Embed Size (px)
Citation preview
1
WWWooorrrkkk---RRReeelllaaattteeeddd AAAsssttthhhmmmaaa iiinnn
WWWiiissscccooonnnsssiiinnn
Occupational Health Surveillance Program Bureau of Environmental and Occupational Health
2
Henry Anderson, MD Chief Medical Officer
Pamela Rogers, MPH Epidemiologist
Wisconsin Department of Health Services Division of Public Health
Bureau of Environmental & Occupational Health Occupational Health Surveillance Program
P.O. Box 2659 Room 150 Madison, WI 53701-2659
Phone: 608-264-9829
List of Abbreviations and Acronyms BLS Bureau of Labor Statistics CDC Centers for Disease Control and Prevention CSTE Council of State and Territorial Epidemiologists DHS Department of Health Services ED Em ergency Department FACE Fatality Assessment and Control Evaluation HD Hospital Discharge ICD-9 Intern ational Classification of Diseases, 9th Revision NAICS North American Industry Classification NIOSH National Institute for Occupational Safety & Health OA Occupational Asthma OHS Occupational Health Surveillance OSHA Occupational Safety and Health Administration SIC Standard Industrial Classification SOC Standard Occupational Classification WAA Wor k-aggravated Asthma WC Wor kers’ Compensation WRA W ork-related Asthma

1
Table of Contents
Summary ......................................................................................................................................... 2 Introduction..................................................................................................................................... 3 Data Sources ................................................................................................................................... 6 Results........................................................................................................................................... 11 Discussion..................................................................................................................................... 12 Case Reports ................................................................................................................................. 21 Bibliography ................................................................................................................................. 25
P-00068 04/2009
Summary Each year the W isconsin Occupational Health Surveillance (OHS) Program releases a report to increase awareness of hazards in Wisconsin workplaces. Last year’s report focused on the indicators of occupational he alth collected through surveillance activities. This year the focus is on one specific occupational health illness - work-related asthma (WRA). Data for this report were obtained from four sources: workers’ com pensation claims; hospital discharge records; emergency department visit records; and death records. Data ranged from 1999 through 200 6, depending on the data source. Additional data used include surveys and research conducted in Wisconsin and other states during various timeframes. A consensus statem ent from the Am erican Thoracic Society conclud ed: “ The median value of 15% is a reasonable estimate of the occupational contribution to the population burden of asthma.” However, confirm ing this finding through state-based surveillance data has been difficult. Recently the Wisconsin OHS Program has used available d ata sources to investigate the prevalence and charac teristics of WRA in the state. A Wisconsin BRFSS survey conducted in 2006 found 11% of W isconsin residents with as thma reported that they had been told by a doctor or health professional that their asthma was related to either a current job or to one they held in the past. Using those findings, as m any as 71,000 Wisconsin residents may have work-related asthma. There are different types of WRA. Workplace exposures may cause onset of new asthma from exposure to an allergen or an irritant that precipitates infl ammatory changes, or they m ay exacerbate pre-existing asthma. Almost eighty percent of the workers’ compensation claims for asthma involve the new-onset asthma. Over 300 ag ents or work processes have been associated with WRA. Nationwide, indoor air pollutants, dusts, cleani ng materials, lubricants and diisocynates are am ong the m ost frequently reported causes of WRA (Jajosky, 1999, CDC/NIOSH, 2008). In Wisconsin, dust, smoke, fumes, chemicals, and vapors are often cited as making breathing difficult at work. W hile exposures to allergens contributing to asthma exacerbations are occurring in a wide range of workplaces, air monitoring at these same facilities typically reveal that ex posure to the suspected allergen or irritant is within exis ting workplace standards approximately 95% of the tim e, however, s ignificant numbers of sym ptomatic individuals can be identified (Rosenman, 2006). According to the Wisconsin data examined, WRA affects both men and women. While it most frequently affects those from the ages of 35-45 years, WRA has b een reported in workers as young as 12 years of age and as old as 66 year s of age. Most workers who report having WRA are Caucasian; however, when looking at the rate of this illness (t he proportion of those affected to the num ber of workers), African-American workers are affect ed over twice as often as Caucasian workers. In order to create awareness and prevent workplace exposures that can cause or exacerbate asthma, Wisconsin has implemented a series of mini-grants for work-related asthm a research and interventions. Five projects will be com pleted by the end of June 2009. These include raising physician awarenes s of WRA; developi ng standard diagnosis criteria; raising employer and em ployee awareness of W RA; advocating for sm oke-free workplaces, and researching bio-aerosol allergens in the dairy industry.
Conclusions The work-related asthma (WRA) burden contributes approximately 11% to the
overall asthma burden in Wisconsin There are two types of WRA – new-onset asthma and work-aggravated asthma African-American workers have a higher rate of WRA than Caucasians Indoor air quality is frequently cited as a cause of WRA in Wisconsin
3
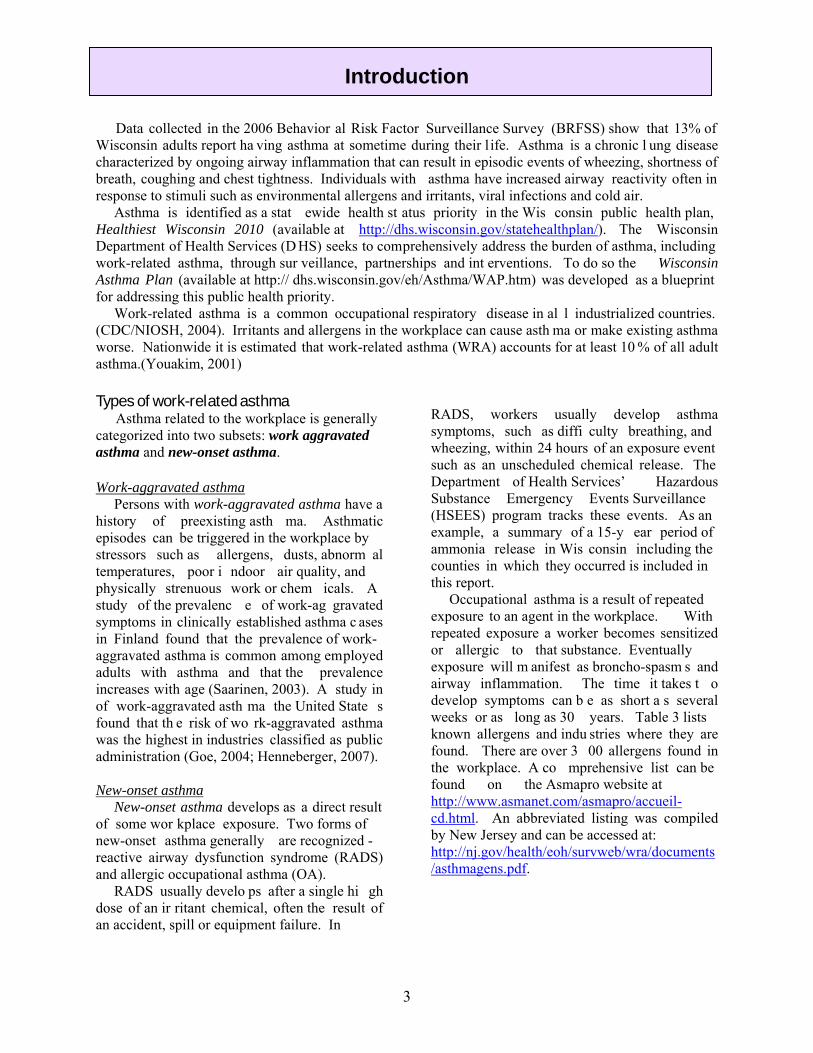
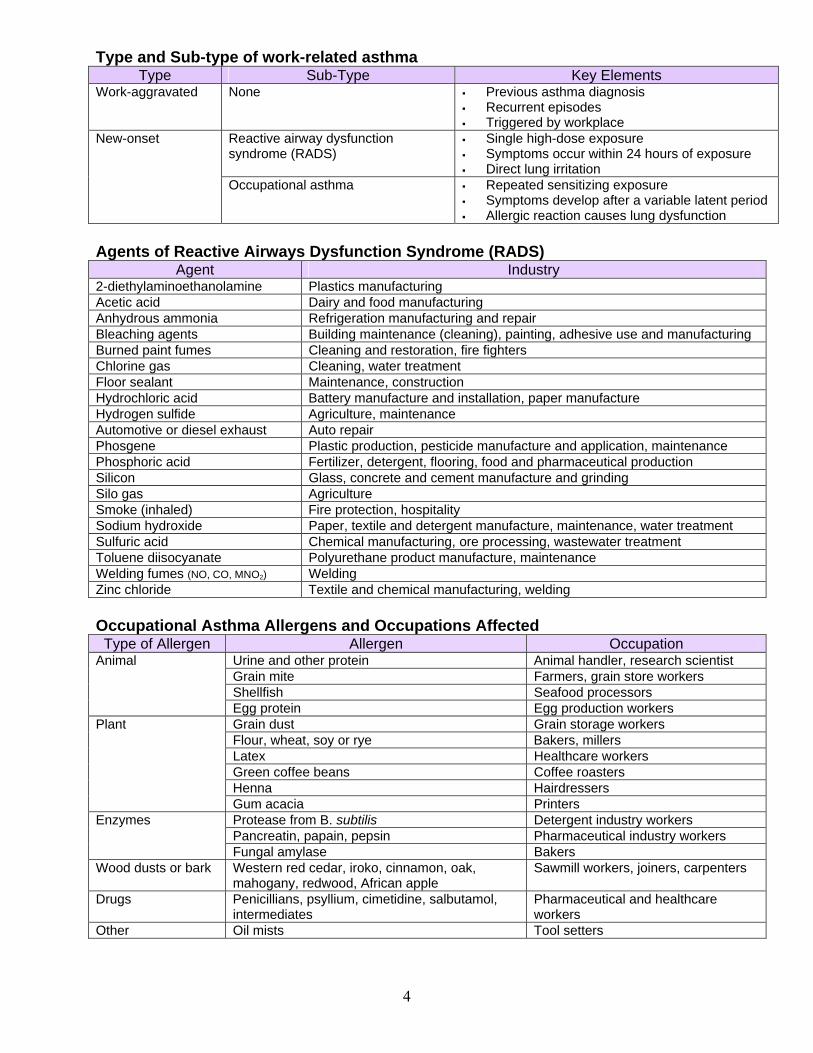
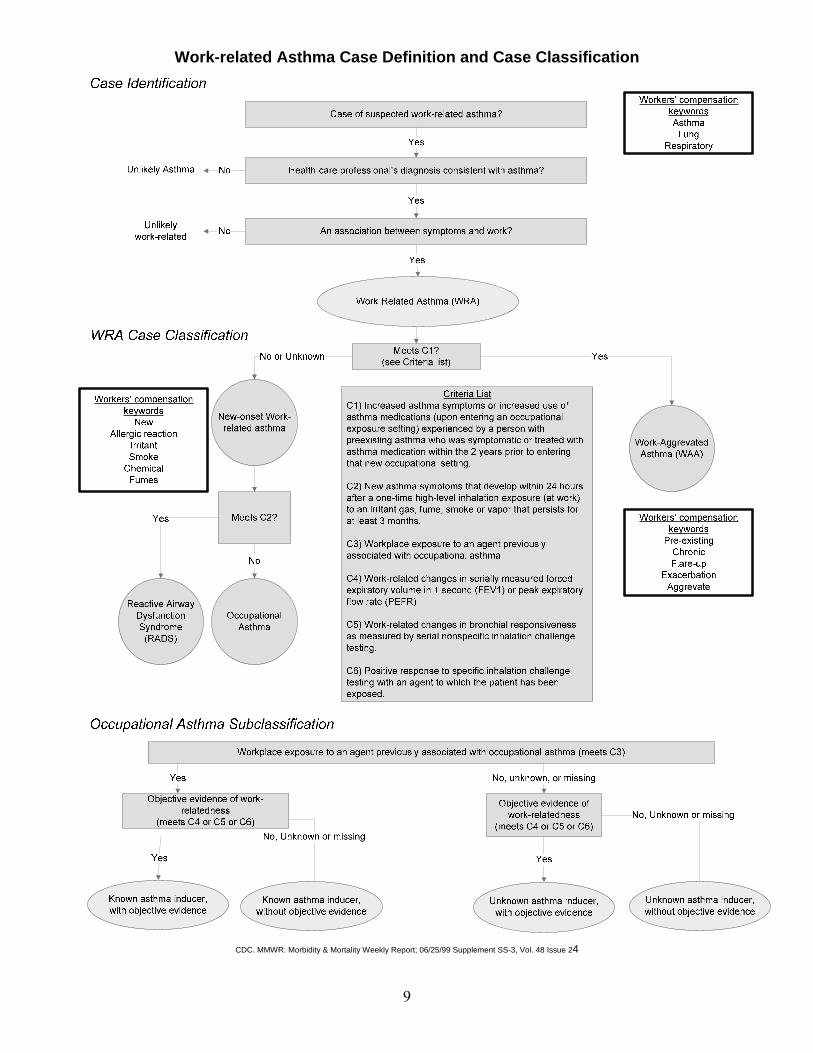
Introduction Data collected in the 2006 Behavior al Risk Factor Surveillance Survey (BRFSS) show that 13% of Wisconsin adults report ha ving asthma at sometime during their l ife. Asthma is a chronic l ung disease characterized by ongoing airway inflammation that can result in episodic events of wheezing, shortness of breath, coughing and chest tightness. Individuals with asthma have increased airway reactivity often in response to stimuli such as environmental allergens and irritants, viral infections and cold air. Asthma is identified as a stat ewide health st atus priority in the Wis consin public health plan, Healthiest Wisconsin 2010 (available at http://dhs.wisconsin.gov/statehealthplan/). The Wisconsin Department of Health Services (D HS) seeks to comprehensively address the burden of asthma, including work-related asthma, through sur veillance, partnerships and int erventions. To do so the Wisconsin Asthma Plan (available at http:// dhs.wisconsin.gov/eh/Asthma/WAP.htm) was developed as a blueprint for addressing this public health priority. Work-related asthma is a common occupational respiratory disease in al l industrialized countries. (CDC/NIOSH, 2004). Irritants and allergens in the workplace can cause asth ma or make existing asthma worse. Nationwide it is estimated that work-related asthma (WRA) accounts for at least 10 % of all adult asthma.(Youakim, 2001) Types of work-related asthma Asthma related to the workplace is generally categorized into two subsets: work aggravated asthma and new-onset asthma. Work-aggravated asthma Persons with work-aggravated asthma have a history of preexisting asth ma. Asthmatic episodes can be triggered in the workplace by stressors such as allergens, dusts, abnorm al temperatures, poor i ndoor air quality, and physically strenuous work or chem icals. A study of the prevalenc e of work-ag gravated symptoms in clinically established asthma c ases in Finland found that the prevalence of work-aggravated asthma is common among employed adults with asthma and that the prevalence increases with age (Saarinen, 2003). A study in of work-aggravated asth ma the United State s found that th e risk of wo rk-aggravated asthma was the highest in industries classified as public administration (Goe, 2004; Henneberger, 2007). New-onset asthma New-onset asthma develops as a direct result of some wor kplace exposure. Two forms of new-onset asthma generally are recognized - reactive airway dysfunction syndrome (RADS) and allergic occupational asthma (OA). RADS usually develo ps after a single hi gh dose of an ir ritant chemical, often the result of an accident, spill or equipment failure. In
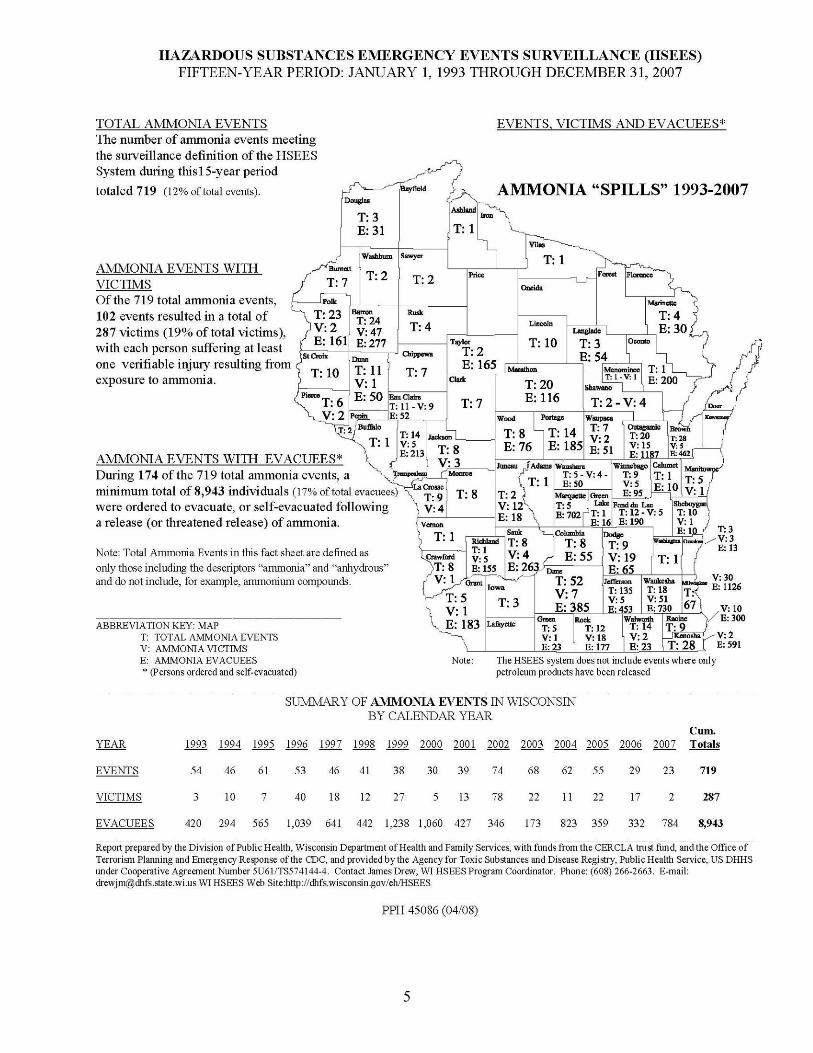
RADS, workers usually develop asthma symptoms, such as diffi culty breathing, and wheezing, within 24 hours of an exposure event such as an unscheduled chemical release. The Department of Health Services’ Hazardous Substance Emergency Events Surveillance (HSEES) program tracks these events. As an example, a summary of a 15-y ear period of ammonia release in Wis consin including the counties in which they occurred is included in this report. Occupational asthma is a result of repeated exposure to an agent in the workplace. With repeated exposure a worker becomes sensitized or allergic to that substance. Eventually exposure will m anifest as broncho-spasm s and airway inflammation. The time it takes t o develop symptoms can b e as short a s several weeks or as long as 30 years. Table 3 lists known allergens and indu stries where they are found. There are over 3 00 allergens found in the workplace. A co mprehensive list can be found on the Asmapro website at http://www.asmanet.com/asmapro/accueil-cd.html. An abbreviated listing was compiled by New Jersey and can be accessed at: http://nj.gov/health/eoh/survweb/wra/documents/asthmagens.pdf.
4
Type and Sub-type of work-related asthma Type Sub-Type Key Elements
Work-aggravated None Previous asthma diagnosis Recurrent episodes Triggered by workplace
Reactive airway dysfunction syndrome (RADS)
Single high-dose exposure Symptoms occur within 24 hours of exposure Direct lung irritation
New-onset
Occupational asthma Repeated sensitizing exposure Symptoms develop after a variable latent period Allergic reaction causes lung dysfunction
Agents of Reactive Airways Dysfunction Syndrome (RADS)
Agent Industry 2-diethylaminoethanolamine Plastics manufacturing Acetic acid Dairy and food manufacturing Anhydrous ammonia Refrigeration manufacturing and repair Bleaching agents Building maintenance (cleaning), painting, adhesive use and manufacturing Burned paint fumes Cleaning and restoration, fire fighters Chlorine gas Cleaning, water treatment Floor sealant Maintenance, construction Hydrochloric acid Battery manufacture and installation, paper manufacture Hydrogen sulfide Agriculture, maintenance Automotive or diesel exhaust Auto repair Phosgene Plastic production, pesticide manufacture and application, maintenance Phosphoric acid Fertilizer, detergent, flooring, food and pharmaceutical production Silicon Glass, concrete and cement manufacture and grinding Silo gas Agriculture Smoke (inhaled) Fire protection, hospitality Sodium hydroxide Paper, textile and detergent manufacture, maintenance, water treatment Sulfuric acid Chemical manufacturing, ore processing, wastewater treatment Toluene diisocyanate Polyurethane product manufacture, maintenance Welding fumes (NO, CO, MNO2) Welding Zinc chloride Textile and chemical manufacturing, welding Occupational Asthma Allergens and Occupations Affected Type of Allergen Allergen Occupation
Urine and other protein Animal handler, research scientist Grain mite Farmers, grain store workers Shellfish Seafood processors
Animal
Egg protein Egg production workers Grain dust Grain storage workers Flour, wheat, soy or rye Bakers, millers Latex Healthcare workers Green coffee beans Coffee roasters Henna Hairdressers
Plant
Gum acacia Printers Protease from B. subtilis Detergent industry workers Pancreatin, papain, pepsin Pharmaceutical industry workers
Enzymes
Fungal amylase Bakers Wood dusts or bark Western red cedar, iroko, cinnamon, oak,
mahogany, redwood, African apple Sawmill workers, joiners, carpenters
Drugs Penicillians, psyllium, cimetidine, salbutamol, intermediates
Pharmaceutical and healthcare workers
Other Oil mists Tool setters
5
6
Data Sources Data and information used in this report came from six data sources – the Behavioral Risk Factor Surveillance Survey (BRFSS), inpatien t hospital discharge billing data, e mergency department visit billing data, death records, workers’ compensation claims data, and national information published in research reports. Use of su ch administrative datasets has both strengths and limitations. The main str ength is their availability. No new data collection is required, and access can be easily obtained. However, adm inistrative data has limitations. In most cases, the primary purpose of assem bling such data is not public health su rveillance; as such, field s collected for purposes other th an billing m ay be incom plete or not thoroughly checked for accuracy. These data seldom tell the whole story and further analysis is necessary to understand the nature of the problem . Becau se of these data lim itations one m ust be cau tious in their comparison and interpretation. The material that follows includes a more detailed description of the data sources and their use in this report. Workers’ Compensation Data The Workers’ Compensation (WC) program is an insurance program designed t o cover medical expenses and lost incom e of workers who become injured or ill during the course of doing work activities. Claimant disease and injury information is captured in an incident narrative. T he Wisconsin Occupational Health Surveillance (OHS) program receives a select subset of t hese data in order t o conduct surveillance for asthma in the workplace. Data examined only claim s that have been paid for days away from work. The m ost meaningful measures for these data ar e rates of occurrences per number of workers (incidence rate) or per number of h ours worked (frequency rate) and the costs associated with injury occurrence. Strengths of these data include the large number of records in the database, as well as the collection of industry and occupation through standard codes. Weaknesses include incomplete data. While the collection of industry and occupation is a strength of these data, only 44% of the WC data used in our analysis had complete information. Other weaknesses include underreporting of accidents and illness because of claim suppression and contestation, t he omission of events not resulting in missed time at work, and the lack of racial or ethnicity information.
Hospitalization Discharge Data Wisconsin keeps records of all patients admitted to medical facilities in t he state including, acute care and non-federal hospitals, and other institutions such as general medical/surgical, psychiatric, alcohol and ot her drug abuse (AODA), and rehabilitation facilities. Hospital inpatient discharge records are reported quarterly to the Wisconsin Hospital Association as required by Wisconsin statute and administrative code. This administrative dataset was developed primarily for billing purposes, but these data have been u sed by researchers, analysts and planners for a broad range of other purposes as well. Specifications for the data elements reported are based on the Uniform Billing Form (UB-92) and include patient demographic data, admission and discharge data, charge and pa yer data, and I CD-9 CM-coded diag nostic and procedure information. Hospital discharge records are extensively checked and edited for qua lity and completeness, and hospitals are req uired to verify or correct all invalid codes and missing or inconsistent items. Th ese data, however, have not been audited by com parisons to actual source hospital billing and medical records. To use hospital discharge data effectiv ely, it is necessary to have denominator data for the areas and populations that will be examined. Hospital utilization is generally expressed as a rate (e.g. admissions or discharges per 100, 000 area population).
7
Strengths of use of these data inclu de easy accessibility, timeliness, and completeness, allowing for use of these data repeatedly over time to identify trends. The weaknesses of thi s dataset inc lude the inability of comparison to the larger population due to bias of ph ysician interpretation of diagnosis and other vari ations from hospital to hospital in the quality of medical records coding. Using hospital discharge data as a tool for occupational health surveillance may not capture all relevant case s. This is true for severa l reasons. First, only the most severe cases are admitted to the hospit al for tretment and hospitalizations of Wisconsin residents occurring in other states are not captured in the Wisconsin Hospital As sociation’s database. Additionally, data from the stat e’s three federal VA hospitals in Wisconsin are also excluded. In many cases, patient bills for work-related illness and injury may be paid by private insurance rather than by workers’ compensation. Emergency Department Visits This source of data contains individual-level data for visits to the emergency department of Wisconsin hospitals (general medical-surgical, psychiatric, alcohol and other drug abuse, rehabilitation, and state hospitals). Data elements received include hospital identifiers, diagnosis and procedure codes, expected total charges, the expected payer of those charges, the source and type of ad mission, and the patient discharge destination. Physician license numbers are not included; howe ver the Phy sician-Enhanced Emergency Department Dataset links discharge data with physician information. Use of these electronic datasets is a relatively recent development. Collection and distribution began in 2002. Because of its recent development, some potential problems with data quality persist. For purposes of this re port, the ED visit re cords were used as a measure of prevalence and severit y. Although emergency department visit data were used as a surrogate
for the severity of exposure or injury , it is difficult to determine the magnitude of t he exposure; if multiple workers are exposed in the same workplace and obtain treatment in different facilities and their treatment may not be recognized as a consequence of the same event. For purposes of WRA surveill ance the selection criteria used with ED visit da ta are the same as hospital discharge selection criteria with workers’ compensation listed as the p ayer. As with all other datasets, analysis of administrative data cannot provide a causal explanation for a high rate. ED data, however, can be o f use in the analysis of pattern s among population subgroups and geographic areas. Strengths and weaknes ses of this da taset are the same as the hospital discharge data. Behavioral Risk Factor Surveillance System The Behavioral Risk Factor Surveillance System (BRFSS) is a random-digit-dialed telephone survey of t he US civilian, non-institutionalized population aged 18 years and older with te lephones. S urvey respondents are randomly selected to ensu re that the su rvey data will be representative of all adults in Wi sconsin. Survey data are adjusted or “weighted” by age and sex distribution f or Wisconsin’s population so that the resulting estimates can be generalized to the state’s entire popul ation, not ju st those who responded to the sur vey. The BR FSS asks respondents about thei r health and health behaviors. For work-relat ed asthma, a separate, additional survey, the asthma follow-up survey , is offered for ad ministration to an y respondent who claims to have had asthma. Data for the 2006 follow-up survey were examined and used to provide an estimate of the prevalence of work-related asthma in Wisconsin. The major strengths of t he BRFSS include its ease in collecting a large am ount of state-specific data. Since th e survey has been conducted for more than two decades, there is a wealth of experience in data collection as well as showing trends over time. Weaknesses include that the exclu sion of subjects without hom e telephones, the self-reported nature of the data, and the inabilit y to link follow-up survey data to original survey results.
Criteria for Using Hospital Discharge Records Payer = Workers’ Compensation Principal diagnosis (ICD-9) code = 493.0-
493.9 Zipcode = zipcode of Wisconsin residence
8
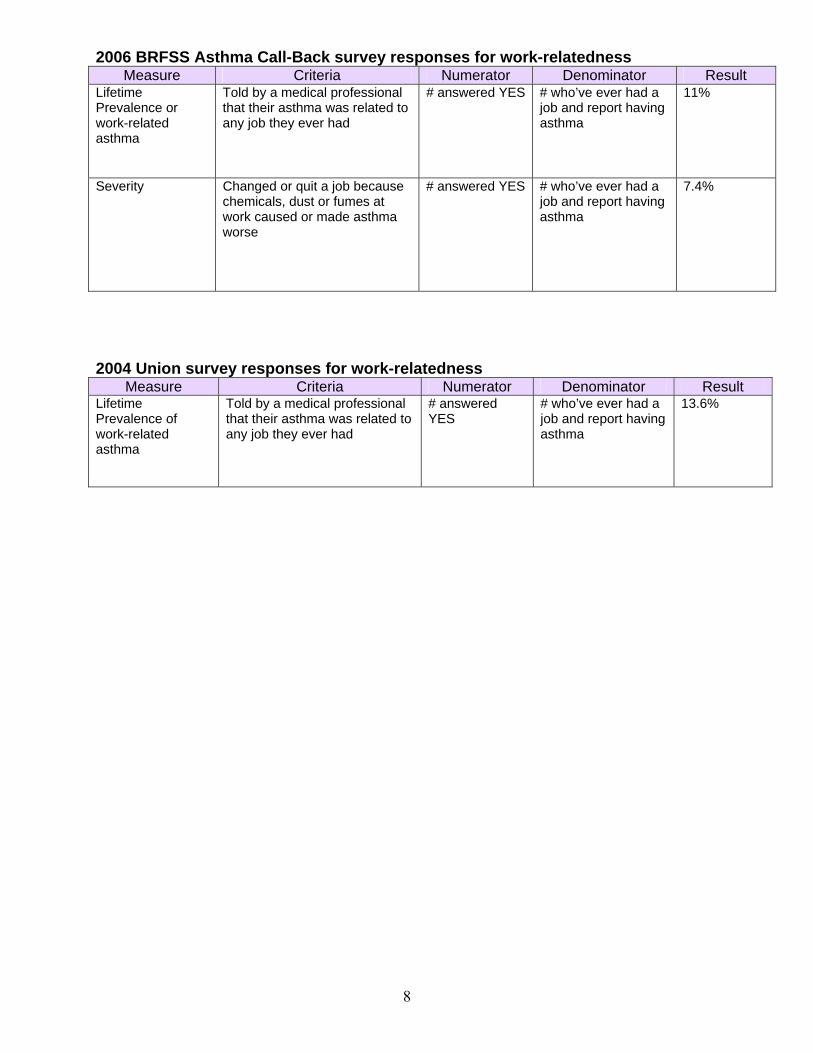
2006 BRFSS Asthma Call-Back survey responses for work-relatedness Measure Criteria Numerator Denominator Result
Lifetime Prevalence or work-related asthma
Told by a medical professional that their asthma was related to any job they ever had
# answered YES # who’ve ever had a job and report having asthma
11%
Severity Changed or quit a job because chemicals, dust or fumes at work caused or made asthma worse
# answered YES # who’ve ever had a job and report having asthma
7.4%
2004 Union survey responses for work-relatedness
Measure Criteria Numerator Denominator Result Lifetime Prevalence of work-related asthma
Told by a medical professional that their asthma was related to any job they ever had
# answered YES
# who’ve ever had a job and report having asthma
13.6%
9
Work-related Asthma Case Definition and Case Classification
CDC. MMWR: Morbidity & Mortality Weekly Report; 06/25/99 Supplement SS-3, Vol. 48 Issue 24
10
Vital Records/Death Records Among the first administrative databases used to un derstand the nature and extent of health and safety issues were vital statistics records. Vital records are records of life events such as births, deaths, marriages and divorces. Deaths in Wisconsin are reported b y the county vital records offices and by two city health offices to DHS. Death records are completed by physicians, coroners, funeral directors or county or city health officer s. These record s are by DHS’ Bureau of Health Information and Policy (BHIP). While death records m ay include the occupation and industry of the decea sed, this information is not keyed as part of the electronic record. As such, drawing conclusions from death records about the entire population can be problematic. Strengths of this dataset i nclude the richness of data. Information on race/ethnicity , education is included. Zip-code-level analy sis often can provide findings of i nterest to plan ners and policymakers. One weakness of these data is the relatively small number of records. In so me cases, data may be aggregated to protect confidentiality . This makes it difficult to associate the findings to the general population. Other Data Sources Surveys A survey is another ty pe of non experim ental descriptive study where inferences about behavior are made fro m data collected via interviews or questionnair es. If large enough, surveys are likely the best way to obtain the most accurate information about the prevalence of work-related asth ma in Wisconsin. Surve ys are particularly useful for asse ssing events that are difficult t o directly observe and when it is desirable to sample a large number of subjects. The major limitation of surve y data is in the methodology used to collect the data. Surveys rely on self-reporting, and intentional deception, poor memory or misunderstanding of the questions asked can all contribute to inaccuracies and bias in the data. Further more, the descriptive nature of surve y data may make assessments of causality difficult.
Between 2003 and 2004, the occupational health surveillance program conducted a survey of
unionized workers to gather inform ation about asthma diagnosis and allergen exposures in Wisconsin workplaces. A total of 1,837 surveys were completed and analyzed (Islam, 2004).
Environmental Information It is known that other environm ental factors can exacerbate and contribute to the severity of asthma while at work. T hese include smoking, exposure to environm ental tobacco sm oke, particulate matter, and ozone. Particulate matter and ozone can be significant environmental asthma triggers. Data on these pollutants can be obtained from the Wisconsin Department of Natural Resources real-time mapping website for particulate matter and ozone, which is at http://dnrmaps.wisconsin.gov/imf/imf.jsp?site=wisards Census Information To determine the denominator for crude rates, the 2000 census Wisconsin population for those over 18 was used. Age-adjusted rates were also determ ined using the 2000 census data for each age category. Information specific to c ounties was obtained from the Wisconsin count y profiles available at http://dwd.wisconsin.gov/oea/county_profiles/archived.htm. Scientific Literature The experience of other s’ research, especially of states similar to Wisconsin can be a good starting point to esti mate or investigate WRA, by applying findings to Wisconsin. CDC/NIOSH. Worker Health Chartbook, 2004. Goe, SK, Henneberger PK, Reilly MJ, Rosenman KD, et al. A descriptive study of work aggravated asthma. 2004. Occup Environ Med Jun; 61(6):512-7 Saarinen, K., Karjalainen, A., Martikainen, R. et.al. Prevalence of work aggravated symptoms in clinically established asthma. 2003 Eur Respir J 22:305-309 Youakim, Sami, 2001. Work-Related Asthma. Am Fam Physician Vol 64, No 11, December 12, 2001, 1839-1848. Wisconsin Department of Health and Family Services. 2007. Burden of Asthma in Wisconsin
11
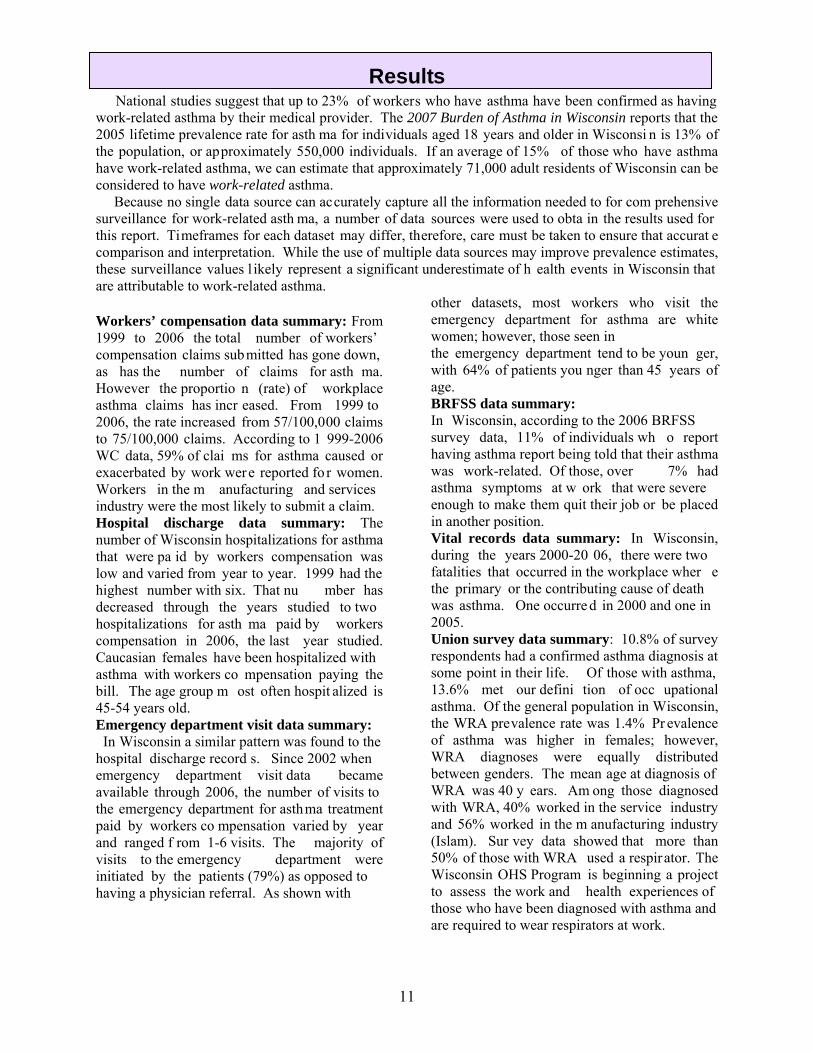
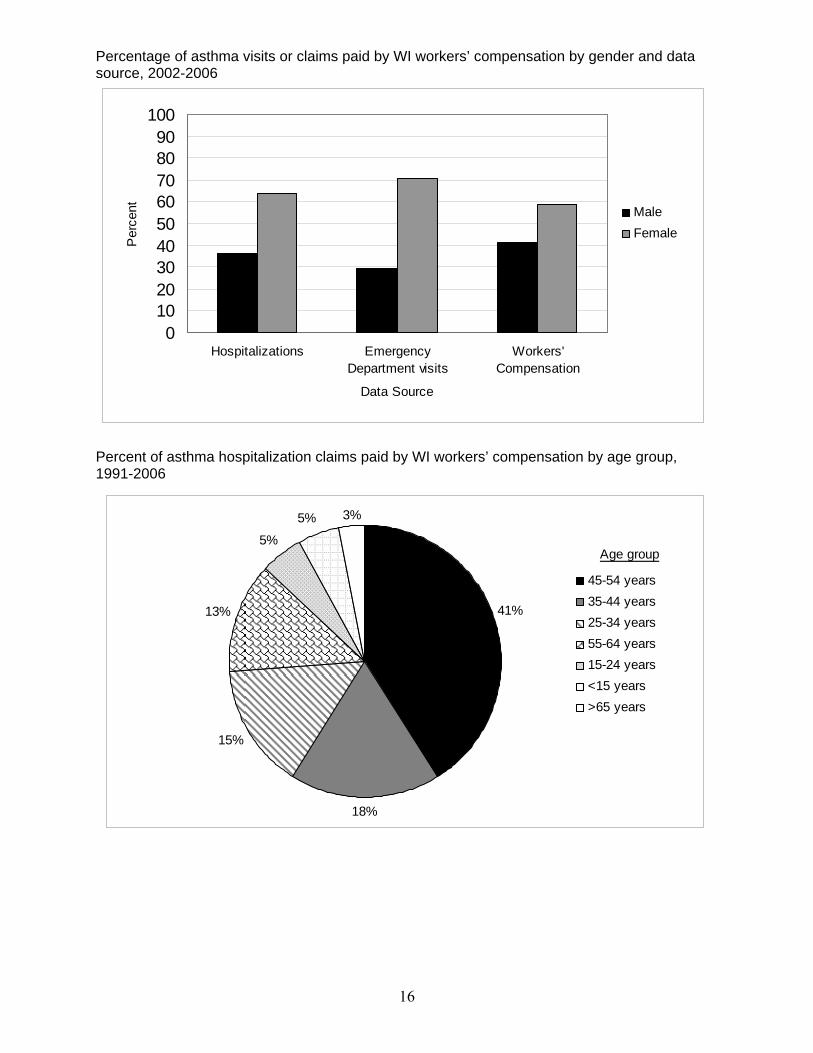
Results National studies suggest that up to 23% of workers who have asthma have been confirmed as having work-related asthma by their medical provider. The 2007 Burden of Asthma in Wisconsin reports that the 2005 lifetime prevalence rate for asth ma for individuals aged 18 years and older in Wisconsi n is 13% of the population, or approximately 550,000 individuals. If an average of 15% of those who have asthma have work-related asthma, we can estimate that approximately 71,000 adult residents of Wisconsin can be considered to have work-related asthma. Because no single data source can accurately capture all the information needed to for com prehensive surveillance for work-related asth ma, a number of data sources were used to obta in the results used for this report. Timeframes for each dataset may differ, therefore, care must be taken to ensure that accurat e comparison and interpretation. While the use of multiple data sources may improve prevalence estimates, these surveillance values l ikely represent a significant underestimate of h ealth events in Wisconsin that are attributable to work-related asthma. Workers’ compensation data summary: From 1999 to 2006 the total number of workers’ compensation claims submitted has gone down, as has the number of claims for asth ma. However the proportio n (rate) of workplace asthma claims has incr eased. From 1999 to 2006, the rate increased from 57/100,000 claims to 75/100,000 claims. According to 1 999-2006 WC data, 59% of clai ms for asthma caused or exacerbated by work were reported fo r women. Workers in the m anufacturing and services industry were the most likely to submit a claim. Hospital discharge data summary: The number of Wisconsin hospitalizations for asthma that were pa id by workers compensation was low and varied from year to year. 1999 had the highest number with six. That nu mber has decreased through the years studied to two hospitalizations for asth ma paid by workers compensation in 2006, the last year studied. Caucasian females have been hospitalized with asthma with workers co mpensation paying the bill. The age group m ost often hospit alized is 45-54 years old. Emergency department visit data summary: In Wisconsin a similar pattern was found to the hospital discharge record s. Since 2002 when emergency department visit data became available through 2006, the number of visits to the emergency department for asthma treatment paid by workers co mpensation varied by year and ranged f rom 1-6 visits. The majority of visits to the emergency department were initiated by the patients (79%) as opposed to having a physician referral. As shown with
other datasets, most workers who visit the emergency department for asthma are white women; however, those seen in the emergency department tend to be youn ger, with 64% of patients you nger than 45 years of age. BRFSS data summary: In Wisconsin, according to the 2006 BRFSS survey data, 11% of individuals wh o report having asthma report being told that their asthma was work-related. Of those, over 7% had asthma symptoms at w ork that were severe enough to make them quit their job or be placed in another position. Vital records data summary: In Wisconsin, during the years 2000-20 06, there were two fatalities that occurred in the workplace wher e the primary or the contributing cause of death was asthma. One occurre d in 2000 and one in 2005. Union survey data summary: 10.8% of survey respondents had a confirmed asthma diagnosis at some point in their life. Of those with asthma, 13.6% met our defini tion of occ upational asthma. Of the general population in Wisconsin, the WRA prevalence rate was 1.4% Pr evalence of asthma was higher in females; however, WRA diagnoses were equally distributed between genders. The mean age at diagnosis of WRA was 40 y ears. Am ong those diagnosed with WRA, 40% worked in the service industry and 56% worked in the m anufacturing industry (Islam). Sur vey data showed that more than 50% of those with WRA used a respirator. The Wisconsin OHS Program is beginning a project to assess the work and health experiences of those who have been diagnosed with asthma and are required to wear respirators at work.
12
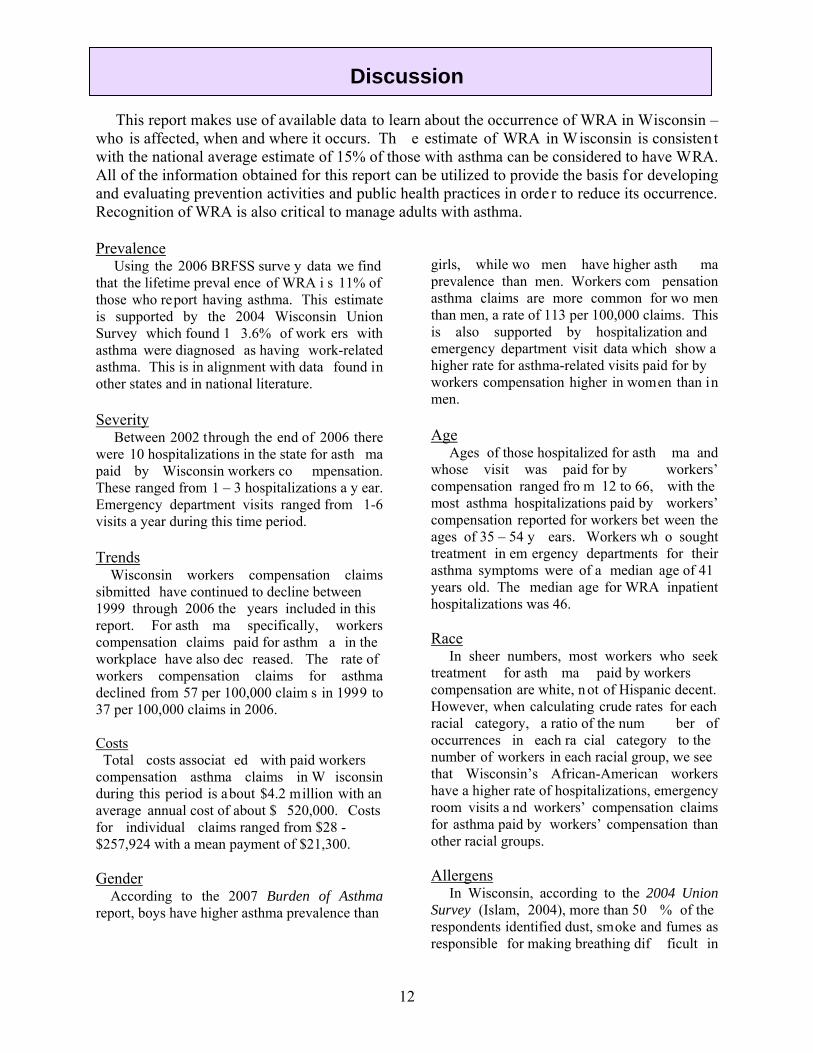
Discussion This report makes use of available data to learn about the occurrence of WRA in Wisconsin – who is affected, when and where it occurs. Th e estimate of WRA in Wisconsin is consisten t with the national average estimate of 15% of those with asthma can be considered to have WRA. All of the information obtained for this report can be utilized to provide the basis for developing and evaluating prevention activities and public health practices in orde r to reduce its occurrence. Recognition of WRA is also critical to manage adults with asthma. Prevalence Using the 2006 BRFSS surve y data we find that the lifetime preval ence of WRA i s 11% of those who report having asthma. This estimate is supported by the 2004 Wisconsin Union Survey which found 1 3.6% of work ers with asthma were diagnosed as having work-related asthma. This is in alignment with data found in other states and in national literature. Severity Between 2002 through the end of 2006 there were 10 hospitalizations in the state for asth ma paid by Wisconsin workers co mpensation. These ranged from 1 – 3 hospitalizations a y ear. Emergency department visits ranged from 1-6 visits a year during this time period. Trends Wisconsin workers compensation claims sibmitted have continued to decline between 1999 through 2006 the years included in this report. For asth ma specifically, workers compensation claims paid for asthm a in the workplace have also dec reased. The rate of workers compensation claims for asthma declined from 57 per 100,000 claim s in 1999 to 37 per 100,000 claims in 2006. Costs Total costs associat ed with paid workers compensation asthma claims in W isconsin during this period is about $4.2 million with an average annual cost of about $ 520,000. Costs for individual claims ranged from $28 - $257,924 with a mean payment of $21,300. Gender According to the 2007 Burden of Asthma report, boys have higher asthma prevalence than
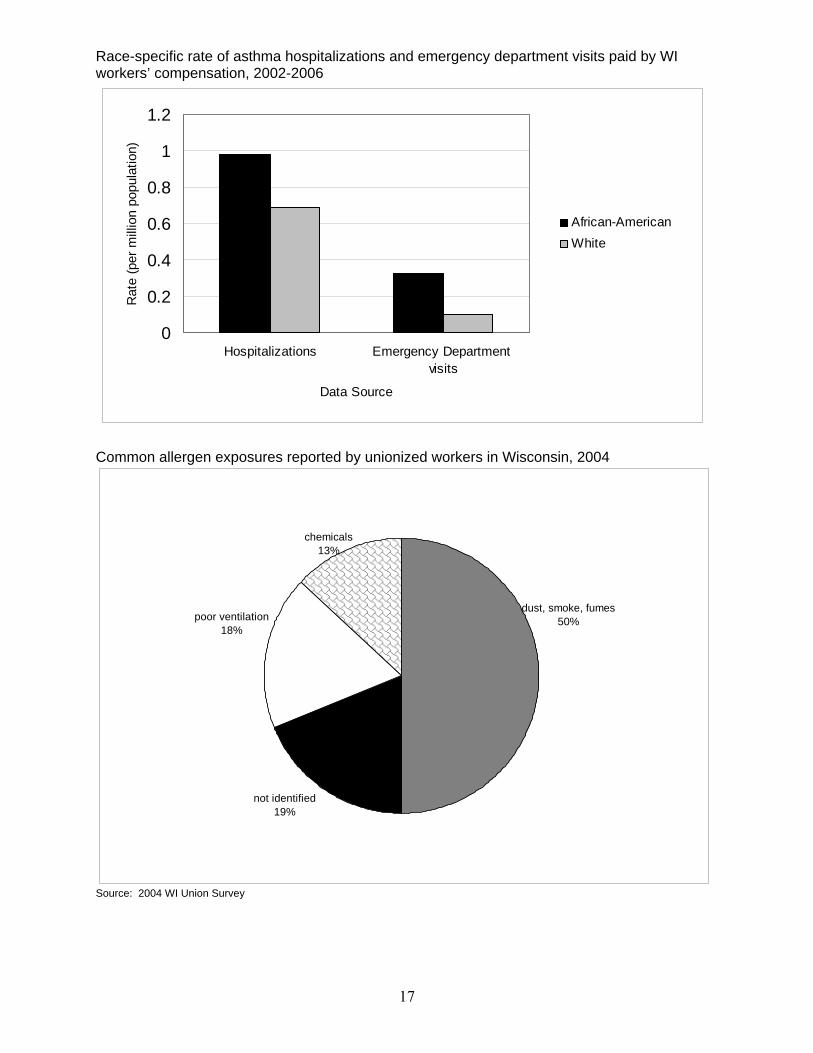
girls, while wo men have higher asth ma prevalence than men. Workers com pensation asthma claims are more common for wo men than men, a rate of 113 per 100,000 claims. This is also supported by hospitalization and emergency department visit data which show a higher rate for asthma-related visits paid for by workers compensation higher in women than in men. Age Ages of those hospitalized for asth ma and whose visit was paid for by workers’ compensation ranged fro m 12 to 66, with the most asthma hospitalizations paid by workers’ compensation reported for workers bet ween the ages of 35 – 54 y ears. Workers wh o sought treatment in em ergency departments for their asthma symptoms were of a median age of 41 years old. The median age for WRA inpatient hospitalizations was 46. Race In sheer numbers, most workers who seek treatment for asth ma paid by workers compensation are white, n ot of Hispanic decent. However, when calculating crude rates for each racial category, a ratio of the num ber of occurrences in each ra cial category to the number of workers in each racial group, we see that Wisconsin’s African-American workers have a higher rate of hospitalizations, emergency room visits a nd workers’ compensation claims for asthma paid by workers’ compensation than other racial groups. Allergens In Wisconsin, according to the 2004 Union Survey (Islam, 2004), more than 50 % of the respondents identified dust, smoke and fumes as responsible for making breathing dif ficult in
13
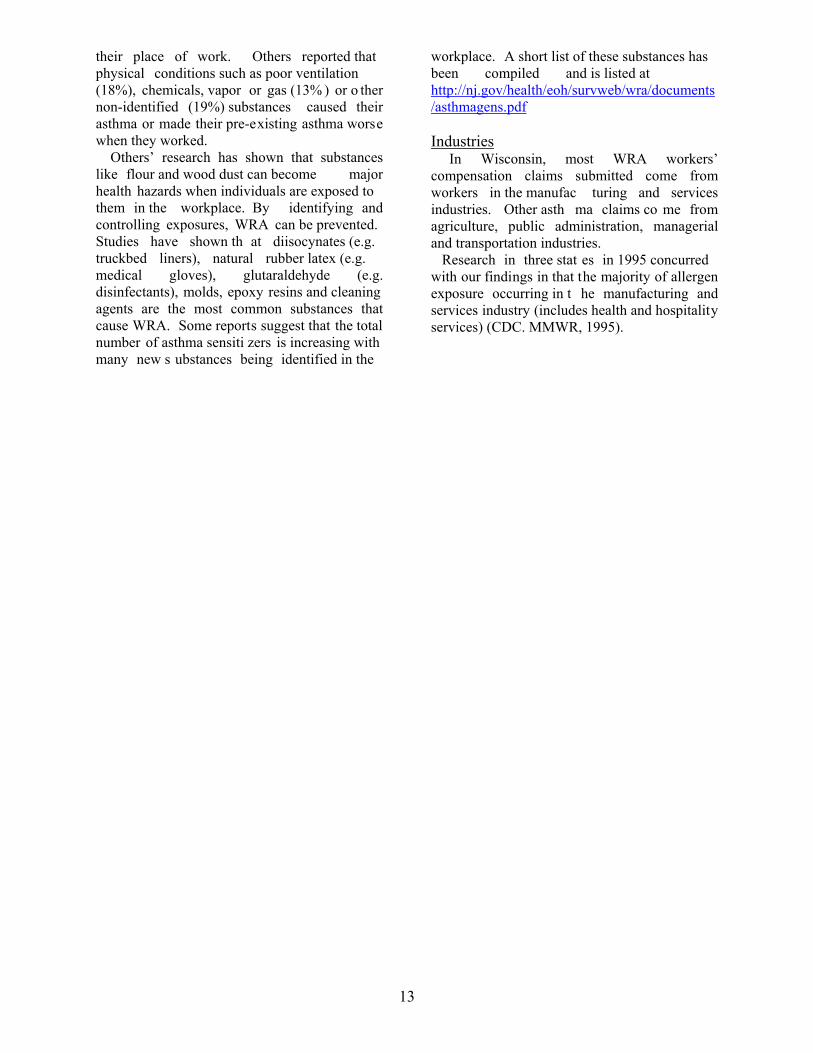
their place of work. Others reported that physical conditions such as poor ventilation (18%), chemicals, vapor or gas (13% ) or o ther non-identified (19%) substances caused their asthma or made their pre-existing asthma worse when they worked. Others’ research has shown that substances like flour and wood dust can become major health hazards when individuals are exposed to them in the workplace. By identifying and controlling exposures, WRA can be prevented. Studies have shown th at diisocynates (e.g. truckbed liners), natural rubber latex (e.g. medical gloves), glutaraldehyde (e.g. disinfectants), molds, epoxy resins and cleaning agents are the most common substances that cause WRA. Some reports suggest that the total number of asthma sensiti zers is increasing with many new s ubstances being identified in the
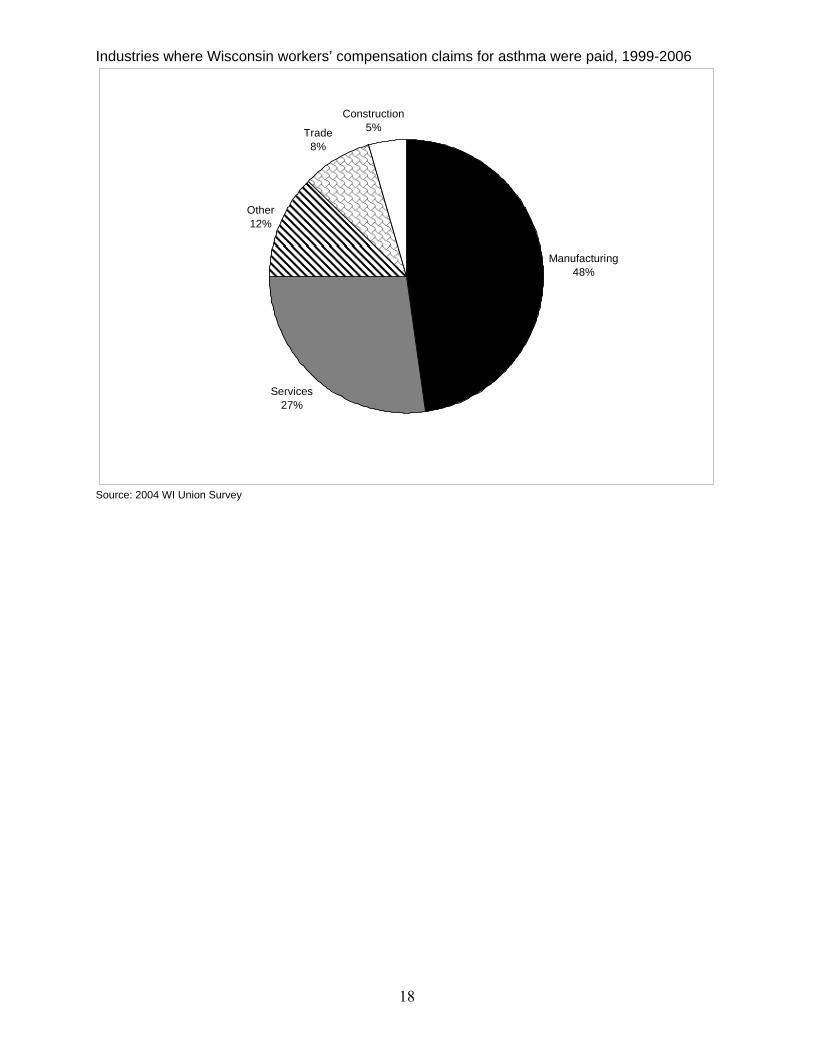
workplace. A short list of these substances has been compiled and is listed at http://nj.gov/health/eoh/survweb/wra/documents/asthmagens.pdf Industries In Wisconsin, most WRA workers’ compensation claims submitted come from workers in the manufac turing and services industries. Other asth ma claims co me from agriculture, public administration, managerial and transportation industries. Research in three stat es in 1995 concurred with our findings in that the majority of allergen exposure occurring in t he manufacturing and services industry (includes health and hospitality services) (CDC. MMWR, 1995).
14
0
1
2
3
4
5
6
Hospitalizations EmergencyDepartment visits
Workers'Compensation
Data source
Rat
e (p
er 1
00,0
00 p
opul
atio
n)
20022003200420052006
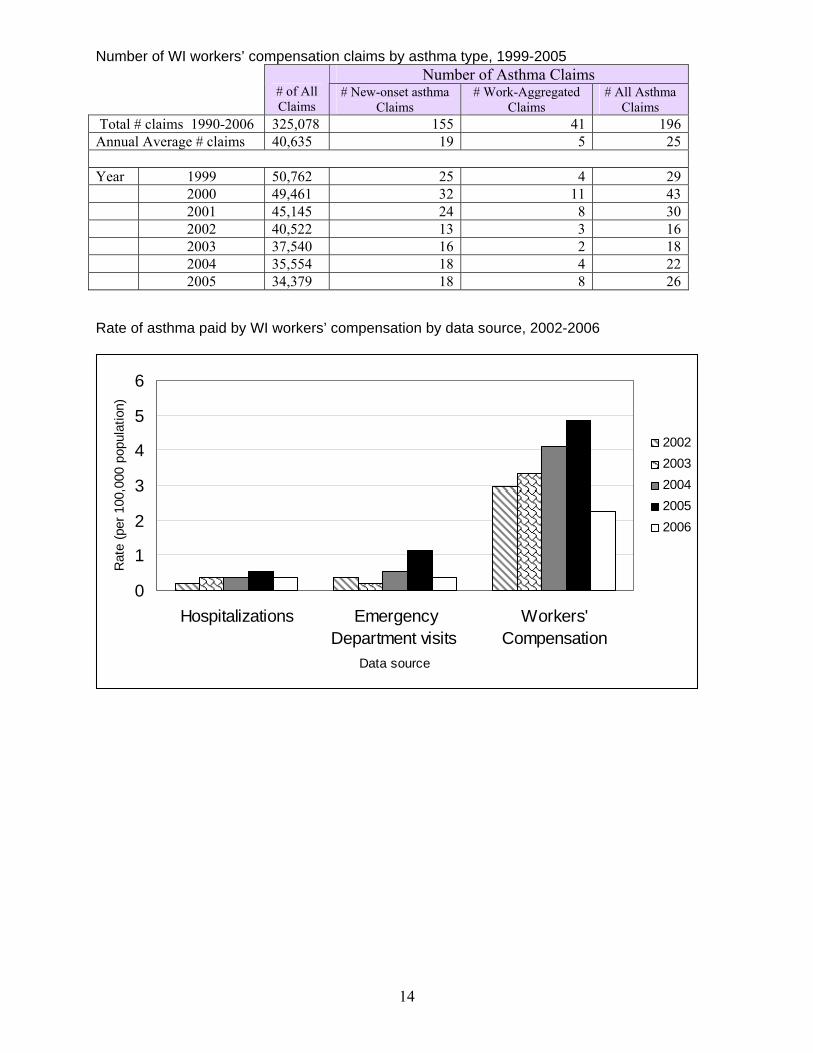
Number of WI workers’ compensation claims by asthma type, 1999-2005 Number of Asthma Claims
# of All Claims
# New-onset asthma Claims
# Work-Aggregated Claims
# All Asthma Claims
Total # claims 1990-2006 325,078 155 41 196Annual Average # claims 40,635 19 5 25 Year 1999 50,762 25 4 29 2000 49,461 32 11 43 2001 45,145 24 8 30 2002 40,522 13 3 16 2003 37,540 16 2 18 2004 35,554 18 4 22 2005 34,379 18 8 26 Rate of asthma paid by WI workers’ compensation by data source, 2002-2006
15
0
10
20
30
40
50
60
70
80
90
100
1999 2000 2001 2002 2003 2004 2005 2006
Year
Rat
e pe
r 100
,000
cla
ims
all asthmanew-onsetwork-aggravatedLinear (all asthma)
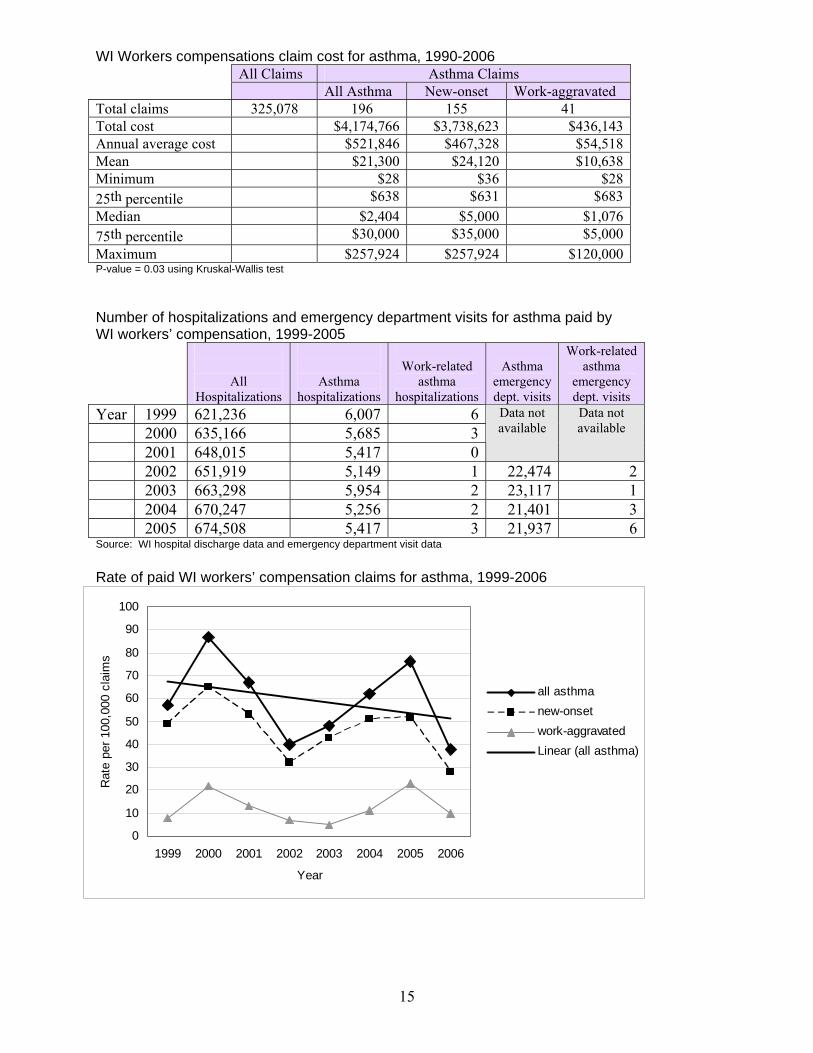
WI Workers compensations claim cost for asthma, 1990-2006 All Claims Asthma Claims All Asthma New-onset Work-aggravated
Total claims 325,078 196 155 41 Total cost $4,174,766 $3,738,623 $436,143 Annual average cost $521,846 $467,328 $54,518 Mean $21,300 $24,120 $10,638 Minimum $28 $36 $28 25th percentile $638 $631 $683 Median $2,404 $5,000 $1,076 75th percentile $30,000 $35,000 $5,000 Maximum $257,924 $257,924 $120,000 P-value = 0.03 using Kruskal-Wallis test Number of hospitalizations and emergency department visits for asthma paid by WI workers’ compensation, 1999-2005
All Hospitalizations
Asthma hospitalizations
Work-related
asthma hospitalizations
Asthma
emergency dept. visits
Work-related asthma
emergency dept. visits
Year 1999 621,236 6,007 6 2000 635,166 5,685 3 2001 648,015 5,417 0
Data not available
Data not available
2002 651,919 5,149 1 22,474 2 2003 663,298 5,954 2 23,117 1 2004 670,247 5,256 2 21,401 3 2005 674,508 5,417 3 21,937 6 Source: WI hospital discharge data and emergency department visit data Rate of paid WI workers’ compensation claims for asthma, 1999-2006
16
18%
15%
13%
5%
5%
41%
3%
45-54 years35-44 years25-34 years55-64 years15-24 years<15 years>65 years
Age group
Percentage of asthma visits or claims paid by WI workers’ compensation by gender and data source, 2002-2006
0102030405060708090
100
Hospitalizations EmergencyDepartment visits
Workers'Compensation
Data Source
Per
cent Male
Female
Percent of asthma hospitalization claims paid by WI workers’ compensation by age group, 1991-2006
17
Race-specific rate of asthma hospitalizations and emergency department visits paid by WI workers’ compensation, 2002-2006
0
0.2
0.4
0.6
0.8
1
1.2
Hospitalizations Emergency Department visits
Data Source
Rat
e (p
er m
illio
n po
pula
tion)
African-AmericanWhite
Common allergen exposures reported by unionized workers in Wisconsin, 2004
chemicals13%
dust, smoke, fumes50%
not identified19%
poor ventilation18%
Source: 2004 WI Union Survey
18
Industries where Wisconsin workers’ compensation claims for asthma were paid, 1999-2006
Manufacturing48%
Services27%
Other12%
Trade8%
Construction5%
Source: 2004 WI Union Survey
19
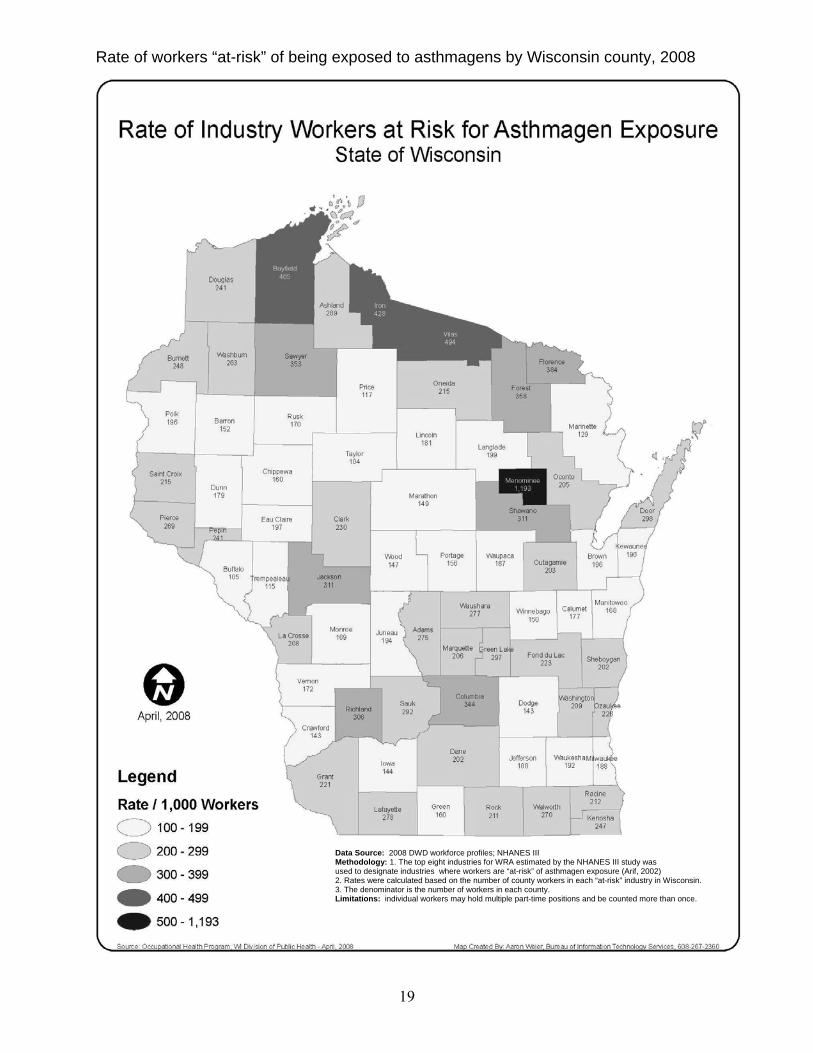
Rate of workers “at-risk” of being exposed to asthmagens by Wisconsin county, 2008
Data Source: 2008 DWD workforce profiles; NHANES III Methodology: 1. The top eight industries for WRA estimated by the NHANES III study was used to designate industries where workers are “at-risk” of asthmagen exposure (Arif, 2002) 2. Rates were calculated based on the number of county workers in each “at-risk” industry in Wisconsin. 3. The denominator is the number of workers in each county. Limitations: individual workers may hold multiple part-time positions and be counted more than once.
20
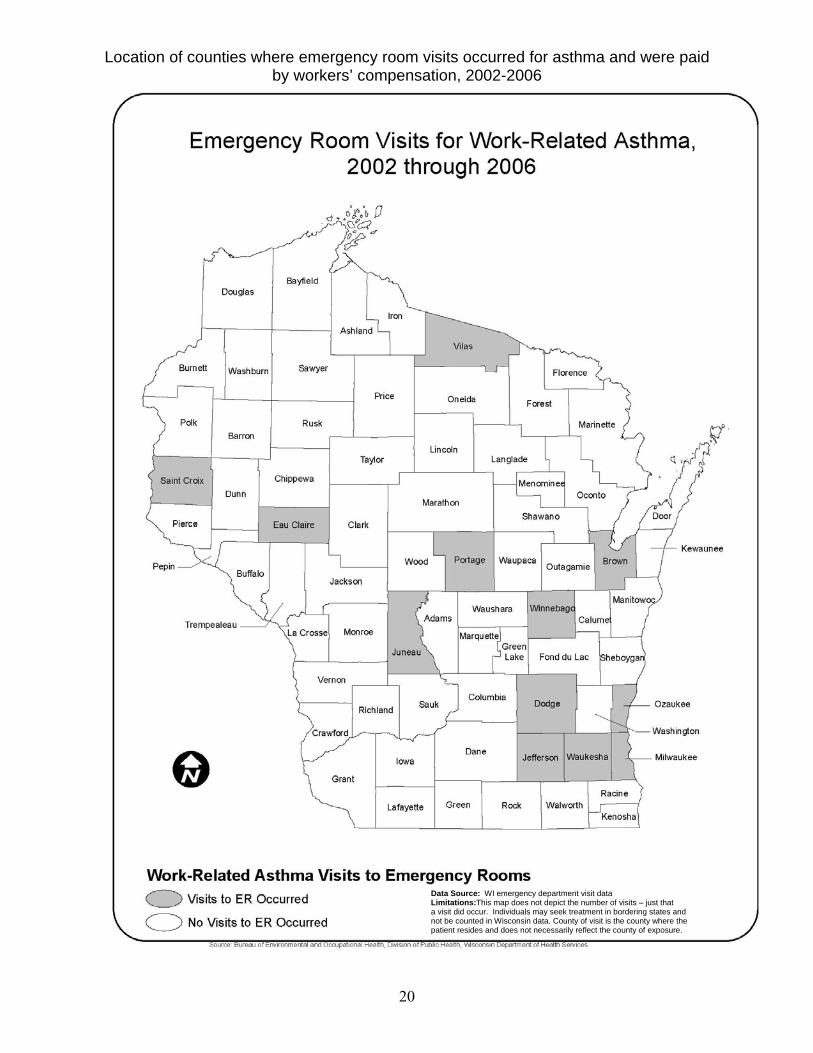
Location of counties where emergency room visits occurred for asthma and were paid by workers’ compensation, 2002-2006
Data Source: WI emergency department visit data Limitations:This map does not depict the number of visits – just that a visit did occur. Individuals may seek treatment in bordering states and not be counted in Wisconsin data. County of visit is the county where the patient resides and does not necessarily reflect the county of exposure.
21
Case Reports A health hazard evaluation (HHE) is a study of a workplace conducted they NIOSH. It is done to learn whether workers are exposed to hazardous materials or harmful conditions. When an HHE is done, NIOSH staff visit the workplace to tour the facilit y, review records, measur e exposure, interview or survey employees and they may do medical testing. These activities happen during one or m ore visits. At the end of this evaluation, NIOSH will provide a written report to the employ er and to the em ployee representatives. An HHE can take from a few months to a few years to complete depending on the type of evaluation. An employee can request an HHE if he or she is currently employed at the workplace of concern and has the signatures of two other em ployees. If the workplace has thre e or fewer employees, the signature of onl y one employ ee is enough. An offi cer of a labo r union t hat represents employees for collective bargaining can request an HHE. Any management official may request an HHE on behalf of the employer. For any one who submits a request, NI OSH will not reveal to the em ployer the names of the persons who made the request if they indicate this on the request form. The following final report summari es are taken directly from NIOSH health hazard evaluation (HHE) reports of investigations in Wisconsin workplaces. Chemicals in Manufacturing Case 1. Report: HETA-2005-0243-3016 On May 17, 2005, the National Institute for Occupational Safety and Health (NIOSH) received a confidential request fr om three employees at ACH Foam Technologies in Fond du Lac, Wisconsin. The requestors expressed concerns about potential long-term effects from exposure to sm oke and chemicals generated while manufacturing pol ystyrene and cutting polyethylene sheeting and expandable polystyrene (EPS) foam . On August 31, 2005, NIOSH investigators sampled for che mical byproducts from the EPS processes at the ACH facility. Personal breathing zone (PBZ) and area air samples were collected for pentane, styrene, volatile organic co mpounds (VOCs), and respirable and total dust. Air samples collected on thermal d esorption tubes identified pentane, styrene, acetophenone, ethylbenzene, and xylene as predominant chemicals. The charc oal tubes used to sample for VOCs were submitted for laboratory analysis for a cetophenone, ethylbenzene, and xylene. Area conce ntrations of carbon monoxide, a potential byproduct from the EPS pr ocesses, were measured in several departments with a direct reading ins trument. All sample results were below applicable occupational exposure lim its. NIOSH investigators conclude that a health hazard did not exist o n the da y of this evaluation. Employees were not exposed over applicable
occupational exposure limits to carbon monoxide, pentane, styrene, aceto phenone, ethylbenzene, xylene, respirable dust, or total dust while m olding and cutting EPS products. Recommendations in this report include providing local exhaust ventilation i n the hot wire cutting area, repairing damaged duct work in the Recy cling department, and im proving communication between supervis ors and employees. A full NIOSH report can be found at: http://www.cdc.gov/niosh/hhe/reports/pdfs/2005-0243-3016.pdf Case 2. Report: HETA-2005-0029-2923 On October 18, 2002, the National Institute for Occupational Safety and Health (NIOSH) received a c onfidential employee request for a health hazard evaluation (HHE) at W ard Brodt Music Mall in Madison, Wisconsin. The request centered on workers’ exposures to acids and solvents during m usical instrument repair operations, the adequacy of the ventilation in the chemical room, and reported sy mptoms of sore throat, sinus headaches, congestion, asth ma, persistent cough, allergies, sneezing, and watery eyes. On January 14, 2003, NIOSH investigators conducted an exposure assessment and interviewed repair shop workers. Between the time of the HHE request and the site vi sit, local exhaust ventilation was installed in the chemical
22
room. Personal breathing zone and general area air samples were collected and anal yzed for inorganic acids (hy drochloric, nitric, and sulfuric) and volatile organic com pounds (VOCs). Thermal desorption tubes were used qualitatively to determ ine the co mpounds to analyze. A ventilation assessment consisted of “smoke” tube observations and velometer measurements. Hydrochloric acid concentrations ranged from not detected (ND) to 0.0 49 milligrams per cubic meter (mg/m3) and nitric acid concentrations ranged from ND to 0.035 mg/m3. Sulfuric acid concentrations could not be determined due to analy tical problems. Based upon thermal desorption tube results, the VOC samples were anal yzed for toluene, trichloroethylene (TCE), and total VOCs (reported as octane). Toluene concentrations ranged from 0.06 to 0.29 parts per million (ppm), TCE concentrations ranged from trace to 0.99 ppm, and total VOC concentrations ranged from trace to 0.35 ppm. All of these results were far below applicable occupational exposure limits. Ventilation testing using visual “sm oke” indicated little air movement over the workbenches and around mechanical equipment. A ventilation assessment of the slot hood in the chemical room found it within recommended standards. Although no applicable standards exist for the ventilation s ystems in the buffing and lacquer rooms, each area was under negative pressure in relationship to the repair shop. Confidential interviews were conducted with repair shop em ployees. Of the seven br ass and woodwind shop em ployees interviewed, three had experienced upper an d/or lower respiratory symptoms they felt were related to acid mist exposure from the chemical room . Two of the three had complete resolution of their symptoms after a new ventilation s ystem was installed. At least two of the seven have had mild to moderate skin irritation related to their work. These symptoms reportedly improved with skin moisturizers and glove use. Em ployees’ reports of upper and lower respiratory symptoms could be related to the l ow concentrations of air contaminants measured. It is possible that the reported symptoms were related to hig her concentration of the irritants that may have been present in the repair shop prior to i nstallation of the new ventilation s ystem. Recommendations are provided to further reduce e mployees’ exposures to these chem icals by increasing the level of personal protection for workers in the
repair shop, and improving ventilation and work practices in the facility. Keywords: SIC Code 7699 (Repair Shops and Related Services, Not Elsewhere Classified), musical instrument repair, inorgani c acid, hydrochloric acid, sulfu ric acid, nit ric acid, toluene, trichloroethylene, TCE, sore throat, headaches, congestion, asthma, cough, allergies, sneezing, watery eyes, upper r espiratory symptoms, lower respirator y symptoms, skin irritation. A full NIOSH report can be found at: http://www.cdc.gov/niosh/hhe/reports/pdfs/2003-0029-2923.pdf
23
Bioaerosols Case 1. Report HETA 99-0091-2846 On January 29, 1999, the National Institute for Occupational Safety and Health (NIOSH) received a c onfidential employee request for a Health Hazard Evaluation (HHE) at the Plover, Wisconsin, facility of McCain Foods, Inc., a plant which produces frozen potato products. The requesters express ed concern regarding possible health effects, especially respiratory problems, which they believed were a ssociated with exposures to carbon m onoxide (CO), chlorine gas (Cl2), and un known chemicals. On March 30, 1999, a preliminary NIOSH investigation focused on the potential for Cl2, and CO ex posures. Screening tests for the presence of both chemicals in air were negative. However, informal worker interviews suggested that health problems might be widespread. During a July 25-26, 1999, site visit, NIOSH researchers investigated whether the health effects were related to bioaerosols, such as bacteria, fungi, or their products (especially endotoxins, which are co mponents of the coats of gram-negative bacteria). A questionnaire survey of wo rkers was co nducted to determine the frequency of respiratory and oth er health symptoms and full-shift, personal breathing zone (PBZ) samples were collected to estimate time-weighted average (TW A) concentrations of airborne particulates and endotoxi n. Data was categorized by whether it was colle cted in the potato processing areas or in the packaging areas of the plant. The question naire survey of 115 of 185 workers found the prevalence of chest tightness was more than 2.5 tim es greater in the processing workers than the packaging workers (39% versus 14% , prevalence rate [PR] = 2.8, 95% confidence interv al [CI]: 1.36-5.75). Processing employees also had twice th e prevalence of shortness o f breath (43% ver sus 18%, PR = 2.4, 95% CI: 1.29- 4.63), twice the prevalence of pneumonia or chest flu episodes (48% versus 25%, PR = 2.0, 95% CI: 1.16-3.33) , and one and one-half times the prevalence of eye, nose, or throat irritation (55% versus 33%, PR = 1.7, 95% CI: 1.07-2.5 7) compared to packaging employees. These findings re mained statistically significant aft er controlling for t he confounding factors of age and cigarette smoking. Airborne endotoxin concentrations in
the processing area greatly exceeded those in the packaging area. PBZ endotoxin concentrations in the processing area of t he plant averaged 168 endotoxin units per cubic meter (EU/m3), but those in the packaging ar ea were less than the lower limit of detection (0.018 EU/m3). A likely source of bacteria, and, the refore, endotoxins, is a wastewater gutter s ystem located through out the processing area of the plant. Case 2. A Health Ha zard Evaluation (HHE) was conducted on April 14–16 , 1997, by the National Institute for O ccupational Safety and Health (NIOSH) at Especially for You, Limited, located in Colom a, Wisconsin. This HHE was conducted following a confidential em ployee request regarding styrene vapor and sanding dust exposure in the Resin and Finishing department. The company manufactures a va riety of hom e decorative items including plastic art icles by curing polyester resin in preformed molds. Air monitoring was conducted during the manufacturing activities for volatil e organic compounds (VOCs), styrene, Stoddard solvent, methyl ethyl ketone peroxide (MEKP) as well as respirable and total dust. Personal b reathing zone (PBZ) samples collected when workers were mixing and p ouring liquid resin revealed that full–shift exposure concentrations to styrene ranged from 15 to 46 par ts per million (ppm); some of the exposures exceeded the American Conference of Go vernmental Industrial Hygienists (ACGIH) Threshold Lim it Value® (TLV) for styrene of 20 ppm and approached the NIOSH Recommended Exposure Limit (REL) of 50 ppm. In addition, short–te rm PBZ exposure to sty rene during resin mixing exceeded both the ACGI H 15–minute Short–Term Exposure Limit (STEL) of 40 ppm and the NIOSH STEL of 100 ppm. Gas chromatograpy–mass spectrophotometry (GC–MS) analyses identified other VOCs pr esent in the air as a mixture of aliphatic h ydrocarbons which produced a chromatogram pattern resembling Stoddard solvent. However, PBZ exposure to Stoddard solvent was determined to be well below relevant occupationa l health criteria. Area samples collected for MEKP did not detect this com pound at “worst–case” locations when the (ME KP) accelerator was added to t he resin. Full–shift exposure concentrations to total particulates during
24
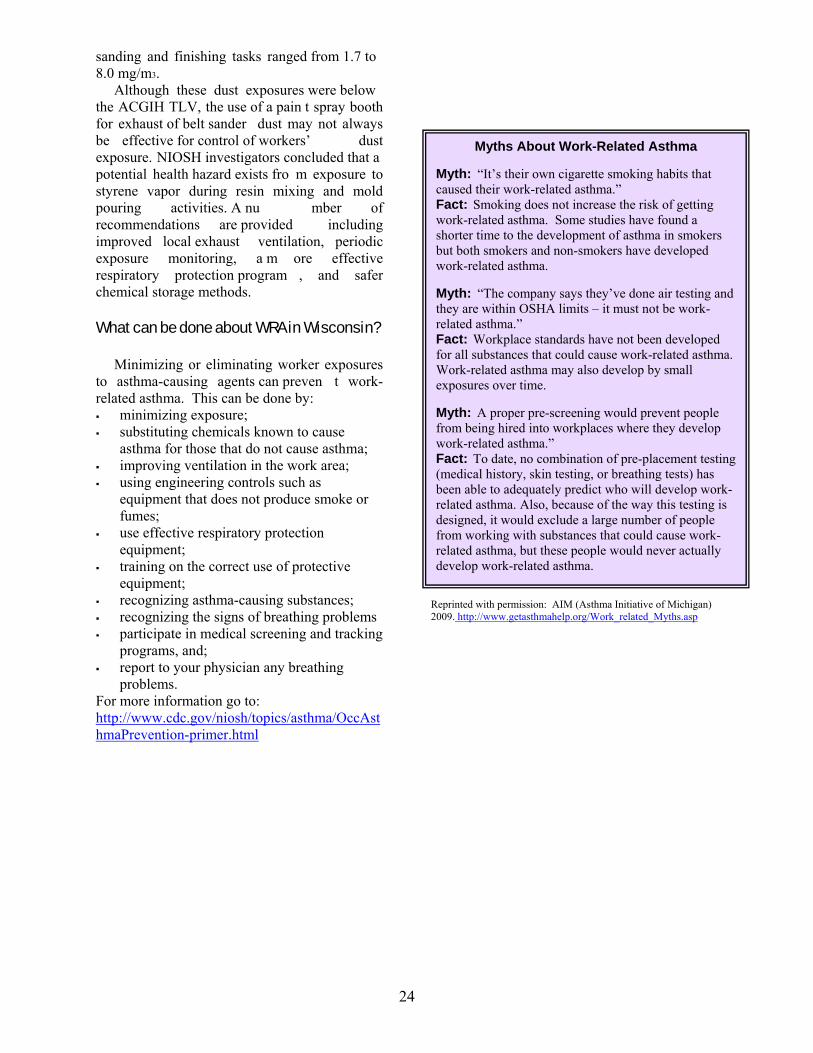
Myths About Work-Related Asthma Myth: “It’s their own cigarette smoking habits that caused their work-related asthma.” Fact: Smoking does not increase the risk of getting work-related asthma. Some studies have found a shorter time to the development of asthma in smokers but both smokers and non-smokers have developed work-related asthma. Myth: “The company says they’ve done air testing and they are within OSHA limits – it must not be work-related asthma.” Fact: Workplace standards have not been developed for all substances that could cause work-related asthma. Work-related asthma may also develop by small exposures over time. Myth: A proper pre-screening would prevent people from being hired into workplaces where they develop work-related asthma.” Fact: To date, no combination of pre-placement testing (medical history, skin testing, or breathing tests) has been able to adequately predict who will develop work-related asthma. Also, because of the way this testing is designed, it would exclude a large number of people from working with substances that could cause work-related asthma, but these people would never actually develop work-related asthma.
sanding and finishing tasks ranged from 1.7 to 8.0 mg/m3. Although these dust exposures were below the ACGIH TLV, the use of a pain t spray booth for exhaust of belt sander dust may not always be effective for control of workers’ dust exposure. NIOSH investigators concluded that a potential health hazard exists fro m exposure to styrene vapor during resin mixing and mold pouring activities. A nu mber of recommendations are provided including improved local exhaust ventilation, periodic exposure monitoring, a m ore effective respiratory protection program , and safer chemical storage methods. What can be done about WRA in Wisconsin? Minimizing or eliminating worker exposures to asthma-causing agents can preven t work-related asthma. This can be done by: minimizing exposure; substituting chemicals known to cause
asthma for those that do not cause asthma; improving ventilation in the work area; using engineering controls such as
equipment that does not produce smoke or fumes;
use effective respiratory protection equipment;
training on the correct use of protective equipment;
recognizing asthma-causing substances; recognizing the signs of breathing problems participate in medical screening and tracking
programs, and; report to your physician any breathing
problems. For more information go to: http://www.cdc.gov/niosh/topics/asthma/OccAsthmaPrevention-primer.html
Reprinted with permission: AIM (Asthma Initiative of Michigan) 2009. http://www.getasthmahelp.org/Work_related_Myths.asp
25
Bibliography American Thoracic Society. 2003. Consensus Statement Bardana EJ Jr. Reactive airways dysfunction syndrome (RADS): guidelines for diagnosis and treatment and insights into likely prognosis. Ann Allergy Asthma Immunol 1999;83:583-6 Arif, A A, Whitehead, LW, Delclos GL, Tortolero, Lee ES. Prevalence and risk factors of work related asthma by industry among United States workers: data from the third national health and nutrition examination survey (1988-94). Occup Environ Med 2002;59:505-511 Blanc PD, Toren K. How much adult asthma can be attributed to occupational factors? Am J Med 1999; 107. CDC/NIOSH. Work-related Lung Disease (WoRLD) Surveillance System. Available at: http://www2a.cdc.gov/drds/WorldReportData/FigureTableDetails.asp?FigureTableID=992 CDC/NIOSH. Preventing Asthma and Death from Diisocyanate Exposure: A NIOSH Alert. Available at http://mtn.niosh.cdc.gov/eid/rmca/polstmt/pdfdoc/PSZY33B.pdf CDC/NIOSH. Preventing Allergic Reactions to Natural Rubber Latex in the Workplace. Available at http://www.cdc.gov/niosh/latexalt.html CDC/NIOSHPreventing Asthma in Animal Handlers: A NIOSH Alert. Available at http://mtn.niosh.cdc.gov/eid/rmca/critdoc/criteriadoc/239,pdf CDC/NIOSH. Worker Health Chartbook, 2004. Chan-Yeun M, Malo JL. Tables of major inducers of occupational asthma. In: Berstein IL, Chan-Yeung M, Malo JL, Bernstein DI, eds. Asthma in the Workplace. 2nd ed. New York: Dekker, 1999:683-720.
Glazer, C., Pacheco, K. 2008. Making the Diagnosis of Occupational Asthma: When to Suspect it and what to do. Prim Care Clin Office Pract 35 (2008):61-80 Goe, SK, Henneberger PK, Reilly MJ, Rosenman KD, et al. 2004. Occup Environ Med Jun; 61(6):512-7 Islam, KM, Lins, M. 2004. Wisconsin Asthma Questionnaire Work-related asthma survey: Final report. Wisconsin Department of Health and Family Services. Henneberger, Paul K. Work-exacerbated asthma. Curr Opin Allergy Clin Immunol. 2007. Apr; Vol 9 (2): 146-51. Jajosky RA, Harrison R, Reinish F, et. al. 1999. Surveillance of work-related asthma in selected US states using surveillance guidelines for state health departments – California, Massachusetts, Michigan, and New Jersey, 1993-1995. Morb Mortal Wkly Rep 48:1-20. Milton DK, Solomon GM, Rosiello RA, Herrick RF. Risk and incidence of asthma attributable to occupational exposure among HMO members. AM J Ind Med 1998;33:1-10. National Center for Health Statistics. Plan and operation of the third national health and nutrition examination survey, 1988-94. National Center for Health Statistics 1994;1:32 Quint, Julia, Beckett, W., Campleman, S., et al. 2008. Primary Prevention of Occupational Asthma: Identifying and Controlling Exposures to Asthma-Causing Agents. AM J Ind Med 51:447-491. Rosenman, Kenneth, Kalinowski, D. 2006 Annual Report on Work-Related Asthma in Michigan. Saarinen, K., Karjalainen, A., Martikainen, R. et.al. 2003 Eur Respir J 22:305-309

26
Toren K, Brisman J, Olin AC, Blanc PD. 2000 Asthma on the job: work-related factors in new-onset asthma and in exacerbations of pre-existing asthma. Respir Med 94 (6):529-535 Youakim, Sami, 2001. Work-Related Asthma. Am Fam Physician Vol 64, No 11, December 12, 2001, 1839-1848. Wisconsin Department of Health and Family Services. 2007 Burden of Asthma in Wisconsin