Embed Size (px)
Citation preview

CDP WATERREPORT
2017

TABLE OF CONTENTS
WATER
W0. INTRODUCTION 1310182830
38434449
W1. CONTEXTW2. PROCEDURES & REQUIREMENTSW3. WATER RISKSW4. WATER OPPORTUNITIESW5. FACILITY LEVEL WATER ACCOUNTING
W6. GOVERNANCE & STRATEGYW7. COMPLIANCEW8. TARGETS & INITIATIVESW9. MANAGING TRADE-OFFS BETWEEN WATER & OTHER ENVIRONMENTAL ISSUES

CDP Water 2017 Information Request
PepsiCo, Inc.
Module: Introduction
Page: W0. Introduction
W0.1
Introduction
Please give a general description and introduction to your organization
PepsiCo products are enjoyed by consumers one billion times a day in more than 200 countries and territories around the world. PepsiCo generated approximately $63 billion in net revenue in 2016, driven by a complementary food and beverage portfolio that includes Frito-Lay, Gatorade, Pepsi-Cola, Quaker and Tropicana, including 22 brands that generate more than $1 billion each in estimated annual retail sales. At the heart of PepsiCo is Performance with Purpose – our goal to deliver top-tier financial performance while creating sustainable growth and shareholder value. In practice, Performance with Purpose means providing a wide range of foods and beverages from treats to healthy eats; finding innovative ways to reduce our impact on the environment and lower our operating costs; providing a safe and inclusive workplace for our employees globally; and respecting, supporting and investing in the local communities where we operate. Cautionary Statement - Statements in this submission that are “forward-looking statements” are based on currently available information, operating plans and projections about future events and trends. Terminology such as “aim,” “anticipate,” “believe,” “drive,” “estimate,” “expect,” “expressed confidence,” “forecast,” “future,” “goal,” “guidance,” “intend,” “may,” “objective,” “outlook,” “plan,” “position,” “potential,” “project,” “seek,” “should,” “strategy,” “target,” “will” or similar statements or variations of such terms are intended to identify forward-looking statements, although not all forward-looking statements contain such terms. Forward-looking statements inherently involve risks and uncertainties that could cause actual results to differ materially from those predicted in such forward-looking statements. Such risks and uncertainties include, but are not limited to: changes in demand for PepsiCo’s products; changes in, or failure to comply with, applicable laws and regulations; imposition or proposed imposition of new or increased taxes aimed at PepsiCo’s products; imposition of labeling or warning requirements on PepsiCo’s products; changes in laws related to packaging and disposal of PepsiCo’s products; PepsiCo’s ability to compete effectively; political conditions, civil unrest or other developments and risks in the markets where PepsiCo’s products are made, manufactured, distributed or sold; PepsiCo’s ability to grow its business in developing and emerging markets; unfavorable economic conditions in the countries in which PepsiCo operates; the ability to protect information systems against, or effectively respond to, a cybersecurity incident or other disruption; increased costs, disruption of supply or shortages of raw materials and other supplies; business disruptions; product contamination or tampering or issues or concerns with respect to product quality, safety and integrity; damage to PepsiCo’s reputation or brand image; failure to successfully complete or integrate acquisitions and joint ventures into PepsiCo’s existing operations or to complete or manage divestitures or refranchisings; changes in estimates and underlying assumptions regarding future performance that could result in an impairment charge; increase in income tax rates, changes in income tax laws or disagreements with tax authorities; failure to realize anticipated benefits from PepsiCo’s productivity initiatives or global operating model; PepsiCo’s ability to recruit, hire or retain key employees or a highly skilled and diverse workforce; loss of any key customer or changes to the retail landscape; any downgrade or potential downgrade of PepsiCo’s credit ratings; PepsiCo’s ability to implement shared services or utilize information technology systems and networks effectively; fluctuations or other changes in exchange rates; climate change or water scarcity, or legal, regulatory or market measures to address climate change or water scarcity; failure to successfully negotiate collective bargaining agreements, or strikes or work stoppages; infringement of intellectual
property rights; potential liabilities and costs from litigation or legal proceedings; and other factors discussed in the risk factors section of PepsiCo’s filings with the Securities and Exchange Commission. Investors are cautioned not to place undue reliance on any such forward-looking statements, which speak only as of the date they are made. PepsiCo undertakes no obligation to update any forward-looking statements.
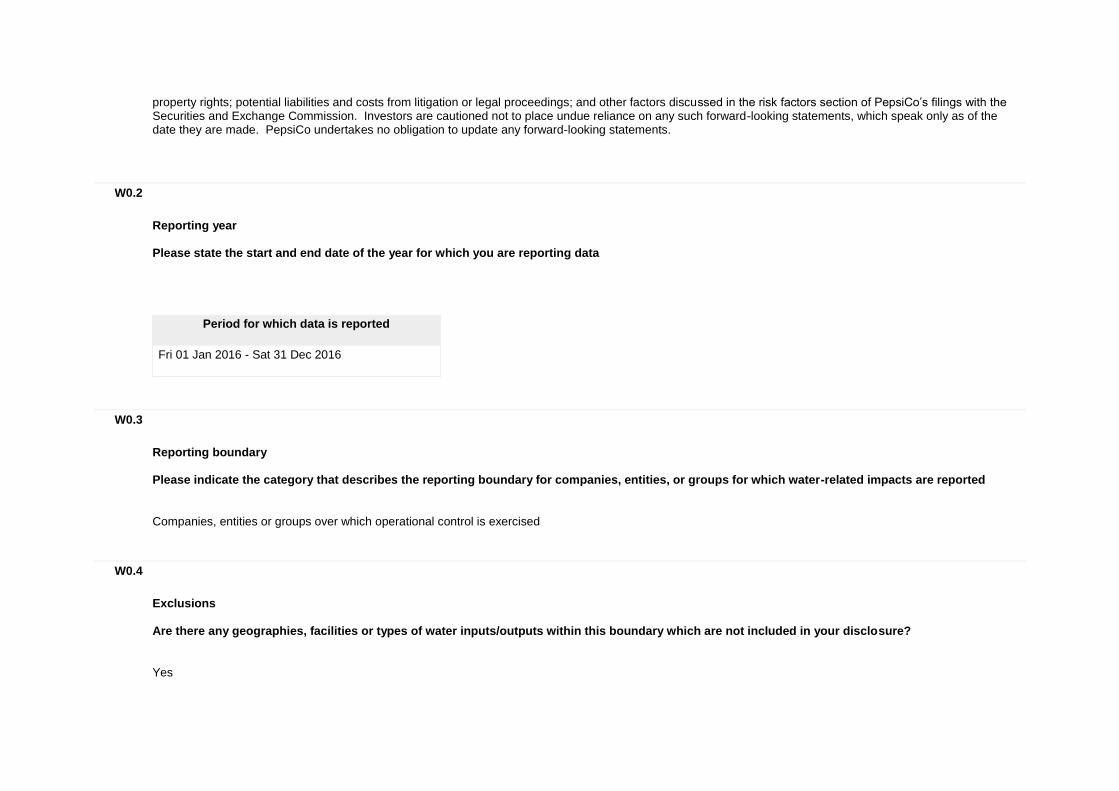
W0.2
Reporting year
Please state the start and end date of the year for which you are reporting data
Period for which data is reported
Fri 01 Jan 2016 - Sat 31 Dec 2016
W0.3
Reporting boundary
Please indicate the category that describes the reporting boundary for companies, entities, or groups for which water-related impacts are reported
Companies, entities or groups over which operational control is exercised
W0.4
Exclusions
Are there any geographies, facilities or types of water inputs/outputs within this boundary which are not included in your disclosure?
Yes

W0.4a
Exclusions
Please report the exclusions in the following table
Exclusion
Please explain why you have made the exclusion
Operational control farms & dairies Company farms in China and Egypt do not have the capability to measure consumption at this time. Collectively, we estimate that exclusions represent less than 1% of total consumption.
International offices/warehouse (partial) These facilities do not report water consumption. Collectively, we estimate that exclusions represent less than 1% of total consumption.
Offices/warehouses associated with significant acquisitions in 2010 and 2011.
These facilities do not report water consumption. Collectively, we estimate that exclusions represent less than 1% of total consumption.
Further Information
Module: Current State
Page: W1. Context
W1.1
Please rate the importance (current and future) of water quality and water quantity to the success of your organization
Water quality and
quantity
Direct use importance
rating
Indirect use importance
rating
Please explain
Sufficient amounts of good Vital for Important Good quality fresh water is needed as a key ingredient for our beverages and it is used throughout

Water quality and
quantity
Direct use importance
rating
Indirect use importance
rating
Please explain
quality freshwater available for use
operations our food and beverage operations and in those of our third party manufacturers and franchise bottlers to maintain sanitary conditions in our facilities. This is also true for raw materials suppliers, particularly within our agricultural supply chain where water is vital for growing crops.
Sufficient amounts of recycled, brackish and/or produced water available for use
Not very important
Neutral Our ingredient standards mean that we cannot use brackish or other types of water in our manufacturing processes. The power plants that provide energy to our operations and our suppliers may rely on recycled, brackish and/or produced water for cooling.
W1.2
For your total operations, please detail which of the following water aspects are regularly measured and monitored and provide an explanation as to why or why not
Water aspect
% of
sites/facilities/operations
Please explain
Water withdrawals- total volumes
76-100
100% Manufacturing Sites are measured and monitored. We Track all water withdrawals on a monthly basis across PepsiCo, leveraging our enterprise wide Sustainability metrics platform. We score card performance quarterly as part of our Performance With Purpose Goals performance tracking.
Water withdrawals- volume by sources
76-100 100% manufacturing sites track water withdrawal by source on a monthly basis and capture it in our enterprise wide sustainability metric tracking platform.
Water discharges- total volumes
We intend to report against this metric in our next CDP Water response.
Water discharges- volume by destination
We intend to report against this metric in our next CDP Water response
Water discharges- volume by treatment method
We intend to report against this metric in our next CDP Water response
Water discharge quality
We intend to report against this metric in our next CDP Water response

Water aspect
% of
sites/facilities/operations
Please explain
data- quality by standard effluent parameters
Water consumption- total volume
76-100 100% of sites track and monitor water consumption.
Facilities providing fully-functioning WASH services for all workers
76-100
PepsiCo’s internal self-assessment program to measure water, sanitation, and hygiene (WASH) compliance has been implemented at all company-owned plants, with 89% of sites reporting full compliance with core WASH elements of availability and maintenance of toilets, access to safe water, and availability of hand washing facilities).
W1.2a
Water withdrawals: for the reporting year, please provide total water withdrawal data by source, across your operations
Source
Quantity
(megaliters/year)
How does total water withdrawals for this source compare to the last reporting
year?
Comment
Fresh surface water 188 Higher 1 site in Latin America, Santo Domingo, sourced its water from surface water in 2016. This supply was sourced from a well the previous year.
Brackish surface water/seawater
0 About the same We do not use salt water in our operations.
Rainwater 0
Groundwater - renewable 27193 About the same We supply water from company owned wells in many locations.
Groundwater - non-renewable
0 About the same
Produced/process water 655 Higher This water is recovered from purchased steam. Changes to product portfolio and production patterns impact on the amount of stream purchased in any year.

Source
Quantity
(megaliters/year)
How does total water withdrawals for this source compare to the last reporting
year?
Comment
Municipal supply 65398 About the same
Wastewater from another organization
0 About the same We do not source waste water from any other organization.
Total 93434 About the same We continue to drive efficiencies in water usage across our operations.
W1.2b
Water discharges: for the reporting year, please provide total water discharge data by destination, across your operations
Destination
Quantity
(megaliters/year)
How does total water discharged
to this destination compare to the last reporting year?
Comment
Fresh surface water
Unable to Answer this Year; Intend to Answer Next Year
Brackish surface water/seawater
Unable to Answer this Year; Intend to Answer Next Year
Groundwater
Unable to Answer this Year; Intend to Answer Next Year
Municipal/industrial wastewater treatment plant
Unable to Answer this Year; Intend to Answer Next Year
Wastewater for another organization
Unable to Answer this Year; Intend to Answer Next Year
Total
Unable to Answer this Year; Intend to Answer Next Year

W1.2c
Water consumption: for the reporting year, please provide total water consumption data, across your operations
Consumption (megaliters/year)
How does this consumption figure compare to the last reporting year?
Comment
62460 About the same Our Consumption volume is based on withdrawal volume – production and evaporated water volumes.
W1.3
Do you request your suppliers to report on their water use, risks and/or management?
No
W1.3a
Please provide the proportion of suppliers you request to report on their water use, risks and/or management and the proportion of your procurement spend this represents
Proportion of suppliers %
Total procurement spend %
Rationale for this coverage
W1.3b

Please choose the option that best explains why you do not request your suppliers to report on their water use, risks and/or management
Primary reason
Please explain
Reporting implementation in progress
Our water stewardship program is based on addressing key areas of risk across the PepsiCo value chain. Water risk in our supply chain is centered on our franchise bottler operations and co-manufacturing/co-packing partners. While we do not require such business partners to report water use to us, we request that they work directly with us to assess and mitigate water risk and that they report back to us in some cases on the results of water efficiency improvements.
W1.4
Has your organization experienced any detrimental impacts related to water in the reporting year?
Yes
W1.4a
Please describe the detrimental impacts experienced by your organization related to water in the reporting year
Country
River basin
Impact driver
Impact
Description of
impact
Length of
impact
Overall financial
impact
Response strategy
Description of response
strategy
United States of America
Other: All
Phys-Increased water stress
Supply chain disruption
Unpredictable weather including droughts across the U.S., particularly in California and Texas in recent years has
The on-going lack of rainfall in parts of the U.S. appear to be a long-term (<10 yrs) issue,
Financial impacts have not been quantified. However, we are investing in pro-active management of the issues as well as our
Engagement with suppliers
In 2013, PepsiCo launched the SFI, a comprehensive on-farm program that was ongoing through 2016 to gather data at the farm level and advance sustainable

Country
River basin
Impact driver
Impact
Description of
impact
Length of
impact
Overall financial
impact
Response strategy
Description of response
strategy
affected the availability of corn and potatoes from farmers whose crops were affected.
increasing water stress for farmers and impacting their ability to supply our business.
Sustainable Farming Initiative (SFI) program (see response strategy) which is intended to mitigate potential financial impacts.
agricultural practices, continuous improvement, and long-term viability of the farm. The SFI framework contains environmental, social and economic sustainability indicators with detailed criteria and global standards for each. Water is one of the nine environmental indicators.
United States of America
Other: All
Reg-Higher water prices
Higher operating costs
Rising water prices in the U.S. for a range of reasons including increasing water stress threaten to increase our costs unless we reduce our water usage.
The reasons for higher water prices including increasing water stress are potentially long term trends.
Our water efficiency programs saved the business approximately $19 million in 2015 compared to the 2006 run rate. These savings could be negated by higher water prices.
Establish site-specific targets
By the end of 2015, we had reduced our water use per unit of production by 25.8% since 2006 from our legacy operations, exceeding our target of a 20 percent reduction and delivering a cost saving of approximately $19 million in 2015 as compared to a 2006 run rate. We are currently working on new goals which should continue to help limit our exposure to increasing costs from higher prices for water.
W1.4b
Please choose the option below that best explains why you do not know if your organization experienced any detrimental impacts related to water in the reporting year and any plans you have to investigate this in the future

Primary reason
Future plans
Further Information
Please see attached Sustainability Report pages 6 and 21-27 for additional information.
Attachments
https://www.cdp.net/sites/2017/05/14605/Water 2017/Shared Documents/Attachments/Water2017/W1.Context/pepsico_sustainability_report_2015_and_-2025_agenda.pdf
Module: Risk Assessment
Page: W2. Procedures and Requirements
W2.1
Does your organization undertake a water-related risk assessment?
Water risks are assessed
W2.2
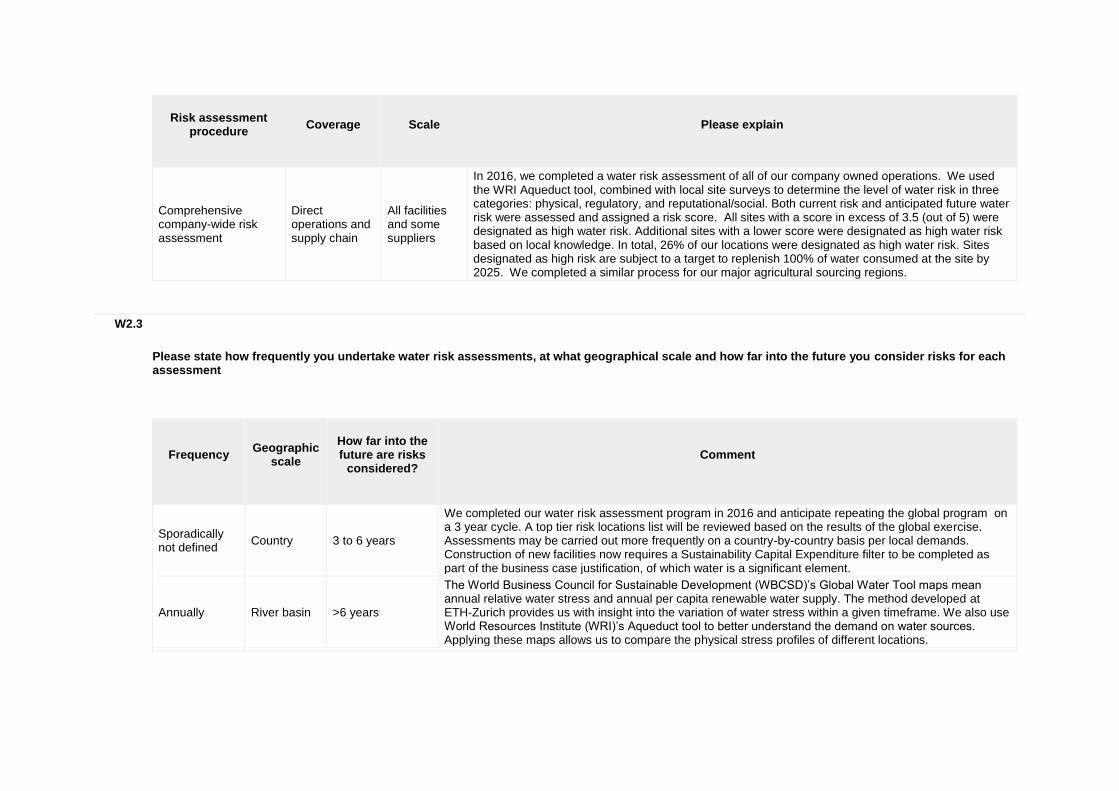
Please select the options that best describe your procedures with regard to assessing water risks
Risk assessment
procedure
Coverage
Scale
Please explain
Comprehensive company-wide risk assessment
Direct operations and supply chain
All facilities and some suppliers
In 2016, we completed a water risk assessment of all of our company owned operations. We used the WRI Aqueduct tool, combined with local site surveys to determine the level of water risk in three categories: physical, regulatory, and reputational/social. Both current risk and anticipated future water risk were assessed and assigned a risk score. All sites with a score in excess of 3.5 (out of 5) were designated as high water risk. Additional sites with a lower score were designated as high water risk based on local knowledge. In total, 26% of our locations were designated as high water risk. Sites designated as high risk are subject to a target to replenish 100% of water consumed at the site by 2025. We completed a similar process for our major agricultural sourcing regions.
W2.3
Please state how frequently you undertake water risk assessments, at what geographical scale and how far into the future you consider risks for each assessment
Frequency
Geographic
scale
How far into the future are risks
considered?
Comment
Sporadically not defined
Country 3 to 6 years
We completed our water risk assessment program in 2016 and anticipate repeating the global program on a 3 year cycle. A top tier risk locations list will be reviewed based on the results of the global exercise. Assessments may be carried out more frequently on a country-by-country basis per local demands. Construction of new facilities now requires a Sustainability Capital Expenditure filter to be completed as part of the business case justification, of which water is a significant element.
Annually River basin >6 years
The World Business Council for Sustainable Development (WBCSD)’s Global Water Tool maps mean annual relative water stress and annual per capita renewable water supply. The method developed at ETH-Zurich provides us with insight into the variation of water stress within a given timeframe. We also use World Resources Institute (WRI)’s Aqueduct tool to better understand the demand on water sources. Applying these maps allows us to compare the physical stress profiles of different locations.

W2.4
Have you evaluated how water risks could affect the success (viability, constraints) of your organization's growth strategy?
Yes, evaluated over the next 1 year
W2.4a
Please explain how your organization evaluated the effects of water risks on the success (viability, constraints) of your organization's growth strategy?
We have evaluated the potential effects of both water quality issues and water quantity on our business strategy, and have implemented programs to respond to them, as follows: Water quality: We have a public goal under our Performance with Purpose agenda that 100% of wastewater discharges from our operations meet PepsiCo’s high standards for discharge quality. We set this target recognizing that local wastewater discharge regulations are not always enough to adequately protect receiving water body water quality. We identified this as a risk to both our license to operate and ability to grow our business in certain markets. In response, we are upgrading onsite effluent treatment plants, working to reduce the amount of organic material entering effluent streams within our plants, and training employees on effluent management and treatment. Water quantity: Because of the critical nature of water supply to our business, we have an embedded water-related risk assessment into our business processes and use the results to modify or enhance business strategy in several areas. For example, we assess the level of water stress to our operations. While all PepsiCo production locations are subject to a public target to improve water use efficiency by 25% by 2025, locations defined as high water risk are subject to an additional target to replenish back into the watershed the amount of water consumed. We have also conducted an assessment of water scarcity in our supply chain, focusing on agricultural in our main sourcing regions. The results are being used to support PepsiCo’s overall growth strategy – in this case specifically to assist our procurement teams in identifying sourcing areas most at risk for water stress, enabling them to adjust long-term sourcing plans and strategy accordingly.
W2.4b
What is the main reason for not having evaluated how water risks could affect the success (viability, constraints) of your organization's growth strategy, and are there any plans in place to do so in the future?

Main reason
Current plans
Timeframe until evaluation
Comment
W2.5
Please state the methods used to assess water risks
Method
Please explain how these methods are used in your risk assessment
Internal company knowledge WBCSD Global Water Tool WRI Aqueduct Other: PepsiCo developed Local Water Risk Surveys
PepsiCo conducts water risk assessments for all of its wholly-owned manufacturing operations using the following method: data is collected from 4 inputs: 1) WRI Aqueduct tool; 2) WBCSD Global Water Tool; 3) internal company knowledge at site level; and 4) expertise of external independent hydrologists with local knowledge and expertise. Information from these sources is compiled to develop a comprehensive view of water-related risk facing each site within their specific local context, both now and out to 2025, and to categorize risks as physical, regulatory or social/reputational. All sites receiving a score of 3.5 or higher (from within a range of 0 to 5) are classified as high water risk and subject to mitigation requirements, including targets on water efficiency improvements and watershed replenishment. Additional sites with a lower score that are designated as high water risk based on local knowledge are subject to mitigation requirements as well. We utilize the expertise of independent hydrologists to validate the results of both the tools and the site surveys in an effort to ensure the results are consistent and credible.
W2.6
Which of the following contextual issues are always factored into your organization's water risk assessments?
Issues
Choose option
Please explain
Current water availability and quality parameters at a local level
Relevant, included
We conduct source vulnerability assessments at priority high risk facilities to ensure that we have a comprehensive picture of local water availability within the context of the local watershed. Through

Issues
Choose option
Please explain
these assessments along with our water risk assessment process, we gain knowledge of both current stressors on water availability and quality as well as projected future stressors.
Current water regulatory frameworks and tariffs at a local level
Relevant, included
We have constructed a water stress assessment survey for our sites that provides more detailed insight into local regulatory conditions affecting both water supply (i.e., allocation restrictions) and water costs (i.e., tariffs).
Current stakeholder conflicts concerning water resources at a local level
Relevant, included
We have constructed a water stress assessment survey for our sites that provides more detailed insight into local water conditions by addressing water quantity, water quality and external factors such as competition, economics and community concerns.
Current implications of water on your key commodities/raw materials
Relevant, included
We conducted a water risk assessment on our major agricultural sourcing regions around the globe. This assessment identified areas of high water risk and enables us to target investment in water efficiency improvements with our farmer communities as well as plan for future supply disruptions.
Current status of ecosystems and habitats at a local level
Not evaluated
We have not yet adopted a systematic approach to assessing the current status of ecosystems and habitats at a local level. We regularly review the need, opportunity and our ability to increase the number of factors that we consider in assessing risks related to water.
Current river basin management plans Relevant, included
PepsiCo’s public goal to contribute to Positive Water Impact in and near the communities where we work (meaning that our efforts and partnerships will be designed to enable long-term, sustainable water security for our business and others who depend on water availability) includes a goal to advocate for strong water governance locally and nationally. Where we undertake this work, we ensure that our work is aligned with local river basin management plans.
Current access to fully-functioning WASH services for all employees
Relevant, included
In 2014, we developed a global PepsiCo standard for Potable Water Management, which includes WASH, applies to all company owned facilities, all company managed and leased facilities, as well as majority owned joint ventures.
Estimates of future changes in water availability at a local level
Relevant, included
PepsiCo collects data from 4 inputs in its assessment process: 1) WRI Aqueduct tool; 2) WBCSD Global Water Tool; 3) internal company knowledge at site level; and 4) expertise of external independent hydrologists with local knowledge and expertise. Information from these sources is compiled to develop a comprehensive view of water-related risk facing the site within their specific local context, both now and out to 2025, and to categorize risks as physical, regulatory or social/reputational. Sites receiving a score of 3.5 or higher (from within a range of 0 to 5) are classified as high water risk and subject to mitigation requirements, including targets on water efficiency improvements and watershed replenishment. We utilize the expertise of independent hydrologists to validate the results of both the tools and the site surveys in an effort to ensure the results are consistent and credible.
Estimates of future potential regulatory changes at a local level
Relevant, included
PepsiCo collects data from 4 inputs in its assessment process: 1) WRI Aqueduct tool; 2) WBCSD Global Water Tool; 3) internal company knowledge at site level; and 4) expertise of external independent hydrologists with local knowledge and expertise. Information from these sources is compiled to develop a comprehensive view of water-related risk facing the site within their specific local context, both now and out to 2025, and to categorize risks as physical, regulatory or social/reputational.

Issues
Choose option
Please explain
Sites receiving a score of 3.5 or higher (from within a range of 0 to 5) are classified as high water risk and subject to mitigation requirements, including targets on water efficiency improvements and watershed replenishment. We utilize the expertise of independent hydrologists to validate the results of both the tools and the site surveys in an effort to ensure the results are consistent and credible.
Estimates of future potential stakeholder conflicts at a local level
Relevant, not yet included
The tools that we use to assess water risk, including external tools such as the WBCSD’s Global Water Tool, the WRI Aqueduct Tool and our site level surveys focus on current and future water use, quality and availability and current external issues such as regulations, competition, economics and community concerns. We regularly review the need, opportunity and our ability to increase the number of factors that we consider in assessing risks related to water and expect to include this element in water risk assessments within the next 1-3 years.
Estimates of future implications of water on your key commodities/raw materials
Relevant, included
We have conducted a water risk assessment on our major agricultural sourcing regions around the globe. This assessment identified areas of high water risk both current and into the future and enables us to target investment in water efficiency improvements with our farmer communities as well as plan for future supply disruptions.
Estimates of future potential changes in the status of ecosystems and habitats at a local level
Not evaluated
We have not yet adopted a systematic approach to assessing estimates of future potential changes in the status of ecosystems and habitats at a local level. We regularly review the need, opportunity and our ability to increase the number of factors that we consider in assessing risks related to water.
Scenario analysis of availability of sufficient quantity and quality of water relevant for your operations at a local level
Relevant, included
Site level business continuity plans are developed based in part on scenario analysis of current and potential disruptions to water quantity and quality.
Scenario analysis of regulatory and/or tariff changes at a local level
Relevant, not yet included
The tools that we use to assess water risk, including external tools such as the WBCSD’s Global Water Tool, the WRI Aqueduct Tool and our site level surveys focus on current and future water use, quality and availability and current external issues such as regulations, competition, economics and community concerns. We regularly review the need, opportunity and our ability to increase the number of factors that we consider in assessing risks related to water and expect to include this element in water risk assessments within the next 1-3 years.
Scenario analysis of stakeholder conflicts concerning water resources at a local level
Relevant, not yet included
The tools that we use to assess water risk, including external tools such as the WBCSD’s Global Water Tool, the WRI Aqueduct Tool and our site level surveys focus on current and future water use, quality and availability and current external issues such as regulations, competition, economics and community concerns. We regularly review the need, opportunity and our ability to increase the number of factors that we consider in assessing risks related to water and expect to include this element in water risk assessments within the next 1-3 years.
Scenario analysis of implications of water on your key commodities/raw materials
Relevant, included
We are using data collected in the UK and other countries in Europe through i-crop™, a technology that brings together data drawn from soil moisture probes in the fields and local weather stations, to calculate the amount of irrigation needed to maximize crop yields by our potato growers. This data

Issues
Choose option
Please explain
helps us predict water use required in specific locations versus data collected through various tools on water stress to plan for future changes in weather patterns and other impacts.
Scenario analysis of potential changes in the status of ecosystems and habitats at a local level
Not evaluated
We have not yet adopted a systematic approach to assessing potential changes in the status of ecosystems and habitats at a local level. We regularly review the need, opportunity and our ability to increase the number of factors that we consider in assessing risks related to water.
Other
W2.7
Which of the following stakeholders are always factored into your organization's water risk assessments?
Stakeholder
Choose option
Please explain
Customers Relevant, included
Key customers with expectations for performance on water by suppliers include Walmart and Sam's Club. The expectations of these customers are included in risk assessments related to PepsiCo’s water stewardship strategy and program implementation.
Employees Relevant, included
Employees have the potential to significantly impact PepsiCo water stewardship programs and water goal achievement. As such, risks associated with employee behavior with regard to water may be included in local risk assessments, particularly where water-related risks have occurred. In such cases, the potential for employees to reduce risk and improve site performance on water is assessed and action taken accordingly.
Investors Relevant, included
A key element of our overall water stewardship strategy and risk management approach is to achieve and maintain a reputation for leadership in this area. The primary means that we employ to address and manage risk with investors is through participation in the CDP Water public reporting platform.
Local communities Relevant, included
Local community interests in water and PepsiCo’s performance on water are critical foundations of our water strategy. As such, risks to PepsiCo reputation as a water steward within the local community are assessed as part of the site survey element of our risk assessment process.
NGOs Not evaluated
We have not formally included NGOs as a stakeholder group in water risk assessments.
Other water users at Relevant, At some sites with high water risk, the other water users at the local level will likely be critical for scaled-up risk mitigation

Stakeholder
Choose option
Please explain
a local level included efforts. In these cases, we include them in risk assessment and mitigation planning.
Regulators Relevant, included
At some sites with high water risk, local regulators and government administrators responsible for water governance can be critical partners in efforts for scaled-up risk mitigation efforts. In these cases, we include them in risk assessment and mitigation planning.
River basin management authorities
Relevant, included
At some sites with high water insecurity, river basin management authorities responsible for regional water planning can be critical partners in efforts for scaled-up risk mitigation efforts. In these cases, we include them in risk assessment and mitigation planning.
Statutory special interest groups at a local level
Not evaluated
We have not formally included special interest groups as a stakeholder group in water risk assessments.
Suppliers Relevant, included
Our water stewardship program is based on addressing key areas of risk across the PepsiCo value chain. Water risk in our supply chain is centered on our franchise bottler operations and comanufacturing/copacking partners. We work directly with such business partners to mitigate water risk.
Water utilities at a local level
Relevant, included
At some locations, the root cause of water scarcity is the inability of local water utility infrastructure to deliver water in an efficient and effective way. Thus, the local water utility and its plans to improve infrastructure would be an important consideration in local water risk assessments at these sites
Other
W2.8
Please choose the option that best explains why your organisation does not undertake a water-related risk assessment
Primary reason
Please explain
Further Information
Module: Implications

Page: W3. Water Risks
W3.1
Is your organization exposed to water risks, either current and/or future, that could generate a substantive change in your business, operations, revenue or expenditure?
Yes, direct operations and supply chain
W3.2
Please provide details as to how your organization defines substantive change in your business, operations, revenue or expenditure from water risk
PepsiCo incorporates the following factors when defining substantive change in PepsiCo’s direct operations, revenue or expenditure from water risk: 1) magnitude of potential impact on operating costs and/or current and future revenue; and 2) potential impact on stakeholder expectations or perceptions. Substantive change would generally be considered any material change (+/- 5%) to a site's operating environment/costs and/or to PepsiCo reputation locally, regionally or globally. Should such material change occur, the impact (and any potential need to review the definition) would be reviewed and re-assessed by our senior executive team. This definition of substantive change applies to both direct operations and to elements of our supply chain (such as change to agricultural raw material sourcing from water-related risks).
W3.2a
Please provide the number of facilities* per river basin exposed to water risks that could generate a substantive change in your business, operations, revenue or expenditure; and the proportion of company-widefacilities this represents
Country
River basin
Number of facilities exposed to water
risk
Proportion of company-wide facilities that this
represents (%)
Comment
India Other: Multiple 2 1-5 2 of our highest risk operations in India are beverage

Country
River basin
Number of facilities exposed to water
risk
Proportion of company-wide facilities that this
represents (%)
Comment
operations.
United States of America
Colorado River (Pacific Ocean)
9 1-5 9 California operations are identified on our top tier Risk locations.
W3.2b
For each river basin mentioned in W3.2a, please provide the proportion of the company's total financial value that could be affected by water risks
Country
River basin
Financial reporting
metric
Proportion of chosen metric that could be
affected
Comment
India Other: Multiple % global production volume
1-5 Sites identified based on 2016 analysis. Financial reporting metric applies to % global production volume in beverages.
United States of America
Colorado River (Pacific Ocean)
% global production volume
1-5 Sites identified based on 2016 analysis. Financial reporting metric applies to % global production volume in beverages.
W3.2c
Please list the inherent water risks that could generate a substantive change in your business, operations, revenue or expenditure, the potential impact to your direct operations and the strategies to mitigate them

Country
River basin
Risk driver
Potential impact
Description of
potential impact
Timeframe
Likelihood
Magnitude
of potential financial impact
Response strategy
Costs of response strategy
Details of
strategy and costs
India Other: Multiple
Physical-Increased water stress Other: Reputational Risk
Plant/production disruption leading to reduced output
Social and regulatory changes in several areas of India impact the ability of our facilities to maintain and/or increase production. This situation has occurred in the states of Tamil Nadu and Kerala where local opposition to multi-national corporations framed in the context of water use has resulted in product boycotts.
Current-up to 1 year
Highly probable
Medium
Water management incentives
We estimate response costs to be ‘low’, specifically we estimate them to be <1% of PepsiCo’s global revenue. We expect these costs to continue into the future at approximately the same level.
PepsiCo’s response in these watersheds is to implement our global water strategy where we strive for Positive Water Impact in and near the communities where we work — meaning our efforts and collaborations will be designed to enable long-term, sustainable water security for our business and others who depend on water availability. This global strategy is implemented through

Country
River basin
Risk driver
Potential impact
Description of
potential impact
Timeframe
Likelihood
Magnitude
of potential financial impact
Response strategy
Costs of response strategy
Details of
strategy and costs
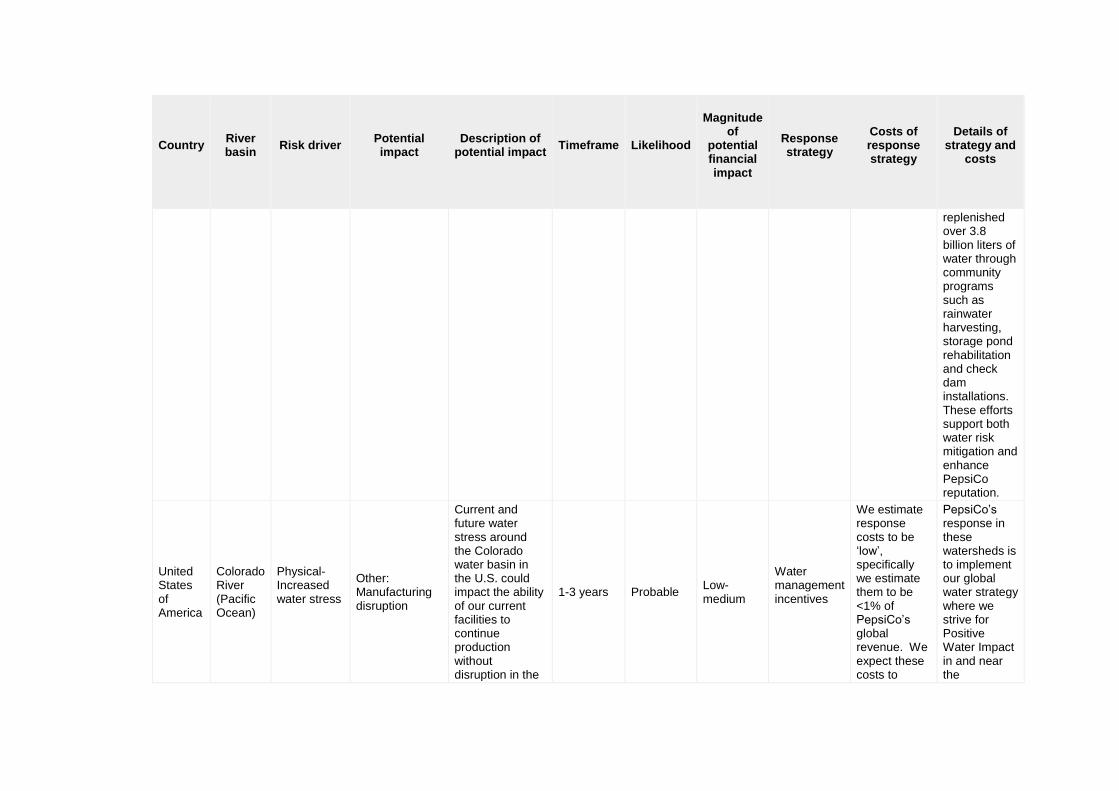
focusing on watershed management, conserving water within our operations, reducing water use in our agricultural supply chain, promoting access to water and advocating for strong water governance within communities. We are implementing this strategy now in India. For example, we are actively replenishing high water risk watersheds where we operate. From 2015 to 2016, we
Country
River basin
Risk driver
Potential impact
Description of
potential impact
Timeframe
Likelihood
Magnitude
of potential financial impact
Response strategy
Costs of response strategy
Details of
strategy and costs
replenished over 3.8 billion liters of water through community programs such as rainwater harvesting, storage pond rehabilitation and check dam installations. These efforts support both water risk mitigation and enhance PepsiCo reputation.
United States of America
Colorado River (Pacific Ocean)
Physical-Increased water stress
Other: Manufacturing disruption
Current and future water stress around the Colorado water basin in the U.S. could impact the ability of our current facilities to continue production without disruption in the
1-3 years Probable Low-medium
Water management incentives
We estimate response costs to be ‘low’, specifically we estimate them to be <1% of PepsiCo’s global revenue. We expect these costs to
PepsiCo’s response in these watersheds is to implement our global water strategy where we strive for Positive Water Impact in and near the

Country
River basin
Risk driver
Potential impact
Description of
potential impact
Timeframe
Likelihood
Magnitude
of potential financial impact
Response strategy
Costs of response strategy
Details of
strategy and costs
future. continue into the future at approximately the same level.
communities where we work — meaning our efforts and collaborations will be designed to enable long-term, sustainable water security for our business and others who depend on water availability. This global strategy is implemented through focusing on watershed management, conserving water within our operations, reducing water use in our agricultural supply chain, promoting

Country
River basin
Risk driver
Potential impact
Description of
potential impact
Timeframe
Likelihood
Magnitude
of potential financial impact
Response strategy
Costs of response strategy
Details of
strategy and costs
access to water and advocating for strong water governance within communities. We are implementing this strategy now in the Colorado River basin through our partnership with The Nature Conservancy. In this program, we partner with TNC on conservation activities within the Colorado River watershed as well as supporting irrigation efficiency improvements to reduce demand for

Country
River basin
Risk driver
Potential impact
Description of
potential impact
Timeframe
Likelihood
Magnitude
of potential financial impact
Response strategy
Costs of response strategy
Details of
strategy and costs
water in this area. These efforts support both water risk mitigation and enhance PepsiCo reputation.
W3.2d
Please list the inherent water risks that could generate a substantive change in your business operations, revenue or expenditure, the potential impact to your supply chain and the strategies to mitigate them
Country
River basin
Risk
driver
Potential impact
Description of
potential impact
Timeframe
Likelihood
Magnitude
of potential financial impact
Response strategy
Costs of response strategy
Details of
strategy and costs
Other: Company-wide
Physical-Increased water stress
Supply chain disruption
Our company is dependent on a successful and sustainable agriculture sector. The
1-3 years Probable Low-medium
Engagement with suppliers
We estimate response costs to be ‘low’, specifically we estimate them to be <1% of
In this context, we define critical tier 1 suppliers as direct growers/farmers and manufacturers of our products.

Country
River basin
Risk
driver
Potential impact
Description of
potential impact
Timeframe
Likelihood
Magnitude
of potential financial impact
Response strategy
Costs of response strategy
Details of
strategy and costs
majority of our raw materials in terms of dollar spend come directly from agriculture, ranging from small-holder farmers in developing and emerging markets to large-scale agribusinesses in developed markets. The importance of water scarcity to our agricultural supply chain is therefore clear and we have already seen the impacts that water scarcity and flooding can have on the reliability and cost of supply.
PepsiCo’s global revenue. We expect these costs to continue into the future at approximately the same level.
We use complementary mapping tools to identify our locations most likely to face water scarcity and also to understand which of our key suppliers may likely face water scarcity. Through our Sustainable Farming Initiative, we are working to deliver our goal to improve water use efficiency in our high water risk direct sourcing areas by 15% by 2025. In collaboration with potato farmers in the UK, we delivered a 50% reduction in water usage in 5 years, completing the program in 2015.
W3.2e

Please choose the option that best explains why you do not consider your organization to be exposed to water risks in your direct operations that could generate a substantive change in your business, operations, revenue or expenditure
Primary reason
Please explain
W3.2f
Please choose the option that best explains why you do not consider your organization to be exposed to water risks in your supply chain that could generate a substantive change in your business, operations, revenue or expenditure
Primary reason
Please explain
W3.2g
Please choose the option that best explains why you do not know if your organization is exposed to water risks that could generate a substantive change in your business operations, revenue or expenditure and discuss any future plans you have to assess this
Primary reason
Future plans
Further Information

Page: W4. Water Opportunities
W4.1
Does water present strategic, operational or market opportunities that substantively benefit/have the potential to benefit your organization?
Yes
W4.1a
Please describe the opportunities water presents to your organization and your strategies to realize them
Country or region
Opportunity
Strategy to realize opportunity
Estimated timeframe
Comment
Company-wide
Other: Securing supply chain
The aspirational aim of our Performance with Purpose water stewardship program is to improve water security for our supply chain and the communities in which we operate. Improved water security usually translates into improved economic opportunity for all. Our strategy to achieve our goals include delivery of several water-specific goals, including replenishing the water we consume back into high water risk watersheds as well as advocating for stronger water governance. For example, in Monterrey, Mexico, we have invested in the TNC Water Fund which uses market financial mechanisms to drive improved protection of source watersheds. We have invested over $3 million in Water Funds in LATAM as well as watershed conservation projects in North America.
1-3 years
Company-wide
Other: Developing markets
The initiatives in which we are engaged with our portfolio of NGO partners provide a transformative opportunity. Our collaboration with global partners is expected to result in greater water availability where it did not previously exist, thereby providing more sustainable access to water for the community, more sustainable solutions to the global water crisis, and more sustainable access to water for our manufacturing operations. For example, the PepsiCo Foundation has partnered with several organizations to invest millions of dollars in providing access to safe water for over 11 million people in developing markets such as India.
1-3 years
Company-wide
Cost savings
Conserving water is good for our business and the environment wherever we operate. By the end of 2015, we had reduced our water use per unit of production by 25.8% since 2006 from our legacy operations, exceeding our target of a 20% reduction and delivering a cost saving of approximately
Current-up to 1 year

Country or region
Opportunity
Strategy to realize opportunity
Estimated timeframe
Comment
$19 million in 2015 as compared to a 2006 run rate.
Company-wide
Innovation
PepsiCo has an opportunity to improve the resiliency of our agricultural supply chain through better water management. From 2010 to 2016, we worked with our U.K. farmers to achieve a 50 percent reduction in agricultural carbon emissions of key growers and a reduction of 50% in water use in water-stressed areas. Furthermore, farmer yields increased as their environmental impacts decreased. We achieved this goal through investment in technology such as drip irrigation, and training farmers to use the i-cropTM water management tool and the GHG management Cool Farm Tool.
Current-up to 1 year
Company-wide
Collective Action
Our ability to achieve our goals is possible in part by collaborating with business, academic experts and NGOs. We are actively involved in the UN Global Compact’s CEO Water Mandate, the WBCSD water leadership group, the International Finance Corporation’s 2030 Water Resources Group and the Beverage Industry Environmental Roundtable. These forums allow us to learn from other companies and share our own experiences across a spectrum of industries, including food and beverage manufacturing, power generation and construction. This also enables us to discuss water-related issues and advance solutions on a pre-competitive basis.
Current-up to 1 year
W4.1b
Please choose the option that best explains why water does not present your organization with any opportunities that have the potential to provide substantive benefit
Primary reason
Please explain
W4.1c
Please choose the option that best explains why you do not know if water presents your organization with any opportunities that have the potential to provide substantive benefit

Primary reason
Please explain
Further Information
Module: Accounting
Page: W5. Facility Level Water Accounting (I)
W5.1
Water withdrawals: for the reporting year, please complete the table below with water accounting data for all facilities included in your answer to W3.2a
Facility reference
number
Country
River basin
Facility name
Total water withdrawals
(megaliters/year) at this facility
How does the total
water withdrawals
at this facility compare to
the last reporting
year?
Please explain
Facility 1 India Other: Bharathapuzha River
Palakkad 150 Much lower 25% less - Main driver for reduction was a decrease in production.
Facility 2 India Other: Kumudvathi
Nelamangala 371 Lower 4% less - Main driver for reduction was a decrease in production
Facility 3 United States of
Other: San Jacinto
Riverside ,CA 415 Much higher The increase in water usage at this plant was largely due to a 14% increase in production as

Facility reference
number
Country
River basin
Facility name
Total water withdrawals
(megaliters/year) at this facility
How does the total
water withdrawals
at this facility compare to
the last reporting
year?
Please explain
America well as a shift in product portfolio mix to higher water intensive products.
Facility 4 United States of America
Other: Los Angeles
City Of Industry, CA
345 About the same
There was no significant change in water usage at this plant during 2016.
Facility 5 United States of America
Other: San Gabriel
Buena Park,CA
182 Much lower
20% less - This site is PepsiCo’s most water efficient Beverage site. It ranks as one of the most water efficient plants in the annual benchmarking report published by the Beverage Industry Environmental Roundtable.
Facility 6 United States of America
Other: San Joaquin
Fresno, CA 333 Lower 7% less - All across our California beverage business we continue to identify and implement innovative water saving opportunities.
Facility 7 United States of America
Sacramento River - San Joaquin River
Sacromento, CA
377 About the same
All across our California beverage business we continue to identify and implement innovative water saving opportunities. This plant’s production output increased by 6% but the plant was able to offset this through efficiencies, keeping water use largely flat from prior year.
Facility 8 United States of America
Other: San Lorenzo Creek
Hayward,CA 315 About the same
There was no significant change in water usage at this plant during 2016.
Facility 9 United States of America
Other: Toulumne Oakland,CA 247 Lower Down 6% - All across our California beverage business we continue to identify and implement innovative water saving opportunities.
Facility 10 United States of America
Other: Chino Creek
Rancho Cucamonga
342 Higher
Up 16% - The main drivers for the increase.in water use were an increase in production of 6% and a shift in product portfolio in 2016 to higher water intense products.

Facility reference
number
Country
River basin
Facility name
Total water withdrawals
(megaliters/year) at this facility
How does the total
water withdrawals
at this facility compare to
the last reporting
year?
Please explain
Facility 11 United States of America
Kem Kern,CA 1650 Higher Up 12% - This snacks location is subject to shift in product portfolios which drove higher water usage in 2016.
Further Information
Page: W5. Facility Level Water Accounting (II)
W5.1a
Water withdrawals: for the reporting year, please provide withdrawal data, in megaliters per year, for the water sources used for all facilities reported in W5.1
Facility
reference number
Fresh
surface water
Brackish surface
water/seawater
Rainwater
Groundwater (renewable)
Groundwater
(non-renewable)
Produced/process
water
Municipal
water
Wastewater
from another
organization
Comment
Facility 1 0 0 0 150 0 0 0 0
We track each source of water on our enterprise wide environmental sustainability metrics

Facility
reference number
Fresh
surface water
Brackish surface
water/seawater
Rainwater
Groundwater (renewable)
Groundwater
(non-renewable)
Produced/process
water
Municipal
water
Wastewater
from another
organization
Comment
platform on a monthly basis.
Facility 2 0 0 0 371 0 0 0 0
We track each source of water on our enterprise wide environmental sustainability metrics platform on a monthly basis
Facility 3 0 0 0 0 0 0 415 0
We track each source of water on our enterprise wide environmental sustainability metrics platform on a monthly basis
Facility 4 0 0 0 0 0 0 345 0
We track each source of water on our enterprise wide environmental sustainability metrics platform on a monthly basis
Facility 5 0 0 0 0 0 0 182 0
We track each source of water on our enterprise wide environmental sustainability metrics platform on a monthly basis
Facility 6 0 0 0 0 0 0 333 0
We track each source of water on our enterprise wide environmental sustainability metrics

Facility
reference number
Fresh
surface water
Brackish surface
water/seawater
Rainwater
Groundwater (renewable)
Groundwater
(non-renewable)
Produced/process
water
Municipal
water
Wastewater
from another
organization
Comment
platform on a monthly basis
Facility 7 0 0 0 0 0 0 377 0
We track each source of water on our enterprise wide environmental sustainability metrics platform on a monthly basis
Facility 8 0 0 0 0 0 0 315 0
We track each source of water on our enterprise wide environmental sustainability metrics platform on a monthly basis
Facility 9 0 0 0 0 0 0 247 0
We track each source of water on our enterprise wide environmental sustainability metrics platform on a monthly basis
Facility 10 0 0 0 0 0 0 342 0
We track each source of water on our enterprise wide environmental sustainability metrics platform on a monthly basis
Facility 11 0 0 0 1650 0 0 0 0
We track each source of water on our enterprise wide environmental sustainability metrics

Facility
reference number
Fresh
surface water
Brackish surface
water/seawater
Rainwater
Groundwater (renewable)
Groundwater
(non-renewable)
Produced/process
water
Municipal
water
Wastewater
from another
organization
Comment
platform on a monthly basis
W5.2
Water discharge: for the reporting year, please complete the table below with water accounting data for all facilities included in your answer to W3.2a
Facility reference number
Total water discharged
(megaliters/year) at this facility
How does the total water discharged at this facility compare to the last reporting year?
Please explain
Facility 1 31 This is our first year of measurement 2016 was the first baselining year
Facility 2 193 This is our first year of measurement 2016 was the first baselining year
Facility 3 188 This is our first year of measurement 2016 was the first baselining year
Facility 4 293 This is our first year of measurement 2016 was the first baselining year
Facility 5 80 This is our first year of measurement 2016 was the first baselining year
Facility 6 156 This is our first year of measurement 2016 was the first baselining year
Facility 7 158 This is our first year of measurement 2016 was the first baselining year
Facility 8 135 This is our first year of measurement 2016 was the first baselining year
Facility 9 128 This is our first year of measurement 2016 was the first baselining year
Facility 10 294 This is our first year of measurement 2016 was the first baselining year
Facility 11 1620 This is our first year of measurement 2016 was the first baselining year
W5.2a
Water discharge: for the reporting year, please provide water discharge data, in megaliters per year, by destination for all facilities reported in W5.2

Facility reference
number
Fresh surface
water
Municipal/industrial
wastewater treatment plant
Seawater
Groundwater
Wastewater for
another organization
Comment
Facility 1 0 0 0 31 0 Single source discharge locations for all of these plants.
Facility 2 0 0 0 193 0 Single source discharge locations for all of these plants.
Facility 3 0 188 0 0 0 Single source discharge locations for all of these plants.
Facility 4 0 293 0 0 0 Single source discharge locations for all of these plants.
Facility 5 0 80 0 0 0 Single source discharge locations for all of these plants.
Facility 6 0 156 0 0 0 Single source discharge locations for all of these plants.
Facility 7 0 158 0 0 0 Single source discharge locations for all of these plants.
Facility 8 0 135 0 0 0 Single source discharge locations for all of these plants.
Facility 9 0 128 0 0 0 Single source discharge locations for all of these plants.
Facility 10 0 294 0 0 0 Single source discharge locations for all of these plants.
Facility 11 0 0 0 1620 0 Single source discharge locations for all of these plants.
W5.3
Water consumption: for the reporting year, please provide water consumption data for all facilities reported in W3.2a

Facility reference number
Consumption (megaliters/year)
How does this compare to the
last reporting year?
Please explain
Facility 1 119
Facility 2 178
Facility 3 227
Facility 4 52
Facility 5 102
Facility 6 177
Facility 7 219
Facility 8 177
Facility 9 119
Facility 10 48
Facility 11 30
W5.4
For all facilities reported in W3.2a what proportion of their water accounting data has been externally verified?
Water aspect
%
verification
What standard and methodology was used?
Water withdrawals- total volumes
76-100
Bureau Veritas conduct sampling verification based on their standard procedures and guidelines for external verification of sustainability reports. This was in accordance with the requirements of ISAE 3000 and the GRI G3.1 Reporting Framework The methodology also included: (i) review of documentary evidence provided by PepsiCo, (ii) review of information system used to collect, aggregate, analyze and internally verify environmental data, and (iii) interviews with relevant PepsiCo personnel.
Water withdrawals- volume by sources
76-100
Bureau Veritas conduct sampling verification based on their standard procedures and guidelines for external verification of sustainability reports. This was in accordance with the requirements of ISAE 3000 and the GRI G3.1 Reporting Framework The methodology also included: (i) review of documentary evidence provided by PepsiCo, (ii) review of information system used to collect, aggregate, analyze and internally verify environmental data, and (iii) interviews with relevant PepsiCo personnel.

Water aspect
%
verification
What standard and methodology was used?
Water discharges- total volumes
Not verified
Water discharges- volume by destination
Not verified
Water discharges- volume by treatment method
Not verified
Water discharge quality data- quality by standard effluent parameters
Not verified
Water consumption- total volume
Not verified
Further Information
Module: Response
Page: W6. Governance and Strategy
W6.1
Who has the highest level of direct responsibility for water within your organization and how frequently are they briefed?
Highest level of direct
responsibility for water issues
Frequency of briefings
on water issues
Comment
Board of individuals/Sub-set of the Board or other committee
Scheduled-annual
Our Board of Directors has oversight responsibility for PepsiCo’s integrated risk management framework, including risk assessment and risk mitigation of the Company’s top risks. The Board receives regular updates

Highest level of direct
responsibility for water issues
Frequency of briefings
on water issues
Comment
appointed by the Board on key risks throughout the year and has tasked designated Committees of the Board with oversight of certain categories of risk management. The Public Policy and Sustainability Committee of PepsiCo’s Board of Directors is responsible for annually reviewing the Corporation’s key public policy and sustainability issues, such as water scarcity, including sustainability initiatives, and its engagement in the public policy process. PepsiCo’s Risk Committee (PRC), including PepsiCo’s Chairman of the Board and Chief Executive Officer, meets regularly to identify, assess, prioritize and address our top strategic, operating, and business risks. The PRC is also responsible for reporting progress on our risk mitigation efforts to the Board, including with respect to water scarcity.
W6.2
Is water management integrated into your business strategy?
Yes
W6.2a
Please choose the option(s) below that best explains how water has positively influenced your business strategy
Influence of water on business
strategy
Please explain
Alignment of public policy positions with water stewardship goals
We continue to proactively manage water risk through our advocacy for comprehensive water valuation systems. We are a Governing Council and Steering Board Member of the 2030 Water Resources Group (WRG), dedicated to closing the gap between water supply and demand, which is projected to be 40% by 2030.

Influence of water on business
strategy
Please explain
Establishment of sustainability goals
In 2016, PepsiCo announced its second generation of sustainability goals, called Performance with Purpose. This platform contains 6 individual goals related to water stewardship, including goals to improve water use efficiency by 15% in direct agricultural supply at water risk, to improve water use efficiency by 25% in direct operations (on top of a 26% improvement achieved during our first generation of goals), to replenish back into the watershed 100% of water consumed in high water risk operations, and to advocate for strong governance of water resources in water insecure watersheds by 2025. These goals form an integral part of PepsiCo’s overall business strategy. One example of how these goals are already influencing business strategy is the integration of water risk assessment into PepsiCo’s growth strategy, including merger & acquisition activity. Our internal business processes have been modified to ensure that such risk assessment occurs prior to growth activity and that mitigation plans are developed to address any significant increases in water risk that result.
Exploration of water valuation practices
Our U.K. business is piloting an approach to incorporate environmental impacts into product development choices. This pilot includes an assessment of total life cycle product carbon footprints and may include total product life cycle water use in the future. At present, the pilot considers water use in manufacturing and sensitivity to and impact on water stress and water quality during the agricultural life cycle phase (for new ingredients for PepsiCo Europe that are key to the product development concept).
Introduction of water management KPIs
Each PepsiCo business unit relies on a global tool to track and report plant-level KPIs, including resource consumption, on a monthly or per-period basis.
Investment in staff/training Many of our sites are actively participating in PepsiCo’s resource conservation program, ReCon, which empowers employees to identify and deliver efficiency opportunities in site energy, water and waste.
Water resource considerations are factored into location planning for new operations
Through the water stress tools and approach outlined elsewhere in this document, plus our knowledge on the ground, we are able to identify potential areas of water stress and factor this in to potential new site locations.
Publicly demonstrated our commitment to water
Our public recognition of water as a human right includes five elements, including Affordability, Safety, Sufficiency, Physical Accessibility and Acceptability. We continue to work closely with stakeholders, including the UN Global Compact CEO Water Mandate to develop a robust Human Right to Water Impact Assessment, which should allow us to ultimately track and work to remedy challenges within all five elements.
Tighter operational performance standards
In India, we operate to higher operational performance standards for water use to help maintain our license to operate and in recognition of the severe water stress in many parts of the country.
Water management incentives established for employees
PepsiCo has a pay for performance philosophy and the annual performance rating impacts annual pay rates, including bonuses. In addition, a wide range of complementary awards recognize teams and associates for exceptional performance in sustainability, including projects that reduce water use.
Water management incentives established for senior management
Our Corporate Executive Team has strategic objectives based on an executive’s role and accountabilities aligned with Performance with Purpose, which is our goal to deliver top-tier financial performance while creating sustainable growth in shareholder value. Performance against these objectives impacts a portion of both annual and long-term incentives.

W6.2b
Please choose the option(s) below that best explains how water has negatively influenced your business strategy
Influence of
water on business strategy
Please explain
Closure of operations
We have experienced situations where lack of water availability and the resulting environmental, social and financial impacts have outweighed the business benefit of keeping a manufacturing site open and have, therefore, closed the plant. For example, in India, negative public perception of PepsiCo water use has resulted in temporary plant closures as well as restricted usage allocations. Our Performance with Purpose sustainability strategy, announced by PepsiCo in 2016, is intended to reduce the risk and business impact of these situations.
Increased capital expenditure
Increasing water scarcity has resulted in accelerated expenditure in water savings technology at some impacted manufacturing sites. For example, in 2016, we installed wastewater treatment technology at a plant in India that is aimed at achieving ‘zero-liquid discharge’ where we are maximizing the treatment and reuse of wastewater discharges in order to minimize the amount of water withdrawn from local water sources.
W6.2c
Please choose the option that best explains why your organization does not integrate water management into its business strategy and discuss any future plans to do so
Primary reason
Please explain
W6.3
Does your organization have a water policy that sets out clear goals and guidelines for action?

Yes
W6.3a
Please select the content that best describes your water policy (tick all that apply)
Content
Please explain why this content is included
Publicly available Company-wide Performance standards for direct operations Performance standards for supplier, procurement and contracting best practice Acknowledges the human right to water, sanitation and hygiene Other: Incorporated within group environmental, sustainabiilty or EHS policy
PepsiCo is reliant on water in our products, our supply chain and in the communities of which we are a part. The sustained crisis of global water insecurity and the closely interlinked crises of food, climate and health insecurity have been increasing in awareness by diverse stakeholders, including influencers, investors, customers, academics, employees and consumers. With awareness of these global realities comes increased visibility of corporate practices and heightened expectations of performance. PepsiCo continues to activate a robust, comprehensive water-stewardship strategy, underpinned by our public commitment to respect water as a human right, based on five key imperatives: Improving water efficiency in our direct operations; Extending conservation to our supply chain, particularly agriculture; Pursuing integrated watershed management; Partnering to help provide community access to safe water; and Stewarding public water advocacy and engagement. In addition, we continue to partner externally to seek innovative solutions to the challenges we face, and also explore competitive opportunities through our products and business models to use and transport less water.
W6.4
How does your organization's water-related capital expenditure (CAPEX) and operating expenditure (OPEX) during the most recent reporting year compare to the previous reporting year?

Water CAPEX (+/- % change)
Water OPEX (+/- % change)
Motivation for these changes
0 0 In 2016, we continued to invest in water efficiency measures at an equivalent level to that of prior year.
Further Information
Page: W7. Compliance
W7.1
Was your organization subject to any penalties, fines and/or enforcement orders for breaches of abstraction licenses, discharge consents or other water and wastewater related regulations in the reporting year?
Yes, not significant
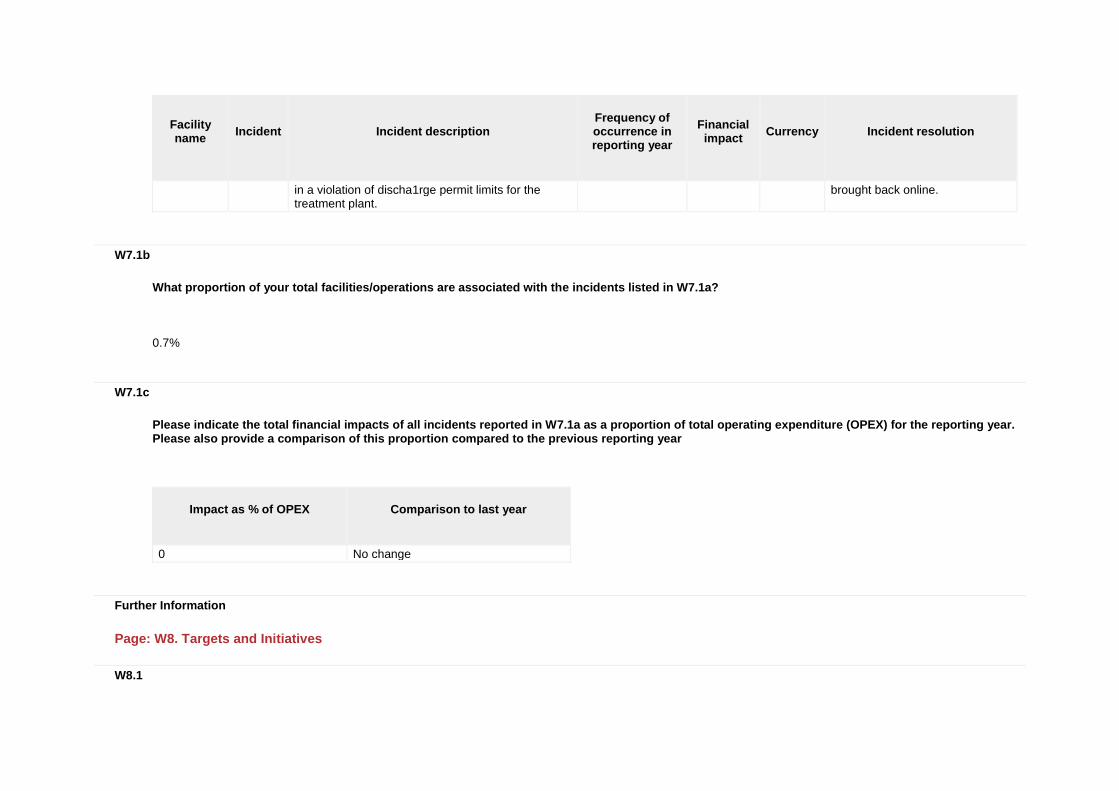
W7.1a
Please describe the penalties, fines and/or enforcement orders for breaches of abstraction licenses, discharge consents or other water and wastewater related regulations and your plans for resolving them
Facility name
Incident
Incident description
Frequency of occurrence in reporting year
Financial
impact
Currency
Incident resolution
Soroksar, Hungary
Fine Fine imposed for a wastewater exceedance that occurred at our Soraksar, Hungary site in 2013
0 51000 USD($) This site was decommissioned as a manufacturing site in 2014.
Rayong Fine Internal glycol spill within the site resulted in a shut-down of site wastewater treatment facility, resulting
1 92410 USD($) Incident was remediated and wastewater treatment plant was
Facility name
Incident
Incident description
Frequency of occurrence in reporting year
Financial
impact
Currency
Incident resolution
in a violation of discha1rge permit limits for the treatment plant.
brought back online.
W7.1b
What proportion of your total facilities/operations are associated with the incidents listed in W7.1a?
0.7%
W7.1c
Please indicate the total financial impacts of all incidents reported in W7.1a as a proportion of total operating expenditure (OPEX) for the reporting year. Please also provide a comparison of this proportion compared to the previous reporting year
Impact as % of OPEX
Comparison to last year
0 No change
Further Information
Page: W8. Targets and Initiatives
W8.1

Do you have any company wide targets (quantitative) or goals (qualitative) related to water?
Yes, targets and goals
W8.1a
Please complete the following table with information on company wide quantitative targets (ongoing or reached completion during the reporting period) and an indication of progress made
Category of target
Motivation
Description of target
Quantitative unit of
measurement
Base-line year
Target year
Proportion of target
achieved, % value
Reduction of product water intensity
Water stewardship
Goal: Build on the 25% improvement in water-use efficiency achieved to date with an additional 25% improvement by 2025, with a focus on manufacturing operations in high-water-risk areas. In 2016, we achieved an improvement of 1.4% across our all of our company-owned manufacturing locations. Although this improvement builds on the work that we have been focused on for the last decade, in which we improved water use efficiency per unit of production by 25.8% against a baseline of 2006 in our legacy operations, it falls short of our desired glide path for 2025 goal delivery. As a result, we have increased our efforts to get back onto glide path in this area.
% reduction per unit of production
2015 2025 5.6%
Other: 100% water replenishment in high water risk operations
Shared value
Goal: Replenish 100% of the water we consume in manufacturing operations located in high-water-risk areas, ensuring that such replenishment takes place in the same watershed where the extraction has occurred. We are achieving this goal by investing in projects in high-risk watersheds that improve the quantity and/or quality of the water. These include
Other: liters of water benefits from replenishment projects
2015 2025 55%

Category of target
Motivation
Description of target
Quantitative unit of
measurement
Base-line year
Target year
Proportion of target
achieved, % value
watershed protection projects like reforestation, wetlands rehabilitation, and aquifer recharge. We also are focused on projects that enable water for productive use, such as rainwater harvesting, dam rehabilitation, and seasonal water storage. Our Replenishment goal is focused specifically on high-water risk areas where we operate, where the need is greatest. In 2015 and 2016, we replenished over 5 Billion liters of water, focused in this first year of our target delivery period in projects in India, Jordan, and the United States. In India and Jordan, completed projects have over-delivered on the local markets' Replenishment targets, reflecting strong local programs to reduce community water insecurity that have been in place for several years, pre-dating the launch of our global Replenishment goal. Globally, we are 55% of the way to our 2025 target of replenishing 100% of water consumed annually in high risk watersheds. While this is strong progress, it reflects activity in a limited number of watersheds, thus our focus this year is on expanding Replenishment activity to more high risk watersheds across multiple countries.
Increased access to water, sanitation and hygiene
Shared value
Goal: With the PepsiCo Foundation and its partners, work to provide access to safe water to a total of 25 million people since 2006 in the world’s most at-water-risk areas, with a focus on communities near where PepsiCo works. Increasing access to safe water for vulnerable individuals is one of the most urgent challenges the world faces. From the early days of Performance with Purpose, addressing this challenge has been a priority for PepsiCo. Since 2006, through partnerships funded by the PepsiCo Foundation, we have provided access to safe water to 11.4 million people by the end of 2016.
Other: # of people provided with access to safe water
2006 2025 46%
Increased access to Recommended Goal: Ensure appropriate access to safe water, Other: % of mfg. 2015 2025 89%

Category of target
Motivation
Description of target
Quantitative unit of
measurement
Base-line year
Target year
Proportion of target
achieved, % value
water, sanitation and hygiene
sector best practice sanitation and hygiene (WASH) for 100% of our own manufacturing employees. Our business depends on the thousands of dedicated employees in our manufacturing sites who ensure the safety and quality of our products, and we in turn, are committed to providing safe conditions for them. Critical to this is the provision of access to WASH.
operations conforming to PepsiCo Tier 1 criteria for access to safe water, sanitation and hygiene
Other: 15% improvement in agricultural water efficiency in high water risk areas
Other: PepsiCo Performance with Purpose Positive Water Impact Goals
Goal: Improve the water-use efficiency of our direct agricultural supply chain by 15% in high-water-risk sourcing areas, a volume approximately equivalent to the entire water use of all PepsiCo direct operations. As a company that depends on agricultural commodities for our products, we place great importance on operating sustainably on the farm level. For several years, PepsiCo has been working with growers through our global Sustainable Farming Initiative, and through local partnerships, like our 50 in 5 program in the UK, to drive efficiency in fields around the world. We anticipate making progress on this goal in a number of ways. We are supplying farmers with more efficient irrigation equipment, enabling them to move from flood to drip irrigation. This conversion in turn, changes the way farmers apply nutrients, improving soil health, yields and crop quality. We are also increasingly promoting the use of cover crops, which improves soil moisture.
Other: % improvement (liters of water applied per kg of crop produced)
2015 2025 0%
W8.1b
Please describe any company wide qualitative goals (ongoing or reached completion during the reporting period) and your progress in achieving these

Goal
Motivation
Description of goal
Progress
Engagement with public policy makers to advance sustainable water policies and management
Recommended sector best practice
While we know we can make a significant impact in water stewardship through the actions we take across our value chain, we also have opportunities to help mitigate water insecurity on a broader level, through advocacy. For PepsiCo, this means initiating and supporting collaborative efforts to address water risk and mitigate water insecurity.
We have several examples of progress in the area of advocacy during 2016, including: a collaborative effort taking place across 12 countries in Latin America, through a partnership between PepsiCo, the PepsiCo Foundation and the Inter-American Development Bank. Enabled by a $5 million grant from the PepsiCo Foundation, we are working together to launch a regional center for applied water resources management through the Hydro-BID program, an innovative data management and modeling tool that estimates the availability of freshwater in water-scarce regions, giving municipalities the ability to better govern water resources. The tool was piloted in Brazil and Peru from 2014-2016, and in Peru alone, 40 National Water Association experts applied Hydro-BID to 65% of the country’s water basins, including the Atlantic, Pacific and Titicaca water bodies. Programs like these work because they are rooted in deep understanding of the needs of local communities, and executed in partnership with local partners. In addition, PepsiCo is represented on the Governing Council of the 2030 Water Resources Group, a public-private collaboration hosted by the IFC that convenes multi-stakeholder platforms to improve the management of water resources in 11 countries around the world, including India, Mexico, and South Africa.
W8.1c
Please explain why you do not have any water-related targets or goals and discuss any plans to develop these in the future
Further Information

Module: Linkages/Tradeoff
Page: W9. Managing trade-offs between water and other environmental issues
W9.1
Has your organization identified any linkages or trade-offs between water and other environmental issues in its value chain?
Yes
W9.1a
Please describe the linkages or trade-offs and the related management policy or action
Environmental
issues
Linkage
or trade-
off
Policy or action
Climate Change Linkage
By 2030, it is expected that we will need to meet rising demand for the amount of food consumed, either by increasing production by 50% or substantially reducing the 35% to 50% of food that is currently wasted or lost through the value chain. At the same time, a 40% gap in supply and demand for water and a 54% increase in energy needs are projected to develop on current trends. If we follow business as usual, GHG emissions are expected to increase significantly. Managing the interrelationship between agriculture, climate change, energy and water in terms of both adaptation and mitigation will be crucial for food and beverage businesses seeking long-term, sustainable growth. Our strategy for managing these trade-offs includes both mitigation activities and adaptation activities as follows: a) mitigation activities - we have an industry-leading goal to reduce absolute GHG emissions from across our value chain, including from agriculture, by at least 20% by 2030 – this is an absolute goal which means it takes into account expected business growth and will mitigate our contribution to climate change in line with science-based recommendations; b) adaptation activities – recognizing that climate change is already occurring and the impacts are already being felt, particularly in our agricultural supply chain, we are pursuing adaptation strategies, such as developing drought-resistant potato varieties and transforming our product portfolio to less water intensive materials.
Health and Linkage According to the United Nations, every day nearly 800 million people lack access to safe water and more than two billion people

Environmental
issues
Linkage
or trade-
off
Policy or action
wellness live without basic sanitation. In 2016, PepsiCo announced an increase in its public commitment to provide access to safe water, committing to provide safe water access to 25 million people by 2025 (from a 2006 baseline). In addition to providing safe water access, our investments also result in a significant improvement in the health, wealth and well-being of our beneficiaries. For example, our projects reduce the time required for beneficiaries, often women and girls, to obtain safe water for daily uses.
Further Information
Module: Sign Off
Page: Sign Off
W10.1
Please provide the following information for the person that has signed off (approved) your CDP water response
Name
Job title
Corresponding job category
Brian Newman Executive Vice President, Global Operations Chief Operating Officer (COO)
W10.2
Please indicate that your organization agrees for CDP to transfer your publicly disclosed data regarding your response strategies to the CEO Water Mandate Water Action Hub.
Note: Only your responses to W1.4a (response to impacts) and W3.2c&d (response to risks) will be shared and then reviewed as a potential collective action project for inclusion on the WAH website.

By selecting Yes, you agree that CDP may also share the email address of your registered CDP user with the CEO Water Mandate. This will allow the Hub administrator to alert your company if its response data includes a project of potential interest to other parties using water resources in the geographies in which you operate. The Hub will publish the project with the associated contact details. Your company will be provided with a secure log-in allowing it to amend the project profile and contact details.
Yes
Further Information
CDP