Embed Size (px)
Citation preview

Wafa Aboul HosnTeam Leader , Statistics Division
Data for AllSession 6.4.2
Frameworks and approaches: Regional
Session 5th World Water Forum 20 March 2009
Economic and Social Commission for West Asia
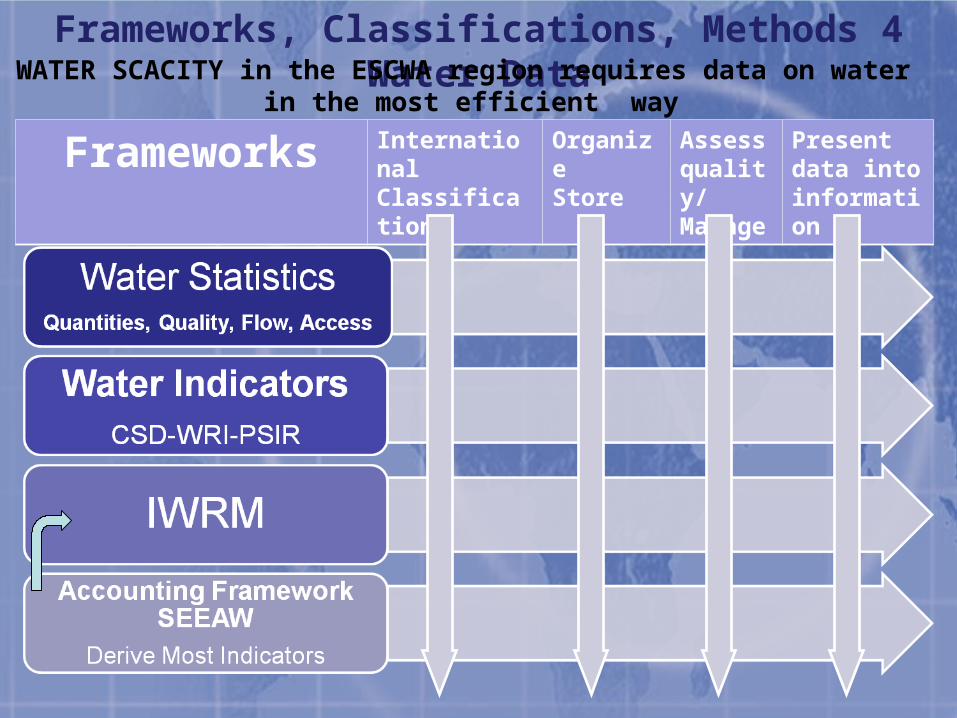
Frameworks, Classifications, Methods 4 Water Data
Frameworks InternationalClassification
OrganizeStore
Assess quality/Manage
Present data into information
WATER SCACITY in the ESCWA region requires data on water in the most efficient way

Subregion2Arabian Peninsula
Jordan, Palestine (about 200 m3/yr/capita)
Subregion1 Egypt, Iraq, Lebanon ,
Syria, Sudan
Pilot Water Accounts Egypt, Lebanon 1st Step
Pilot Water AccountsJordan, Oman,
Bahrain, Palestine
SEEA-W for ESCWA countries
A STEP FORWARD!
Surface WaterShared Water Resources
Hard to Measure Water Assets Water UseWater Supply
Economics of Water: CostSubsidies, Taxes
Social Problems
Limited Surface WaterGround Water
(Fresh vs. Brackish)(Fossil vs. Renewable)
(Desalination)
Water AssetsEstimation groundwater,
and rechargeWater Use
Water Supply
Economics of Water: Cost, Subsidies, Taxes
Market values

AgricultureISIC 01
Sewerage TreatmentISIC 37
Losses 1
Domestic
5
50
21
148.5
120.5
Ground water
12880
49.5
Water Supply IndustryISIC 36
7
5
7Losses .5Losses 28
4
Industrial
5-3341-43
Desalination plant
104.5104
Example BAHRAIN 2005Abdulla Ali,
Authority of Electricity and WaterFrom Tables to Diagrams
Presented in Beirut August 2008
Losses .5
Treated Water
ϪΠϟΎόϣϩΎϴϣ
ϲϋΎ
Ϩλ
ϲϋ
έί
ϲϟΰ
Ϩϣ
ωϮϤΠ
Ϥϟ
ϲϋΎ
Ϩλ
ϲϋ
έί
ϲϟΰ
Ϩϣ
ϲϋ
έί
To
talω
ϮϤΠϤ
ϟ
ϲϋΎ
Ϩλ
ϲϋ
έί
ϲϟΰ
Ϩϣ
ωϮϤΠ
Ϥϟ
ϲϋΎ
Ϩλ
ϲϋ
έί
ϲϟΰ
Ϩϣ
ϙϼϬΘ
γϻϲ
ϣϮϴϟ
ςγϮΘ
Ϥϟ
L/D
ΔϴϣΩ
ϻν
ήϼϟ
Ωήϔϟ
Ϗ
X 1
000ϥ
ΎϜδ
ϟΩΪϋ
ΔϨδ
ϟ
IM
DU
ST
RIA
L
AG
RIC
UL
TU
RE
DO
ME
ST
IC
T
OT
AL
IM
DU
ST
RIA
L
AG
RIC
UL
TU
RE
DO
ME
ST
IC
AG
RIC
UL
TU
RE
T
OT
AL
IM
DU
ST
RIA
L
AG
RIC
UL
TU
RE
DO
ME
ST
IC
T
OT
AL
IM
DU
ST
RIA
L
AG
RIC
UL
TU
RE
DO
ME
ST
IC
Mea
n D
om
esti
c U
se p
er C
apit
a
Po
pu
lati
on
*100
0
YE
AR
4 52 44 192 7 100 85 0 43 1.9 0.4 41.0 149 5 100 44 573 383 19854 53 43 207 8 109 90 0 50 2.2 0.5 47.4 157 5 109 42 596 391 19863 53 43 220 8 118 95 0 44 2.0 0.4 42.2 176 6 117 53 617 400 19874 51 46 217 8 110 99 2 49 2.2 0.5 47.0 166 6 108 52 634 408 19883 51 46 230 8 117 105 2 49 2.2 0.5 46.4 178 6 114 58 656 417 19893 53 44 243 8 128 107 4 54 2.4 0.5 51.7 184 6 123 55 658 426 19903 53 44 241 8 128 105 6 56 2.5 0.6 53.5 178 5 121 51 631 436 19913 55 42 262 8 144 109 8 62 2.8 0.6 59.1 192 6 136 50 636 454 19923 54 43 273 9 148 116 8 58 2.6 0.6 55.7 205 6 139 60 648 472 19933 57 40 287 9 163 115 11 60 2.7 0.6 57.1 215 6 151 58 617 491 19943 59 38 292 9 171 112 12 53 2.4 0.5 50.1 227 7 159 62 574 511 19953 60 37 307 10 183 114 13 59 2.7 0.6 56.7 233 7 169 57 564 532 19963 60 37 318 10 192 116 13 58 2.6 0.6 55.2 247 7 178 61 552 554 19973 60 37 322 10 193 119 12 60 2.7 0.6 57.3 250 8 181 62 544 577 19983 59 38 315 9 185 121 14 61 2.8 0.6 58.5 239 6 170 62 532 600 19993 56 41 315 10 175 130 15 81 3.7 0.8 77.6 219 6 160 53 556 625 20003 51 46 301 9 154 138 15 90 4.1 0.9 86.0 195 5 137 52 570 651 20013 51 46 309 9 158 141 16 91 4.1 0.9 87.3 201 5 142 54 559 677 2002
3 50 47 314 9 156 149 19 99 4.4 1.0 94.1 195 5 136 54 567 705 2003
3 48 49 322 10 156 156 19 106 4.8 1.1 100.9 190 5 130 55 575 734 2004
3 48 49 329 10 158 161 21 110 4.9 1.1 104.6 190 5 128 57 572 764 2005
Mean Annual Water Consumption for All Uses (million cubic meters)ΐ όϜϣήΘϣϥϮϴϠϤϟΎΑΕΎϣ ΪΨΘγϻϊ ϴϤΠϟϩΎϴϤϠϟϱϮϨδϟ ϙϼϬΘγϻ
ϡΪΨΘγϻΐ δϧ ϲϠϜϟωϮϤΠϤϟ ΔϴϠΤΗϩΎϴϣ ΔϴϓϮΟϩΎϴϣ% use
Grand total Desalinated Water GroundWater
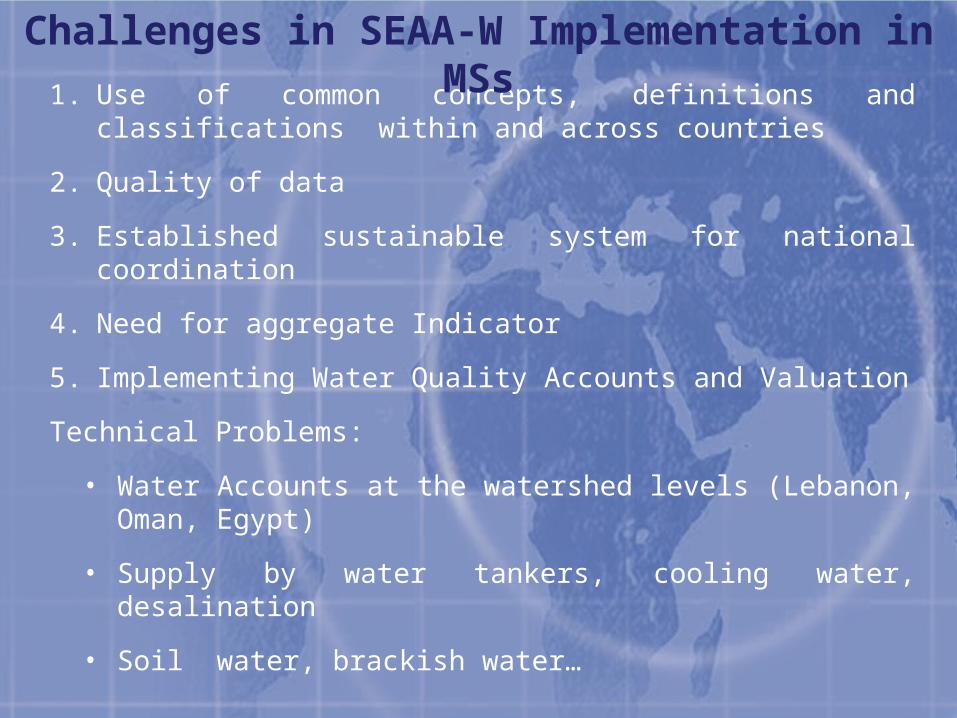
1. Use of common concepts, definitions and classifications within and across countries
2. Quality of data
3. Established sustainable system for national coordination
4. Need for aggregate Indicator
5. Implementing Water Quality Accounts and Valuation
Technical Problems:
• Water Accounts at the watershed levels (Lebanon, Oman, Egypt)
• Supply by water tankers, cooling water, desalination
• Soil water, brackish water…
Challenges in SEAA-W Implementation in MSs

• Sharing Water Data (UNSD-UNEP Questionnaire)
• Verifying and checking data, contacting and following-up with countries fro clarifications and corrections
• Conducting joint trainings and missions on Water Accounts (training material, bilingual, coordinated assistance)
• Adding countries concerns and comments in manuals and recommendations
• Web Portal on Environmental Accounting for ESCWA Countries Network, docubase and forum ESIAP.escwa.org.lb
• Sharing lessons learned with other regions (ECLAC)
Role of OrganizationsESCWA, UNSD,UNEP,MEDSTAT

Opportunities in SEEAW for ESCWA MSsWHAT WAS ACCOMPLISHED UNTIL NOW!
1. Countries can use available data and put it into the system allowing gaps to be identified and addressed.
2. Improved data quality by cross- checking the different standard tables
3. Strengthening coordination among national statistical offices and water and environment ministries
4. SEEA-W as agent in creation of regional networks………………………………………………………………..……..LONGER TERM APPLICATIONS!
1. Integrating information for water policy and management
2. Link to economic information through SNA3. Flexibility and expansion to accommodate regional needs
(i.e. inclusion of tourism industry, separate identification of oil industries etc)


![The World’s Leading [Game-Changing] Leadership, Talent ...worldwide.streamer.espeakers.com/assets/0/19960/115478.pdf · Head of Training, Al Hosn Gas, Abu Dhabi, UAE . ... roadblocks](https://img.pdfslide.net/doc/110x75/5f216ee5583c0d65c9207b5e/the-worldas-leading-game-changing-leadership-talent-head-of-training-al.jpg)