Embed Size (px)
Citation preview

1

2
thread supported research for this publication. We appreciate Panu Lucier and
Stephanie Berglund, who provided valuable insight and perspectives throughout the
research process.
We appreciate the early childhood and school-age educators who participated in our
online survey and in-depth interviews and allowed us into their lives. We would like to
thank also the SEED Steering Committee, who participated in the leadership survey,
focus group, and interviews to help us understand the landscape of Alaska’s early care
and education workforce.
We would like to thank research assistants—Sooyeon Byun, Victoria Chang, Georgia
Gaertner, Tali Lesser, and Xiangyu Zhao—who contributed to this report. Finally, we
acknowledge the contributions and support of our colleagues at the Johns Hopkins
University IDEALS Institute, Chris Swanson, Alan Guttman, Jon Farley, and Deb Shuey.
The content is solely the responsibility of the authors and does not necessarily represent
the views of thread.
For specific inquiries, please contact:
Lieny Jeon, Ph.D., [email protected]; Johns Hopkins University
Suggested Citation: Jeon, L., Alexander, C., Hur, E., Ardeleanu, K., Schock, N. & Swanson,
C. (2019). Wage and Compensation Model for Alaska’s Early Care and Education. IDEALS
Institute, Johns Hopkins University School of Education, Baltimore, MD.

3
Executive Summary
Chapter 1. National Landscape Review
This chapter synthesizes information from multiple sources, including previous literature and
national and state reports. The chapter aims to inform the development of an early childhood
(EC) educator wage compensation model for Alaska.
Session 1 summarizes existing research on compensation. Research consistently reports that
wages for EC educators are lower than those for other occupations requiring similar levels of
education. Many EC educators experience financial difficulties, which may increase turnover,
which compromises the consistency and quality of care for children. Low wages also discourage
EC educators to advance their education and training, deterring the professional development
of the EC workforce. In addition, EC educators rarely receive personal benefit packages (e.g.,
health insurance), although they are more likely to receive professional benefits (e.g., paid
vacation days).
Session 2 reviews policies and practices across states and sectors. Many states are closing the
gap between wage and compensation between EC educators and K–12 teachers in public
schools. Similar efforts are present in Head Start, public pre-K programs, and Department of
Defense.
Session 3 reviews current compensation strategies. Louisiana School Readiness Tax Credits
provides tax credits for EC educators based on credential level attained and to programs based
on Quality Rating and Improvement System (QRIS) rating. The Child Care WAGE$ is a wage
supplement for EC educators earning an hourly wage below a threshold and is implemented in
five states. Twenty-one states use the Teacher Education and Compensation Helps (T.E.A.C.H.)
program, which provides supports for EC educators to receive college education and bonuses
and/or raises after completion. Several states incorporate wage components into QRIS. For
example, Massachusetts requires level 2 programs to provide a description of policies
supporting teacher retention and requires Level 4 programs to offer a benefits package.
The Compensation and Wage Augmentation Grants for Economic Success, or C-WAGES,
provides tiered incentives (e.g., salary increase and benefits) to EC educators working with
children from low-income families or programs that are in neighborhoods with a high
percentage of children receiving subsidies. Finally, Pay for Success, or a Social Impact Bond, is
an innovative public-private funding mechanism. For example, in Utah, private investors funded
an EC initiative up-front, absorbing the risk, and then the government paid them back when
they reached their targets. Overall, these strategies showed success in teacher retention and

4
improving educational attainment and training, as well as increasing the number of low-income
children attending higher quality programs.
Session 4 summarizes common trends found in this report, key takeaways, and next steps for
developing an Alaskan compensation model. EC educators experience considerable financial
challenges and wage disparity, which leads to high levels of turnover. A potential solution is to
incorporate compensation models into professional development systems and/or QRIS. An
increasing number of states are implementing policies to impact salaries as well as personal and
professional benefits.
Chapter 2. Research Findings
This chapter reports findings from studies conducted in Alaska in 2019. The chapter aims to
understand Alaska’s current early care and education landscape; the impacts, barriers, and
benefits of current wage and compensation practices in Alaska; and early childhood educators’
attitudes towards wage and compensation.
Session 1 provides the results from the Early Childhood and School-Age Educators Wage and
Compensation Survey conducted in May 2019 to July 2019 with 288 early childhood (EC) and
school-age (SA) educators. Most of the respondents were female, Caucasian, working full-time,
and about half of them had a bachelor’s degree or higher. About 30% of the respondents were
directors/administrators and about 20% of the respondents were lead teachers. About 90% of
the respondents reported that they received professional development (PD) activities during the
current school year, but about 36% did not receive compensation for PD.
The results showed that although the participants were, on average, paid relatively high wages
($18/hour), the data were skewed upward because of a high proportion of administrators and
specialists. Lead teachers were paid an hourly wage of about $14/hour. Over half of the
participants said that their wage was insufficient for living expenses. About half of the
participants said that they intended to leave their current jobs within five years, citing low pay
and lack of benefits as primary reasons. Participants’ wage increased with years of experience
($1–$3/hour increase for every five years of experience) and educational attainment.
Disparities in wage and compensation also existed. Assistant teachers received the lowest wage
(on average $13.30/hour compared to $27.30/hour for supervisors) and the fewest benefits. Not
surprisingly, more than half of assistant teachers (65%) were planning to leave their current
position although they were intrinsically motivated to work in the EC education field.
Participants who said that they were planning to leave had a slightly lower average salary and
5
reported receiving fewer benefits than those who were planning to stay. The participants ranked
higher salary, full-time status, and job stability as the most important factors.
Session 2 summarizes the results from in-depth interviews with EC and SA educators (N = 12, six
directors and six teachers). The interview results corroborated survey results, indicating that
teachers are underpaid, lack benefits, and feel undervalued, and that this leads to high levels of
turnover. Participants were unaware of the benefits and support from SEED and Learn & Grow,
and most of the participants were paying for their own PD. Participants showed preference to
include both education and experience in the wage and compensation system. Among the
compensation strategies, participants liked T.E.A.C.H. and C-Wages most.
We asked the directors/administrators particularly about hiring support they would like, and
participants cited support with finding qualified candidates/substitutes, background checks, and
providing orientation. Directors/administrators also said that frequent changes in state policies
were difficult to keep up with regarding teacher qualifications and PD.
Session 3 describes the results from the SEED Steering Committee leadership survey (N = 16), a
focus group (N = 3), and interviews (N = 2) conducted in August 2019. Overall, the leadership
survey results were similar to the Alaska EC and SA Educators Wage and Compensation Survey.
Participants ranked higher salary, health insurance, and full-time status as their organization’s
compensation priorities. The majority of the participants strongly agreed or agreed that both
education and experience should be structured in the pay scale for EC and SA educators. They
also provided suggestions for the wage and compensation system, SEED, and Learn & Grow,
which echoed the opinions provided in the Alaska EC and SA Educators Wage and
Compensation Survey. We particularly asked the leadership participants about perceived
challenges to policy change and potential solutions. Participants mentioned limited funding and
lack of public understanding of the importance of EC education. Potential solutions included
increased communication and marketing efforts to improve public understanding of EC
education.
Session 4 provides the results from a survey responded by state/agency and advocacy/think-
tank leaders participating in the Johns Hopkins System-Level Shared Services Community of
Practice (N = 11) conducted in September 2019. The participants were from California (3),
Colorado (2), Pennsylvania (2), Florida (1), Idaho (1), Massachusetts (1) and Wisconsin (1).
Participants’ states funded professional activities such as college course tuition, workshop or
training fees, and conference registration fees. Types of state QRIS incentives included bonus or
salary increase, tiered reimbursement or incentive system based on the program’s QRIS level,
incentives for teacher PD, and tax credits. Child Care Development Block Grant was most
frequently cited as the source of funding for QRIS PD and incentives.

6
Chapter 3. Recommendations - Wage and Compensation Model for Alaska
The investigation in Chapter 1 and 2 concluded with recommendations based on wage and
compensation research and feedback from a representative cross-section of stakeholders in the
Alaska early care and education (ECE) workforce. In addition, we conducted another round of in-
depth interviews with eight EC educators to assess our recommendations.
Based on the evidence from multi-faceted research, we present “C3 Alaska: Alaska’s Commitment
to Compensation and Competency”. The C3 Alaska model is designed to help the Alaska ECE
field meet the goals of (1) improving EC educators’ compensation by closing the gap between
ECE and K–3 education and improving equity within the ECE field; and (2) strengthening the
competency of ECE educators. We expect that achieving these goals will fundamentally help
motivate educators to improve the quality of their practice and remain in the field with the
support and commitment of Alaska’s broader community of policy makers, business leaders, and
for-profit and non-profit organizations and agencies. Within that framework, we recommend:
Alaska sets a goal of accomplishing K–3 parity in minimum wage by 2025.
Alaska encourages ECE programs to (a) establish their own pay scale that reflects
experience and education, (b) provide transparent information for educators, and (c)
provide valid data for leadership.
Alaska rewards EC educators’ tenure and competency.
Alaska convenes a multi-sector taskforce to examine impact, barriers, and benefits of
promoting more staff to full-time status.
Alaska supports ECE programs to develop, deliver, and document benefit packages for
educators. Long-term, we recommend exploring partnerships to provide universal health
insurance options and retirement plans.
Alaska seeks ways to address EC educators’ living expenses needs through innovative
partnerships with public and private sectors.
Alaska addresses wage and compensation issues of the broader ECE community,
including assistant teachers.
Further examination of specific professional development needs related to content and
delivery mechanisms for Alaskan EC educators.
Improvement of the SEED Registry to provide seamless support for EC educators and to
increase their participation.
Exploration and consideration of the unique needs of the broader ECE community,
including family child care providers, in Alaska.
Alaska implements entry and exit surveys to better understand EC educators’ job
attitudes and turnover intention
Alaska explores the possibility of providing a recruitment platform through the SEED
Registry.

7
Table of Contents
Executive Summary ............................................................................................................................3
Chapter 1. National Landscape Review ............................................................................................. 11
Introduction .................................................................................................................................... 11
1. A Review of Research on Compensation ....................................................................................... 12
Background ............................................................................................................................................. 12
The Impact of Low Wages ....................................................................................................................... 13
Teacher Turnover: Other Factors to Consider ........................................................................................ 14
Benefits ................................................................................................................................................... 15
Disparities in Compensation and Benefits .............................................................................................. 16
Cash Incentives ....................................................................................................................................... 16
2. A Review of Current Policies and Practices .................................................................................... 16
A State-level Scan of Early Childhood Workforce Policies ...................................................................... 16
Efforts to Reduce Disparities in Salary: Requirement for Wage Parity ................................................... 19
Department of Defense Compensation Practices .................................................................................. 20
Head Start Compensation Practices ....................................................................................................... 21
Public Pre-Kindergarten Compensation Practices .................................................................................. 22
3. A Review of Currently Available Compensation Strategies ............................................................. 23
Louisiana School Readiness Tax Credits .................................................................................................. 23
Child Care WAGE$ ................................................................................................................................... 24
T.E.A.C.H. ................................................................................................................................................. 26
Wage Components within a Quality Rating and Improvement System ................................................. 28
Minimum Wage Requirement ................................................................................................................ 28
C-WAGES ................................................................................................................................................. 29
Pay for Success ........................................................................................................................................ 29
Summary ................................................................................................................................................. 30
4. Common Trends, Key Takeaways, and Next Steps ......................................................................... 31
Common Trends and Key Takeaways from Research of Current Compensation Models ...................... 31
Next Steps: .............................................................................................................................................. 33
Chapter 2. Research Findings ............................................................................................................ 35
Introduction .................................................................................................................................... 35
1. Alaska Early Childhood and School-Age Educators Wage and Compensation Survey ....................... 36

8
Study Method ......................................................................................................................................... 36
Participants’ Demographics .................................................................................................................... 36
About Employment, Wage, and Benefits ................................................................................................ 40
Professional Motivation and Commitment ............................................................................................ 53
Educational Background and Experience in the Field ............................................................................. 62
Perceptions of Compensation and Benefits ........................................................................................... 68
Program Operation ................................................................................................................................. 76
Program and Classroom Characteristics ................................................................................................. 80
SEED Registry and Learn & Grow ............................................................................................................ 85
Thoughts and Opinions of Compensation .............................................................................................. 95
2. Educators In-Depth Interviews .................................................................................................... 104
Study Method ....................................................................................................................................... 104
Descriptive Summary of Interview and Participants ............................................................................ 104
Feedback on thread, SEED, and Learn & Grow ..................................................................................... 104
Program Support (Teachers) ................................................................................................................. 105
Compensation System Examples .......................................................................................................... 106
Wage System......................................................................................................................................... 107
Hiring Support (Administrators/Directors) ........................................................................................... 107
Program Policy (Administrators/Directors) .......................................................................................... 108
3. Leadership Survey, Focus Group, and Interviews ......................................................................... 109
Study Method ....................................................................................................................................... 109
Participants’ Characteristics .................................................................................................................. 109
Wage and Compensation Priorities ...................................................................................................... 111
Priorities in Pay Structure ..................................................................................................................... 113
One Thing to Change in the Current Compensation Model ................................................................. 114
Skills and Qualifications Required for ECE Workforce .......................................................................... 115
Perceptions of Ongoing State Resources .............................................................................................. 116
Perceptions of Barriers to Change ........................................................................................................ 118
Final Suggestions ................................................................................................................................... 118
4. Johns Hopkins System-Level Shared Services Community of Practice ........................................... 119
Study Method ....................................................................................................................................... 119
State QRIS Funding for Professional Development .............................................................................. 119
State Workforce Registry Funding for Professional Development ....................................................... 120

9
Chapter 3. Recommendations – Wage and Compensation Model for Alaska .................................... 123
Background: Research-Based and Feedback-Informed Recommendations ....................................... 123
C3 Alaska: Alaska’s Commitment to Compensation and Competency ............................................... 124
Recommendations 1. Commitment to Compensation ..................................................................... 125
1A. ECE and K–3 Minimum Wage Parity ............................................................................................... 125
1B. Fair and Transparent Pay Scale ....................................................................................................... 128
1C. Tenure and Competency Recognition ............................................................................................ 129
1D. Full-Time Status .............................................................................................................................. 132
1E. Benefits ........................................................................................................................................... 134
1F. Support of Living Expenses.............................................................................................................. 137
1G. Broader ECE Community ................................................................................................................ 138
Recommendations 2. Commitment to Competency ........................................................................ 140
2A. Professional Development .............................................................................................................. 140
2B. Workforce Registry ......................................................................................................................... 143
2D. Mental Health and Leadership Support ......................................................................................... 145
2E. Retention and Turnover .................................................................................................................. 146
Summary of Recommended Implementation Strategies .................................................................. 147
1. Learn & Grow Workforce Standards ................................................................................................. 147
2. SEED .................................................................................................................................................. 148
3. Overview of Recommendations ........................................................................................................ 151
Appendix 1A. ................................................................................................................................. 154
Appendix 1B. ................................................................................................................................. 157
Appendix 1C. ................................................................................................................................. 159
Appendix 2A: ................................................................................................................................. 164
Appendix 2B: ................................................................................................................................. 195
Appendix 3A. ................................................................................................................................. 205
References ..................................................................................................................................... 206

10

11
Chapter 1. National Landscape Review
Introduction
This chapter synthesizes information from multiple sources, including previous literature
and national and state reports. The chapter aims to inform the development of an early
childhood educator wage compensation model for Alaska.
Session 1 reviews previous research on compensation, explores factors associated with
low wages for early childhood educators, and examines the impact of low wages on
classroom quality and turnover.
Session 2 reviews policies and practices in different states across various sectors. The
review includes specific policies in state-funded public pre-kindergarten, Head Start, and
Department of Defense child care programs.
Session 3 reviews and analyzes current compensation strategies.
Session 4 summarizes common trends found in this report, key takeaways, and next
steps for developing a compensation model in Alaska.
We refer to all educational staff who directly work with early childhood and school-age
children as “early childhood educators.” This includes educators in child care centers,
Early Head Start or Head Start programs, child care homes or large group homes, non-
relative or relative child care programs, publicly funded pre-kindergarten programs, and
private preschools. We use more specific terminology to explain context when citing
research.

12
1. A Review of Research on Compensation
Background
Many early childhood educators in the United States face challenges regarding
inadequate compensation and benefits, a lack of coordination between compensation
and competency, and inconsistent workforce policies and systems. Previous research
finds that wages for early childhood educators are lower than wages in other
occupations requiring similar levels of education (e.g., Cleveland & Hyatt, 2002;
Herzenberg, Price, & Bradley, 2005; Manlove & Guzell, 1997; Phillips, Howes, &
Whitebook, 1991; Whitebook & Sakai, 2003). For example, center-based early childhood
teachers and administrators who have a college degree earn only 52-66% of what
average female college graduates earn (Herzenberg et al., 2005). Another study found
that early childhood educators working full-time earn 75% of the income of female
workers in other occupations and 50% of the income of kindergarten and elementary
teachers (Cleveland & Hyatt, 2002).
Even with an educational degree and trainings, early childhood educators working in
child care programs or private preschools earn the same as other jobs that require little
or no education (Hale-Jinks, Knopf, & Kemple, 2006). Whitebook, Phillips, and Howes
(2014) demonstrated that childcare workers in 2013 had a lower average hourly wage
($10.33) than animal caretakers at kennels, animal shelters, zoos, shelters, and
aquariums ($10.82).
Although Cleveland and Hyatt (2002) reported that early childhood educators’ salaries
increase with experience after the first three years, many early childhood educators
experience financial barriers. One in four center-based early childhood educators have
incomes below 200% of the poverty line versus one in five for other workers and one in
14 for female college graduates (Herzenberg et al., 2005). Consequently, one-third of
early childhood teachers in Missouri require public assistance to supplement their
income (Torquati, Raikes, & Huddleston-Casas, 2007). In one study, center-based
administrators reported they were able to provide adequate wages and benefits only
when receiving outside funding (Shdaimah, Palley, & Miller, 2018).
Ullrich, Hamm, and Schochet (2017) argue that adequate compensation for highly
qualified early childhood educators is mathematically impossible given the cost of

13
operation without public or outside funding and/or raising tuition. Not surprisingly,
early childhood educators, including public pre-kindergarten teachers, who leave the
profession for full-time work in a different field earn significantly more (Gilpin, 2011).
Furthermore, a study of pre-service teachers’ preferences found that most participants
did not want to work in childcare due to low wages and poor work conditions (Thorpe,
Boyd, Ailwood, & Brownlee, 2011).
This illuminates a critical need for “transforming the financing of early care and
education” (The National Academies of Sciences, Engineering, Medicine, 2018), and
coordinating funding streams at the federal, state, and local levels to ensure an early
childhood ecosystem where (a) an early childhood workforce is highly qualified and
adequately compensated, and (b) all children and families have access to high-quality,
reliable early care and education.
The Impact of Low Wages
Low wages are a major source of concern and low satisfaction for early childhood
educators (Kontos & File, 1992; Manlove & Guzell, 1997; Phillips et al., 1991; Stremmel,
1991). Meanwhile, higher wages are associated with greater feelings of autonomy, job
commitment, and satisfaction (Phillips et al., 1991). In addition, public school teachers
who earn more perceive their work environments as being more positive (Grayson &
Alvarez, 2008). Teachers who leave the profession tend to earn less than those who stay
(Gilpin, 2011), especially for teachers who were in the field for less than six years (Gilpin,
2011).
Low wages also may have consequences for quality of care and child developmental
outcomes. Early childhood teachers’ wages may be positively related to children’s
positive behavior and emotional expression (e.g., King et al., 2016; Whitebook, 1999).
Early childhood educators’ wages may be positively related to the quality of care
provided to children such as structural quality and observed classroom quality (Ghazvini
& Mullis, 2002; Phillips et al., 1991; Phillips, Mekos, Scarr, McCartney, & Abbott-Shim,
2000; Whitebook, 1999).
Although there is evidence that teachers with higher levels of training and education
have higher wages compared to those with lower levels of training and education

14
(Phillips et al., 2000; Torquati et al., 2007), low wages still impact early childhood
educators’ motivation for education, training, and advancement. Low wages are often
identified as an obstacle for higher education and training (Ackerman, 2006; Cleveland
& Hyatt, 2002) and decrease teachers’ motivation to obtain higher education and
increase their quality of care (Ackerman, 2006; Cleveland & Hyatt, 2002). Center-based
administrators and home-based providers report that they struggle with the costs of
hiring staff, which can lead them to hire teachers with less education, training, and
familiarity with the profession (Shdaimah et al., 2018). In addition, low wages prevent
centers from retaining teachers with higher levels of educational attainment and
certification (Ackerman, 2006; Shdaimah et al., 2018).
Wages are related to teacher turnover, with higher wages predicting less turnover
(Ackerman, 2006; Cleveland & Hyatt, 2002; Hanushek & Rivkin, 2007; Hendricks, 2014;
Kelly, 2004; Stockard & Lehman, 2004; Whitebook & Sakai, 2003; Whitebook, 1999). This
suggests that compensating teachers better may result in lower turnover, which would
lead to stability of care for children.
Teacher Turnover: Other Factors to Consider
In general, dissatisfaction with wages is associated with turnover (Guarino, Santibanez, &
Daley, 2006; McDonald, Thorpe, & Irvine, 2018; Phillips et al., 1991). However, salary is
not the only factor in teachers’ decisions to leave. In Wells’s (2015) study with Head Start
teachers, the majority of the teachers reported being satisfied with their current salary,
and salary was not related to job satisfaction or turnover. The author found that work
climate is more important than salary in preventing turnover. Jeon, Buettner, and Grant
(2018) also found that although salary predicts center-based child care and public pre-K
teachers’ burnout, their teaching competencies, perceived work climate, and conditions
(e.g., relationships with leadership and co-workers) more strongly predicted burnout.
In addition to low base wages, inadequate overtime pay, benefits, and incentives or
bonuses are also related to turnover (Hale-Jinks et al., 2006; Johnco, Salloum, Olson, &
Edwards, 2014; Kontos & File, 1992; Phillips et al., 1991; Stremmel, 1991).

15
Benefits
In the profession of early care and education, benefits are not commonly offered to
early childhood educators (Hale-Jinks et al., 2006; Phillips et al., 1991). Center-based
early childhood educators are twice as likely to lack health insurance through their
employers as employees in other fields, and they are three times as likely to lack any
health insurance (Herzenberg et al., 2005). On average, only one in three center-based
staff receive health insurance through their employers and only one in five have a
pension plan (compared to 46% of general employees, on average, who have employer
sponsored pensions; Herzenberg et al., 2005). Among home-based early childhood
educators, only one in four providers have health insurance (Herzenberg et al., 2005).
Examining different roles in early care and education, cChild care aides tend to receive
fewer benefits than lead and assistant teachers, and directors do not necessarily receive
more benefits than teachers (Phillips et al., 1991).
It is critical to consider benefits in a compensation model because health insurance,
disability insurance, and retirement plans were found to be related to retention in the
early care and education field (Holochwost, DeMott, Buell, Yannetta, & Amsden, 2009),
although dental insurance and investment plans were not significantly associated with
retention (Holochwost et al., 2009).
In a study of Australian early childhood educators, the educators were more likely to
stay in their current job when they were offered benefits on top of wages, such as paid
time for professional development or paid no-contact (planning) time during their work
hours (McDonald et al., 2018). In the United States, early care and education employers
are more likely to offer “professional” benefits related to teaching and professional
development than “personal” benefits that are more costly, such as health insurance
(Kontos & File, 1992; Phillips et al., 1991). Although King et al. (2016) found that early
childhood educators’ paid planning time, vacation days, and sick days were unrelated to
children’s positive behavior and emotional expression, other work suggests that paid
professional development, vacation, and sick days increase employees’ job satisfaction
and retention (Deckop, Konrad, Perlmutter, & Freely, 2006; Hill, 2013; Stearns & D’Arcy,
2008).

16
Disparities in Compensation and Benefits
While early childhood educators’ wages are generally low compared to other
professions, disparities exist also within the field. Appendix 1A, a 2016 federal report,
shows high variability in median wages for early childhood educators nationwide (U.S.
Department of Health and Human Services & U.S. Department of Education, 2016).
Wages vary across states, program sponsorship (e.g., Head Start, public
prekindergarten), and age group of children. Indeed, early childhood educators working
with infants and toddlers earn about $9,000 less annual salary than early childhood
educators serving preschool-age children (Ullrich et al., 2017). Regarding setting, home-
based early childhood educators may earn less than center-based early childhood
educators after accounting for business-related costs and long hours (Herzenberg et al.,
2005).
Cash Incentives
Cash incentives may reduce turnover. Educators in center-based programs who received
cash incentives based on their level of educational attainment through the Workforce
Incentive Project (WIN) had lower rates of turnover (Gable, Rothrauff, Thornburg, &
Mauzy, 2007). However, WIN did not reduce director turnover rates (Gable et al., 2007).
From 2001–2004, North Carolina offered teachers bonuses for working with low-income
or low-performing students in middle and high schools, and turnover rates decreased
by 12% (Clotfelter, Glennie, Ladd, & Vigdor, 2006).
2. A Review of Current Policies and Practices
A State-level Scan of Early Childhood Workforce Policies
The Center for the Study of Child Care Employment (2018) developed an Early
Childhood Workforce Index that assesses states and offers strategies to improve the
quality of the early childhood workforce across the United States. Strategies included
wage increases and financial and professional supports. Table 1A describes the criteria
used to assess each state in three categories: Earnings and Economic Security, Early

17
Childhood Workforce Policies, and Family and Income Support Policies. There are three
statuses, “Stalled”, “Edging Forward”, and “Making Headway”.
Table 1A. Early Childhood Workforce Index Criteria
Category Criteria
Earnings & Economic
Security
Disparities in earnings among early educators
by children age group serving, sectors,
educational attainment, race/ethnicity
Utilization of federal income supports and
Medicaid
Economic insecurity (food insecurity, financial
concerns about housing, and/or postponing
medical treatment)
Early Childhood Workforce Policies
Qualifications/Financial
Supports for Education
Minimum qualification levels by education
Availability of scholarship to support education
pathways
Collect data on scholarship recipients
QRIS & Work Environment QRIS standards include:
Paid professional development time
Paid planning/preparation time
Salary scale/benefits
Compensation Strategies Salary parity for publicly funded pre-K teachers
State requires compensation standards, plans,
and guidelines outside of pre-K programs as a
condition of public funding
State funding includes earmarks for salaries
outside of publicly funded pre-K
Availability of a stipend or tax credit for early
childhood educators
18
Availability of a bonus linked to educational
attainment
Financial Resources State per-child spending on pre-K is more than
50% of state per-child spending on K-12
State reports extra Child Care Development
Block Grant spending
Workforce Data State registry data are inclusive across early care
and education settings
State registry collects data on wages and/or
benefits
Summary of registry data available online
Family & Income Support Policies
Income Supports & Child
Care Assistance
A minimum wage higher than the federal
minimum wage and indexed for inflation
State has a refundable Earned Income Tax
Credit
State has a refundable child care tax credit
Supports for Health &
Well-Being
Availability of state-wide mandated paid sick
leave
Availability of state-wide mandated paid family
leave
Availability of expanded Medicaid
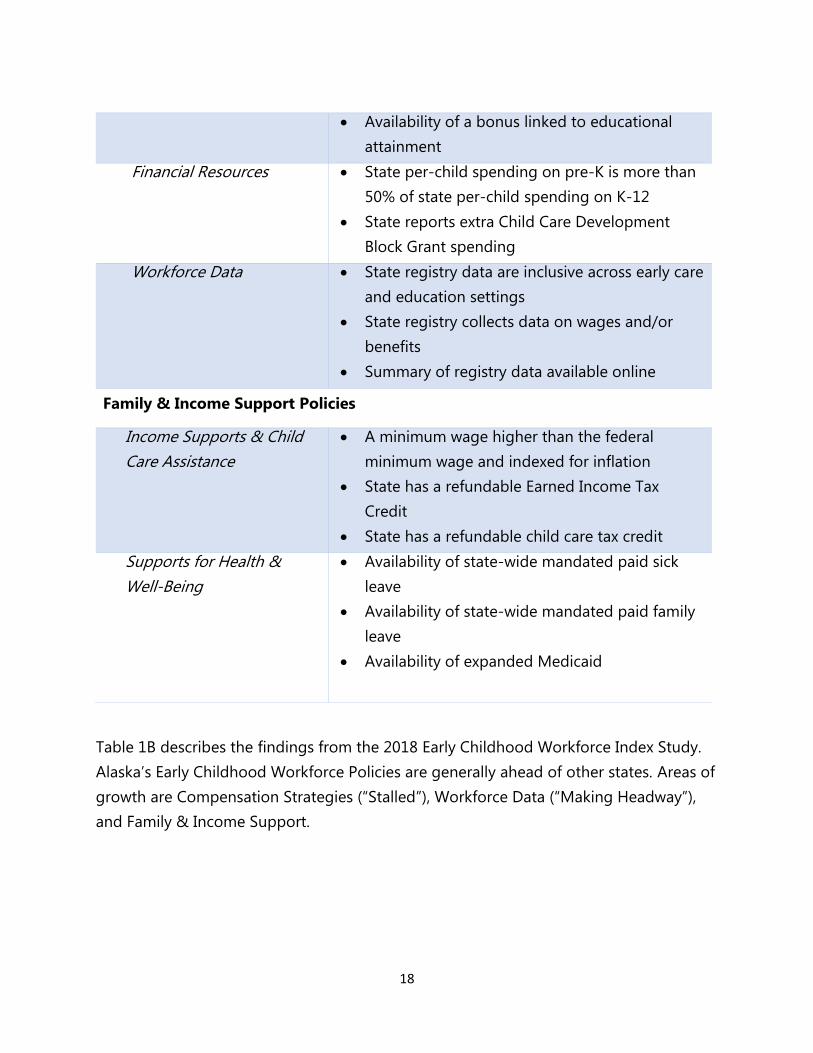
Table 1B describes the findings from the 2018 Early Childhood Workforce Index Study.
Alaska’s Early Childhood Workforce Policies are generally ahead of other states. Areas of
growth are Compensation Strategies (“Stalled”), Workforce Data (“Making Headway”),
and Family & Income Support.

19
Table 1B. Results of Assessment
Category Alaska
The number of States
Stalled Edging
Forward
Making
Headway
Early Childhood Workforce Policies
Qualifications/Financial
Supports for Education Edging Forward 18 33 0
QRIS & Work Environment Edging Forward 24 10 3
Compensation Strategies Stalled 44 7 0
Financial Resources Edging Forward 29 21 1
Workforce Data Making Headway 18 5 28
Family & Income Support Policies
Income Supports & Child
Care Assistance Stalled 37 9 5
Supports for Health &
Well-Being Stalled 39 7 5
Note. Data retrieved from the Center for the Study of Child Care Employment (2018).
Efforts to Reduce Disparities in Salary: Requirement for Wage Parity
Although disparities in compensation for early childhood educators exist, some states
are reducing the gap in salary between early childhood educators and K–12 teachers.
The District of Columbia, supports universal preschool available for all 3- and 4-year-
olds through public charter schools, Head Start-blended public schools, and
community-based organizations. To be eligible, programs are required to pay teachers
on the same scale as K-12 teachers (U.S. Department of Health and Human Services and
U.S. Department of Education, 2016).
North Carolina also requires parity in pay for teachers in state-funded public pre-K
programs and K-12 teachers in public schools.

20
To improve equity in early care and education, the New Jersey Supreme Court required
the state to invest in economically disadvantaged districts. As a result, the court required
Abbott School Districts Head Start and pre-K childcare programs to pay their teachers
equal wages and provide the same benefits as those provided to school district
teachers. In addition, about $21.7 million dollars were awarded towards scholarship
funds for more than 6,600 preschool teachers who work “a minimum of 30 hours per
week as a head teacher, group teacher, or assistant teacher, maintain a B average or
higher, and remain employed with the same center for at least one year following
completion of the degree program” (U.S. Department of Health and Human Services
and U.S. Department of Education, 2016, p. 10). This led community-based preschool
teachers to obtain a CDA, Early Childhood teacher certification, or college degree by the
court-mandated deadline (U.S. Department of Health and Human Services and U.S.
Department of Education, 2016).
The federal Preschool Development Grants request for proposal included wage parity,
spurring state equity efforts. (Appendix 1B describes various federal efforts to support
the early childhood workforce). However, it is often very challenging to achieve parity in
cash benefits without large funding increases.
In addition to the states mentioned above, the following states have compensation
parity policies for lead teachers in state-funded public pre-K (Barnett & Kasmin, 2017):
Hawaii, Iowa, Kentucky, Maryland, Nevada, New Mexico, North Carolina,
Oklahoma, Tennessee, Texas, and West Virginia.
Department of Defense Compensation Practices
The Department of Defense (DoD) early care and education system is considered the
gold standard of childcare because of its high standards, accountability systems, and
resources and support. DoD requires all full-time staff to complete at least 24 hours of
professional development every year, and the Navy mandates 48 hours. Full-time early
childhood educators’ wages are comparable to other similar jobs on installations (on
average $15 an hour) (Butrymowicz & Mader, 2016).
Although DoD requires only a high school diploma to be hired as an early childhood
educator, its high-quality in-house coaching system helps early childhood educators
obtain a CDA and college course credits within three months of employment. In

21
addition, DoD’s pay scale allows for pay increases based on employees’ performance
and years of experience.
DoD’s Sure Start program serves military children and families living overseas. The
program offers services similar to Head Start and targets mostly children at risk because
of economic challenges or other health or family-related barriers. Sure Start teachers
receive extra-duty pay for activities that take place outside of the duty day (e.g., home
visits, family meetings, student recruitment) (Sure Start Program Guide, 2009). In
addition, the DoD Education Activity (DoDEA) ensures annual, tailored professional
development. The program guide says, “three days of training, funded by DoDEA
Headquarters, for new Sure Start staff and two days for returning staff is required
annually to ensure consistency in approach and delivery of content and program
requirements. … This training may be delivered in a variety of modes to include face-to-
face, virtual, and/or school cluster groups at designated sites within commuting
distance. The training must, to the extent possible, meet the needs of each district it
serves and promote program fidelity.” (DoDEA Sure Start Program, 2018, p. 12)
Head Start Compensation Practices
According to the National Survey of Early Care and Education (2013), Head Start
teachers’ median hourly wage varies by educational attainment. Teachers who have a
high school diploma are paid $8.00 an hour; those who have at least an associate
degree are paid $12.20 an hour; and those who have a bachelor’s degree or higher are
paid $15.90 an hour. These rates are similar to wages for public Pre-K educators ($8.40
for teachers having a high school diploma; $9.80 for teachers having an associate
degree; and $16.20 for teachers having a bachelor’s degree or higher); however, they are
higher than other early childhood educators’ hourly wages ($9.60 for teachers having a
high school diploma; $11.00 for teachers having an associate degree; and $13.90 for
teachers having a bachelor’s degree or higher).
Although there are disparities across states and within states, Head Start teachers with a
bachelor's degree, on average, earn $33,000 annually. This is generally higher than early
childhood educators’ salary in private child care programs, reflecting higher educational
attainment expectations for Head Start teachers; as of February 2017, 74% of Head Start

22
teachers have a bachelor’s degree and have received training in early childhood
education.
Despite relatively higher salaries in comparison to other early childhood educators,
Head Start teachers still earn far lower salaries than average general full-time female
workers with a bachelor’s degree. In some states, Head Start teachers with a bachelor’s
degree can move to the K-12 public school sector and earn twice as much. This disparity
leads to high Head Start teacher turnover.
Relative funding for professional development has diminished throughout Head Start’s
history. The 1965 summer program had a budget of $84 million, with $11 million, or
13%, allotted for training (Fitzgerald, 2014). By 2013, total funding was $7.6 billion, with
$295 million, or 4%, allotted for a range of supports (Fitzgerald, 2014).
Previous research conducted by the Johns Hopkins University IDEALS Institute found
that although Head Start teachers report generally higher salaries, better benefits,
superior professional development resources, and higher educational attainment, job
satisfaction and commitment were much lower than responses from early childhood
educators in other programs.
Public Pre-Kindergarten Compensation Practices
Among early childhood programs, state-funded pre-K programs are one of the most
active in seeking teacher compensation parity. Although salaries and supports for early
childhood educators differ across states, there are within-state efforts to ensure early
childhood educators are adequately paid and receive appropriate professional
development opportunities.
For example, the Georgia Department of Early Care and Learning 2018–2019 School
Year Pre-K Providers’ Operating Guidelines include a pay scale with minimum salary
requirements. Lead teachers with at least an associate degree must earn a minimum
salary of $19,304.87. Teachers with at least a master’s degree and Teaching Certificate
Level 5 must earn a minimum salary of $36,308.74 (Georgia Department of Early Care
and Learning, 2018). In addition, Georgia's Department of Early Care and Learning
(DECAL) has an incentive program with salary bonuses based on education and tenure.

23
Bonuses range from entry-level $250 (two payment maximum) to $1,250 (four payment
maximum) at higher levels of education and tenure.
3. A Review of Currently Available Compensation Strategies
Louisiana School Readiness Tax Credits
In 2007, the Louisiana Legislature passed Act 394, which enacted Revised Statutes
47:6101-6109 to provide five different types of tax credits for early care and education
providers, teachers, directors, business operators, and families.
Descriptions of Louisiana School Readiness Tax Credits
Source: Information reprinted from “Giving Credit Where It’s Due: School Readiness
Tax Credits Benefit Louisiana Families and Communities” by Louise Stoney, Melanie
Bronfin, and Monica Candal Rahim (2016, p. 7)
The Child Care Provider Credit is available to child care centers that have a Quality
Start rating of at least 2-Stars. The value of the credit is based on the quality level and
number of low-income children served by the center, and ranges from $750 to $1,500
per child. The credit is refundable and available to both tax-paying and non-profit
centers. In tax year 2014, 405 participating centers received, on average, a credit worth
$9,900.
The Child Care Teacher and Director Credit is available to staff with Pathways Career
Ladder Credentials who have been employed in a child care center for at least six
consecutive months. The credit is refundable, adjusted for inflation each year, and
based on the credential level attained. In tax year 2014, the value of the credit ranged
from $1,630 to $3,260. 3,770 educators claimed the credit and the average recipient
received $2,150.
The Child Care Expense Credit is available to families who incur expenses for
enrolling a child under the age of 6 in a child care center with a Quality Star rating of
at least 2 stars. The credit amounts are between 50% and 200% of the LA Child Care

24
Credit, based on the Star rating of the center. The credit is refundable for families with
incomes less than $25,000. In tax year 2014, 14,468 families received the credit and
the average recipient received a credit of $223.
The Business-Supported Credit is available to businesses that pay for child care
expenses in centers with a Quality Star rating of at least two stars. The credit amounts
range from 5% to 20% of eligible expenses, depending on the center’s star rating. In
tax year 2014, the average credit claimed by 57 businesses was $7,040.
The Resource and Referral Agency (CCR&R) Credit is a dollar-for-dollar investment
tax credit for businesses that contribute up to $5,000 to a CCR&R. The credit is
refundable. In tax year 2014, the average credit claimed by 190 businesses was $4,360.
As described above, the School Readiness Tax Credits policy is aligned with Louisiana’s
Quality Rating and Improvement System (QRIS) and Pathways Career Ladder
Credentials. This policy provides incremental awards by Pathways Career Ladder
Credentials. In addition, the policy encourages staff retention by requiring a recipient’s
employment for at least six consecutive months. This policy is universally available to all
qualified participants regardless of the recipient’s current wages.
As a result of the School Readiness Tax Credits, children from disadvantaged family
backgrounds are more likely to attend higher quality child care programs defined by the
Louisiana’s Quality Rating and Improvement System (ratings of three stars or above)
between 2009 and 2016. In addition, the number of teachers achieving higher levels of
career pathway credentials significantly increased between 2008 and 2015.
Child Care WAGE$
The Child Care WAGE$ Initiative is a direct wage supplementation program that
provides graduated supplements and encourages continued education. Currently, five
states—Florida, Iowa, Delaware, New Mexico, and North Carolina—are operating
Child Care WAGE$. This program benefits children’s learning by decreasing rates of

25
teacher turnover and developing a more educated teacher workforce through incentives
for educational attainment. About 74% of WAGE$ recipients in Iowa reported that the
program was an incentive to pursue a higher level of education.
Teachers, directors, and family child care providers working with children from ages 0–5
and who have an hourly wage below a threshold are eligible to receive a wage
supplement twice a year based on their educational attainment. Recipients also must
have at least some formal education related to early childhood education. The average
six-month supplement is $952. Each state has different funding mechanisms, but the
WAGE$ programs are typically funded through private and public sources.
For example, in Iowa (http://www.iowaaeyc.org/wage.cfm), early childhood educators
are eligible to receive a WAGE$ supplement stipend when they (a) work in an eligible
program in a funded county; (b) earn below the income cap of $15/hour on average
(varies by county); (c) have one of the education levels from regionally accredited
schools; (d) work at least six months in the same early care and education program; and
(e) stay at the same program at the final stage of the WAGE$ supplement receipt. Table
1C provides more specific information on the education levels and the amount of tiered
supplement.
Table 1C. The WAGE$ Supplement Scale in Iowa
Level Education Requirement Annual
Award
10
10 Master's or Doctorate Degree plus or including 24 EC credits
Bachelor's Degree with an Active Teaching License with an EC
Endorsement
$3,500
9
9 Master's or Doctorate Degree plus or including 18 EC credits
Bachelor's Degree plus or including 24 EC credits
$2,900
8
8 Master's or Doctorate Degree plus or including 9 EC credits
Bachelor's Degree plus or including 15 EC credits
$2,300
7
7*
7*
7*
Associate Degree plus or including 24 EC credits
Master's or Doctorate Degree (less than 9 EC credits)
Bachelor's Degree (less than 15 EC credits)
90 credits toward a Bachelor's Degree plus or including 24 EC
credits
$1,800

26
6*
6* Associate Degree plus or including 12 EC credits
60 credits general education plus or including 18 EC credits
$1,400
5*
5*
5*
Early Childhood Community College Diploma
36 credits general education plus or including 12 EC credits
Associate Degree (less than 12 EC credits)
$1,100
4* 24 credits general education plus or including at least 6 EC
credits
$800
3* 12 EC college credits (could be part of a CDA Credential™,
Paraeducator, Apprenticeship, Community College EC Certificate,
etc.)
$500
2 Active Child Development Associate (CDA) Credential™ (earned
with less than 12 college credits)
N/A
1 High School Diploma and training not for college credit N/A
Note. Retrieved from http://www.iowaaeyc.org/wage.cfm. EC credits are defined as
college coursework focused children ages birth to five.
*Temporary levels of education. Early care and education providers at one of these
levels must move to a higher level within two years to retain eligibility. Deadlines are
reestablished at each temporary level.
T.E.A.C.H.
The T.E.A.C.H. program is often incorporated into the Child Care WAGE$. T.E.A.C.H
provides college education with comprehensive supports (e.g., books) for in-service
early childhood educators. Once early childhood educators complete their coursework,
they receive bonuses and/or raises depending on their state’s policy. Recipients must
work in a licensed childcare program (center, home, or school). To encourage retention,
most states require recipients to stay in the same program for at least six months before
they are compensated
About 21 states operate their own T.E.A.C.H. program: Colorado, Nevada, Utah,
Nebraska, Texas, Missouri, Iowa, Minnesota, Wisconsin, Alabama, Indiana,
Michigan, Ohio, Pennsylvania, Vermont, District of Columbia, Delaware, North
Carolina, South Carolina, Florida, and Rhode Island. In 2018, the average GPA for a
T.E.A.C.H. scholarship recipient was 3.5, and the average increase in hourly wages for
recipients ranged between 7.9% and 8.8%, depending on the type of degree achieved.
In addition, sites with T.E.A.C.H recipients had a retention rate of over 94% within the

27
year of program participation. The difference in rates of retention for T.E.A.C.H.
recipients versus non-recipients is significant. For example, the rate of retention for
non-recipients in Ohio is estimated to be as low as 60%, whereas the retention rate for
T.E.A.C.H. recipients in the state is over 94%.
In Vermont, early childhood educators have a wide range of scholarship options within
T.E.A.C.H. (http://vaeyc.org/programs-and-services/teach/scholarship-options/). If
center-based or preschool teachers participate in the Child Care Apprenticeship
Scholarship, T.E.A.C.H. provides 80% of the tuition and 90% of the cost for books.
Teachers receive a bonus of $400 as well as $80 for travel or internet reimbursement per
semester. They also receive release time reimbursement by T.E.A.C.H. Recipients provide
10% of tuition costs and 10% of the cost of books, while employers provide 10% of
tuition, paid time off, and 1.5% of an annual salary increase. The education requirement
for this option is nine to 12 college credits. The recipients must stay at their sponsoring
program for additional year to be eligible.
If family childcare providers participate in an Associate Scholarship Option for associate
level coursework, they receive 80% of tuition and 90% of the cost for books from
T.E.A.C.H. Recipients pay the remaining 20% tuition costs and 10% of the cost for books.
The annual bonus provided by T.E.A.C.H. is $300 and family childcare providers receive
reimbursements of $80 for travel or internet per semester and release time. The
education requirement for this option is nine to 15 college credits. The recipients must
be in or operate a family childcare for additional year to be eligible.
In Pennsylvania, teachers and directors in child care centers have an opportunity to
receive scholarships for a Child Development Associate credential, associate’s degree in
CDA assessment, bachelor’s degree, or PA teacher certification. Scholarship recipients
receive paid time off for professional development, and T.E.A.C.H. provides incentives for
child care centers to participate by reimbursing employers for teachers’ release time.
Teachers are eligible if they earn less than $19 per hour, and directors are eligible if they
earn less than $25 per hour.
We also analyzed the overall levels of satisfaction with T.E.A.C.H. Across states, almost
100% of T.E.A.C.H. recipients and their employers responded that they would
recommend the program to someone they know. In North Carolina, 99% of recipients
reported being “very satisfied” or “somewhat satisfied” with the program. In

28
Minnesota, 89% of participants reported that T.E.A.C.H. helped them with career
development and advancement, and 95% reported that T.E.A.C.H. impacted their choice
to remain in their career.
Appendix 1C provides an in-depth analysis of the T.E.A.C.H. programs: agencies that
implement T.E.A.C.H., the effects of the program, and a link to each state’s T.E.A.C.H.
information webpage.
Wage Components within a Quality Rating and Improvement System
Several states incorporate the components of staff supports and wage structure into
their QRIS. For example, Ohio requires a written policy document describing their wage
structure for all rated programs and benefits for programs rated with two to five stars.
Ohio’s QRIS also requires a planning time set aside for teachers as a way to support staff
to meet Ohio’s requirements. The written document specifies wages by position and
available supports for staff. Two to five-star rated programs must submit documentation
if the program provides the following benefits: a total of five days of paid leave, health
benefits, retirement, discount on child care, tuition reimbursement, T.E.A.C.H. Early
Childhood Ohio, paid professional development, flexible spending account, life
insurance, five paid holidays, and one hour of paid planning time weekly. In addition,
programs need to specify their eligibility to receive the staff supports.
Massachusetts has an exemplary system that incorporates workforce policies into the
QRIS System. Level 2 programs are required to provide a description of program policies
that support teacher retention. Examples of policies include vacation and/or sick time,
education/tuition reimbursement, pay or career ladder increases, free or reduced child
care, and/or retirement plan or contribution. Level 4 programs are required to offer a
benefit package for staff that includes vacation, sick time, and health insurance.
Minimum Wage Requirement
An increasing number of states are requiring higher minimum wages for early childhood
educators. For example, D.C. and 29 states have minimum hourly wages greater than the
federal minimum wage. Eleven states have separate minimum wage laws at the local
level. Although this requirement may ensure that all early childhood educators receive at

29
least minimum wages, this may not influence the wages of more educated and
experienced educators.
C-WAGES
The Compensation and Wage Augmentation Grants for Economic Success (C-WAGES,
http://sfoece.org/cwages/) program provides tiered incentives to early childhood
educators and childcare providers in San Francisco who work with children from
disadvantaged families. Licensed centers qualify for the C-WAGES program if at least
25% of children in the program have families that earn less than 75% of the state
median outcome. Centers are eligible to receive compensation from C-WAGES if they
are located in neighborhoods with a high percentage of children receiving voucher
subsidies. Teachers and teacher assistants in these centers are provided with bonuses,
salary increases, health insurance, and retirement benefits. Centers also must be
involved in San Francisco’s Quality Rating and Improvement System to receive benefits
from C-WAGES. Increases in salary are based on job title and educational attainment. In
FY 15–16, approximately 1,000 early childhood educators in 85 licensed centers and 234
licensed family childcare providers participated in C-WAGES.
Pay for Success
The Pay for Success (https://payforsuccess.org/) is an innovative “Social Impact Bond”
funding mechanism in which private investors fund preventive interventions upfront and
the government compensates if minimal outcomes are met. This model is being used in
various social service areas such as recidivism, homelessness, and early childhood
education. This is a safe and efficient way for the government because it sets outcome
minimums and does not pay if they are not met. Pay for Success encourages innovation
and protects public spending.
Pay for Success can be an optimal approach for ECE interventions considering the high
payoffs for investing in young children (Heckman et al., 2010). For example, in 2013, Salt
Lake County, in Utah, launched a Social Impact Bond to provide high-quality preschool
programs to children from low-income neighborhoods (United Way of Salt Lake, 2015).
Private investors funded high-quality preschool programs to increase the capacity to
serve disadvantaged children. The goal was to increase children’s school readiness and

30
academic outcomes and reduce the need for special education. The results showed
success and resulted in government paying back the investors. In initial results, only one
of 110 children who were predicted to need special education was placed in a special
education class in kindergarten (Temple & Reynolds, 2015).
Similarly, Chicago’s Child–Parent Center used the Pay for Success approach to increase
the number of low-income children receiving high-quality preschool programs. The goal
was to increase children’s school readiness and decrease the number of children
receiving special education. In CPC’s third-year evaluation, Gaylor, Ferguson, McCracken,
Wei and Spiker (2018) report that it served more than 26,000 low-income children and
that a lower percentage of children needed special education than in the control group.
Pay for Success or Social Impact Bond thus can be an efficient way for governments to
encourage innovative prevention efforts.
Summary
In summary, currently available wage programs were similar to the programs reviewed
in thread’s ROOTS Awards Evaluation Results (pp. 6–10). However, this analysis found
more states implementing their own WAGE$ and/or T.E.A.C.H. programs to incentivize
early childhood educators’ training and education. In addition, some states are aligning
compensation and QRIS. Providing tax credits is another emerging option in research as
a way to stabilize funding streams for compensation. Pay for Success or Social Impact
Bonds provide an innovative way to partner with private investors.

31
4. Common Trends, Key Takeaways, and Next Steps
Common Trends and Key Takeaways from Research of Current
Compensation Models
Many early childhood educators enter the field with intrinsic motivation and
willingness to work with children.
Financial challenges and disparities in wages and compensation exist across and
within states.
Inequity in wages across sectors of the early childhood care and education
workforce lead to higher turnover.
Compensation models incorporate professional development systems and align
with career pathways as well as QRIS.
An increasing number of states require a minimum wage for early childhood
educators.
The federal government and states are working to reduce disparities across
various sectors.
Professional and personal benefits, in addition to salary, may improve the
workforce.
Salary is not the sole factor in turnover and retention decisions.
Ullrich et al. (2017) describe six policies to support the early childhood workforce. The
authors recommend that states partner with the federal government to implement these
policies.
1) Develop and maintain a comprehensive professional development system
The authors argue that multiple stakeholders, including institutes of higher education,
vocational or technical schools, professional development providers, and other
credentialing agencies or programs, must partner to provide professional development
for early childhood educators.
This system includes providing widely acceptable, portable, and stackable credentials
that have value within the labor market, providing competency-based credit for prior
learning, and improving the quality of professional development trainings.

32
2) Develop or revise statewide career pathways
This includes establishing compensation standards based on educators’ previous or
ongoing education or training and opportunities for advancement and specialization
based on skills and competencies.
3) Make progress toward compensation and benefit standards at parity with
kindergarten teachers
This policy suggests that each state’s QRIS needs to add standards on compensation
and benefits. The standards may include a tiered salary scale, requirement of minimum
wages for entry-level educators, and providing an annual salary for full-time educators
rather than an hourly wage. In addition, the policy may include a requirement for
educators in the highest level of positions (by education, training, and experience) to
earn salary parity with at least kindergarten teachers in the school district.
4) Promote data-driven policies and programs with a statewide workforce registry
This policy encourages states to maximize early childhood educators’ participation in
workforce registries. A well-designed online system will enable educators to track their
progress, monitor their training and education, set up performance goals, gather
information on professional development opportunities, and inform the state about the
workforce. As of 2017, although 42 states have a workforce registry, most states do not
mandate registration, which result in a low participation rate. Increasing the
participation rate is a key to maintaining a comprehensive set of information from early
childhood workforce.
5) Bolster state scholarship program
An increasing number of states and sectors require higher credentials in the early care
and education field. However, not many in-service, experienced early childhood
educators can afford additional education or trainings without adequate financial
support. To respond to the needs for higher credentials, states are encouraged to
implement scholarship programs that offset the cost of tuition and/or other expenses.
6) Reward degree attainment with wage supplements or tax credits
States need to incentivize early childhood educators’ professional growth to encourage
retention. Understanding the financial limitation of increasing wages across the board

33
consistently, some states implement wage supplement programs that are provided once
or twice annually based on educational attainment. The WAGE$ (wage supplements)
and Louisiana School Readiness Tax Credits are examples. States may prefer either tax
credits or wage supplements. Although tax credits compensate educators only once a
year, incentives are more stable because they are part of the tax system.
Next Steps:
This report synthesizes current research, national reports, and state policies. This is an
evolving and iterative report that will result in a final report with recommendations.
Based on this synthesis, the following steps are in progress:
Examining disparities across subgroups of early childhood educators in Alaska
Understanding Alaskan early childhood educators’ attitudes towards various
compensation options (e.g., wage, benefits, professional development resources,
competency-based compensation, advancement opportunities, etc.)
Exploring motivation for Alaskan early childhood educators to improve retention
Examining Alaskan Early childhood educators’ career pathways, education, and
training
Understanding Alaskan early childhood educators’ experiences with Learn &
Grow and SEED Career Ladder
Understanding various ways to build an early childhood ecosystem that
coordinates multiple services and funding streams in Alaska

34

35
Chapter 2. Research Findings
Introduction
This chapter reports findings from studies conducted in Alaska in 2019. The chapter
aims to understand the Alaska’s current early care and education landscape; the
impacts, barriers, and benefits of current wage and compensation practices in Alaska;
and early childhood educators’ attitudes towards wage and compensation.
Session 1 provides the results from the Alaska Early Childhood and School-Age
Educators Wage and Compensation Survey.
Session 2 summarizes the results from in-depth interviews with early childhood school-
age educators.
Session 3 describes the results from a SEED Steering Committee leadership survey, a
focus group, and interviews.
Session 4 provides the results from a survey responded by state/agency and
advocacy/think-tank leaders participating in the Johns Hopkins System-Level Shared
Services Community of Practice.
Table 2A below provides a summary of research participants.
Table 2A. Educators and Leadership Survey/Interviews Responses
Study Method N
Alaska Early Childhood and School-Age Educators Wage and
Compensation Survey
288
Interested in a follow-up interview/focus group 91
Educators in-depth follow-up interviews 12
SEED Steering Committee Leadership Survey 16
Leadership in-depth focus group/interviews 5
Johns Hopkins System-Level Shared Services Community of Practice
Survey
11
Educators recommendations validation study (reported in Chapter 3) 8

36
1. Alaska Early Childhood and School-Age Educators Wage
and Compensation Survey
Study Method
The IDEALS Institute at Johns Hopkins University conducted the Alaska Early Childhood
and School-Age Educators Wage and Compensation Survey from May 2019 to July
2019. A 20-minute online survey was distributed to early childhood (EC) and school-age
(SA) educators, primarily, using the list of the SEED Registry participants. The survey was
also distributed to Head Start programs in Alaska, and to EC and SA educators through
the Alaska Department of Education. The participants were also asked to share the
survey link with anyone who might be interested in participating in the survey.
At the end of the survey, we invited the participants to participate in a follow-up
interview or focus group. People who were interested in a follow-up study were asked to
leave their contact information. We received a total of 288 survey responses (more than
33% of the survey completion) and 91 of the participants were willing to participate in a
follow-up interview or focus group.
Participants’ Demographics
To gather participants’ demographics information, we asked their age, gender,
race/ethnicity, first language, and marital status. The results are described below.
Age: Almost one-third of respondents (31.2%, n = 63) were between ages 25 to 34. The
next largest age group was ages 35–44 (21.3%, n = 43), followed by ages 55–64 (19.8%,
n = 40), ages 45–54 (18.3%, n = 37), under 25 years old (6.9%, n = 14), and over 65 years
old (2.5%, n = 5).

37
Answer % Count
15-24 6.93% 14
25-34 31.19% 63
35-44 21.29% 43
45-54 18.32% 37
55-64 19.80% 40
65+ 2.48% 5
Total 100% 202
Gender: 96.6% (n = 197) of respondents were female and 3.4% (n = 7) were male.
Answer % Count
Female 96.57% 197
Male 3.43% 7
Other 0.00% 0
Total 100% 204
38
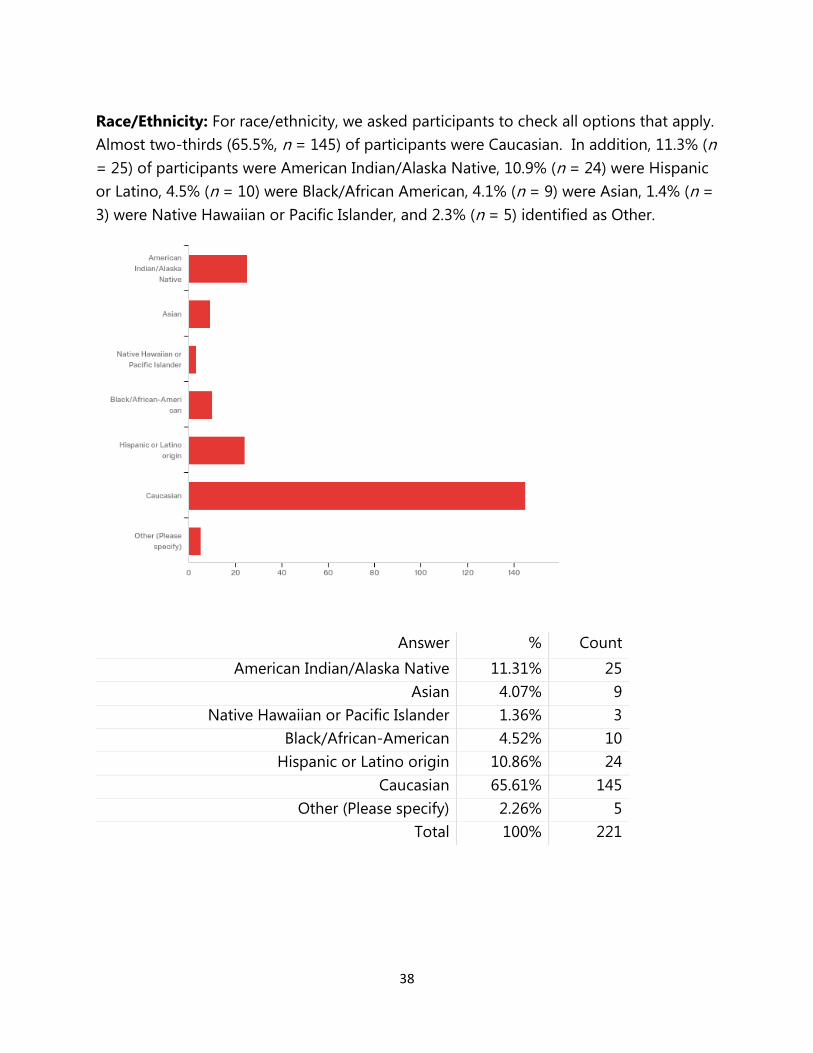
Race/Ethnicity: For race/ethnicity, we asked participants to check all options that apply.
Almost two-thirds (65.5%, n = 145) of participants were Caucasian. In addition, 11.3% (n
= 25) of participants were American Indian/Alaska Native, 10.9% (n = 24) were Hispanic
or Latino, 4.5% (n = 10) were Black/African American, 4.1% (n = 9) were Asian, 1.4% (n =
3) were Native Hawaiian or Pacific Islander, and 2.3% (n = 5) identified as Other.
Answer % Count
American Indian/Alaska Native 11.31% 25
Asian 4.07% 9
Native Hawaiian or Pacific Islander 1.36% 3
Black/African-American 4.52% 10
Hispanic or Latino origin 10.86% 24
Caucasian 65.61% 145
Other (Please specify) 2.26% 5
Total 100% 221

39
First Language: Among 202 valid responses, 87.6% of respondents’ first language was
English (n = 177) and 6.4% was Spanish (n = 13). The rest of the participants’ first
languages included Tagalog (n = 2), Hmong (n = 1), Japanese (n = 2), Korean (n = 1),
Lao (n = 1), Russian (n = 3), Samoan (n = 1), and Yup’ik (n = 1).
Marital Status: Most participants, 61.4% (n = 124), reported being married or in a civil
union, while 22.8% (n = 46) were single or never married, 7.4% (n = 15) were divorced,
6.4% (n = 13) were co-habiting or living together, 1.0% (n = 2) were separated, and 1.0%
(n = 2) were widowed.
Answer % Count
Married/Civil Union 61.39% 124
Co-habiting/Living together 6.44% 13
Single/Never married 22.77% 46
Separated 0.99% 2
Divorced 7.43% 15
Widowed 0.99% 2
Total 100% 202
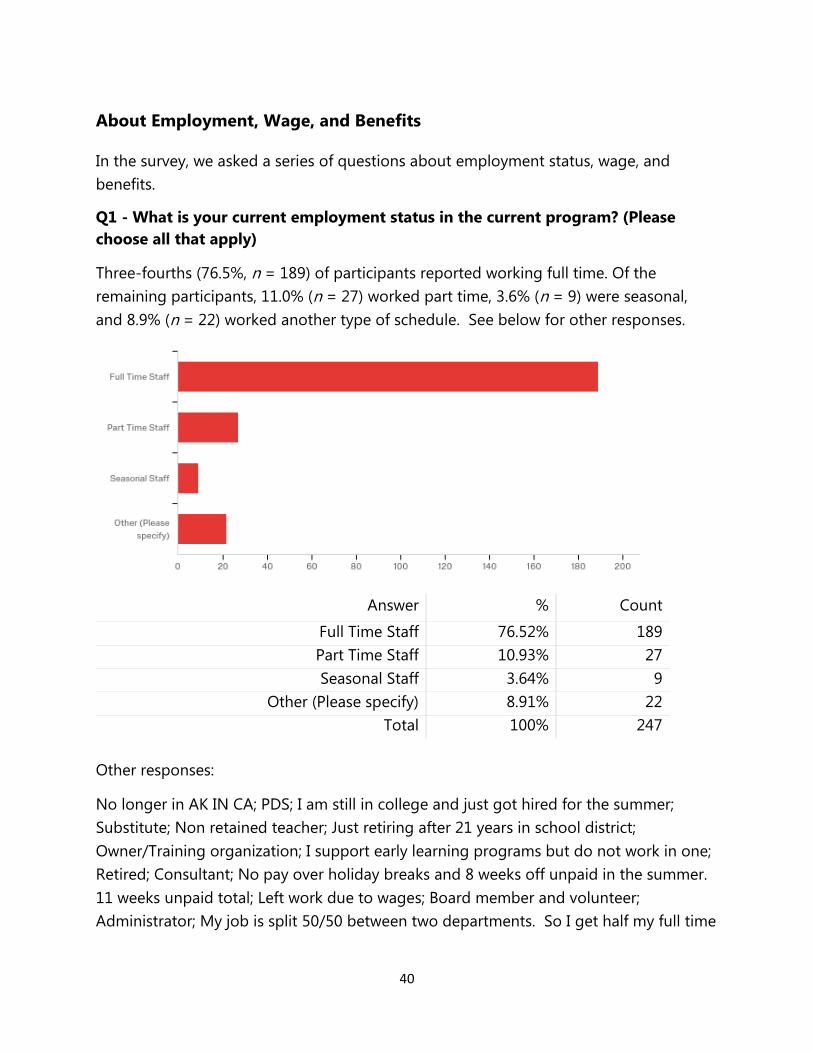
40
About Employment, Wage, and Benefits
In the survey, we asked a series of questions about employment status, wage, and
benefits.
Q1 - What is your current employment status in the current program? (Please
choose all that apply)
Three-fourths (76.5%, n = 189) of participants reported working full time. Of the
remaining participants, 11.0% (n = 27) worked part time, 3.6% (n = 9) were seasonal,
and 8.9% (n = 22) worked another type of schedule. See below for other responses.
Answer % Count
Full Time Staff 76.52% 189
Part Time Staff 10.93% 27
Seasonal Staff 3.64% 9
Other (Please specify) 8.91% 22
Total 100% 247
Other responses:
No longer in AK IN CA; PDS; I am still in college and just got hired for the summer;
Substitute; Non retained teacher; Just retiring after 21 years in school district;
Owner/Training organization; I support early learning programs but do not work in one;
Retired; Consultant; No pay over holiday breaks and 8 weeks off unpaid in the summer.
11 weeks unpaid total; Left work due to wages; Board member and volunteer;
Administrator; My job is split 50/50 between two departments. So I get half my full time

41
wages and benefits from each department, only one is school age care the other is
unrelated to this survey.
Q2 - What is your position title?
One-fifth (21.2%, n = 48) of respondents were lead teachers. 12.0% (n = 27) of
respondents were administrators/directors, 9.3% (n = 21) were assistant teachers, 8.4%
(n = 19) were family or group home child care owners, 6.2% (n = 14) were early
intervention/infant learning specialists, 5.3% (n = 12) were assistant
administrators/directors, 3.5% (n = 8) were elementary teachers, and 3.1% (n = 7) were
child care center owners. The remaining position categories in the survey made up less
than 7.0% of responses (6.6%, n = 15). However, almost one-fourth (24.3%, n = 55) of
participants chose “Other” for this question. See below for responses by those who
chose “Other”.
Answer % Count
Lead Teacher 21.24% 48
Assistant Teacher 9.29% 21
Assistant Administrator/Director 5.31% 12
Administrator/Director 11.95% 27
Child Care Center Owner 3.10% 7
Family or Group Home Child Care Owner 8.41% 19
Family or Group Home Child Care Staff 0.44% 1
Aide 0.88% 2
Other Non-Teaching Staff (bus driver, cook, reception) 0.88% 2
Apprentice 0.44% 1
Elementary Teacher 3.54% 8
Home Visitor 1.77% 4
Family Service Coordinator 2.21% 5
Early Intervention/Infant Learning Specialist 6.19% 14
Other (Please specify) 24.34% 55
Total 100% 226
Other responses:
Family Advocate; Special Education Preschool Teacher; Education Manager; Before and
After school child care;

42
Professional Development Coach; PDS; physical therapist; Assistant Director; Early
Interventionist and Physical Therapist; 2nd grade teacher; Paraprofessional working one
on one with child with a disability; Education and Training Specialist; Executive Director;
Co teacher; Infant Learning Program Director; Child care staff; Professional Development
Specialist; Professional Development Specialist; Director of Consultation at CCRR;
Enrollment Specialist; Two roles: deputy director and early interventionist; Admin
Assistant; Director/Lead Teacher; Professional Development Specialist; Education
Coordinator; thread CCR&R staff; Professional Development Specialist; Family Advocate;
HR manager; Early Childhood Coach; Elementary Substitute Teacher; Director of
Program Services (meaning Administrator for all licensed sites); Board Treasurer, Co-
founder; Co-teacher; family advocate; Early Intervention Therapist; Director/not in child
care program; Occupational Therapist; Infant Learning Program Manager; Director of
Professional Development (CCR&R); System Development Coordinator; Regional
Manager; Substitute Teacher; Education Coordinator; Retired Director; Support Staff;
Teacher Trainer; Project Manager; Administrative assistant; Data Compliance; Traditional
Cultural Coordinator; Supervisor; QRIS Director
Position Title Categories
Based on participants’ other responses, we created a new category,
“supervisor/coach/coordinator/specialist.” For the following wage and benefit analysis,
we categorized positions into five categories: (1) lead teacher, (2) assistant teacher
(assistant teacher, aid, and family or group home child care staff), (3) administrator
(assistant administrator/director; administrator/director; child care center owner; and
family or group home child care owner), (4) supervisor/coach/coordinator/specialist
(supervisor; coach; coordinator; home visitor; family service coordinator; early
intervention/infant learning specialist), and (5) elementary teacher. Two participants
from public schools who did not identify themselves as elementary teacher were
dropped from the following analysis.
Q3 - How many hours per week are you paid to work in the current program (not
including overtime)?
On average, the participants reported that they work about 38 hours per week (valid n =
212). There were 134 participants who work 40 hours (63.2%); 20 participants who work
more than 40 hours (9.4%); and 58 participants who work less than 40 hours (27.4%).
Eight participants reported that their work hours vary.
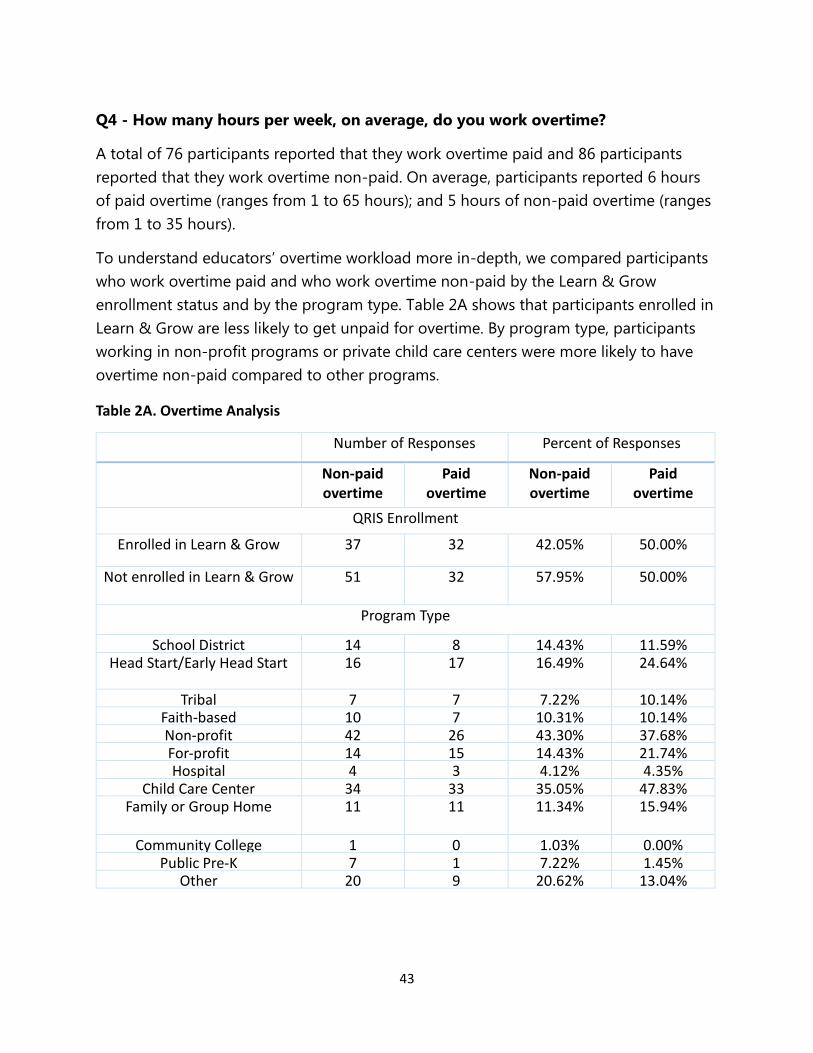
43
Q4 - How many hours per week, on average, do you work overtime?
A total of 76 participants reported that they work overtime paid and 86 participants
reported that they work overtime non-paid. On average, participants reported 6 hours
of paid overtime (ranges from 1 to 65 hours); and 5 hours of non-paid overtime (ranges
from 1 to 35 hours).
To understand educators’ overtime workload more in-depth, we compared participants
who work overtime paid and who work overtime non-paid by the Learn & Grow
enrollment status and by the program type. Table 2A shows that participants enrolled in
Learn & Grow are less likely to get unpaid for overtime. By program type, participants
working in non-profit programs or private child care centers were more likely to have
overtime non-paid compared to other programs.
Table 2A. Overtime Analysis
Number of Responses Percent of Responses
Non-paid overtime
Paid overtime
Non-paid overtime
Paid overtime
QRIS Enrollment
Enrolled in Learn & Grow 37 32 42.05% 50.00%
Not enrolled in Learn & Grow 51 32 57.95% 50.00%
Program Type
School District 14 8 14.43% 11.59% Head Start/Early Head Start 16 17 16.49% 24.64%
Tribal 7 7 7.22% 10.14% Faith-based 10 7 10.31% 10.14% Non-profit 42 26 43.30% 37.68% For-profit 14 15 14.43% 21.74% Hospital 4 3 4.12% 4.35%
Child Care Center 34 33 35.05% 47.83% Family or Group Home 11 11 11.34% 15.94%
Community College 1 0 1.03% 0.00% Public Pre-K 7 1 7.22% 1.45%
Other 20 9 20.62% 13.04%

44
Q5 - How many months do you work per year?
Among 221 valid responses, 76.5% of the participants (n = 169) reported that they work
12 months per year. On average, the participants work about 11 months per year. A
total of 18 participants work less than 6 months per year.
Q6 - What is your current wage per hour?
The median wage per hour was $18 (valid n = 190; ranges from $0 to $51.89).
Q7 - What is your total annual salary (before taxes) for the current year?
The median total annual salary for the current year was $39,705.60 (valid n = 173; ranges
from $0 - $118,000).
We conducted further analyses to understand participants’ hourly wage and annual
salary by position title (Table 2B), experience years (Table 2C), employment status (Table
2D), and educational attainment (Table 2E).
Table 2B. Wage Analysis by Position Title
Median hourly wage
Minimum hourly wage
Maximum hourly wage
Median yearly salary
Minimum yearly salary
Maximum yearly salary
Lead Teacher $14.00 $5.00 $43.93 $27,000.00 $1,000.00 $93,347.05
Assistant $12.00 $10.00 $20.00 $20,160.00 $1,700.00 $40,000.00
Administrator $18.00 $0.00 $50.00 $45,560.00 $0.00 $118,000.00
Supervisor/Coach/ Coordinator/Specialist
$27.70 $13.50 $51.89 $54,500.00 $4,050.00 $72,000.00
Elementary Teacher $32.00 $18.00 $35.80 $53,000.00 $13,190.00 $70,000.00
Table 2C. Wage Analysis by Experience Years
Years of Experience
N Median hourly wage
Minimum hourly wage
Maximum hourly wage
Median yearly salary
Minimum yearly salary
Maximum yearly salary
0-5 49 $14.00 $10.00 $43.93 $27,560.00 $1,500.00 $72,000.00
5.1-10 40 $16.50 $4.00 $40.00 $33,000.00 $1,000.00 $90,000.00
10.1-15 39 $20.00 $5.00 $45.00 $44,000.00 $20,000.00 $118,000.00
15.1-20 23 $20.78 $12.00 $42.00 $25,920.00 $20,840.00 $100,000.00
20.1+ 44 $24.90 $10.00 $51.89 $51,000.00 $4,050.00 $102,000.00 Note. We excluded elementary school teachers from this analysis.

45
Table 2D. Wage Analysis by Employment Status
Full Time Staff Part Time Staff Seasonal Staff
N 188 27 8
Median hourly wage $19.62 $18.00 $16.00
Median salary $42,000.00 $21,300.00 $22,00.00 Note. We excluded elementary school teachers from this analysis.
Table 2E. Wage Analysis by Educational Attainment
Highest Education Level
Median Hourly Wage
Minimum Hourly Wage
Maximum Hourly Wage
Median Yearly Salary
Minimum Yearly Salary
Maximum Yearly Salary
Less than high school, no GED
$10.50 $10.00 $12.00 $13,000.00 $13,000.00 $13,000.00
High school diploma or GED
$13.00 $10.50 $19.50 $27.200.00 $1,500.00 $45,120.00
Some college, but no degree
$14.32 $5.00 $45.00 $28,080.00 $1,000.00 $118,000.00
Some college, but CDA
$14.00 $ - $24.00 $24,000.00 $ - $42,000.00
Associate of Arts Degree
(A.A.)
$18.36 $4.00 $42.00 $33,580.00 $20,000.00 $66,000.00
Bachelor’s Degree
(B.A./B.S.)
$18.19 $10.00 $42.89 $42,500.00 $1,647.94 $85,000.00
Graduate school, but no
degree
$28.36 $14.00 $32.43 $53,000.00 $20,000.00 $100,000.00
Graduate degree
(M.A./M.S.)
$29.34 $ - $51.89 $59,000.00 $ - $102,000.00
Graduate or professional
degree beyond a master’s
(PhD., M. D., J.D., Ed.D.)
$34.80 $25.00 $38.00 $65,000.00 $62,000.00 $72,000.00
Note. We excluded elementary school teachers from this analysis.
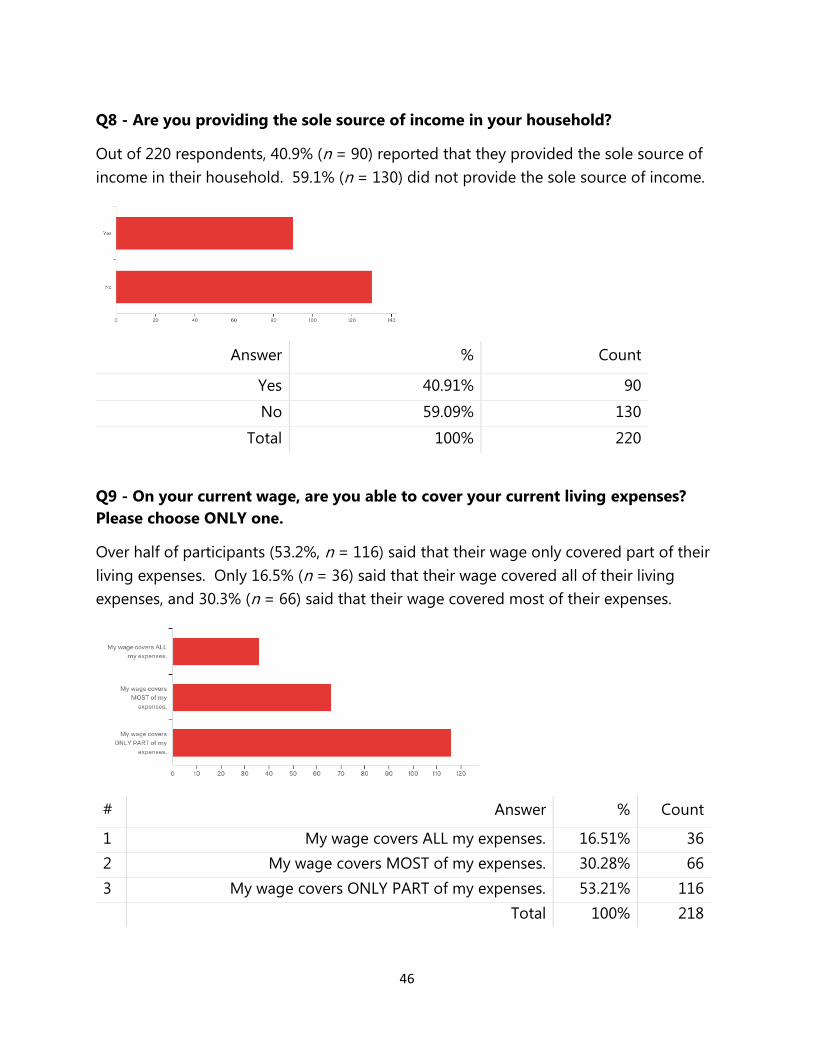
46
Q8 - Are you providing the sole source of income in your household?
Out of 220 respondents, 40.9% (n = 90) reported that they provided the sole source of
income in their household. 59.1% (n = 130) did not provide the sole source of income.
Answer % Count
Yes 40.91% 90
No 59.09% 130
Total 100% 220
Q9 - On your current wage, are you able to cover your current living expenses?
Please choose ONLY one.
Over half of participants (53.2%, n = 116) said that their wage only covered part of their
living expenses. Only 16.5% (n = 36) said that their wage covered all of their living
expenses, and 30.3% (n = 66) said that their wage covered most of their expenses.
# Answer % Count
1 My wage covers ALL my expenses. 16.51% 36
2 My wage covers MOST of my expenses. 30.28% 66
3 My wage covers ONLY PART of my expenses. 53.21% 116
Total 100% 218

47
Q10 - If you would like to leave any comment about your answer to the previous
question, please leave here.
We received 84 responses on this question. Participants’ comments were mostly about
how their child care income barely covers the living expenses (54% of the responses),
and that they need other sources of income (30%) such as partner/spouse income,
family support, and state welfare support.
o “We live paycheck to paycheck.”
o “My salary does not cover my children's health insurance nor my mortgage
payment.”
o “I would not be able to cover my expenses if my husband did not have a good
job.”
o “I left work because the pay didn’t even cover gas after I paid for friends to
watch my boys.”
Appendix 2A Q10 includes all comments left by the participants.

48
Q11 - Which of the following benefits do you receive from your child care
employment? (Please choose all that apply.)
The most common benefits that participants received were paid holidays (n = 138), paid
vacation days (n = 137), paid time off to attend professional meetings (n = 99), and
reimbursement or coverage for the cost of professional development training or
certificates (n = 96). Regarding medical insurance, 79 participants out of 288
participants said that their employer provided health insurance for them, 43 participants
said that their employer provided health insurance for their families, 83 respondents
received vision insurance from their employer, and 84 respondents received dental
insurance. In addition, 87 participants reported having a retirement program through
their employer. Please see below for a list of other responses.
Answer Count
Health insurance for yourself 79
Health insurance for your family 43
Vision Insurance 83
Paid vacation days 137
Paid release 26
Paid sick days 73
Paid holidays 138
Support for your college coursework (e.g. tuition) 56
Retirement program (e.g. pension program, 401(k) or 403(b)) 87
Reduced or full tuition coverage for your own child to receive child
care 25
Dental Insurance 84
Paid days to attend professional meetings 99
Fees/dues for professional development training or certificates 96
Flexible spending account (e.g. tax deferred account for dependent
or medical expenses) 32
Other benefits 25
Total 1,083

49
Other benefits:
Paid air travel for medical; Professional development, $1,000; My employer paid for my
CDA certification; Some fees for professional holidays; some flexibility of hours; I have
the Juneau School District Classified employees’ benefits; life insurance; gift certificates,
luncheons, employee appreciation picnic; PTO (for sick or vacation days), 5 weeks; Profit
sharing account; Child care assistance copay is waived; mileage reimbursement.
We further analyzed benefits the participants are receiving by position title (Table 2F),
experience years (Table 2G), and employment status (Table 2H). The results showed
disparities in benefits between lead and assistant teachers, and by employment status
(full-time versus part-time).
Table 2F. Benefits by Position Title
Percentage of Responses
Benefits Lead Teacher
Assistant Administrator Supervisor/ Coach/
Coordinator/ Specialist
Elementary Teacher
Health insurance for yourself
26.00% 13.04% 25.33% 64.44% 40.00%
Health insurance for your family
14.00% 13.04% 16.00% 28.89% 30.00%
Vision insurance 24.00% 4.35% 26.67% 75.56% 40.00%
Paid vacation days 50.00% 47.83% 52.00% 91.11% 60.00%
Paid release 16.00% 0.00% 6.67% 15.56% 20.00%
Paid sick days 36.00% 21.74% 24.00% 44.44% 60.00%
Paid holidays 54.00% 34.78% 52.00% 91.11% 50.00%
Support for your college coursework (e.g. tuition)
28.00% 13.04% 22.67% 31.11% 10.00%
Retirement program (e.g. pension program, 401(k) or 403(b))
28.00% 17.39% 22.67% 71.11% 50.00%
Reduced or full tuition coverage for your own child to receive child care
8.00% 13.04% 16.00% 2.22% 0.00%
Dental insurance 18.00% 17.39% 24.00% 80.00% 50.00%
Paid days to attend professional meetings
34.00% 30.43% 36.00% 64.44% 50.00%
Fees/dues for professional
30.00% 30.43% 46.67% 57.78% 10.00%

50
development training or certificates
Flexible spending account (e.g. tax deferred account for dependent or medical expenses)
8.00% 0.00% 17.33% 22.22% 10.00%
Other benefits 6.00% 8.70% 8.00% 20.00% 10.00%
Table 2G. Benefits by Experience Years
Percentage of Responses
Benefits 0-5 years 5.1-10 years 10.1-15 years
15.1-20 years
20.1+ years
Health insurance for yourself
30.61% 35.00% 43.59% 65.22% 36.36%
Health insurance for your family
12.24% 15.00% 28.21% 39.13% 20.45%
Vision insurance 22.45% 30.00% 43.59% 65.22% 59.09%
Paid vacation days 57.14% 60.00% 69.23% 91.30% 81.82%
Paid release 10.20% 5.00% 12.82% 26.09% 18.18%
Paid sick days 30.61% 45.00% 33.33% 60.87% 31.82%
Paid holidays 59.18% 65.00% 71.79% 95.65% 70.45%
Support for your college coursework (e.g. tuition)
22.45% 25.00% 30.77% 30.43% 34.09%
Retirement program (e.g. pension program, 401(k)
or 403(b))
24.49% 47.50% 51.28% 56.52% 50.00%
Reduced or full tuition coverage for your own
child to receive child care
12.24% 17.50% 10.26% 21.74% 6.82%
Dental insurance 30.61% 30.00% 35.90% 73.91% 54.55%
Paid days to attend professional meetings
46.94% 55.00% 43.59% 47.83% 56.82%
Fees/dues for professional development training or
certificates
44.90% 47.50% 51.28% 52.17% 50.00%
Flexible spending account (e.g. tax deferred account for dependent or medical
expenses)
4.08% 15.00% 20.51% 21.74% 22.73%
Other benefits 10.20% 10.00% 17.95% 8.70% 15.91%

51
Table 2H. Benefits by Employment Status
Percentage of Responses
Benefits Full Time Staff Part Time Staff
Seasonal Staff
Health insurance for yourself 39.36% 14.81% 0.00%
Health insurance for your family 21.81% 3.70% 0.00%
Vision insurance 42.55% 7.41% 0.00%
Paid vacation days 67.55% 37.04% 12.50%
Paid release 13.30% 7.41% 0.00%
Paid sick days 35.64% 14.81% 25.00%
Paid holidays 67.55% 37.04% 37.50%
Support for your college coursework (e.g. tuition)
29.26% 7.41% 12.50%
Retirement program (e.g. pension program, 401(k) or 403(b))
0.00% 0.00% 0.00%
Reduced or full tuition coverage for your own child to receive child care
11.17% 22.22% 37.50%
Dental insurance 43.09% 7.41% 0.00%
Paid days to attend professional meetings 46.28% 37.04% 50.00%
Fees/dues for professional development training or certificates
45.21% 40.74% 62.50%
Flexible spending account (e.g. tax deferred account for dependent or medical expenses)
15.43% 11.11% 0.00%
Other benefits 11.17% 7.41% 12.50%
Q12 - Do you currently hold another paid job to supplement your teaching
income?
One-fifth (19.0%, n = 42) of participants said that they had another job to supplement
their teaching income. 81.0% of respondents did not report having an additional job.
Answer % Count
Yes 19.00% 42
No 81.00% 179
Total 100% 221

52
Q13 - Do you receive any forms of public support (e.g., Medicaid, food stamps,
WIC, child care subsidy)?
18.6% (n = 41) of participants endorsed receiving some form of public support, while
81.5% (n = 180) did not receive any type of public support.
Answer % Count
Yes 18.55% 41
No 81.45% 180
Total 100% 221
Appendix 2A Q13 includes specific comments from the participants. The common
themes from the comments have not been retrieved because the participants’ responses
significantly varied.
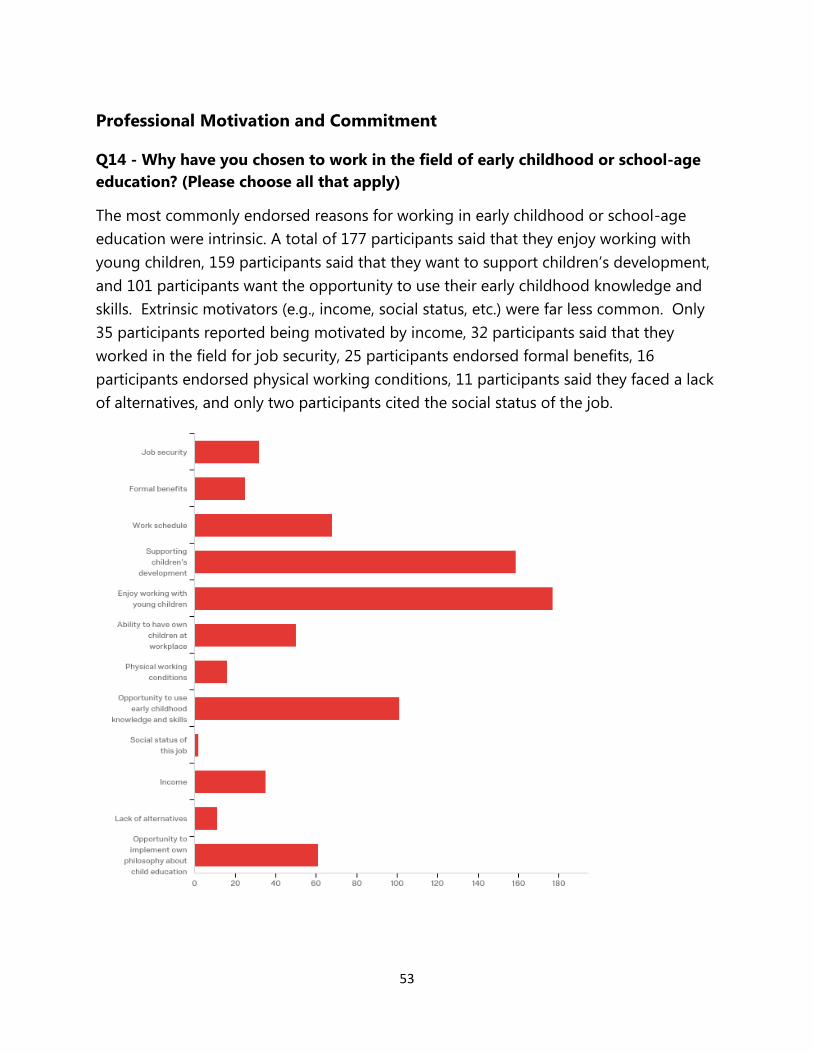
53
Professional Motivation and Commitment
Q14 - Why have you chosen to work in the field of early childhood or school-age
education? (Please choose all that apply)
The most commonly endorsed reasons for working in early childhood or school-age
education were intrinsic. A total of 177 participants said that they enjoy working with
young children, 159 participants said that they want to support children’s development,
and 101 participants want the opportunity to use their early childhood knowledge and
skills. Extrinsic motivators (e.g., income, social status, etc.) were far less common. Only
35 participants reported being motivated by income, 32 participants said that they
worked in the field for job security, 25 participants endorsed formal benefits, 16
participants endorsed physical working conditions, 11 participants said they faced a lack
of alternatives, and only two participants cited the social status of the job.

54
Answer Count
Job security 32
Formal benefits 25
Work schedule 68
Supporting children’s development 159
Enjoy working with young children 177
Ability to have own children at workplace 50
Physical working conditions 16
Opportunity to use early childhood knowledge and skills 101
Social status of this job 2
Income 35
Lack of alternatives 11
Opportunity to implement own philosophy about child
education 61
Total 737
Q15 - Are you planning to leave your current job in the future (within 5 years)?
Almost half of participants (49.1%, n = 108) said that they were planning to leave their
job within the next five years.
Answer % Count
Yes 49.09% 108
No 50.91% 112
Total 100% 220

55
Q16 - How soon are you planning to leave your position?
Of the participants who endorsed intention to leave their position within the next five
years, one-third (31.1%, n = 33) said that they planned to leave within one year, and
one-third (31.1%, n = 33) said that they planned to leave within the next one to two
years. The remaining participants either intended to leave within three to five years
(19.8%, n = 21) or were not sure when they would leave (17.9%, n = 19).
(For participants who chose “Yes” in Q12)
Answer % Count
This year 31.13% 33
In 1–2 years 31.13% 33
In 3–5 years 19.81% 21
Not sure 17.92% 19
Total 100% 106
We conducted further analyses examining educators’ wage and benefits by turnover
intention and commitment. Table 2I describes educators’ wage by their intention to
leave the field. Participants who had intention to stay had about $1/hour more hourly
wage than participants who had intention to leave. Table 2J also shows that educators
who had intention to stay had slightly better benefits in general than educators who had
intention to leave. Table 2K describes educators’ commitment by the position title. The
assistant teacher group had the lowest intention to stay in the field.

56
Table 2I. Wage Analysis by Turnover Intention & Commitment
Time of Departure N Median hourly wage Median salary
Staying 112 $18.83 $48,000.00
Total Leaving 106 $17.49 $33,000.00
Leaving this year 33 $15.75 $30,720.00
Leaving in 1-2 years 33 $18.00 $30,720.00
Leaving in 3-5 years 21 $23.00 $37,881.60
Not sure 19 $15.00 $29,060.00
Table 2J. Benefits by Turnover Intention & Commitment
Benefits N Leaving this year
Leaving in 1-2 years
Leaving in 3-5 years
Not Sure
Total Leaving
Staying
Health insurance for yourself
79 39.39% 33.33% 42.86% 10.53% 33.33% 37.50%
Health insurance for your family
43 21.21% 21.21% 9.52% 5.26% 16.67% 21.43%
Vision insurance 83 33.33% 33.33% 47.62% 21.05% 34.26% 40.18%
Paid vacation days 137 60.61% 66.67% 66.67% 36.84% 59.26% 64.29%
Paid release 26 6.06% 15.15% 4.76% 5.26% 9.26% 15.18%
Paid sick days 73 27.27% 42.42% 42.86% 21.05% 33.33% 33.04%
Paid holidays 138 42.42% 60.61% 76.19% 42.11% 54.63% 69.64%
Support for your college coursework (e.g. tuition)
56 18.18% 30.30% 23.81% 5.26% 21.30% 29.46%
Retirement program (e.g. pension program, 401(k)
or 403(b))
87 0.00% 42.42% 38.10% 0.00% 20.37% 0.00%
Reduced or full tuition coverage for your own
child to receive child care
25 12.12% 9.09% 9.52% 0.00% 8.33% 14.29%
Dental insurance 84 36.36% 39.39% 38.10% 21.05% 35.19% 40.18%
Paid days to attend professional meetings
99 42.42% 30.30% 38.10% 47.37% 37.96% 50.89%
Fees/dues for professional development training or
certificates
96 30.30% 54.54% 52.38% 26.32% 41.67% 46.43%
Flexible spending account (e.g. tax deferred account for dependent or medical
expenses)
32 12.12% 12.12% 9.52% 5.26% 11.11% 17.86%
Other benefits 25 15.15% 3.03% 14.29% 10.53% 10.19% 12.50%

57
Table 2K. Commitment by Position Title
Lead Teacher Assistant Administrator
Supervisor/ Coach/
Coordinator/ Specialist
Planning to stay 48.98% 36.36% 53.42% 62.22%
Planning to leave (total) 51.02% 63.64% 46.58% 37.78%
Leaving this year 18.37% 36.36% 8.22% 8.89%
Leaving in 1-2 years 18.37% 13.64% 17.81% 13.33%
Leaving in 3-5 years 4.08% 4.55% 12.33% 8.89%
Unsure when leaving 10.20% 9.09% 5.48% 6.67%
Q17 - Are you actively seeking another job?
Of the participants who intended to leave their jobs within the next five years, almost
half (48.1%, n = 51) reported actively seeking another job.
(For participants who chose “Yes” in Q15)
Answer % Count
Yes 48.11% 51
No 51.89% 55
Total 100% 106

58
Q18 - Could you tell us why you want to leave?
We received 104 responses on this question. The main points include the following:
Many of the participants said that they would like to leave for jobs with higher pay and
better benefits. About 43% of the responses mentioned low pay and lack of benefits as
the reasons for leaving.
o “I am not confident this job can support me as I progress towards larger financial
goals (homeownership, parenthood, etc.).”
o “I am not making enough, and it is getting difficult to get by. I live paycheck to
paycheck.”
The second-most-mentioned reason was high stress in the current program or the job
itself (23%). Many of them added that the pay does not compensate the stress coming
from the job.
o “Too stressful and too much staff turn-over.”
o “The salary doesn't compensate for the work load.”
o “Not enough support from the management and not enough professional
training.”
Other reasons were:
o Career change (7%)
o Retirement (11%)
o Career advancement (6%)
o Concerns about retirement (5%), and
o Family-related reasons (16%)
Appendix 2A Q18 includes all comments left by the participants.
Q19 - If you had an opportunity to leave this program, what would you most likely
do? (Please mark ONLY one.)
We asked participants what they would do if they had the opportunity to leave their
program. More than a quarter of respondents, 28.9% (n = 59), said they would not
choose to leave. Of those who would choose to leave, 23.5% (n = 48) of respondents
said that they would find a different program within the field of early childhood or
school-age education. Of those who would choose to leave the field of early childhood
and school-age education, 19.6% (n = 40) would switch to a completely different field,
15.7% (n = 32) would stop working altogether, and 12.6% (n = 25) would find a position
or get training in a field related to early childhood and school-age education.

59
Answer % Count
Stay in the field of Early Childhood or School-Age Education
but in a different setting. 23.53% 48
Find a position or get training in a field related to Early
Childhood or School-Age Education. 12.25% 25
Find a position or get training in a completely different field. 19.61% 40
Stop work, stay home, or retire. 15.69% 32
I would not choose to leave this program. 28.92% 59
Total 100% 204

60
Q20 - What are the reasons you chose your response to the previous question?
Of 48 participants who would stay in the field but in a different setting, 40
commented:
About 33% of the responses mentioned that they would stay in the field because oftheir passion for child care work.
o “I am very passionate about providing the best quality of care and educationto young children!”
o “I want to express my opinions and feelings and also my frustrations. We aredoings one of the most important jobs of this earth, we are giving love, time,role modeling and nurturing children, they will be the future of our nation.”
About 23% of the responses said that low pay and lack of benefits were the reasonsthey would want to leave to a different setting. Also, about 20% of the responseswere about burnout and low satisfaction about the current setting.
o “Low wages compared to previous job. Unorganized structure in currentcompany. Very little opportunity to expand on my current ECE knowledge.”
o “I like my job and I love working with kids, but I don't get paid enough at mycurrent job. There aren't enough benefits and I'm not satisfied at my currentjob. I need to find a job elsewhere doing the same work that I do now.”
Of 25 participants who would find a position or get training in related field, 24
commented:
About 25% of the responses mentioned burnout or low satisfaction in the currentsituation.
o “I enjoy working with children but was unsatisfied and felt stuck in my at homesituation. I was stymied in my plans to expand and felt dissatisfied with thecurrent status of childcare in rural settings in general.”
o “Every year as teachers we negotiate our contracts. It’s exhausting.Class sizes are bigger, support systems are dwindling. Teachers areoften blamed for not reaching benchmarks. In reality, I spend themajority of my day dealing with kiddos who need serious mentalhealth intervention and family support.”
About 25% of the responses said that they would like to work in a job where higherpay and better benefits are available.
o “I love kids and I want to be able to work with them, but I want to be able toafford to live securely, or even comfortably.”
o “I would like to stay in the field of early childhood education but I would needto find a center that can match my salary to my duties.”
o “Because places like elementary school settings or school district preschoolshave higher wages with benefits. Even though there is scientific evidence thatthe first 5 years has the largest impact for growth, development and

61
interventions. I wish I could stay at my job. I'm very very good at it and have a lot to offer. But it will not set me up for financial stability.”
Of 40 participants who would find a position or get training in a completely different
field, 32 commented:
About 28% of the responses mentioned low pay and benefits. o “I currently get paid the most here and I still live off of credit cards and
have upwards of 10,000 in consumer debt. I struggle to pay things like Medical bills and my mortgage.”
o “I have a family that I need to support. Currently, I am unable to do that.”
About 25% of the responses showed high levels of burnout. o “I am so tired of managing the constantly changing under paid employees
to do the most important work.” o “I feel the expectations of educators far exceed to support and
compensation given to them and the stress is not worth the lack of pay and respect from the public.”
o “The weight of responsibility of caring for young children, and needing to wear so many hats to carry out this job is a very heavy burden.”
Q21 - What would motivate you not to leave your current position?
A total of 98 participants left responses on this question.
About 67% of the responses mentioned higher pay and better benefits.
o “the ability to pay myself and all of my staff a living wage and give them raises as
they gain skill and knowledge of ECE”
o “Higher wages and benefits like health insurance and retirement.”
About 21% of the responses were about better work environment such as better
management, working conditions, classroom support, and respect/support.
o “A reliable work environment from the supervisors to co-workers.”
o “Vacation & time off to avoid burn out. More pay, more breaks, an extra person
to help kiddos who need extra support, a cook, a cleaning crew at the end of day
for major cleaning. So I can spend quality time with kiddos.”
o “Higher pay, better benefits, feeling like a valued member of the team at the
center, being listened to by the higher-ups and having my needs taken
seriously.”
o “to be treated the way they expect us to treat the families and community we
serve; after all we are part of that community as a whole”
The raw data are included in Appendix 2A Q21.
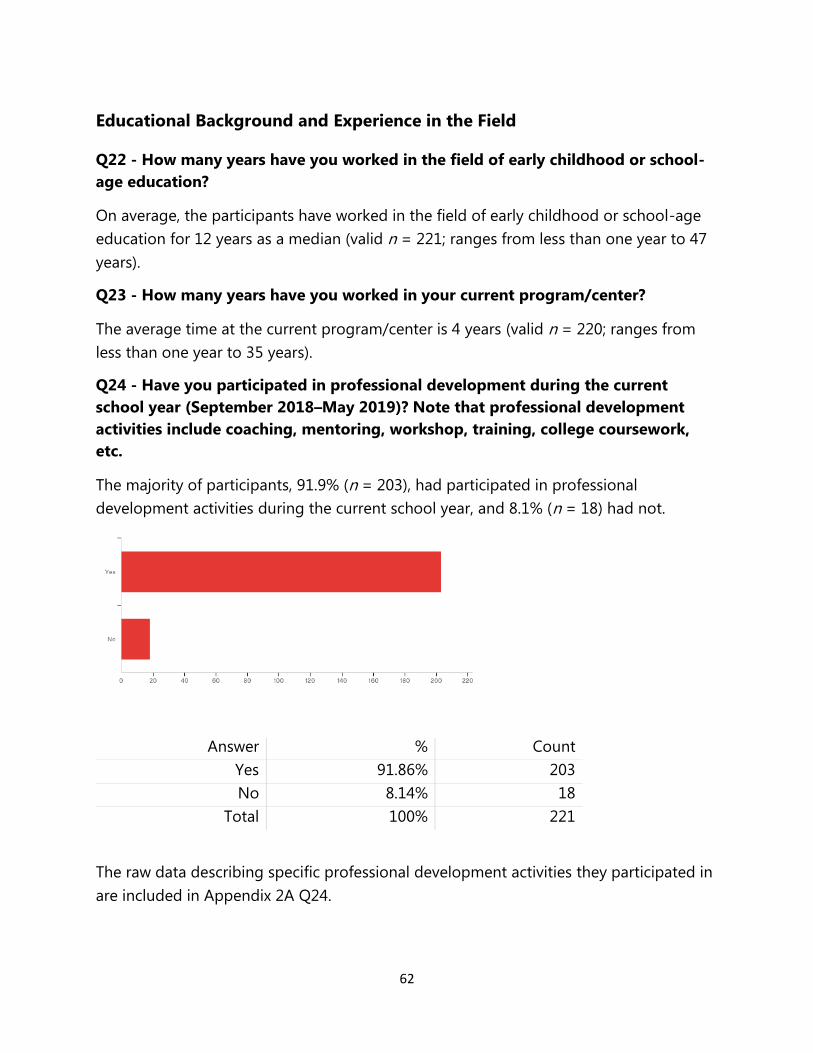
62
Educational Background and Experience in the Field
Q22 - How many years have you worked in the field of early childhood or school-
age education?
On average, the participants have worked in the field of early childhood or school-age
education for 12 years as a median (valid n = 221; ranges from less than one year to 47
years).
Q23 - How many years have you worked in your current program/center?
The average time at the current program/center is 4 years (valid n = 220; ranges from
less than one year to 35 years).
Q24 - Have you participated in professional development during the current
school year (September 2018–May 2019)? Note that professional development
activities include coaching, mentoring, workshop, training, college coursework,
etc.
The majority of participants, 91.9% (n = 203), had participated in professional
development activities during the current school year, and 8.1% (n = 18) had not.
Answer % Count
Yes 91.86% 203
No 8.14% 18
Total 100% 221
The raw data describing specific professional development activities they participated in
are included in Appendix 2A Q24.

63
Q25 - Did you get any compensation (e.g., paid leave, reimbursement for training
and/or travel) for participating in professional development?
Two-thirds of respondents (65.4%, n = 132) received some compensation for
participating in professional development, while one-third of respondents (34.7%, n =
70) did not receive any compensation.
Answer % Count
Yes 65.35% 132
No 34.65% 70
Total 100% 202
Responses to this question included information on who paid for what kind of
compensation respondents received.
About 26% of the responses mentioned that their employer (e.g., work, program, school
district or school) paid for the compensation. About 17% of the responses said that they
received compensation from SEED/thread. Most responses said that they were paid or
reimbursed.
As to what type of compensation they received, about 42% of the responses mentioned
that the professional development activity itself was paid for.
o “Work paid for Conference fees.”
About 42% also said that they received paid work hours or days to attend professional
development activities.
o “They would pay for the hours I was there or taking the class online.”
o “Paid leave from work.”
o “Regular hourly wage for part of training.”
About 25% of the responses said that they received reimbursements on travel, hotel
expenses as well as per-diem.
o “Paid travel (flight, hotel and rental car), paid time while in the training.”
o “The training was paid for and I was paid my normal work pay for being there.
All travel expenses were also covered (mileage and parking costs).”

64
To understand the characteristics of participants who do not report any compensation
for participating in professional development (n = 70), we analyzed their years of
experience in the field as well as in their current program, educational attainment and
program type.
Table 2L. Analysis of Employees with No Professional Development Compensation
Years Worked in Early Childhood or School-Age Education
0-5 5.1-10 10.1-15 15.1-20 20.1+
N 23 11 14 6 16
% 32.9% 15.7% 20.0% 8.6% 22.9%
Years Worked at Current Program
0-5 5.1-10 10.1-15 15.1-20 20.1+
N 47 10 3 4 6
% 67.1% 14.3% 4.3% 5.7% 8.6%
Educational Attainment
Less than high
school, no GED
High school
diploma or GED
Some college, but no degree
Some college, but CDA
Associate of Arts Degree
(A.A.)
Bachelor’s Degree (B.A./
B.S.)
Graduate school, but no degree
Graduate degree
(M.A./ M.S.)
Graduate or professional
degree beyond a master’s
(Ph.D., M.D., J.D., Ed.D.)
N 1 6 14 4 12 0 4 8 0
% 2.0% 12.2% 28.6% 8.2% 24.5% 0.0% 8.2% 16.3% 0.0%
Program Type
School District
Head Start/ Early Head Start
Tribal Faith- based
Non- profit
For- profit
Hospital Child Care
Center
Family or
Group Home
Community
College
Public Pre-K
Other (Please specify)
N 5 9 5 13 27 10 3 39 6 1 5 8
% 3.8% 6.9% 3.8% 9.9% 20.6%
7.6% 2.3% 30.0%
4.6% 0.8% 3.8% 6.1%
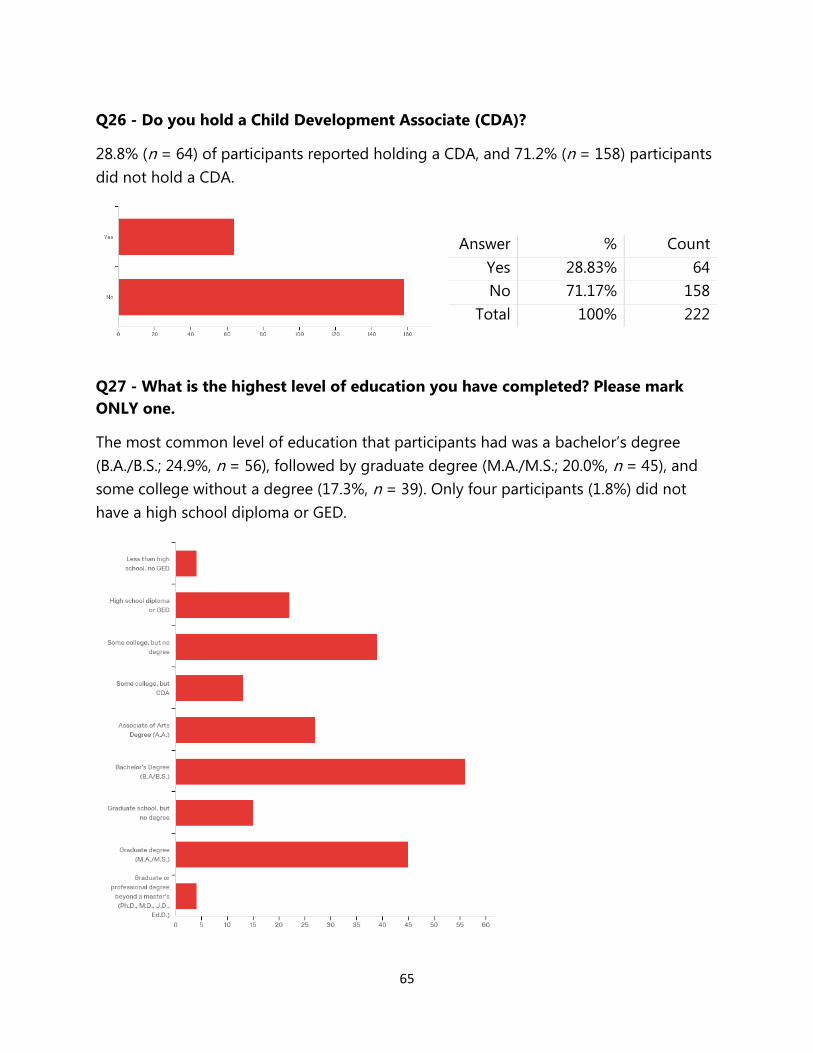
65
Q26 - Do you hold a Child Development Associate (CDA)?
28.8% (n = 64) of participants reported holding a CDA, and 71.2% (n = 158) participants
did not hold a CDA.
Q27 - What is the highest level of education you have completed? Please mark
ONLY one.
The most common level of education that participants had was a bachelor’s degree
(B.A./B.S.; 24.9%, n = 56), followed by graduate degree (M.A./M.S.; 20.0%, n = 45), and
some college without a degree (17.3%, n = 39). Only four participants (1.8%) did not
have a high school diploma or GED.
Answer % Count
Yes 28.83% 64
No 71.17% 158
Total 100% 222

66
Answer % Count
Less than high school, no GED 1.78% 4
High school diploma or GED 9.78% 22
Some college, but no degree 17.33% 39
Some college, but CDA 5.78% 13
Associate of Arts Degree (A.A.) 12.00% 27
Bachelor’s Degree (B.A/B.S.) 24.89% 56
Graduate school, but no degree 6.67% 15
Graduate degree (M.A./M.S.) 20.00% 45
Graduate or professional degree beyond a master's (Ph.D., M.D.,
J.D., Ed.D.) 1.78% 4
Total 100% 225
Q28 - How many years of formal education beyond a high school degree do you
have?
On average, participants had about five years of formal education beyond a high school
degree (valid n = 164; ranges from 0 to 20 years).
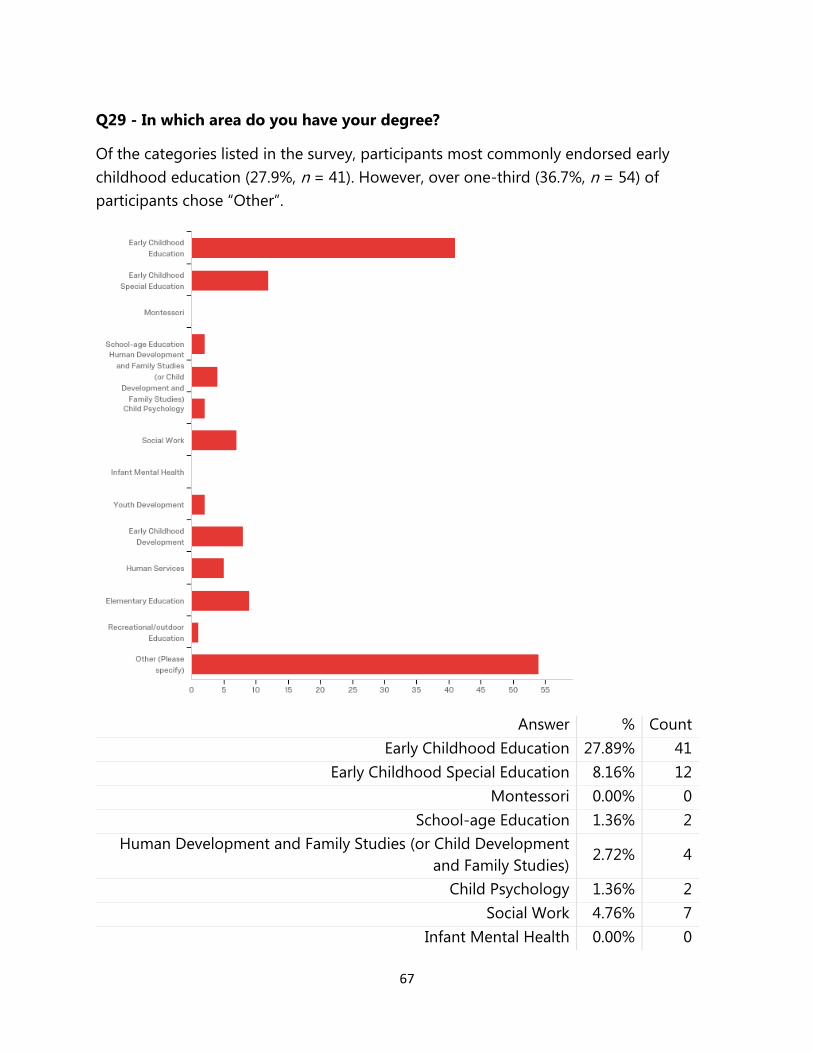
67
Q29 - In which area do you have your degree?
Of the categories listed in the survey, participants most commonly endorsed early
childhood education (27.9%, n = 41). However, over one-third (36.7%, n = 54) of
participants chose “Other”.
Answer % Count
Early Childhood Education 27.89% 41
Early Childhood Special Education 8.16% 12
Montessori 0.00% 0
School-age Education 1.36% 2
Human Development and Family Studies (or Child Development
and Family Studies) 2.72% 4
Child Psychology 1.36% 2
Social Work 4.76% 7
Infant Mental Health 0.00% 0

68
Youth Development 1.36% 2
Early Childhood Development 5.44% 8
Human Services 3.40% 5
Elementary Education 6.12% 9
Recreational/outdoor Education 0.68% 1
Other (Please specify) 36.73% 54
Total 100% 147
Perceptions of Compensation and Benefits
Q30 - Please rate how much you agree or disagree with the statements below.
Please note that the term “program” refers to the early childhood education
program in which you work currently. [Strongly Disagree = 1; Strongly Agree = 5]
Over half (55.6%, n = 114) of participants said that they were not satisfied with pay. Half
(50.3%, n = 102) of participants did not think that their wage and compensation from
their current program was fair, and 58.2% (n = 117) of participants did not think that
their pay accurately reflected their training and education level. In spite of this, 91.5% (n
= 183) said that they were passionate and excited about their work, and 93.0% (n = 187)
agreed that working with children made them feel successful and accomplished. Almost
three-fourths of participants (71.9%, n = 146) said that their job inspired them. Knowing
what they know now, two-thirds (67.3%, n = 136) of respondents said that they would
still choose to enter the field of early childhood and school-age education, and 81.1% (n
= 163) reported being satisfied with being an early childhood educator. Based on these
responses, it appears that the participants overall were passionate about their field and
committed to their work with children but did not feel adequately compensated for their
work.
Table 2M describes the means and standard deviations of each item as well as the
percentages of participants’ responses on the 5-point scale Likert scale.

69
Table 2M. Educators’ Perceptions
# Item Mean Standard Deviation
Valid n
1 I am satisfied with how much I am paid for my job. 2.63 1.26 205
2 Overall, wage and compensation I receive in my current program are quite fair.
2.72 1.22 203
3 I think that my pay appropriately reflects the education and training I received to do my work.
2.52 1.23 201
4 I am satisfied with a benefits package from my job. 2.78 1.37 202
5 I am financially stable. 2.92 1.22 199
6 I have passion and excitement about my work. 4.33 0.83 200
7 Working with children provides me with feelings of success or accomplishment.
4.48 0.66 201
8 I am satisfied with being an early childhood educator. 4.23 0.92 201
9 I am satisfied with my current program. 3.72 1.11 198
10 At my work, I feel bursting with energy. 3.42 1.05 202
11 My job inspires me. 3.94 1.03 203
12 I am proud of the work that I do. 4.51 0.71 202
13 I believe that pay should be structured by education and training.
3.91 0.98 202
14 I believe that pay should be structured by years of experience in early care and education.
4.04 0.95 202
15 Knowing what I know now, if I could decide all over again, I would become an early childhood educator again.
3.78 1.12 202
16 Within the next 12 months, I will actively look for a different position in the early childhood education field.
2.45 1.30 201
17 Given my age, education, occupation, and the general economic condition, I feel my chance of finding a suitable position in some other profession is high.
3.36 1.20 202
18 Having benefits customized to meet my needs would increase my loyalty to my employer.
3.89 0.99 202
19 I would be interested in working for a program/center that offers higher pay.
3.78 1.19 202
20 I am actively seeking a program/center that would pay me more.
2.53 1.40 200
21 I would be more loyal to a program/center that offers higher pay.
3.22 1.33 201
22 I am seeking professional development opportunities as a way to increase my pay.
3.41 1.28 199
23 I feel emotionally drained from my work. 3.18 1.19 201

70
# Question Strongly Disagree
Disagree Neither
Agree nor Disagree
Agree Strongly
Agree Total N
1 I am satisfied with how much I am paid for my job.
19.02% 36.59% 16.10% 18.54% 9.76% 205
2 Overall, wage and compensation I receive in my current program are quite fair.
16.26% 33.99% 19.21% 22.17% 8.37% 203
3 I think that my pay appropriately reflects the education and training I received to do my work.
22.89% 35.32% 16.42% 17.91% 7.46% 201
4 I am satisfied with a benefits package from my job.
24.26% 21.78% 18.81% 22.28% 12.87% 202
5 I am financially stable. 15.08% 24.62% 21.11% 31.16% 8.04% 199
6 I have passion and excitement about my work.
1.50% 3.50% 3.50% 43.50% 48.00% 200
7 Working with children provides me with feelings of success or accomplishment.
0.50% 0.00% 6.47% 37.31% 55.72% 201
8 I am satisfied with being an early childhood educator.
1.49% 3.48% 13.93% 32.34% 48.76% 201
9 I am satisfied with my current program.
5.05% 8.59% 22.73% 36.36% 27.27% 198
10 At my work, I feel bursting with energy.
3.47% 16.34% 30.69% 33.66% 15.84% 202
11 My job inspires me. 2.46% 7.88% 17.73% 36.95% 34.98% 203
12 I am proud of the work that I do. 0.99% 1.49% 1.98% 36.14% 59.41% 202
13 I believe that pay should be structured by education and training.
1.49% 8.42% 18.81% 40.10% 31.19% 202
14 I believe that pay should be structured by years of experience in early care and education.
2.97% 4.46% 11.39% 47.52% 33.66% 202
15
Knowing what I know now, if I could decide all over again, I would become an early childhood educator again.
3.47% 12.87% 16.34% 36.63% 30.69% 202
16
Within the next 12 months, I will actively look for a different position in the early childhood education field.
30.35% 24.88% 24.88% 8.96% 10.95% 201
17
Given my age, education, occupation, and the general economic condition, I feel my chance of finding a suitable
8.42% 16.83% 23.27% 33.66% 17.82% 202

71
position in some other profession is high.
18 Having benefits customized to meet my needs would increase my loyalty to my employer.
1.49% 7.92% 21.78% 37.62% 31.19% 202
19 I would be interested in working for a program/center that offers higher pay.
5.45% 9.41% 22.77% 26.73% 35.64% 202
20 I am actively seeking a program/center that would pay me more.
28.50% 30.00% 18.50% 6.00% 17.00% 200
21 I would be more loyal to a program/center that offers higher pay.
11.44% 20.90% 25.37% 18.41% 23.88% 201
22 I am seeking professional development opportunities as a way to increase my pay.
8.54% 17.59% 24.62% 23.12% 26.13% 199
23 I feel emotionally drained from my work.
9.45% 18.41% 32.84% 22.89% 16.42% 201
Note. A total of 61 participants left comments in this section. The common themes from the comments
have not been retrieved as the responses significantly varied. The raw data of specific comments are
included in Appendix 2A Q30.
Q31 - Please rate the extent to which the situations below are stressful for you as
an early childhood or school-age educator. [No Stress = 1; Extreme Stress = 5]
We asked respondents to rate the extent to which aspects of their job were stressful. Of
the factors that caused Extreme Stress, compensation and benefits were the most
common, with 13.5% (n = 27) and 14.5% (n = 29) of respondents endorsing these as
extremely stressful, respectively. Compensation had the highest mean stress score
across respondents (M = 2.92), followed by benefits (M = 2.70). The job factors that
caused the least stress and were most commonly labeled as not stressful were
respondents’ competence to teach (44.8%, n = 90), respondents’ competence to
manage the classroom (43.4%, n = 85), program-level requirements (45.0%, n = 90),
safety issues (50.3%, n = 101), and professional development opportunities (44.0%, n =
88). Overall, it appears that early childhood and school-age educators were least
stressed regarding their own abilities (e.g., competence to teach and manage their
classrooms, ability to meet program requirements) and most stressed about program
factors that were largely out of their control (e.g., compensation, benefits, supportive
leadership, promotion and advancement opportunities).

72
Table 2N describes the means and standard deviations of each item as well as the
percentages of participants’ responses on the 5-point scale Likert scale.
Table 2N. Stressors for Educators
# Item Mean Standard Deviation
Valid n
1 My competence to teach 1.79 0.85 201
2 My competence to manage the classroom 1.84 0.90 196
3 Program-level requirements (e.g., educational attainment)
1.92 1.04 200
4 Professional development opportunities 1.84 0.88 200
5 Compensation 2.92 1.25 200
6 Benefits 2.70 1.38 200
7 Promotion and advancement opportunities 2.36 1.27 200
8 Safety issues 1.90 1.11 201
9 Clear roles and responsibilities 2.15 1.19 200
10 Supportive leadership 2.41 1.34 197
# Question No Stress Mild Stress
Moderate Stress
Much Stress
Extreme Stress
Total N
1 My competence to teach 44.78% 35.82% 15.92% 2.99% 0.50% 201
2 My competence to manage the classroom
43.37% 35.71% 14.29% 6.63% 0.00% 196
3 Program-level requirements (e.g., educational attainment)
45.00% 29.00% 17.00% 7.00% 2.00% 200
4 Professional development opportunities
44.00% 31.00% 21.50% 3.50% 0.00% 200
5 Compensation 15.00% 23.50% 29.00% 19.00% 13.50% 200
6 Benefits 27.00% 19.00% 25.50% 14.00% 14.50% 200
7 Promotion and advancement opportunities
32.50% 28.00% 18.50% 13.00% 8.00% 200
8 Safety issues 50.25% 23.88% 15.42% 6.97% 3.48% 201
9 Clear roles and responsibilities
39.50% 25.00% 21.50% 8.50% 5.50% 200
10 Supportive leadership 35.03% 21.83% 19.80% 13.71% 9.64% 197

73
Q32 - What are your top three sources of financial stress? Please choose top 3.
We asked respondents to label their sources of financial stress. Overall, having
adequate savings was the most stressful factor, with 25.0% (n = 151) of participants
listing this as a significant stressor. This was followed by having money to pay monthly
expenses and bills (21.4%, n = 129), ability to afford retirement (18.4%, n = 111), ability
to afford healthcare (14.4%, n = 87), and having money to cover out-of-pocket medical
costs (11.3%, n = 68).
# Answer % Count
1 Being able to afford the cost of healthcare 14.43% 87
2 Having adequate savings 25.04% 151
3 Ability to afford retirement 18.41% 111
4 Ability to pay for professional development trainings 3.48% 21
5 Having money to pay monthly expenses and bills 21.39% 129
6 Having money to cover out-of-pocket medical costs 11.28% 68
7 Ability to rely on Social Security/Medicare in retirement 5.97% 36
Total 100% 603

74
Q33 - Below are some job-related factors that are important to people. How
important are the following to you? Please rank 1 = most important to 12 = least
important. Drag and drop the items to rank.
We asked participants to rate the importance of various job-related factors. Overall,
full-time status was the most important factor, followed by higher salary and job
stability.
Table 2O below analyzes the data using various methods to explore the most important
items for the participants. Participants’ specific comments on their responses are
described in Appendix 2A Q33.
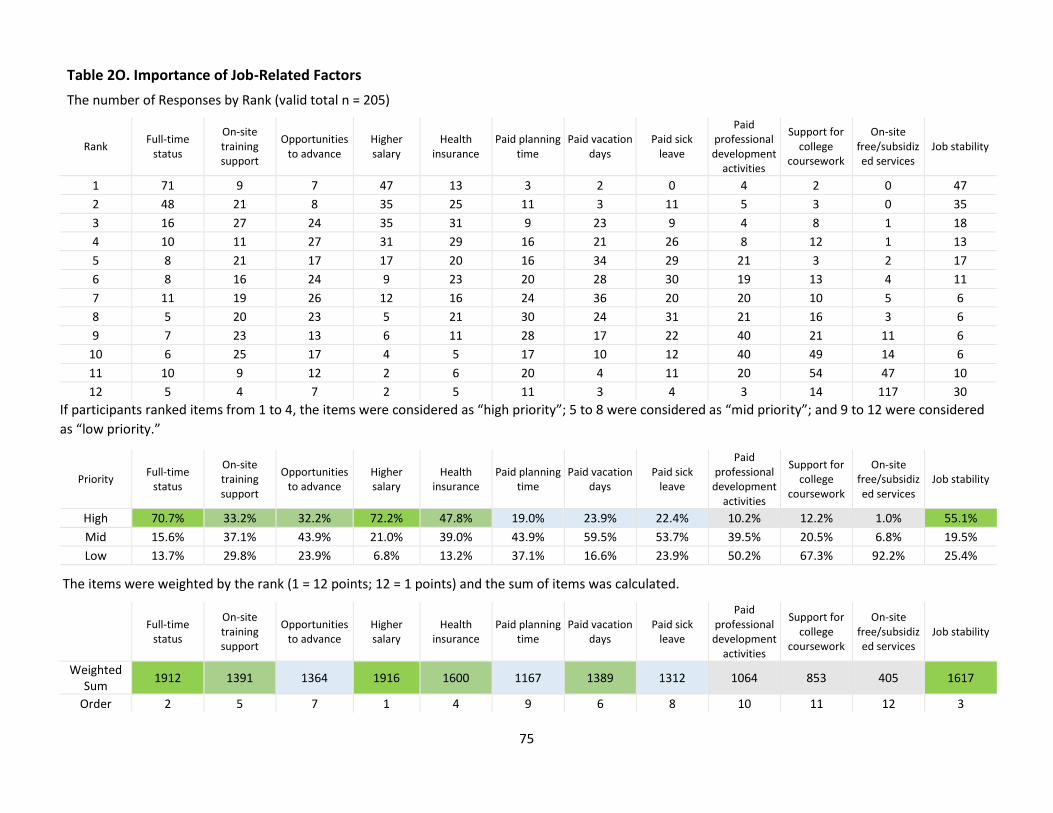
75
Table 2O. Importance of Job-Related Factors
The number of Responses by Rank (valid total n = 205)
Rank Full-time
status
On-site training support
Opportunities to advance
Higher salary
Health insurance
Paid planning time
Paid vacation days
Paid sick leave
Paid professional development
activities
Support for college
coursework
On-site free/subsidized services
Job stability
1 71 9 7 47 13 3 2 0 4 2 0 47
2 48 21 8 35 25 11 3 11 5 3 0 35
3 16 27 24 35 31 9 23 9 4 8 1 18
4 10 11 27 31 29 16 21 26 8 12 1 13
5 8 21 17 17 20 16 34 29 21 3 2 17
6 8 16 24 9 23 20 28 30 19 13 4 11
7 11 19 26 12 16 24 36 20 20 10 5 6
8 5 20 23 5 21 30 24 31 21 16 3 6
9 7 23 13 6 11 28 17 22 40 21 11 6
10 6 25 17 4 5 17 10 12 40 49 14 6
11 10 9 12 2 6 20 4 11 20 54 47 10
12 5 4 7 2 5 11 3 4 3 14 117 30
If participants ranked items from 1 to 4, the items were considered as “high priority”; 5 to 8 were considered as “mid priority”; and 9 to 12 were considered
as “low priority.”
Priority Full-time
status
On-site training support
Opportunities to advance
Higher salary
Health insurance
Paid planning time
Paid vacation days
Paid sick leave
Paid professional
development activities
Support for college
coursework
On-site free/subsidized services
Job stability
High 70.7% 33.2% 32.2% 72.2% 47.8% 19.0% 23.9% 22.4% 10.2% 12.2% 1.0% 55.1%
Mid 15.6% 37.1% 43.9% 21.0% 39.0% 43.9% 59.5% 53.7% 39.5% 20.5% 6.8% 19.5%
Low 13.7% 29.8% 23.9% 6.8% 13.2% 37.1% 16.6% 23.9% 50.2% 67.3% 92.2% 25.4%
The items were weighted by the rank (1 = 12 points; 12 = 1 points) and the sum of items was calculated.
Full-time
status
On-site training support
Opportunities to advance
Higher salary
Health insurance
Paid planning time
Paid vacation days
Paid sick leave
Paid professional
development activities
Support for college
coursework
On-site free/subsidized services
Job stability
Weighted Sum
1912 1391 1364 1916 1600 1167 1389 1312 1064 853 405 1617
Order 2 5 7 1 4 9 6 8 10 11 12 3

76
Program Operation
Q34 - On average, how much do you spend your own money a month to operate
your classrooms? (e.g., learning materials)
On average, the participants spend about $89 a month to operate their classrooms
(valid n = 178). It ranged from $0 to $2,500 – there is a possibility that program owners
reported their expenses to operate their programs. A total of 131 participants reported
that they spend between $0 to $100 a month. The rest of participants reported that they
spend more than $100/month.
Q35 - Does your program reimburse extra spending to operate your classroom?
About half (51.0%, n = 100) of
participants receive reimbursement
for spending to operate their
classroom, and 49.0% (n = 96)
reported that they do not receive
reimbursement.
Among the participants who chose “Yes (n = 100),” 25 participants left specific
comments about their answers.
About 40% of the responses (who said yes to Q47) said that their program has a certain
amount/budget fixed on classroom supplies, but that it is often not enough or provided
in a timely manner.
o “The program does allow teachers to request specific materials for the
classroom. However, the process is long and does not allow teachers to support
the students’ current interests in a timely manner. And after a long process the
purchase may not be approved. It is faster a faster, more creative, and more
independent process to buy materials out of pocket.”
o “I am on the grant program but most of the time I spent more money that what
they give me”
o Only a couple responses mentioned that their program offers enough:
Answer % Count
Yes 51.02% 100
No 48.98% 96
Total 100% 196

77
“Classroom receives $200 a month and it’s adequate. Rest if provided by
parent donations”
“My program is lucky to be able to afford to pay for classroom
enrichment. I know so many others who spend hundreds of their own
dollars.”
About 8% of the responses mentioned that they do not ask for a reimbursement.
o “I don't turn in all my receipts. I work in a small, non-profit program. We don't
have much of a cushion.”
Among the participants who chose “No (n = 96),” 29 participants left specific comments
about their answers.
It seems that since programs only reimbursed pre-approved purchases (17%) and since
the budget is small (7%), respondents were spending their own money on classroom
supplies (34%).
o “I create a shopping list, but if I don't include an item or it isn't approved I buy it
myself.”
o “I get a monthly supplies allowance of 30$, but it is often not enough to do the
activities I want to do with families and so I supplement with my own money or
supplies I have on hand at home.”
o “My current company only gives $30/monthly to support 20 school-age
activities”
o “Every now and again as leadership staff I purchase things for the teachers out of
pocket even though we are advised not to.”
Q36 - Please rate how much of a concern the below items are to you.
We asked respondents to rate the extent to which their business’s ability to stay open
and their ability to cover operation costs (e.g., facilities, learning materials) concerned
them (No Concern = 1; Much of a Concern = 5). The mean level of concern regarding
business’ ability to stay open was 2.6 (SD = 1.51), and the mean level of concern for their
ability to cover operation costs was 2.9 (SD = 1.39). This indicates that, overall,
respondents had mild to moderate concerns regarding these factors.
Table 2P describes the means and standard deviations of each item as well as the
percentages of participants’ responses on the 5-point scale Likert scale.
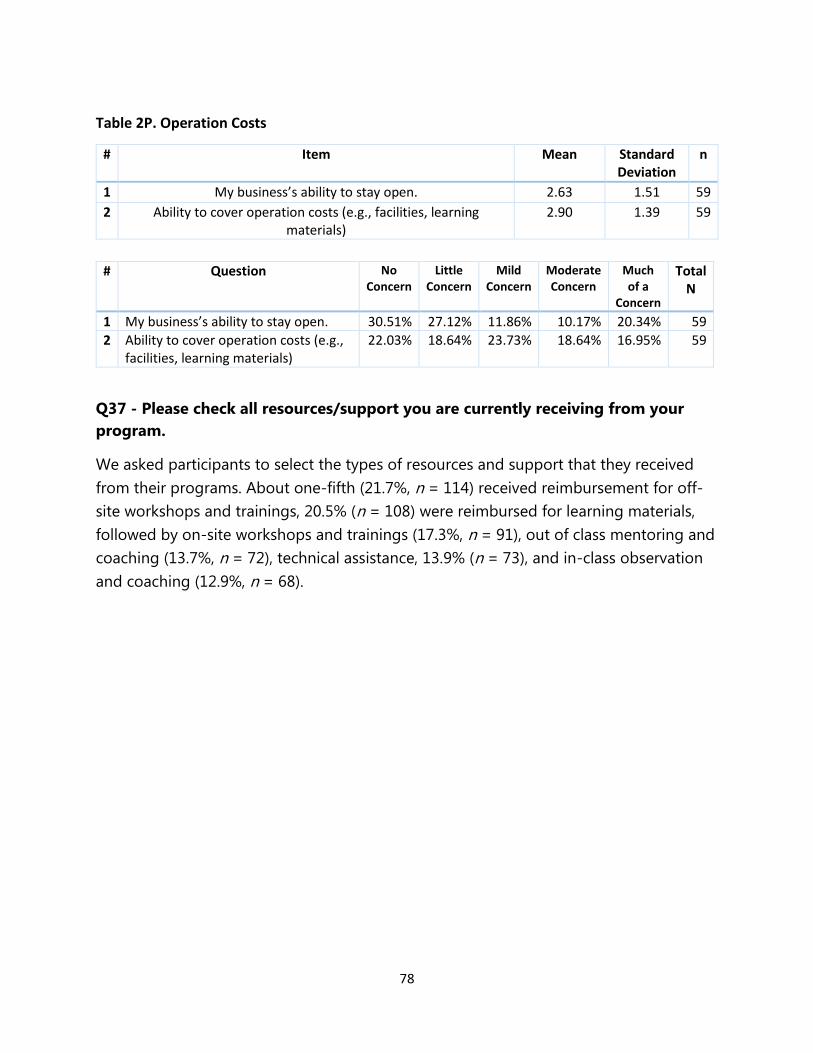
78
Table 2P. Operation Costs
# Item Mean Standard Deviation
n
1 My business’s ability to stay open. 2.63 1.51 59
2 Ability to cover operation costs (e.g., facilities, learning materials)
2.90 1.39 59
# Question No Concern
Little Concern
Mild Concern
Moderate Concern
Much of a
Concern
Total N
1 My business’s ability to stay open. 30.51% 27.12% 11.86% 10.17% 20.34% 59
2 Ability to cover operation costs (e.g., facilities, learning materials)
22.03% 18.64% 23.73% 18.64% 16.95% 59
Q37 - Please check all resources/support you are currently receiving from your
program.
We asked participants to select the types of resources and support that they received
from their programs. About one-fifth (21.7%, n = 114) received reimbursement for off-
site workshops and trainings, 20.5% (n = 108) were reimbursed for learning materials,
followed by on-site workshops and trainings (17.3%, n = 91), out of class mentoring and
coaching (13.7%, n = 72), technical assistance, 13.9% (n = 73), and in-class observation
and coaching (12.9%, n = 68).

79
Answer % Count
In-class observation and coaching 12.93% 68
Technical assistance 13.88% 73
On-site workshop or training 17.30% 91
Out of class mentoring/coaching 13.69% 72
Learning materials 20.53% 108
Off-site workshop or training reimbursement 21.67% 114
Total 100% 526

80
Program and Classroom Characteristics
Q38 - How many children from birth to 72 months of age are currently enrolled in
your program/center?
One-third (34.7%, n = 66) of respondents had 1–30 children ages 0–72 months in their
programs/centers. A fifth (20.5%, n = 39), had 31–60 children enrolled in this age group,
17.9% (n = 34) had 61–94 children in this age group, and one-fourth of participants
(26.8%, n = 51) had more than 94 children in this age group.
Answer % Count
1-30 34.74% 66
31-60 20.53% 39
61-94 17.89% 34
More than 94 26.84% 51
Total 100% 190
Q39 - How is your program structured?
Half of participants (53.1%, n = 102) were employed at a program that offered both full-
time and part-time structure for children, while 40.1% (n = 77) worked at a program that
was full-time, and 6.8% (n = 13) of participants worked in a part-time program.

81
Answer % Count
Full-time 40.10% 77
Part-time 6.77% 13
Both 53.13% 102
Total 100% 192
Q40 - How many of the children currently enrolled in your classroom are in the
following age groups? (Please write 0 if there are no children of that age.)
0–11 months 1–2 years old
(12–35 months)
3–4 years old
(36–59 months)
5 years old or
older
Mean 4.38 11.03 19.96 19.5
Q41 - Please choose ALL that represent your program.
More than one-fifth of participants (22.9%, n = 86) worked in non-profit programs,
21.9% (n = 82) worked in child care centers, 11.2% (n = 42) worked in Head Start/Early
Head Start, 8.0% (n = 30) worked in for-profit centers, and 8.8% (n = 33) chose “Other”
to describe their program. See below for the responses listed for Other.

82
Answer % Count
School District 5.33% 20
Head Start/Early Head Start 11.20% 42
Tribal 5.60% 21
Faith-based 5.87% 22
Non-profit 22.93% 86
For-profit 8.00% 30
Hospital 1.60% 6
Child Care Center 21.87% 82
Family or Group Home 5.87% 22
Community College 0.27% 1
Public Pre-K 2.67% 10
Other (Please specify) 8.80% 33
Total 100% 375
Other Responses:
Early intervention; Work from Home/Develop trainings; CCR&R; private pre-K through
elementary; Early intervention home visiting (classroom does not describe what we do);
thread; Parent-owned cooperative preschool; Child care connection; Bilingual Daycare;

83
Employer based; Community center; Before and after school; In-home state licensed-
not group home; Infant Learning Program; Montessori school; Employer provided care
(we are hospital employees that teach the children of other hospital employees)
Q42 - Is your program nationally accredited (e.g., NAEYC)?
Two-fifths (41.5%, n = 81) of respondents worked in nationally accredited programs, and
58.5% (n = 114) or respondents worked in programs that were not accredited.
Answer % Count
Yes 41.54% 81
No 58.46% 114
Total 100% 195
Q43 - Which region is your program located in?
Participants lived in a range of different regions of Alaska. Half (51.3%, n = 101) of
participants lived in the southcentral region, 17.3% (n = 34) lived in the southeast
region, 14.7% (n = 29) lived in the interior region, 11.2% (n = 22) lived in the far north,
5.6% (n = 11) lived in the southwest. Three-fourths (74.1%, n = 146) of respondents
were from the southern part of the state.

84
Answer % Count
Southcentral 51.27% 101
Southwest 5.58% 11
Southeast 17.26% 34
Interior 14.72% 29
Far North 11.17% 22
Total 100% 197

85
SEED Registry and Learn & Grow
Q44 - Are you participating in the SEED Registry?
Most participants (86.7%, n = 170) of participants were participating in the SEED
Registry; 13.3% (n = 26) were not participating.
Q45 - What SEED Career Ladder level are you?
Of the respondents who participated in the SEED Registry (n = 170), the most common
SEED Career Ladder levels were Level 11 (16.7%, n = 27), Level 10 (16.1%, n = 26), Level
1 (14.8%, n = 24), Level 9 (13.6%, n = 22) and Level 6 (11.1%, n = 13). Table 2Q displays
participants’ median wage and mean years of experience by the SEED Career Ladder
Levels.
Answer % Count
Level 1 14.81% 24
Level 2 1.23% 2
Level 3 1.85% 3
Level 4 3.09% 5
Level 5 6.79% 11
Level 6 11.11% 18
Level 7 8.02% 13
Level 8 3.70% 6
Level 9 13.58% 22
Level 10 16.05% 26
Level 11 16.67% 27
Level 12 3.09% 5
Total 100% 162
Answer % Count
Yes 86.73% 170
No 13.27% 26
Total 100% 196

86
Table 2Q. Wage Analysis by SEED Career Ladder Level
SEED Career Ladder Level
Median hourly wage Median yearly salary Mean years of experience in the field
1 $14.15 $33,075.60 7.60
2 $12.38 $26,880.00 2.00
3 $20.00 $49,000.00 8.83
4 $10.88 $5,400.00 13.8
5 $13.50 $40,000.00 10.9
6 $14.00 $28,600.00 12.2
7 $15.00 $24,000.00 13.3
8 $17.62 $37,000.00 11.7
9 $20.50 $48,500.00 12.2
10 $25.94 $49,000.00 17.5
11 $28.68 $60,000.00 20.6
12 $34.80 $72,000.00 20.6
Q46 - Have you ever used the SEED professional development resources (e.g. CDA
application/renewal award, travel reimbursement, and/or professional
development reimbursement)?
Almost two-thirds (65.3%, n = 126) of participants had used SEED professional
development resources, while 34.7% (n = 67) had not.
Answer % Count
Yes 65.28% 126
No 34.72% 67
Total 100% 193

87
Q47 - Which resources did you use?
Of the participants who had used the SEED professional development resources (n =
126), 92 participants used professional development reimbursement, 49 participants
used CDA application and renewal awards, and 24 participants used travel
reimbursement.
Answer Count
CDA application/renewal award 49
travel reimbursement 24
professional development reimbursement 92
Total 165

88
Q48 - What was your experience with the SEED Registry? Please describe benefits
and challenges you have experienced.
Response n = 89
About 46% of the responses were positive.
o “They were awesome to deal with.”
o “I love that they are there to help us get the training that we need.”
o “The benefits are being in it and being able to use the registry as a building block
for your professional step ladder.”
About 15% of the responses showed satisfaction with the financial reimbursements.
o “I used the reimbursement for college classes. I was very pleased with the
benefits.”
o “Is a wonderful program I received in the past grants that help me a lot to paid
education and health.”
There were negative responses as well. About 12% of the responses were about
difficulty using the website/online application system.
o “It’s fine. Sometimes there are computer glitches that take extra calls and time
to work out.”
o “Takes too long to process applications, and the online submission always gives
errors.”
o “The interface is not user friendly, you have to "update" and renew annually,
hard to upload training, and the wait time for review and approval is long and
lengthy. There is no "purpose" to the SEED Registry.”
o “The portal is difficult and not user friendly; It takes an extremely long time to
get a response or get career ladder level. For instance I did my renewal in March,
I got an email my renewal was completed in late April and got the certificate in
May; Documents get lost and need resubmitted; There are only 2-3 people that
work for SEED doing all the work statewide; Back in late 1990's they had the
ROOTS awards statewide and it was automatic to participate when you turned in
your SEED application to be on the Registry.”
About 12% of the responses also showed difficulties with communicating with the SEED
registry staff as well as with the review and approval process.
o “The system is slow to respond. They seem understaffed.”
o “Not responsive...takes too long to get reimbursed.”
o “lack of timely responses, lack of timely paperwork, lack of timely
reimbursement and lack of professionalism when confronted with these issues.”

89
Q49 - Are you aware of the SEED Registry?
Almost all participants (98.5%, n = 195) were aware of the SEED Registry.
Answer % Count
Yes 98.48% 195
No 1.52% 3
Total 100% 198
Q50 - Why aren't your participating in the SEED Registry? (If not participating in
the SEED Registry)
Response n = 53
About 19% of the responses mentioned that they were not eligible to participate.
o “Complicated to keep up- and only assist if working directly with child care
program needs. I work with other programs.”
o “I am waiting until I am in a position that supports SEED.”
o “I work for the elementary school. The NPS district doesn't use SEED.” About 13% of the responses mentioned difficulty keeping up with the SEED
Registry.
o “I have a master's... and I stopped maintaining a license because licensing isn't
worth the headache. I still run with the same health and safety rules.”
o “It’s so much to fill out I have other priorities than filling out a database.”
o “Don't have time to update my registration.”
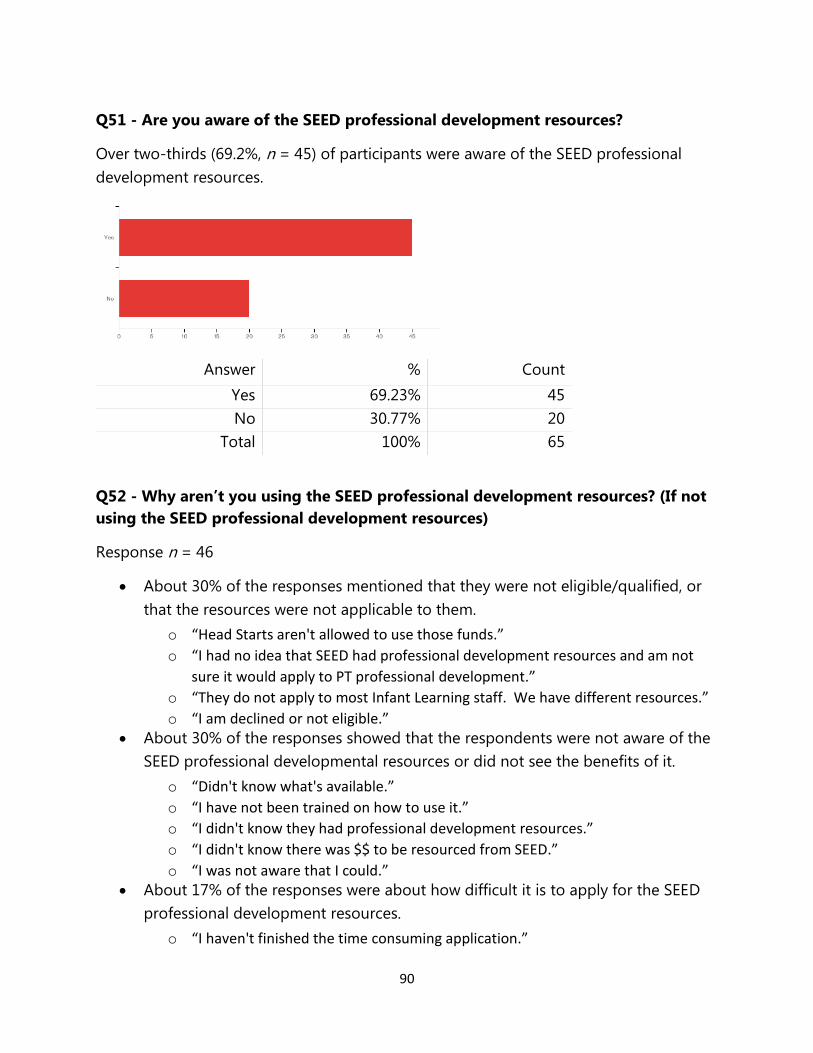
90
Q51 - Are you aware of the SEED professional development resources?
Over two-thirds (69.2%, n = 45) of participants were aware of the SEED professional
development resources.
Answer % Count
Yes 69.23% 45
No 30.77% 20
Total 100% 65
Q52 - Why aren’t you using the SEED professional development resources? (If not
using the SEED professional development resources)
Response n = 46
About 30% of the responses mentioned that they were not eligible/qualified, or
that the resources were not applicable to them.
o “Head Starts aren't allowed to use those funds.”
o “I had no idea that SEED had professional development resources and am not
sure it would apply to PT professional development.”
o “They do not apply to most Infant Learning staff. We have different resources.”
o “I am declined or not eligible.” About 30% of the responses showed that the respondents were not aware of the
SEED professional developmental resources or did not see the benefits of it.
o “Didn't know what's available.”
o “I have not been trained on how to use it.”
o “I didn't know they had professional development resources.”
o “I didn't know there was $$ to be resourced from SEED.”
o “I was not aware that I could.” About 17% of the responses were about how difficult it is to apply for the SEED
professional development resources.
o “I haven't finished the time consuming application.”

91
o “I haven't find time to meet deadlines.”
o “It’s too complicated. Too many moving parts to keep track of with all of my
staff. If it was something through the employer instead of the employer it would
be much better. The system that is in place now is not user friendly.”
o “Its too much of a hassle.”
Q53 - Is your program enrolled in Learn & Grow (Alaska’s Quality Recognition &
Improvement System)?
More than half of participants (50.3%, n = 91) reported programs that were enrolled in
Learn & Grow, and 49.7% (n = 90) reported programs were not enrolled.
Answer % Count
Yes 50.28% 91
No 49.72% 90
Total 100% 181
Q54 - Why did you choose to participate in Learn & Grow? What was your
experience? Please describe benefits and challenges you have experienced.
Response n = 64
About 30% of the responses said that they are participating to increase quality of care in
their programs and 16% said that they do it for the professional development.
o “After too many years providing child care services, I fall in love with the
profession and I want to be a professional early child care educator. The Learn
and Grow program is going to give me the opportunity to enrich my program
with all that new ideas and concepts about to be more than just child care
providers. My program is getting very good benefits I am learning a lot how to
see educational ways to help and improve my kids behaviors and how every kid
learn differently and how we can help them to take the best from them.
Obviously me have challenges and it is time, it is time consuming to remodel our
program; moving furniture, and changing items inside our home. It is about how
to run our program but worth it and I like it.”

92
o “Because they help me with the training. They helped me better the quality of
my care at my facility.”
o “It really teaches things that you never would have thought about.”
o “It had been awesome providing children with the best setting and conditions for
their learning. Knowing what is expected and complying with the best care
conditions is a great thing for our little ones.”
About 16% of the responses mentioned challenges with Learn & Grow.
o “Getting to Learn and Grow level 1 was pretty easy. However, Learn and Grow
level 2 is proving to be really hard. Getting our teachers trained in ECERS and
setting up their classrooms to be higher than ECERS 2.5 is a huge undertaking.
Furthermore, the fact that we have to have someone come to our facility for a
two-week period seems excessive. Meanwhile SEED hasn't revealed what Learn
and Grow Level three through five will be and it's been years.”
o “I feel like it hard for people that live in rural areas to participate.”
o “Initial program to get Learn and Grow started BUT our program will not
continue in Learn Grow. Levels are difficult to achieve and maintain with the
renewal process and staff turnover.”
o “More paperwork and more work for the office staff to track of at this point. I
haven't noticed a benefit at this point.”
o “We have to as part of Head Start requirements. I haven't seen any benefits from
being a part of it, and it was a pain to complete the requirements to get the level
we are at. Very time consuming for no perceived benefit.”
Q55 - Are you aware of Learn & Grow?
Nearly half (48.3%, n = 43) of participants were aware of Learn & Grow, while 51.7% (n =
46) were not aware of Learn & Grow.
Answer % Count
Yes 48.31% 43
No 51.69% 46
Total 100% 89

93
Q56 - Why aren’t you participating in Learn & Grow?
Response n = 39
Many of the responses said that they are working in a program types that are not
eligible (23%) or that their program chose not to participate (15%).
About 10% of the responses said that their program is under 1 year old and that they
were not eligible to participate. About 8% of the responses said that they were working
on getting in the program.
About 8% of the responses showed that it was too challenging to participate.
o “Ridiculous amount of training hours....even if I could do them I can't get
everyone in my program to do them. We have too much turnover and every
time we get a new admin or teacher, we have to start over.”
o “Doesn’t seem worth my precious time to go through all of that when I’m
already working 60 hours a week.”
Table 2Q provides further analyses on wage and benefits by Learn & Grow enrollment
status.
Table 2Q. Wage & Benefit Analysis by Learn & Grow Enrollment
Wage Analysis
Enrolled (n = 89)
Not enrolled (n = 86)
Median hourly wage $15.00 $22.85
Minimum hourly wage $0.00 $0.00
Maximum hourly wage $45.00 $51.89
Median yearly salary $32,000.00 $43,500.00
Minimum yearly salary $0.00 $0.00
Maximum yearly salary $90,000.00 $118,000.00
ONLY lead teachers
Enrolled (n = 14)
Not enrolled (n = 7)
Median hourly wage $14.00 $15.50
Minimum hourly wage $10.75 $10.50
Maximum hourly wage $20.00 $29.00
Median yearly salary $24,960 $31,000
Minimum yearly salary $1,000 $17,000
Maximum yearly salary $37,000 $42,060
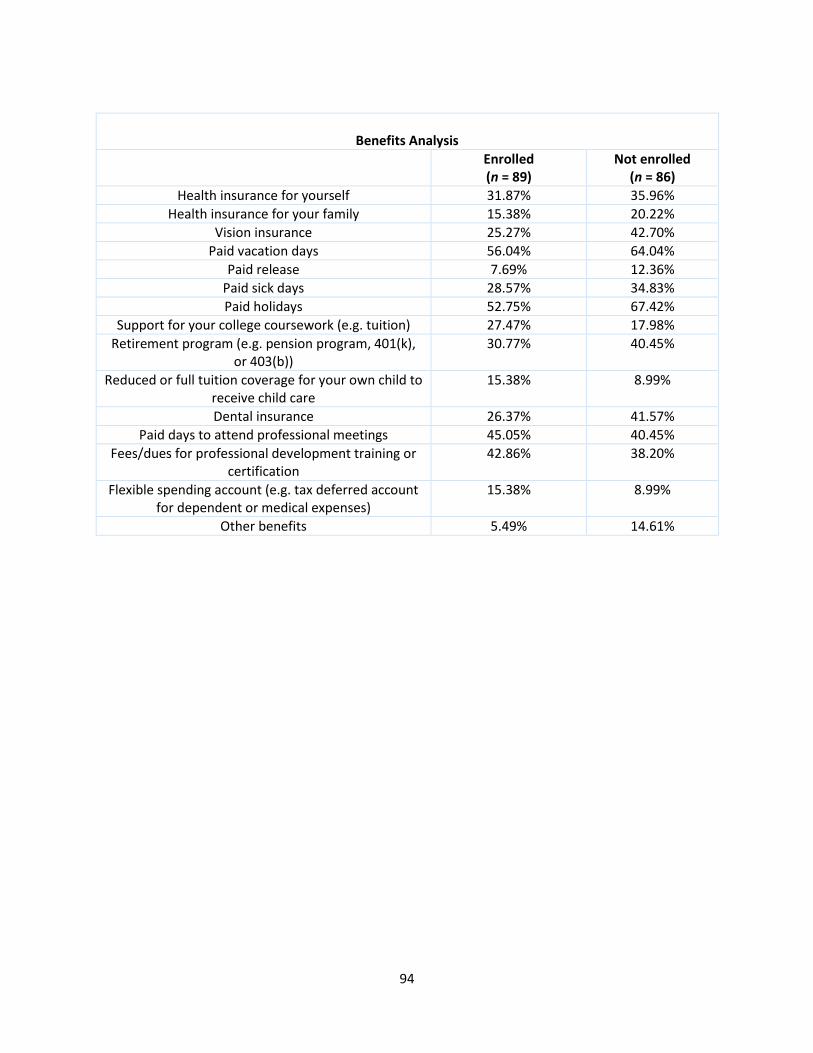
94
Benefits Analysis
Enrolled (n = 89)
Not enrolled (n = 86)
Health insurance for yourself 31.87% 35.96%
Health insurance for your family 15.38% 20.22%
Vision insurance 25.27% 42.70%
Paid vacation days 56.04% 64.04%
Paid release 7.69% 12.36%
Paid sick days 28.57% 34.83%
Paid holidays 52.75% 67.42%
Support for your college coursework (e.g. tuition) 27.47% 17.98%
Retirement program (e.g. pension program, 401(k), or 403(b))
30.77% 40.45%
Reduced or full tuition coverage for your own child to receive child care
15.38% 8.99%
Dental insurance 26.37% 41.57%
Paid days to attend professional meetings 45.05% 40.45%
Fees/dues for professional development training or certification
42.86% 38.20%
Flexible spending account (e.g. tax deferred account for dependent or medical expenses)
15.38% 8.99%
Other benefits 5.49% 14.61%

95
Thoughts and Opinions of Compensation
Teachers and Other Staff
Q57- What are your current financial challenges related to staying at your job?
Response n = 114
More than half of the responses mentioned low salary and paying for living expenses
are financial challenges to staying at their job (56%).
o “Having enough to pay all my bills.”
o “Hourly wage and hours worked do not pay enough to meet my monthly
expenses.”
o “I depend on my spouse's income to survive.”
Other concerns included health insurance (11%), loan/debt/mortgage (10%), and
retirement/savings (9%).
o “Health insurance cost and then the lack of coverage benefits and the high
copays. We pay a great deal into a health benefit plan that doesn't cover much
and what they do barely cover, is still more than I can afford. Going to the
doctor twice in one month is 90$ just for the two visits and then the extra copay
that my insurance doesn't cover. I am too broke to be sick. It is too expensive.
At a previous employment the pay was less, but the benefits were much better
and at a much much lower monthly cost.”
o “No health insurance in my current position. I took a $3 pay cut to move back
into the classroom after working in the kitchen for a year.”
o “Paying my bills, paying student loans and trying to save money for both
retirement and my savings account.”
o “Paying for graduate school, unable to buy house, or save anything substantial
with cost of living in Anchorage.”
Q58 - What pay and reward strategies and practices does your school/center have?
How has this influenced your motivation and engagement at your job?
Response n = 104
A quarter of the responses said that they do not have any reward strategies or practices.
o “We do not currently have any. My manager tried to get us raises but was turned
down by senior leadership.”
o “We don’t have any reward strategies.”
o “They don’t really have a reward system in place it’s even hard to just get
vacation.”

96
o “There are no rewards strategies towards employees that excels at their jobs.”
About 12% of the responses mentioned bonuses.
o “Once a year we get a $20 prize near our date of hire. There are also yearly staff
awards from peers, and they print out complimentary remarks on your
certificate. Not everyone gets one though.”
o “Recognition awards, small prizes for annual retention, education and training
cost coverage.”
o “There is a bonus twice a year for classrooms that perform well on standardized
tests. This motivates me to ensure that kids understand the material and can
perform well on tests.”
o “We get a small bonus around Christmas based on years worked, and they assist
us in accessing grants/other bonuses such as the Hearts bonus. I was motivated
to continue my education in order to qualify for the Hearts bonus, and continue
to work on improving. But it’s still not enough.”
About 12% of the responses said that they had rewards for advancements such as
professional development, educational degree, and CDA. About 11% of the responses
said that they had paid days (e.g., holidays) and paid time off.
o “Admin pay, PTO, 12 paid holidays, spring and winter break... PAID training and
professional development opportunities.”
o “More credits= more pay. This has influenced my motivation to get more
continuing education credits for higher pay.”
o “Good amount of PTO, professional development money and time off; These are
not given as rewards, but part of the contract. I'd be motivated and engaged
without as well, but they help to compensate the lower salary.”
o “I can cash in my paid leave, and I get pay increases as I attain more college
courses. It definitely helps me feel treated to have these types of
compensation.”
o “My work offers valuable retirement plans, great flexibility and PTO, excellent
professional development opportunities.”
Q59 - What would help you to be more productive and provide higher quality
service?
Response n = 103
About 32% of the responses mentioned higher salary or pay.
o “It would be wonderful to have a higher salary and also either more sick days
and/or personal days to schedule my own doctor/dentist, etc., appointments.”
o “Knowing that I do not have to stress about paying my bills.”
About 15% of the responses said that they would like to have more training.
o “Trainings that are useful to teachers who have been in the field for a long time.”

97
o “UAA and distance ed needs to maintain and support programs focused on early
childhood education. We can't expect to have high quality staff in any area of
early childhood development if we can't have access to the appropriate degree
programs.”
o “More influence on my work and how I do my job, more meaningful professional
development opportunities, Opportunities for advancement, more personal
leave, less unpaid evening and weekend work, more pay and opportunities to
work on topics that I personally find interesting and that match my skills.”
About 13% of the responses said that they would like to have more respect and support
from the administration or in general.
o “Feeling like the leadership really cares.”
o “If management made an effort and acknowledge what a good job staff did and
noticed the ones that did showed up to work.”
Q60 - If you could change one thing in the current compensation system in
ECE/SA, what would you change and why?
Response n = 95
About half of the responses mentioned better pay.
o “Raise pay rates to match similar education and experience levels in other
industries.”
o “I would hope that one day it would be a field that’s not only appreciated by the
parents, but on a bigger more recognized level so that ore funding would be
available for higher pay and benefits.”
o “I would advocate for better compensation and recognition for teachers because
I know how hard they work. I know that to provide quality service, teachers work
hours outside their hourly compensation. I do as well, but am also aware that
doing so violates wage and labor laws so all do it in silence out of love and
passion for children.”
About 9% of the responses said that they would like to have experience and
performance included in the wage scale.
o “Build in experience to the wage scale.”
o “Have a better way of deciding a fair pay for employees by taking into
consideration either education or experience PLUS performance.”
o “Compensation, SEED levels, and promotions are based on educational degrees.
I'm good at this work. I can show that I am. But I can't move because I don't
have a degree and have neither the time nor the money to pursue one. I feel
that access to a college education is a white, middle-class privilege. I didn't get
it. But I am smart, hardworking and good at my job. I would love good training.
I would love to take classes if I had the time and money.”

98
Q61- What do you think early childhood and school-age educators' perceptions
are towards their compensation?
Response n = 100
A majority of the responses (68%) showed that they feel underpaid and undervalued.
o “To me, it tells me how little value our country has for early child education, and
for the people who work in the field. Our system runs on monetary value, and
they’ve decided we don’t have any.”
o “I think many of us have resigned to the fact that our jobs will always be
underpaid and under- valued. We do it, in general, because we are naturally
adept in this area and we love it. We understand that we can make a difference
in a child's life.”
o “The stigma still exists that ECE teachers are not real teachers and do not get
paid as much.”
o “They are not getting paid enough. It is hard to keep quality workers.”
o “I think we are used to it but all acknowledge we deserve more for our level of
education, countless hours of work, and commitment to the job.”
Q62 - Do you think that staff retention will be increased in the field of early
childhood or school-age education if early childhood and school-age educators
get paid better?
Response n = 110
Most of the responses (90%) said yes–that they believe higher pay will increase staff
retention. (Only 3% said no, and 4% said that it would, but that staff retention does not
solely rely on pay.)
Of the responses that said yes, 42% said that higher pay will help teachers to afford to
stay—that less stress about financials at home would help them commit to the work
more and to show better performance.
o “Yes, people can afford to stay and work without getting a 2nd job to cover
expenses.”
o “Yes, because it will improve their income households, the level the stress will be
reduce and they can get more opportunities to get higher education.”
o “Yes, because we work so hard with little monetary reward. When you are
stressed about your financials, you can't help but to focus on going elsewhere
regardless of where your heart is.”
Of the responses that said yes, 23% said that higher pay would mean more respect
towards child-care work and that the teachers would be valued in the community for
the work they do.

99
o “Yes- because I think there is a lack of respect for Early Childhood educators by
those who do not understand the importance of ECE for young children. Many
equate it to baby-sitting which it most certainly is not.”
o “Yes- I think that adequate compensation will support educators toward viewing
themselves as professionals and increased compensation allows administrators
to raise the bar in terms of quality, professionalism and expectation. This will
also support the view of early childhood educator as a profession in the broader
view.”
o “Yes. Many educators work very, very hard and get emotionally drained. It feels
good to have a pay check that feels like you are worth the work you do for
others.”
o “Yes. Indication of value placed on their skills.”
Administrator, Director, or Owner
Q63 - What are the steps and timeline for hiring a new teacher when somebody
leaves the job?
Response n = 46
The responses varied as to how long it takes to hire a new teacher from 2 weeks to one
year.
The steps included: posting the job/advertising, conducting the interviews, checking
references, background-checks, paperwork, hiring, and orientation and training.
Respondents expressed challenges regarding each step of hiring a new person – that it is
hard to find a right person, that it is time-consuming to do interviews with candidates,
and that it was hard for them to wait for background checks.
Q64 - How much does it cost to replace a teacher? Please describe.
Response n = 41
Some participants (n = 23) mentioned specific dollar amounts for hiring process.
o “$30.00 BCP, $110.00 CPR/First Aid, $15.00 Training time, Cost of Advertising
$100.00.”
o “Cost of fingerprinting $30, cost of processing fingerprints $25–75, cost of online
training $15–60, cost of extra staff during training process $200–250.”
Others mentioned costs directly related to hiring as well as indirect costs or costs that
are unmeasurable.
o “Since our teaching staff is unionized, and our hiring procedures take so long,
our costs are high. We often have to pay subs to cover open positions while this
process is happening.”

100
o “This varies greatly depending on how long the position is open for. You have the
fees for running the ad in the paper and other locations. Then you have OT hours
paid to current employees. It all depends on how long it takes. But some of the
things that can't be measured in dollars is the wear and tear it takes on current
employees when staff turnover. You have the extra workload of another person,
but then you have the child behaviors/relationships that are affected.”
The dollar amounts ranged from $50 to $5,000, with the mean of $896.
Q65 - What would motivate teachers to stay in terms of compensation?
Response n = 44
About 70% of the responses mentioned higher pay and about 45% of them mentioned
better benefits.
o “Better benefits and competitive wages. Ability to actually use time off.”
o “Higher pay and retirement. Most of our young teachers leave to work in a
different field that pays significantly more. We had a marvelous teacher quit to
be a manager at McDonald's.”
o “Salaries commensurate with the public school sector.”
Q66 - What challenges do you experience when a teacher leaves a job?
Response n = 44
Almost half of the responses mentioned difficulty finding a qualified and committed
person.
o “Finding a good employee that will stick around for longer than 6 months.”
o “Finding quality staff with some experience. Most people are just working until
they find a better job with pay and benefits.”
o “Finding staff qualified and willing to work nontraditional hours. Covering ratios
until new staff can be hired in a small closed Community.”
o “Recruiting qualified staff is very difficult. It has taken months to replace staff.”
About 32% mentioned difficulty operating the program understaffed. Having to keep up
with ratio means having to ask remaining teachers to work overtime, or the director
him/herself needs to cover the class, or to withdraw children for ratio.
o “Shortage of teachers to meet ratios.”
o “We can’t make ratio and other teacher are stretched thin and asked to stay
longer.”
o “Administrators cover class time, overtime for staff, lengthy process to re hire,
shift in stability for children and teachers.”
o “Over ratio, need to withdraw children to meet licensing regulations.”

101
About 20% said that when a teacher leaves, there are negative influences on children,
families, and teaching staff.
o “Emotional back lash from the teachers, children, and parents, longer work
hours and more work load.”
o “Negative attitude that creates waves to other staff staying employed.”
o “Often the teacher has great relationships with parents. When they leave its'
very hard on parents for the transition into a new teacher”
o “Stresses other staff; breaks attachments with children.”
o “The inconsistencies with the teachers and the kids left behind, finding a person
that is qualified and won't leave”
Q67 - What kind of support would you want to receive from thread, SEED, Learn &
Grow, or the State when turnover happens?
Response n = 40
Most of the responses mentioned support with finding qualified candidates. About 13%
said that they wanted more qualified individuals, and about 33% specifically mentioned
that they would like a list or pool of qualified teachers.
o “More qualified applicants to choose from.”
o “List of qualified applicants.”
o “Maybe a floater pool of emergency backup staff since hiring takes so long; new
hire compensation for labor.”
o “WE would love to use thread as a teacher clearinghouse instead of a website
like Indeed. If thread could have files of teachers looking for work it would be an
amazing system. Especially if teachers have profiles through thread that parents
can look up.”
o “Have a database of possible candidates or seeking individuals that are already in
the background check system. Advocate for us to get paid more subsidy for
families who receive assistance so we can actually offer better pay to future
employees.”
o “A pool of applicants to draw from would be beneficial. A centralized location for
all of the new training requirements to make that process easier.”
Q68 - If you could change one thing in the current compensation system in
ECE/SA, what would you change and why?
Response n = 37
More than half of the responses mentioned higher pay (57%) and about 22% said better
benefits.
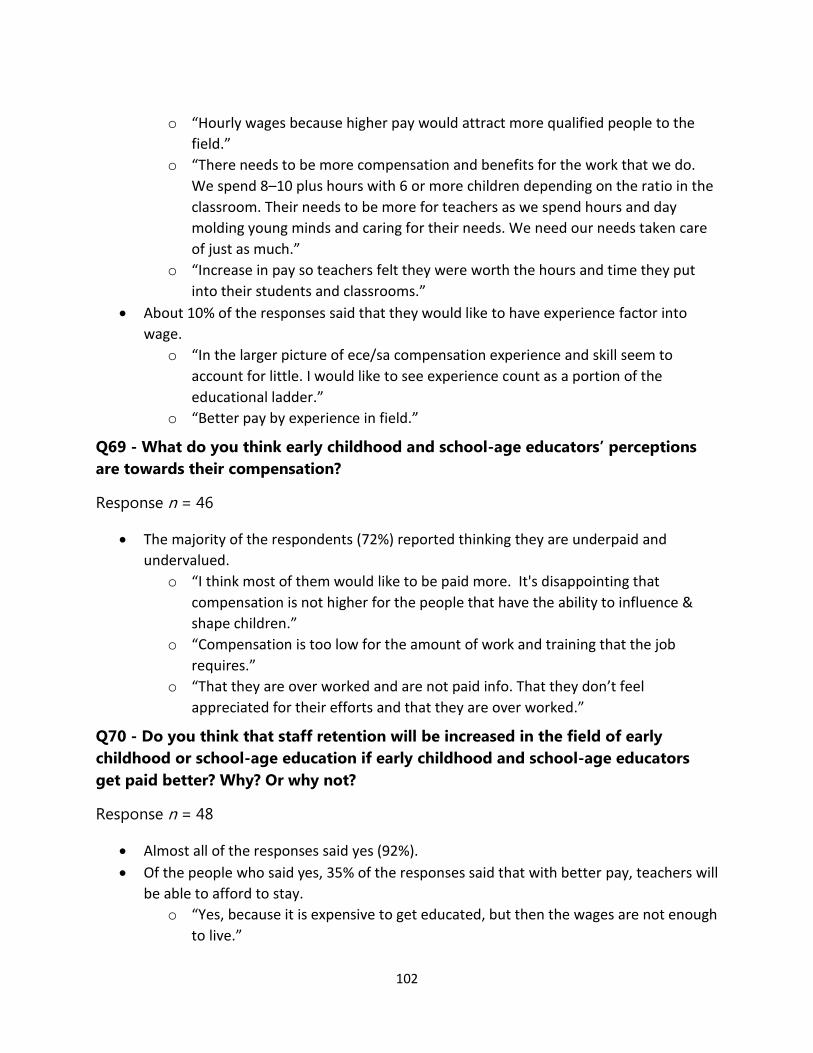
102
o “Hourly wages because higher pay would attract more qualified people to the
field.”
o “There needs to be more compensation and benefits for the work that we do.
We spend 8–10 plus hours with 6 or more children depending on the ratio in the
classroom. Their needs to be more for teachers as we spend hours and day
molding young minds and caring for their needs. We need our needs taken care
of just as much.”
o “Increase in pay so teachers felt they were worth the hours and time they put
into their students and classrooms.”
About 10% of the responses said that they would like to have experience factor into
wage.
o “In the larger picture of ece/sa compensation experience and skill seem to
account for little. I would like to see experience count as a portion of the
educational ladder.”
o “Better pay by experience in field.”
Q69 - What do you think early childhood and school-age educators’ perceptions
are towards their compensation?
Response n = 46
The majority of the respondents (72%) reported thinking they are underpaid and
undervalued.
o “I think most of them would like to be paid more. It's disappointing that
compensation is not higher for the people that have the ability to influence &
shape children.”
o “Compensation is too low for the amount of work and training that the job
requires.”
o “That they are over worked and are not paid info. That they don’t feel
appreciated for their efforts and that they are over worked.”
Q70 - Do you think that staff retention will be increased in the field of early
childhood or school-age education if early childhood and school-age educators
get paid better? Why? Or why not?
Response n = 48
Almost all of the responses said yes (92%).
Of the people who said yes, 35% of the responses said that with better pay, teachers will
be able to afford to stay.
o “Yes, because it is expensive to get educated, but then the wages are not enough
to live.”

103
o “Absolutely! Most of our teachers cannot afford to live comfortably with what
they make. They are living paycheck to paycheck and it is not sustainable for
them. They are one emergency away from going into debt, because they are
unable to build a nest egg.”
o “Absolutely. They would be less stressed about monthly bills and benefits and
more able to stay in positions and have better positive experiences caring for the
children.”
o “Yes, in many cases/communities wages in ECE are not a living wage. Staff often
hold two jobs to make ends meet. That leads to more stress and dissatisfaction.”
Of the people who said yes, 23% of the responses mentioned that higher pay will help
teachers feel valued and appreciated as a professional, and thus increase retention.
o “Yes, because more teachers would see their meaning and the appreciation that
employers have for the career choice and dedication.”
o “Yes, sense of worth.”
o “Yes, because we are raising our new generation of the future of our society. We
deserve better pay.”
o “Yes. It would feel like a real job not just a gig you do before you get your career
jobs.”

104
2. Educators In-Depth Interviews
Study Method
At the end of the Alaska Early Childhood and School-Age Educators Wage and
Compensation Survey described in the first session of this chapter, we invited the
participants to participate in a follow-up interview or focus group. People who were
interested in a follow-up study were asked to leave their contact information. We
received 288 survey responses (more than 33% of the survey completion) and 91 of the
participants were willing to participate in a follow-up interview or focus group. We
randomly selected 12 participants for 30-minute follow-up interviews. The research
team conducted interviews in June and July 2019.
Descriptive Summary of Interview and Participants
We conducted 12 interviews with early childhood or school-age educators in Alaska. Six
interviewees were administrators/directors and six were teachers. We used two different
sets of questions based on the participant’s position type—one set of questions for
administrators/directors and one set for teachers. Interviewers followed an interview
script and took notes throughout the interviews. All participants agreed to have their
interview recorded. Interviews with teachers took around 35–40 minutes, while
interviews with administrators and directors tended to be slightly longer, around one
hour each.
Feedback on thread, SEED, and Learn & Grow
The majority of interviewees said that they were aware of thread, SEED, and Learn &
Grow. Five teachers and four administrators/directors said that they used SEED. Two
teachers and four administrators/directors reported using Learn & Grow. However,
many teachers were not familiar with the types of support offered by SEED and Learn &
Grow. Teachers often reported that they were unaware of the benefits available to them
through SEED and Learn & Grow, and some indicated that it took months or years for
them to find out what benefits were available.
Overall, the greatest benefit reported by administrators/directors and teachers for
participating in SEED and Learn & Grow was the funding provided for Professional

105
Development (PD) activities. Interviewees appreciated receiving funding for PD activities.
However, many educators shared that they often did not receive funding or
reimbursement directly, but rather that it was funneled through their program. One
administrator/director reported that he put the funds he received into the operating
budget for his program because he could not rely on it.
Many educators felt that the process of applying for SEED and Learn & Grow was
difficult and complex. It was also challenging for many programs to navigate the process
of applying and keeping profiles updated given the high rate of staff turnover. Many
interviewees reported that this was a laborious process and that it did not seem worth
their time and effort. Interviewees also reported a lack of communication and
understanding of the requirements for maintaining their participation in SEED and Learn
& Grow, and many felt that their experience and/or educational background were not
given enough weight. Many interviewees said that thread provided good program
support for staff, particularly regarding challenging behaviors and disabilities among
their students.
Overall, greater support and communication, as well as a streamlined process for
registration, would be beneficial.
Program Support (Teachers)
Many teachers voiced concern over inadequate wages and benefits. All but one teacher
(who had retired from the school district and was now working in early childhood
education) said they were paid low wages. One teacher reported needing to work two
jobs to support herself. The teacher who was retired stated that she was only able to
cover her living expenses because of her retirement benefits.
Many teachers mentioned the need for medical insurance, paid vacation/time off, and
reimbursement for classroom supplies. Only two teachers worked at centers that
provided benefits, such as insurance and paid time off. In addition to the stress of their
jobs, teachers reported feeling stressed due to a lack of substitutes who could cover
their responsibilities if they took time off. Many teachers expressed that they did not feel
like they could take time off because there was no one to cover for them. A lack of
benefits, adequate wages, and support may have contributed to a high turnover rate
among these teachers, with one-third (n = 2) of teachers interviewed reporting that they

106
had recently left their program. Teachers voiced that they were “underpaid and
undervalued”.
All teachers interviewed had received some type of professional development (PD). For
the most part, teachers had to pay for their own trainings, and only one teacher
reported being reimbursed for the cost of trainings.
Compensation System Examples
All 12 interviewees expressed an interest in incorporating a compensation system into
Alaska early childhood and school-age education. Four existing compensation systems
were presented to the participants: Louisiana School Readiness Tax Credits, Child Care
Wage$, T.E.A.C.H., and C-WAGES. Overall, T.E.A.C.H. and C-Wages were the most well-
liked among the participants, with many believing that these systems would be
beneficial in Alaska if they could be adjusted to accommodate Alaskan educators’
unique needs.
T.E.A.C.H. is a compensation system that provides funding for educators to obtain
college-level education, with bonuses and/or raises offered after completing
coursework. Many interviewees liked this idea and also had questions about how it
could be adapted for Alaskan educators. For example, how would this be applied to
rural educators with limited access to educational resources? Would classes be offered
online?
C-WAGES was another program that was desirable to interviewees. C-WAGES provides
compensation and benefits to teachers who work in QRIS-participating programs in
low-income areas. Many teachers liked the idea of being provided incentives and
benefits for their work with children from low-income families.
The other two programs mentioned—Louisiana School Readiness Tax Credits and Child
Care Wage$--had mixed results among participants. Many educators noted that a
system like the Louisiana School Readiness Tax Credits would be difficult to implement
in Alaska since Alaska does not have a state tax.

107
Wage System
Teachers
Teachers wanted both education and experience to be considered when creating an
equitable wage system. Most of the teachers felt their experience was not rewarded.
One teacher mentioned that a recently hired new teacher with higher education was
paid more despite far less experience at the program. Although teachers did not
discount the importance of considering education when deciding on a wage system,
most teachers thought that experience should be considered more than it currently is.
Administrators/Directors
Administrators and directors suggested that the minimum wage for early childhood and
school-age educators should be $15.00-$17.00/hour. Some interviewees suggested that
the state help fund this increase. Some administrators/directors said it was important to
provide competitive wages and benefits similar to other organizations (e.g., Costco,
public schools, etc.) in order to reduce turnover among educators and staff.
Administrators/directors thought that both education and experience were important to
consider when creating a wage system for educators. The minimum benefits that
administrators/directors thought should be provided were paid time off (vacation/sick
leave) and paid time for professional development. Interviewees also said that providing
health benefits would be beneficial. All but one interviewee thought that bonuses for
teachers when they completed courses would be beneficial and would motivate and
encourage teachers to complete more education. Some expressed concern about how
they would be compensated for these bonuses and if this would work for all program
types (non-profit, for-profit, non-traditional programs, etc.).
Hiring Support (Administrators/Directors)
Administrators and directors reported a number of challenges with the recruitment and
hiring process. Background checks were one of the most frequently reported problems,
and many interviewees reported that the state’s system for completing a background
check often took two to three weeks. Finding qualified candidates who already had a
background check was difficult for many interviewees. Providing orientation for new
hires and completing the required trainings also took an additional week. For the most
part, the interview process was not a concern for administrators and directors. Many
programs already had existing policies and procedures in place to guide the interview

108
process. Administrators and directors noted that it was challenging to keep up with the
state’s changing requirements, especially when they were expected to comply with these
requirements immediately. Confusion about changing requirements particularly affected
the hiring process, since background checks and orientation needed to be completed
prior to a new teacher entering the classroom.
Another challenge that administrators/directors mentioned was finding substitutes. They
strongly agreed that having a pool of candidates to use as substitutes or possibly hire
would be helpful. Several teachers also mentioned this.
Administrators/directors offered several suggestions for how the state can help with
some of these challenges: streamline and complete background checks in a timely
manner, create an online list of vetted substitutes, and create forums to find qualified
candidates. Another suggestion was to provide professional development to early
childhood and school-age programs, similar to school districts. These would be half-
day training sessions. Lastly, many administrators/directors voiced their desire for the
state and for parents to treat their teachers and staff as educational professionals, rather
than babysitters.
Program Policy (Administrators/Directors)
As mentioned previously, administrators/directors agreed on the importance of
providing paid time off. However, this was often difficult to fund, especially when this
meant that they needed to keep a pool of substitutes available who had already
completed background checks and required trainings. Even when
administrators/directors were able to find suitable substitutes, they often lost the
substitutes to other jobs. In addition, hiring extra staff would decrease wages for all
staff.
Professional development (PD) was mandatory at most programs, so many employees
did not necessarily see it as a benefit. Most programs offered some sort of PD, but the
way in which teachers were reimbursed for their time and how PD was offered varied
among programs. Many administrators/directors were frustrated with the changing PD
requirements and said that it would be helpful if the State did not change the
requirements as often as they do now.
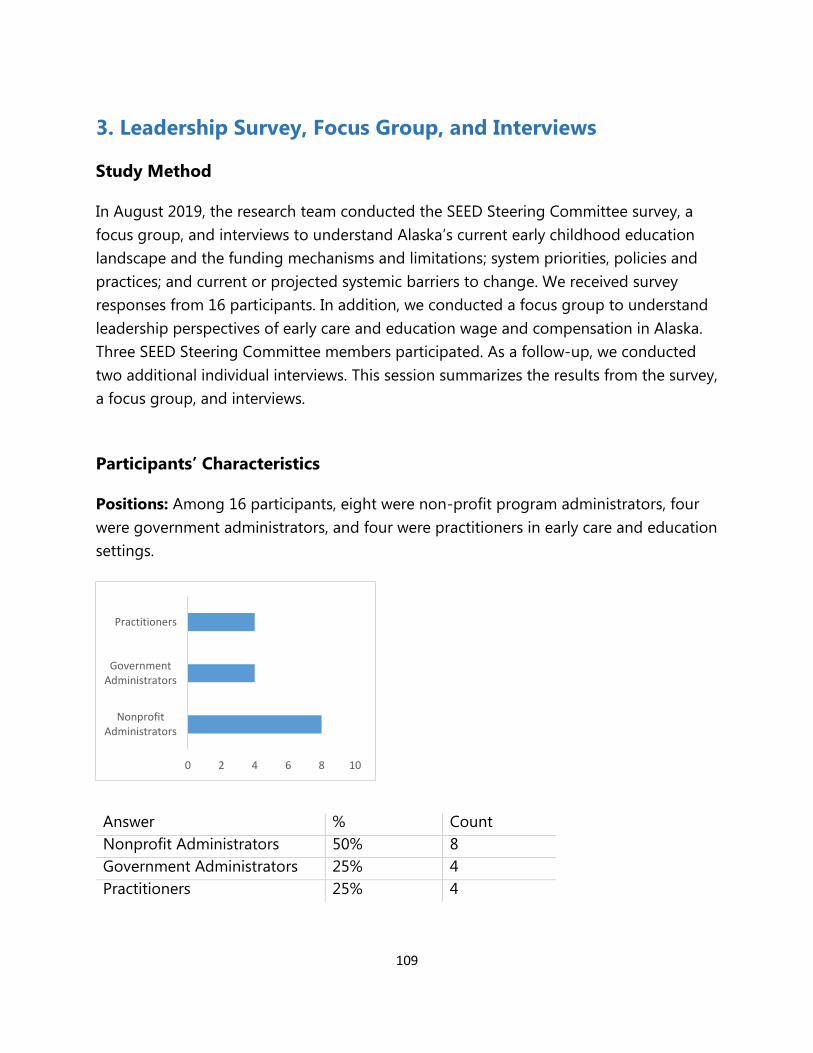
109
3. Leadership Survey, Focus Group, and Interviews
Study Method
In August 2019, the research team conducted the SEED Steering Committee survey, a
focus group, and interviews to understand Alaska’s current early childhood education
landscape and the funding mechanisms and limitations; system priorities, policies and
practices; and current or projected systemic barriers to change. We received survey
responses from 16 participants. In addition, we conducted a focus group to understand
leadership perspectives of early care and education wage and compensation in Alaska.
Three SEED Steering Committee members participated. As a follow-up, we conducted
two additional individual interviews. This session summarizes the results from the survey,
a focus group, and interviews.
Participants’ Characteristics
Positions: Among 16 participants, eight were non-profit program administrators, four
were government administrators, and four were practitioners in early care and education
settings.
Answer % Count
Nonprofit Administrators 50% 8
Government Administrators 25% 4
Practitioners 25% 4
0 2 4 6 8 10
NonprofitAdministrators
GovernmentAdministrators
Practitioners

110
Alaskan Pipelines for EC Workforce: To understand the landscape of Alaska’s pipelines
for early care and education workforce, we asked whether a participant provides
education and training for early care and education workforce. Half of participant
reported that they are providing education and training.
Answer % Count
Yes 50% 8
No 50% 8
Amount of Control over ECE Wage Compensation Policy: We asked participants how
much control they have over the policy of childcare providers’ wage, compensation, and
benefits. On a 5-point Likert scale, 35% of participants responded that they have control
to a great extent.
0 2 4 6 8 10
Yes
No
0 1 2 3 4 5 6 7
Not at all
Very little
Somewhat
Moderately
To a great extent

111
Answer % Count
Not at all 18% 6
Very little 18% 3
Somewhat 12% 2
Moderately 18% 3
To a great extent 35% 3
Knowledge of the SEED Registry and Learn & Grow: We asked participants how
much they are knowledgeable of the benefits of participation in the SEED Registry and
in Learn & Grow. Most of participants were knowledgeable of the SEED Registry and
Learn & Grow.
Answer % Count
SEED Registry
Moderately Knowledgeable 19% 3
Very Knowledgeable 44% 7
Extremely Knowledgeable 38% 6
LEARN & GROW
Moderately Knowledgeable 50% 8
Very Knowledgeable 25% 4
Extremely Knowledgeable 25% 4
*Note. No participants reported that they are not knowledgeable of the SEED Registry or Learn
& Grow.
Wage and Compensation Priorities
Using the same job-related factors asked in the educators’ survey (Q33), we asked
leadership survey participants to rank their organization/program’s priorities on each
type of compensation from their leadership perspective. We noted in the question that
“the list are the types of compensation that contribute to the performance, motivation,
and overall well-being of the childcare workforce. While one may wish to provide all
types of compensation, there are also competing demands and priorities when
allocating limited funds.”
*Participants’ specific comments on their responses are described in Appendix 2B.

112
Table 2R. Leadership Priorities
Rank Full-time
status
On-site training support
Opportunities to advance
Higher salary
Health insurance
Paid planning
time
Paid vacation
days
Paid sick leave
Paid PD activities
Support for college
coursework
On-site free/
subsidized services
Job stability
1 3 1 0 7 0 0 0 0 0 1 1 4
2 2 0 1 2 7 1 0 1 1 0 0 2
3 1 0 2 3 4 0 2 2 1 1 0 1
4 3 2 0 1 2 0 5 0 2 0 0 2
5 1 4 1 1 0 2 0 7 0 1 0 0
6 1 0 5 0 2 1 4 1 2 0 0 1
7 0 3 2 1 0 0 1 2 2 4 1 1
8 2 4 2 0 0 6 1 0 0 1 0 1
9 1 1 3 1 0 3 2 0 5 0 0 1
10 0 1 1 1 2 0 1 2 4 3 2 0
11 2 1 0 0 0 3 1 2 0 4 2 2
12 1 0 0 0 0 1 0 0 0 2 11 2
Percentages of being high, mid, and low priority for each item (Rank 1 to 4 = “high”; Rank 5 to 8 = “mid”; Rank 9 to 12 = “low”)
Rank Full-time
status
On-site training support
Opportunities to advance
Higher salary
Health insurance
Paid planning
time
Paid vacation
days
Paid sick leave
Paid PD activities
Support for college
coursework
On-site free/
subsidized services
Job stability
High 53% 18% 18% 76% 76% 6% 41% 18% 24% 12% 6% 53% Mid 24% 65% 59% 12% 12% 53% 35% 59% 24% 35% 6% 18% Low 24% 18% 24% 12% 12% 41% 24% 24% 53% 53% 88% 29%
Sum of weighted scores (Rank 1 = 12 points; rank 12 = 1 point) and the order of summed weighted scores for each type of compensation
Rank Full-time status
On-site training support
Opportunities to advance
Higher salary
Health insurance
Paid planning time
Paid vacation days
Paid sick leave
Paid PD activities
Support for college coursework
On-site free/ subsidized services
Job stability
Weighted 129 109 111 166 155 83 117 116 97 78 39 126
Order 3 8 7 1 2 10 5 6 9 11 12 4

113
Priorities in Pay Structure
We found from the educators’ survey that educators value years of experience and they
would like to see this in pay scale. We asked the same questions (Educator Survey Q30
items 13 and 14) in the leadership survey to understand leadership perspectives. The
below questions were asked using a 5-point Likert scale (1 = strongly disagree; 5 =
strongly agree).
Do you believe that the pay for EC and SA educators should be structured by education and training?
Do you believe that the pay for EC and SA educators should be structured by years of experience in early care and education?
We combined strongly disagree and disagree into the disagree category below and
strongly agree and agree into the agree category. More than 80% of participants
strongly agreed or agreed that both experience and education should be structured in
the pay for EC and SA educators.
Descriptive statistics for each priority
Item Mean SD N N Agree N Neutral N Disagree
Education and training 4.06 1.09 17 15 0 2
Years of experience in ECE 4.06 .66 17 14 3 0
0 2 4 6 8 10 12 14 16
Years of experience in ECE
Education and training
Disagree Neutral Agree

114
We also compared educators’ and leadership opinions about pay structure. All groups
were favorable of having years of experience and education and training in pay
structure. However, administrators and lead teachers valued years of experience more
than education and training; and leadership survey participants and assistant teachers
valued education and training more than years of experience.
One Thing to Change in the Current Compensation Model
We asked, “If you can change one thing in the current compensation model, what would
you change and why?” Nine participants left valid responses about things to change in
the current compensation model. They believed that the compensation model should:
Account for years of experience in the compensation scale,
Account for differences in cost of living across the state,
Increase merits and bonus pay, and
Balance wages for family- and center-based programs.
*More detailed responses are provided in Appendix 2B.
3.6 3.7 3.8 3.9 4 4.1 4.2
Years of experiencein early care and education
Education and training
Leadership Administrator Lead teacher Assistant

115
Skills and Qualifications Required for ECE Workforce
We asked a series of questions about what skills and qualifications are required for each
of the key roles below in childcare programs and practice. We summarized the results
by the roles below.
Lead Teachers
Eleven participants provided their opinions about skills and qualifications for lead
teachers.
About 65% of participants believed that certain levels of ECE education and training are
required for lead teachers. Specifically, a number of respondents mentioned that lead
teachers should have BA, AA, and/or CDA, preferably BA than AA. Approximately 45% of
the respondents described particular skill sets required for lead teachers, such as
communication skills, ability to care children, classroom management skills and
supervision skills for assistant teachers.
Assistant Teachers
We received 11 responses of participants’ opinions about skills and qualifications
required for assistant teachers.
Among 11 participants, 36% believed either AA and/or CDA is required for assistant
teachers, and 1 person believed that those who are working toward CDA are qualified to
become an assistant teacher. Respondents believed that assistant teachers need skills
similar to lead teachers. However, they emphasized the ability to work as a team for
assistant teachers, instead of the supervision skills.
Family Child Care Providers
There were 9 valid answers for skills and qualifications required for family child care
providers.
One third of the respondents mentioned that AA and/or CDA is required for family child
care providers. Unlike lead or assistant teachers, family child care providers were
expected to have administrative and organizational skills as well as basic knowledge and
skills about child development.
Directors/administrators
Eleven participants shared opinions about skills and qualifications for
directors/administrators.

116
About 20% of the participants suggested that BA is required for directors and
administrators. Respondents emphasized administrative and organizational skills for
directors and administrators. Particularly, they believed that budgeting and grant writing
skills are important for directors and administrators.
*The raw data are provided in Appendix 2B.
Perceptions of Ongoing State Resources
We asked participants’ perceptions of ongoing state resources, such as the SEED
Registry and Learn & Grow.
SEED Registry
Incentives for participating in the SEED Registry
Fifteen respondents shared their understanding of incentives for participating in the
SEED Registry.
About 50% of the respondents understood that the SEED Registry provides financial
support for education and training to its participants. Approximately 30% of the
respondents understood that the SEED Registry helps to track professional progress in
ECE field.
Most of the respondents had some level of understanding that the SEED Registry
support training, professional development and education in ECE, which can lead to
improved wage and job stability.
Recommendations for the SEED Registry
There were 10 participants who provided valid recommendations for the quality
improvement of SEED Registry. The respondents recommended the SEED Registry to:
Communicate more with users and address true needs of its participants,
Improve the system to be more user friendly,
Have more flexibilities in moving up the ladders, and
Speak for ECE practitioners in policymaking and public relations.

117
Learn & Grow
Incentives for participating in Learn & Grow
Twelve of the participants shared their understanding of the benefits of participating in
Learn & Grow.
About 42% of the participants mentioned financial benefits of participating in Learn &
Grow. Almost 60% of respondents understood that Learn & Grow offers resources and
support for quality assurance and improvement.
Some respondents understood services of Learn & Grow in a broader level, such as
specialized training, or professional development supports.
Recommendations for Learn & Grow
We received valid recommendations for the quality improvement of Learn & Grow from
8 participants. They recommended Learn & Grow to:
Fully operate all 5 levels,
Increase and clarify incentives of participating in the program, and
Communicate with participants more clearly and quickly.
*To access the raw data, please see Appendix 2B.

118
Perceptions of Barriers to Change
Sometimes, states experience difficulties in changing their system due to systematic
challenges and/or different interests of various stakeholders. We asked participants what
barriers they do perceive to change in SEED Registry, Learn & Grow, and funding
mechanism in Alaska.
Barriers to change in ongoing state resources and funding mechanism
Fourteen people addressed barriers to change in the SEED Registry, Learn & Grow, and
funding mechanism in Alaska.
Almost 30% of the participants suggested the limited amounts and sources of funding
as key barriers to change. About 21% of the participants mentioned that lacking public
understanding of the importance of ECE is a barrier to change. Approximately 30% of
the respondents maintained that the closeness of system undermines the trust and
becomes a barrier to change.
Potential solution for overcoming barriers
Twelve participants provided potential solutions for overcoming barriers.
Almost 60% of the participants emphasized increased communication. They suggested
to create more opportunities to listen to the voices of practitioners, share more
information and explanation, and improve transparency of the system. Respondents also
encouraged to increase marketing efforts to change mindset of the community and
improve public understanding of the importance of ECE.
*The raw data are provided in Appendix 2B.
Final Suggestions
Nine participants provided final suggestions to improve the compensation and other
systems for the childcare workforce. The suggestions include:
Increased partnership between ECE organizations and the state,
Increased financial support from the government, and
More communication and information-sharing between multiple stakeholders
*The raw data are provided in Appendix 2B.
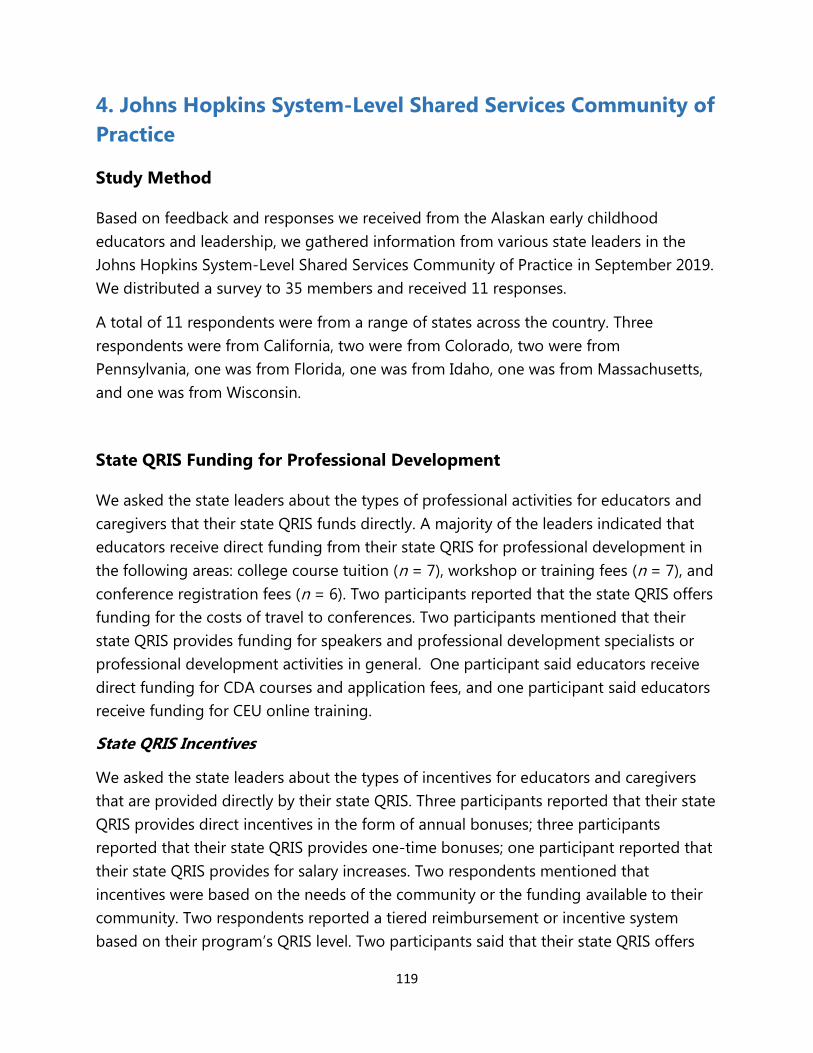
119
4. Johns Hopkins System-Level Shared Services Community of
Practice
Study Method
Based on feedback and responses we received from the Alaskan early childhood
educators and leadership, we gathered information from various state leaders in the
Johns Hopkins System-Level Shared Services Community of Practice in September 2019.
We distributed a survey to 35 members and received 11 responses.
A total of 11 respondents were from a range of states across the country. Three
respondents were from California, two were from Colorado, two were from
Pennsylvania, one was from Florida, one was from Idaho, one was from Massachusetts,
and one was from Wisconsin.
State QRIS Funding for Professional Development
We asked the state leaders about the types of professional activities for educators and
caregivers that their state QRIS funds directly. A majority of the leaders indicated that
educators receive direct funding from their state QRIS for professional development in
the following areas: college course tuition (n = 7), workshop or training fees (n = 7), and
conference registration fees (n = 6). Two participants reported that the state QRIS offers
funding for the costs of travel to conferences. Two participants mentioned that their
state QRIS provides funding for speakers and professional development specialists or
professional development activities in general. One participant said educators receive
direct funding for CDA courses and application fees, and one participant said educators
receive funding for CEU online training.
State QRIS Incentives
We asked the state leaders about the types of incentives for educators and caregivers
that are provided directly by their state QRIS. Three participants reported that their state
QRIS provides direct incentives in the form of annual bonuses; three participants
reported that their state QRIS provides one-time bonuses; one participant reported that
their state QRIS provides for salary increases. Two respondents mentioned that
incentives were based on the needs of the community or the funding available to their
community. Two respondents reported a tiered reimbursement or incentive system
based on their program’s QRIS level. Two participants said that their state QRIS offers

120
incentives for teacher training or teacher demonstration of mastery in a professional
development area. One respondent in Colorado reported that the state had just begun
offering a tax credit to early childhood professionals.
Source(s) of Funding for State QRIS Professional Development and Incentives
We asked about the sources of funding for the QRIS professional development and
incentives mentioned in the previous questions. Almost all respondents (n = 9)
indicated that Child Care Development Block Grant was a source of funding for
incentives and professional development. Two respondents reported that state
referendum (e.g., special tax or bond) was a source of funding for incentives. Half of
participants (n = 5) indicated that their state’s funding provided the incentives, and one
respondent in Denver said that Denver city sales tax provided funding for the Denver
Preschool Program.
State Workforce Registry Funding for Professional Development
Next, we asked state leaders about the types of professional development activities for
educators and caregivers that are directly funded by the state Workforce Registry. Three
respondents reported that their state Workforce Registry provided direct funding for
workshop or training fees for educators and caregivers, one respondent reported that
their state Workforce Registry helped fund college course tuition for educators and
caregivers, and one said that the Workforce Registry offered funding for conference
registration fees. Three participants reported that they either did not have a Workforce
Registry in their state (n = 1; Florida) or that they did not receive direct funding through
the Workforce Registry (n = 2; Massachusetts, Pennsylvania). Six state leaders did not
respond to this question.
State Workforce Registry Incentives
We also asked about the types of incentives provided by the state Workforce Registry
for educators and caregivers. One participant reported the state’s Workforce Registry
provided direct incentives in the form of annual bonuses to educators and caregivers.
One participant from Florida said the state’s Workforce Registry did not provide
incentives for educators and caregivers. Eight leaders did not respond to this question.

121
Source(s) of Funding for State Workforce Registry Professional Development and
Incentives
We asked state leaders about the sources of funding for the Workforce Registry
professional development and incentives mentioned in the previous questions. Three
respondents said that Child Care Development Block Grant was a source of funding for
the Workforce Registry professional development incentives. One respondent in Florida
was not aware of an active state Workforce Registry. Seven leaders did not respond to
this question.
122
123
Chapter 3. Recommendations –
Wage and Compensation Model for Alaska
Background: Research-Based and Feedback-Informed Recommendations
The IDEALS Institute at Johns Hopkins University conducted an Alaska Early Childhood
and School-Age Educators Wage and Compensation Survey in May 2019. A total of 288
early childhood and school-age educators in Alaska participated in the survey. Follow-
up in-depth interviews were held with 12 participants to gain a deeper understanding of
educators’ perceptions of wages and compensation in the early care and education
workforce. In addition, we completed focus group and interviews with early care and
education (ECE) leadership in Alaska. The investigation concluded with
recommendations based on wage and compensation research and feedback from a
representative cross-section of various stakeholders in the Alaska ECE workforce.
Chapter 2 includes specific details about the research methodology, and Appendix 3A
summarizes the methods.
After we developed the set of recommendations, we conducted another round of in-
depth interviews with eight ECE educators to validate our recommendations (Phase 3
validation study). This chapter includes results of the validation study, our final
recommendations, relevant research findings, and recommended implementation
strategies.
The recommendations in this report are designed to help the Alaska ECE field meet the
following goals:
Impact and improve ECE educators’ wage and compensation by
o Closing the compensation gap between the workforces in ECE and K–3 education
o Accomplishing wage and compensation equity within the ECE field
Strengthen competency of early childhood and school-age educators
We expect that achieving these goals will fundamentally help motivate ECE educators to
improve the quality of their practice and remain in the field with the support and
commitment of Alaska’s broader community of policy makers, business leaders, and
for-profit and non-profit organizations and agencies.

124
C3 Alaska: Alaska’s Commitment to Compensation and Competency
Our recommendations in the “C3 Alaska” wage and compensation model lie at the
intersection of the state’s support, SEED (Alaska’s workforce registry and support
system), and Learn & Grow (Alaska’s Quality Recognition & Improvement System).
Through the C3 Alaska model, we expect to build an ecosystem that supports Alaskan
ECE educators’ compensation, competency, and commitment to the field.
Figure 3A illustrates the C3 Alaska Ecosystem Model. In this chapter, for each
implementation strategy, we specify potential implementation entities (state, SEED, or
Learn & Grow) and feasible action levels (immediate, mid-range, or long-term actions).
The action levels are determined by consideration of potential costs, required
coordination and partnerships, priorities, and how soon the impact can be observed.
Figure 3A. C3 Alaska Ecosystem: Alaska’s Commitment to Compensation and
Competency
State Support
SEEDLearn &
Grow
C3 Alaska

125
Recommendations 1. Commitment to Compensation
GOAL: Impact and improve Alaska’s ECE educators’ wage and compensation by
o Closing the compensation gap between ECE and K-3 education
o Accomplishing wage and compensation equity within the ECE field
1A. ECE and K–3 Minimum Wage Parity
As described in Chapter 1, the disparity between ECE and K-3 educators has been widely
acknowledged and efforts have been made to close the gap in many states in the U.S.
(McLean, Dichter, & Whitebook, 2017; Whitebook & McLean, 2017). Research evidence
suggests that setting up a starting salary that is comparable to public pre-kindergarten
teachers’ compensation helps retain educators in the ECE field. Beyond the public pre-
kindergarten level, closing the compensation gap between the ECE field and K-3 will
help ECE educators perceive fairness in wage and compensation, and thus increase their
commitment to the field. Setting up a minimum wage for the entire ECE field will also
help Alaska accomplish wage and compensation equity within the ECE field.
Relevant Research Findings
ECE educators reported higher levels of intrinsic motivation than elementary school
teachers in the Alaska Early Childhood and School-Age Educators Wage and
Compensation Survey data. ECE educators, however, are discouraged because they are
paid considerably less than K–3 teachers, even when they have the same levels of
education and training.
We recommend that Alaska sets a goal of accomplishing K–3 parity in minimum
wage by 2025.

126
Recommended Implementation Strategies
Implementation
√ State SEED Learn & Grow
Action Level
√ Long-Term Mid-Range Immediate
Closing the minimum wage gap is a fiscal challenge. To establish parity in wage and
compensation between ECE educators and those in K–3 education, a two-step
approach is recommended.
Step 1: Establish Livable ECE Minimum Wage
Alaska is one of the states with a minimum wage higher than the federal minimum
wage ($9.89/hour compared to $7.25/hour as of 2019). However, the cost of living
(living wage) in Alaska’s communities is much higher. The living wage calculator
developed by the Massachusetts Institute of Technology suggests that a living wage for
a household with one adult in Alaska is $12.89/hour. That cost increases to $27.49/hour
for a household with one adult and one child. This living wage is calculated based on
the “expenditure data related to a family’s likely minimum food, child care, health
insurance, housing, transportation, and other basic necessities (e.g. clothing, personal
care items, etc.) costs” (http://livingwage.mit.edu/states/02). Living wages in Alaska vary
by region (from $10.67/hour in the Hoonah-Angoon Census Area to $14.25 in the
Northwest Arctic Borough). Figure 3B illustrates minimum hourly wage at different
levels.
We recommend that Alaska establish a minimum wage for the ECE field that meets the
average living wage for at least a one-adult household in Alaska. Funding should be
allocated to support the $3/hour wage gap between the state minimum wage and the
ECE field minimum wage. This recommendation prevents the tendency to cover costs
by increasing tuition, which further burdens families and potentially interferes with
children’s access to high-quality child care. This bold move should establish a minimum
wage for early childhood and school-age educators at the average living wage for a
one-adult household ($12.89/hour) or higher.
The Child Care Aware of America (2019) estimates that there are 1,880 child care
workers in centers and 364 family child care homes (a total of approximately 2,244 ECE
educators) in Alaska. Assuming that ECE educators work 40 hours/week, it costs $6,240
a year for each individual educator to support the $3/hour gap between the state

127
minimum wage and the ECE field minimum wage. Our survey findings show that
although the median wage for all participants was $18/hour ($14/hour for lead
teachers), approximately 18% of educators earn less than $12.89/hour.
Figure 3B. Living Hourly Wage as Minimum Hourly Wage
Step 2: K–3 Parity
To achieve the goal of closing the compensation gap between ECE and K-3 educators,
we suggest that Alaska set a goal of accomplishing K–3 parity in minimum wage by
2025. It is recommended to begin with setting up a starting salary that is comparable
to public pre-kindergarten teachers’ compensation. The data from Center for the Study
of Child Care Employment (2018) shows that the average median hourly wage for
Alaskan kindergarten or elementary school teachers is $41.68. The minimum wage for
Anchorage teachers who has a bachelor’s degree with no experience is about $30–$33
as of 2019 (Figure 3B).
Federal Minumum Wage
Alaska Minimum Wage
Living Wage - One Adult
Living Wage - One Adult One Child
K-3 Wage
$0.00
$5.00
$10.00
$15.00
$20.00
$25.00
$30.00
$7.25
$9.89
$12.89
$27.47
$30
Ho
url
y W
age
Living Wage Exceeds Minimum Wage

128
1B. Fair and Transparent Pay Scale
In K-12 education, it is a common practice for states or school districts to provide salary
schedules that recognize staff’s tenure (years of experience), previous experience, and
educational attainment. Although the ECE field often recognizes educators’ education
and training, years of experience is rarely reflected in their wage.
Research evidence suggests that ECE educators who have more years of experience
demonstrate higher levels of classroom quality. For example, in a study of 692 ECE
classrooms across 11 states, LoCasale-Crouch and colleagues (2007) found that the
highest quality classrooms had educators with more years of ECE teaching experience
than classrooms with lower levels of quality. Pianta et al. (2005) also observed that
greater teaching experience was significantly associated with higher global quality in
ECE classrooms. Preschool teachers with more years of teaching experience are also
more responsive to children and are more likely to engage in constructive play
interactions with their children by accurately assessing their needs and providing
appropriate levels of support and interaction (Trawick-Smith & Dziurgot, 2010).
In addition to setting a minimum wage for the ECE field in Alaska, establishing a fair and
transparent salary schedule that reflects experience years and education will help Alaska
attract and retain high quality ECE educators. Transparency will provide valid data points
for leadership (employers, Learn & Grow, SEED, etc.) to investigate wage and
compensation needs, as well.
Relevant Research Findings
Many participants in this study expressed the need to include work experience as part of
wage and benefit compensation. In the Alaska Early Childhood and School-Age
Educators Wage and Compensation Survey, we asked participants how much they
believe that pay should be structured by (a) education and training and (b) years of
experience in ECE. ECE educators valued experience years more than education and
training: 71.3% of participants strongly agree or agree that “education and training”
We recommend that Alaska encourages ECE programs to (a) establish their own
pay scale that reflects experience years and education, (b) provide transparent
information for educators, and (c) provide valid data for leadership.

129
should be considered and 81.2% of participants strongly agree or agree that “experience
years” should be considered. Although participants in the leadership survey valued
education and training slightly more than experience years, 82.4% of participants still
strongly agreed or agreed that “experience years” should be considered in pay structure
(88.2% strongly agree or agree with “education and training”).
When we asked an open-ended question for ECE educators, “If you could change one
thing in the current compensation system in ECE, what would you change?” about 10%
of the responses indicated that they would like experience taken into account in
determining wages.
Recommended Implementation Strategies
Implementation
State SEED √ Learn & Grow
Action Level
Long-Term √ Mid-Range √ Immediate
To accomplish the goal of retaining and recruiting highly competent educators, we
encourage Learn & Grow to include “documentation of a pay scale by experience years
and educational attainment” as a required quality activity for programs participating in
Learn & Grow. To help programs achieve this goal of creating a distinctive pay
schedule, a bonus for Learn & Grow participants might be allocated. As described in
Chapter 1, several states currently implement QRISs that include documentation of a
pay scale.
1C. Tenure and Competency Recognition
As stated, research shows that ECE educators’ years of experience is significantly
associated with classroom quality and their interactions with children. Extending the
recommendation that programs adopt pay scales that reflect experience, we
recommend that the state award early childhood and school-age educators’ tenure in
the field. Long-term, we recommend that Alaska explore innovative ways to validate and
We recommend that Alaska awards ECE educators’ tenure in the field and
competency.

130
compensate educators’ demonstrated and applied competency (beyond educational
attainment) and incorporate the levels of validated competency in this bonus system.
A statewide bonus system based on years in the field may encourage early childhood
and school-age educators to remain in the field and address the issue of employee
turnover. In addition, we expect that a bonus system implemented at the state-level
would help reduce the burden on ECE programs to compensate their staff based on
years of experience.
Another advantage of the state-level bonus system is that it can compensate all early
childhood educators in the field, including family childcare providers who often lack
their own pay scale or a standardized compensation system. This approach helps the
state accomplish wage and compensation equity within the broader ECE field.
Relevant Research Findings
As described in recommendation 1B, many participants expressed that it is critical to
recognize ECE educators’ experience in the field. In addition, some participants stated
that they would like to see a “merit-based” compensation system.
In the Phase 3 validation study, we asked the interview participants about a bonus
system by experience years. All eight interviewees were participating in the SEED
Registry. Seven out of eight participants agreed that providing a bonus system for ECE
educators based on experience years as part of the SEED Registry would improve
participation in the SEED Registry and increase retention in the field of early childhood
education. The participants made the following statements:
“SEED had a bonus system for a while. I had several of my teachers get on it. The bonus
system gave an extra $1/hour after a year. That was big. Teachers really liked that.”
“Yes, the years of experience is more helpful than the classes you can take.”
Recommended Implementation Strategies
Implementation
State √ SEED Learn & Grow
Action Level
Long-Term √ Mid-Range Immediate

131
We recommend SEED take the lead on implementing a bonus system that recognizes
ECE educators’ experience via the SEED Registry. A bonus system might include awards
on an incremental basis. We suggest setting milestones to be recognized. For example,
as educators achieve major milestones in their careers (e.g., 3 years, 5 years, 10 years,
15 years, 20 years, and 25+ years), they receive a bonus. Previous research shows that
the turnover rate for more novice ECE educators within five years is much higher than
for more seasoned educators. Major milestones might be acknowledged with bonuses
more often for early career educators to motivate those new, competent, and
motivated educators to stay in the field.
Table 3A below provides a projection of the number of educators in the current SEED
Registry (as of 2019) who would achieve major milestones in their careers in the next
five years. We used the SEED Practitioner Education data to project these numbers. We
assumed that there will be about 150 new educators coming into the field each year
based on the SEED data and that educators retire at age 65. The current SEED data
implies that there are 310 new educators with approximately a 50% retention rate in
the following year. We assumed a 60% retention rate for other current SEED registered
members based on the SEED ROOTS award estimation (44% turnover) and a 10%
increase in educators’ participation in SEED, motivated by this bonus system.
We recommend that a bonus be provided for educators by years of experience up to
five years to support them staying within the field; and after five years, competency
evaluation (merit-based bonus) could be incorporated into the bonus system. To
accomplish this long-term goal, thread might explore ways to validate educators’
demonstrated and applied competency in their care and education.
Table 3A. Projected Number of Educators Achieving Major Milestones
2020 2021 2022 2023 2024
3 Years of Experience 90 92 109 105 105
5 Years of Experience 48 74 90 92 109
10 Years of Experience 22 24 30 39 46
15 Years of Experience 15 17 17 15 41
20 Years of Experience 6 14 8 15 18
25+ Years of Experience 54 62 68 76 97
Total Awardees 235 281 321 342 417
On average, we estimate that there will be about 300 educators every year who would
be eligible for a milestone bonus. Assuming that a bonus is provided at 10% of salary

132
level (e.g., $15/hour), it would cost $1.5/hour for each educator, a total of $3,120 a year.
We suggest thread recruit supporters/donors who are willing to provide financial
support for educators who educate and care for young children.
1D. Full-Time Status
Working towards parity between the ECE workforce and K–3 educators, Whitebook and
McLean (2017) encourage the ECE field to adjust ECE educators’ salaries based on work
hours because ECE educators often have more flexible schedules. Similar to this
suggestion, we found that ECE educators in Alaska seek full-time employment status.
This recommendation is driven by that research finding in Alaska.
Relevant Research Findings
Results from the Alaska Early Childhood and School-Age Educators Wage and
Compensation Survey indicated that early childhood and school-age educators in Alaska
consider full-time status and salary equally important.
We acknowledge that there are many ways to interpret what full-time status means to
ECE educators, and there are a number of factors that contribute to the feasibility of
employing full-time staff consistently at the program level. Therefore, we explored ECE
educators’ perceptions of full-time status in the Phase 3 validation study.
Definitions of Full-Time Status
Of the eight people interviewed in the validation study, six worked full-time. All but one
educator reported that full-time status was considered working at least 40 hours per
week (the remaining participant said that the minimum hour requirement at their center
was 35 hours per week). During the Phase 2 leadership interview, we discovered that a
Head Start program defines full-time status as working at least 30 hours per week.
We recommend that Alaska convenes a multi-sector taskforce to examine
impact, barriers, and benefits of promoting more staff to full-time status.

133
Perceptions of Full-Time Status
Regarding the reasons why full-time status might be important to early childhood
educators, five participants said that earning a living wage was an important motivator.
Many educators reported that it was not possible to make a living wage working part-
time. Three participants listed benefits (e.g., health insurance) as a reason for pursuing
full-time status. One educator said that having full-time staff might be beneficial for
providing consistency of teaching staff for children. Another educator stated that
working full-time helped the staff at her center afford to pay for classes towards a
teaching degree and meet the face-to-face requirements of their degree programs.
We note that two educators reported that they are working part-time, and both stated
that they had chosen to work part-time and were not interested in full-time status. It is
possible that some educators— especially in rural communities—seek part-time status
to allow time to participate in other activities (e.g., fishing, hunting, other forms of
subsistence).
Recommended Implementation Strategies
Implementation
State √ SEED √ Learn & Grow
Action Level
Long-Term Mid-Range √ Immediate
Given the mixed reactions from the Phase 3 validation study, participants and limited
data to fully understand impacts, barriers, and benefits of promoting full-time status,
we suggest that more discussion and exploration are needed. We recommend that
thread take the lead on convening a multi-sector taskforce to facilitate a conversation
and further research on impacts, barriers, and benefits of promoting full-time status.
We suggest calling a multi-sector taskforce comprised of representatives and
leadership from private/for-profit and non-profit childcare programs in various regions
(urban, suburban, rural, and remote), government policy entities, SEED, and Learn &
Grow.

134
1E. Benefits
In an effort to achieve K–3 parity, benefits must be considered part of a wage and
compensation model. Common benefits in K–3 settings are paid sick days, paid
professional development activities (including costs related to traveling), paid planning
time, health insurance, and retirement plans. We recommend that the state support ECE
programs to accomplish K–3 parity by helping them develop, deliver, and document
benefit packages for their staff.
Relevant Research Findings
The Alaska Early Childhood and School-Age Educators Wage and Compensation Survey
showed that less than 40% of ECE educators who participated in the survey receive
health insurance, paid sick days, or retirement plans. About 60% of participants reported
that they receive paid vacation days or holidays. In addition, about half of participants
receive professional development related benefits (e.g., paid days to attend professional
meetings, fees/dues for professional development training, or support for college
coursework). We also found disparities in benefits by employment status (most of part-
time staff were ineligible), positions (lead versus assistant educators), and program type
(center versus family child care). Figure 3C shows the percentages of educators who
have access to benefits by various groups.
Not surprisingly, the survey participants cited compensation and benefits as the top two
stressors in their job. About 25% of those who indicated an intention to leave the field
(if they had an opportunity to leave) said that low pay and lack of benefits were the
reasons they would want to move to a different setting.
We recommend that Alaska supports ECE programs to develop, deliver, and
document benefit packages for educators.
Long-term, we recommend exploring partnerships to provide universal health
insurance options and retirement plans.

135
Figure 3C. Access to Benefits by Groups

136
Recommended Implementation Strategies
Implementation
√ State √ SEED √ Learn & Grow
Action Level
√ Long-Term Mid-Range √ Immediate
We recommend two implementation strategies to improve benefits in the ECE field.
Immediate Approach: Benefits in Learn & Grow
Most immediately, we suggest that Learn & Grow include benefits as one of the quality
activity areas. As described in Chapter 1 (like Ohio or Massachusetts), Learn & Grow
might first require that all programs provide documentation of benefits for staff,
including assistant teachers and part-time staff. As programs advance levels towards
Thriving in Higher Quality, Learn & Grow might require that programs provide a full
benefits package for staff.
Long-term Approach: Universal Health Insurance Options and Retirement Plans
As a long-term goal, we recommend that SEED (or the state) explore options for
universal health insurance programs, as well as retirement plans, for the ECE workforce.
For example, SEED might partner with local health insurance companies to ensure that
ECE educators have more affordable access to health insurance programs. This benefit
would improve ECE educators’ participation in the SEED Registry and would motivate
ECE educators to stay within the field.
Another advantage of the universal health insurance options and retirement plans is
that they can benefit all ECE educators, including family child care providers who often
lack access to affordable benefits. This will helps the state accomplish wage and
compensation equity within the ECE field.

137
1F. Support of Living Expenses
Previous research consistently indicates that ECE educators often earn a poverty-level
wage and struggle to meet basic needs. Therefore, we recommend that ECE leaders
consider ways of partnering with organizations and agencies in the public and private
sectors to address these needs.
Relevant Research Findings
More than half of the educators who completed the Alaska Early Childhood and School-
Age Educators Wage and Compensation Survey reported that their wages are
insufficient to meet basic living expenses. In addition, more than half of the educators
reported stress about having enough money to pay monthly expenses and bills. In
open-ended questions or during in-depth interviews, a significant portion of
participants expressed concerns about paying their bills and covering other expenses
such as gas and food, student loans, and/or mortgage.
Recommended Implementation Strategies
Implementation
√ State √ SEED Learn & Grow
Action Level
Long-Term √ Mid-Range Immediate
We recommend that SEED take the lead on finding innovative ways to partner with
organizations and agencies in the public and private sectors. The partnership may
include contracts with utility companies, local groceries, shops, and transportation
services to offer discounts and benefits to ECE educators in Alaska. While partnering
with local companies who are dedicated to the Alaskan community (e.g., Fred Meyer,
Carrs), thread might issue a SEED Registry verification ID card so participating ECE
We recommend that Alaska seeks ways to address ECE educators’ living
expenses needs through innovative partnerships with public and private
sectors.

138
educators could easily access those benefits. This would reduce barriers that prohibit
low-wage workers from accessing support programs and services. Some companies,
such as Fred Meyer or Amazon, offer partnered agencies a “rebate”—the companies
return part of the customers’ expenditures back to the partnered agency.
In addition, thread may partner with Credit Unions to offer mortgage discounts or
student loan discount programs for ECE educators who are registered in the SEED
Registry. In addition, partnerships with private investors may be established to reduce
or waive ECE educators’ student loans (for obtaining an ECE-related degree) when
educators stay in the field for more than five years.
As described in Chapter 1, to accomplish innovate goals, the Pay-for-Success model is
one strategy that can connect private investors and the government through a Social
Impact Bond. We suggest that thread further explore a way to adopt the Pay-for-
Success model in Alaska.
We particularly recommend that thread utilize these strategies as a way to
demonstrate their efforts to advocate for the ECE workforce, as well as a way to
increase public awareness of the importance of ECE.
1G. Broader ECE Community
To accomplish wage and compensation equity within the ECE field, more targeted
research and wage and compensation strategies are needed for the broader ECE
workforce. We particularly target assistant teachers given the research findings and
feedback from ECE educators and leadership in Alaska.
Relevant Research Findings
Our findings revealed that compared to lead teachers, family child care owners, and
directors/administrators, Alaska’s assistant teachers are compensated at much lower
We recommend that Alaska addresses wage and compensation issues of
broader ECE community, including assistant teachers.

139
levels both in wages and benefits. Assistant teachers also had lower levels of
commitment and job satisfaction and were more likely to seek alternative employment,
leading to higher turnover rates. This is despite high levels of intrinsic motivation to
enter the field.
Recommended Implementation Strategies
Implementation
State √ SEED Learn & Grow
Action Level
Long-Term √ Mid-Range Immediate
We recommend that the state recognize assistant teachers as important contributors
by including them in the wage and compensation model for teachers. For example, we
suggest that SEED include assistant teachers if a bonus system is implemented
(recommendation 1C). We also recommend that thread provide more targeted
education and training opportunities for assistant teachers and encourage ECE
programs to provide promotion opportunities tailored to the needs of assistant
teachers.
Phase 3 Validation Interview Findings:
Among eight validation interview participants, six participants agreed with the
recommendation of providing professional development and career advancement
opportunities targeted towards assistant teachers in order to increase retention of
assistant teachers in their program and the ECE field. One person observed that
supporting assistant teachers seeking continuing education had increased retention at
her program. Another interviewee shared that she encouraged her assistant teachers to
pursue their CDA, which is associated with higher wages.
Two participants shared that the most important factor for retaining assistant teachers
was to increase wages. Other suggestions for improving retention included having a
government subsidy to improve funding, creating a pay scale based on participation in
the SEED Registry, and providing mental health support to ECE educators. One person
noted that the ability to provide benefits would increase retention of assistant teachers
at her program, but this was not financially feasible without additional funding.
*Note. Given feedback from leadership interviews, we considered an option of creating
a tailored certificate (or credentials) for assistant teachers to recognize their important

140
work. Only two participants thought that having an official certificate from SEED would
improve retention of assistant teachers. Four participants did not think this would be an
effective strategy, and two participants were unsure. Thus, we do not include this as
part of our recommendations.
Recommendations 2. Commitment to Competency
GOAL: Strengthen competency of early childhood and school-age educators
We recognize the vital importance of a competent workforce to deliver high-quality care
and education and to meet the needs of children and families. Although finding ways to
strengthen competency was not the primary goal of this research, the results from the
wage and compensation surveys and interviews, unsurprisingly, revealed common
themes around competency, connections between competency and compensation, and
the critical needs of refining professional development as well as workforce registry
systems in Alaska. In this section, we do not specify the action-level and implementation
entities, as these are areas to be further explored, examined, and considered to meet
ECE educators’ needs. Overall, we recommend thread take the lead on further
examination.
2A. Professional Development
Relevant Research Findings and Implications
The Alaska Early Childhood and School-Age Educators Wage and Compensation Survey
and the ECE Leadership Survey revealed interesting discrepancies in priorities of benefits
related to professional development. We first asked the ECE educators to rank the
importance of 12 job-related factors, including wage, benefits, and professional
development factors (see Chapter 2 for more details). Among professional
development-related factors, “on-site training support” and “opportunities to advance”
appeared to be more important for educators than paid professional development
We recommend further examination of specific professional development
needs related to content and delivery mechanisms for Alaskan ECE educators.
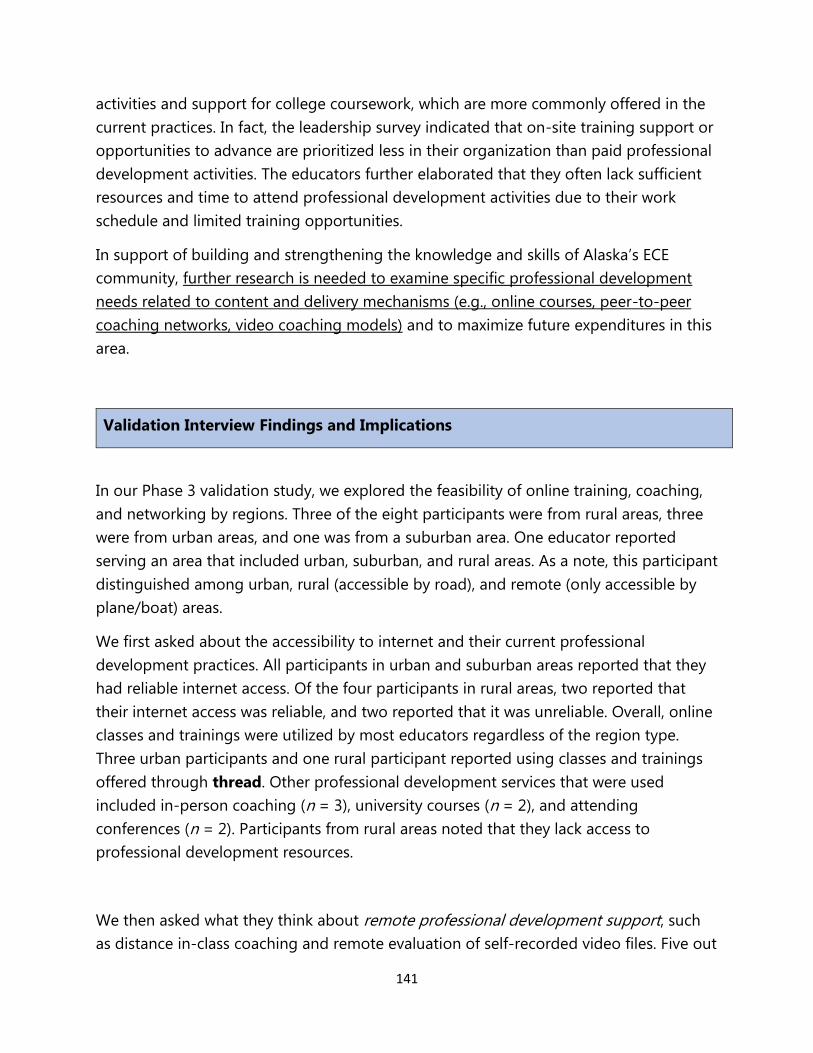
141
activities and support for college coursework, which are more commonly offered in the
current practices. In fact, the leadership survey indicated that on-site training support or
opportunities to advance are prioritized less in their organization than paid professional
development activities. The educators further elaborated that they often lack sufficient
resources and time to attend professional development activities due to their work
schedule and limited training opportunities.
In support of building and strengthening the knowledge and skills of Alaska’s ECE
community, further research is needed to examine specific professional development
needs related to content and delivery mechanisms (e.g., online courses, peer-to-peer
coaching networks, video coaching models) and to maximize future expenditures in this
area.
Validation Interview Findings and Implications
In our Phase 3 validation study, we explored the feasibility of online training, coaching,
and networking by regions. Three of the eight participants were from rural areas, three
were from urban areas, and one was from a suburban area. One educator reported
serving an area that included urban, suburban, and rural areas. As a note, this participant
distinguished among urban, rural (accessible by road), and remote (only accessible by
plane/boat) areas.
We first asked about the accessibility to internet and their current professional
development practices. All participants in urban and suburban areas reported that they
had reliable internet access. Of the four participants in rural areas, two reported that
their internet access was reliable, and two reported that it was unreliable. Overall, online
classes and trainings were utilized by most educators regardless of the region type.
Three urban participants and one rural participant reported using classes and trainings
offered through thread. Other professional development services that were used
included in-person coaching (n = 3), university courses (n = 2), and attending
conferences (n = 2). Participants from rural areas noted that they lack access to
professional development resources.
We then asked what they think about remote professional development support, such
as distance in-class coaching and remote evaluation of self-recorded video files. Five out

142
of eight educators agreed that this would be beneficial and feasible. Two participants in
remote/rural areas said that this would not be feasible due to connectivity issues. A
further exploration is needed to examine whether it would be feasible for educators to
record their practices offline at any time and access internet periodically in the offices of
local partnered agencies. One participant said it would be difficult for staff to find time
to use remote professional development support. One participant noted that it would
be important to provide support and coaching that are targeted towards educators who
have been in the field for many years. This person reported that most professional
development support and coaching seemed to focus on educators who were newer to
the field.
We also asked what they think about online professional development courses. All eight
interviewees said that they would participate in online professional development
courses and encourage their staff to participate. All interviewees said that this type of
professional development support would be feasible, although one participant noted
that this might be a challenge for home-based settings in rural areas, which often lack
reliable internet access. Again, further research is needed to identify the most effective
and efficient way to reach rural ECE educators.
In summary, potential strategies to explore are:
• Competency-based interactive and immersive online learning experiences leading
to earned credit as well as validated, demonstrated, and applied competency
• Remote professional development support, such as distance in-class coaching
and remote evaluation of self-recorded video files
• Partnership with local entities to ensure stable internet access for rural or remote
ECE educators

143
2B. Workforce Registry
The National Landscape Review (Chapter 1) suggests that a well-designed statewide
workforce registry that maximizes ECE educators’ participation is a key component of
ECE workforce development. The SEED Registry has great potential to increase ECE
educators’ motivation and commitment toward their job.
Relevant Research Findings and Implications
First, the most common theme observed from both educator surveys/interviews and
leadership surveys/interviews was the difficulty of the SEED Registry application process.
Many participants said that simplifying the application process would increase
participation. Some participants mentioned that they needed to wait a long time for the
application process to be completed. During the Phase 3 validation interviews, one
participant suggested that this system could be improved by linking the SEED Registry
directly to professional development opportunities. For example, if an educator
attended a conference, the conference organizer or another related resource would
automatically update the educator’s account in the Registry with their attendance. This
would be an efficient way to track participants’ professional development activities and
a more effective way to validate educators’ participation in professional development.
The Basic Psychological Needs
The Basic Psychological Needs Theory posits that individuals are internally motivated
and satisfied with their lives when their needs for competence, autonomy, and
relatedness are fulfilled (Deci & Ryan, 2000). Based on our investigation of research data
and the current SEED Registry system, we suggest that the registry be updated and
improved to meet those basic psychological needs. First, the professional development
efforts that thread is currently making have the potential to fulfill educators’ needs for
competence and relatedness. To maximize this potential, we recommend that the
workforce registry be a more interactive system where ECE educators share their
We recommend improvement of the SEED Registry to provide seamless support
for ECE educators and to increase their participation.
144
professional development plans with their supervisors (e.g., directors, coaches) and then
track their progress. Having solid and consistent professional development plans and
evaluations fulfill educators’ needs for competence, and sharing the plans and receiving
supervision fulfill their needs for relatedness. An interactive system also supports
leadership practices and connects directors with their employees. This ultimately
empowers ECE educators and helps them advance in the field.
Second, the current SEED Registry is voluntary and SEED provides various professional
benefits and options for participants to choose, which fulfills a need for autonomy. More
online training options could be explored and added (as suggested in 2A) to meet
different groups’ needs (e.g., seasoned staff, new staff, family child care providers,
assistant teachers, rural educators). This way, SEED participants would be able to
customize their professional development plan better.
In summary, potential strategies to explore are:
• Creating a more interactive workforce registry system
• Offering more diverse learning experiences for ECE educators
2C. Support for Broader ECE Community
Family child care providers often work in an isolated environment without sufficient
resources and support. In previous studies, family child care providers consistently
reported that they had less access to professional development compared to center-
based educators due to a lack of time and substitutes.
Relevant Research Findings and Implications
The Child Care Aware of America (2019) indicates that there are 364 family child care
homes (versus 249 center-based child care programs) available to serve 12% of the total
child care slots for children in Alaska. Despite the fact that about one in eight children
utilize family child care homes in Alaska, there is insufficient evidence from our research
We recommend exploration and consideration of the unique needs of the
broader ECE community, including family child care providers.

145
to determine the unique needs of family child care providers to improve their
competency due to a low participation rate in our research. Thus, we recommend further
exploration. This examination might include identifying specific professional
development needs and offering more personalized learning opportunities (e.g., via
online resources), connecting family child care providers with a larger professional
community to share and exchange resources, or building a peer network among family
child care providers through SEED to collectively address their needs.
2D. Mental Health and Leadership Support
Relevant Research Findings and Implications
Although salary was found to be a leading factor of Alaskan ECE educators’ intention to
leave the field, about 25% of respondents in the Alaska Early Childhood and School-Age
Educators Wage and Compensation Survey indicated high levels of burnout, stress, and
low job satisfaction in their current job. High stress was the second-most-mentioned
reason (following low pay and benefits) why participants wanted to leave their job. In
addition, the participants chose lack of “supportive leadership” as one of the top
stressors in their job. These findings are consistent with recent research studies showing
that salary is not the sole factor that contributes to ECE educator turnover and retention
– relationships with directors or co-workers, connections with children’s families, and
stress/burnout are often key drivers of ECE educators’ intention to leave the field, the
quality of care and education, and child outcomes.
In the Phase 3 validation study, one participant noted that “mental health support is
often overlooked when considering improvement of support to early childhood
educators.” We suggest that thread offer a variety of trainings on stress reduction
strategies, effective and supportive leadership, how to support mental health, and
related topics. We also encourage leaders in the field to examine their own practices to
deliver the supportive leadership needed to manage and implement high quality
programs.
We recommend offering mental health and leadership support to improve the
quality of the workforce.
146
2E. Retention and Turnover
Relevant Research Findings and Implications
Attracting and retaining high-quality educators is critical to maintain overall competency
in the ECE field. In the Alaska Early Childhood and School-Age Educators Wage and
Compensation Survey, we asked a series of questions about turnover to connect wage
and compensation recommendations with staff retention. We asked participants what
challenges they experience when a teacher leaves a job. Almost half of the participants
mentioned that it was very challenging to find a qualified and committed person. Most
of the participants also stated that they would want to receive support from thread,
SEED, Learn & Grow, or the state to find qualified candidates (e.g., a database of
qualified candidates, an online job posting system). Many participants mentioned that it
was difficult to have a background check and an orientation training conducted on time.
High turnover rates place additional demands on the individuals and systems
responsible for these activities.
We recommend that thread explore various options to provide a recruitment platform
for the ECE workforce. For example, this platform might provide an online space for
program administrators to post job openings. In addition, ECE educators might share
their educational attainment and other credentials, work experience if any, and
professional development history with potential employers. This platform might be
linked with thread-endorsed professional development courses for new employees
(e.g., general health and safety orientation to different types of ECE programs, child
development, and work ethic in the ECE field). This would help candidates become more
competitive in the job market and reduce the burden on programs to provide general
orientations to new hires. This platform could be also used as a pool of thread-run pre-
screened substitutes that fulfill directors’ immediate needs. During the interviews with
ECE educators, we found that educators are not often able to use their paid sick days
because it is difficult to find substitutes.
We recommend that thread implement entry and exit surveys to better
understand ECE educators’ job attitudes and turnover intention; and explore the
possibility of providing a recruitment platform through the SEED Registry.

147
In the Phase 3 validation study, we asked participants’ opinions about the use of the
SEED Registry as a potential recruitment platform. Half of them (n = 4) thought that it
would be beneficial. Two interviewees did not think this would be helpful, and two were
unsure. One participant who did not think it would be helpful noted that needing to go
through SEED would be an additional step that employers or employees would not want
to take. We suggest that SEED prioritize updating the system (recommendation 2B) so
that educators are more motivated to utilize the registry first before implementing a
recruitment platform. Another participant said that word of mouth and personal
communication were more effective ways of recruiting in her rural community. This
indicates that a recruitment platform might be more useful for urban or suburban
educators.
Summary of Recommended Implementation Strategies
1. Learn & Grow Workforce Standards
An increasing number of Quality Rating and Improvement Systems (QRIS) emphasize
ECE workforce development as one of their priorities. When we analyzed goal
statements from each state’s QRIS in 2016, only 17% of QRIS operating states included a
statement related to ECE workforce. However, in 2019, 50% of QRIS operating states
included a goal of ECE workforce development in their mission and goals statements.
Alaska’s Quality Recognition and Improvement System, Learn & Grow, is one of the
QRISs that recognize the importance of workforce development. To accomplish this
goal, it is first needed to provide supportive work environment for educators.
In summary, we recommend consideration of the following additional Learn & Grow
workforce quality activities to support educators:
Establish viable minimum wage salaries
Provide documentation of pay scale and benefits for staff, including assistant
teachers and part-time staff
Provide paid planning time and professional development
Provide evidence that learning and career advancement opportunities are
provided to all positions, including assistant teachers
Provide a benefits package suggested by Learn & Grow (for higher levels)

148
It is critical to note that these workforce quality activities would require coordination
between Learn & Grow, SEED, and ECE leadership, administrators, and educators. In
addition, adequate funding or bonus systems should be explored to support
programs to achieve and advance towards higher quality. We recommend future
research to explore the feasibility and impact of these approaches.
As a more immediate step, we recommend Learn & Grow encourage ECE programs to
develop workforce improvement plans to improve workforce quality by providing
example activities above. This would help ECE leaders to reflect on importance of these
activities for their staff who teach and care for children.
We also recommend creating alternative pathways for other program types, such
as Head Start and tribal childcare programs. This will ensure that Learn & Grow
workforce standards are extended to support all early childhood and school-age
educators in Alaska. Ensuring that all early childhood and school-age educators are
afforded the opportunity to participate in Learn & Grow allows all programs to receive
benefits for meeting high quality standards. As a result, more children and families in
Alaska are afforded the opportunity and access to learn, grow, and thrive with support
from a well-compensated and highly competent workforce.
We also recommend that Learn & Grow issue a micro badge and marketing
materials for programs who meet these expanded workforce standards as a way to
incentivize participation. Proactive marketing strategies would help to increase public
recognition of the importance of the workforce, as well.
2. SEED
In summary, we recommend consideration of the following strategies for SEED updates:
Implement a bonus system that recognizes ECE educators’ experience and
competency
Explore options for universal health insurance programs and retirement plans
Explore innovative ways to partner with organizations and agencies in the public
and private sectors (e.g., contracts with utility companies, local groceries, shops,
and transportation services) to offer discounts and benefits to ECE educators in
Alaska; partner with credit unions to offer mortgage discounts or student loan
discount programs for ECE educators who are registered in the SEED Registry
Further explore a way to adopt the Pay-for-Success model in Alaska

149
Include assistant teachers in the wage and compensation model, provide more
targeted education, training, and promotion opportunities for assistant teachers
Update the application process, consider linking the SEED Registry to
professional development opportunities
Provide more competency-based interactive and immersive online learning
experiences and various options to meet different groups’ needs
Improve the SEED Registry so that it is an interactive system where ECE educators
share their professional development plans with their supervisors (e.g., directors,
coaches, etc.) and track their progress
Explore various options to provide a recruitment platform for the ECE workforce
Table 3B summarizes the recommended improvements in SEED.

150
Table 3B. SEED Implementation Summary
Goals
Recommended Areas
Wage and
Compensation
Professional
Development
Partnership
Plans
System
Updates
1C. Tenure and
competency Recognition
Bonus system for
milestone years
1D. Full-Time Status
Examine impact,
barriers, and
benefits of
promoting more
full-time status
through further
research
1E. Benefits
Explore options for
universal health
insurance and
retirement plans
1F. Support Living
Expenses
Explore options to
partner with the
public and private
sector, credit
unions, and Pay-for-
Success model
1G. Broader ECE
Community
Include assistant
teachers in the
wage and
compensation
model
Assistant teachers
(needs assessment,
more targeted
education, training,
and promotion
opportunities)
2A. Professional
Development
Examine PD needs
related to content
and delivery
mechanisms
Offer mental health
and leadership
support PD (2D)
Explore partnerships
with local entities to
ensure stable
internet access for
remote and rural
communities
2B. Workforce Registry
Explore and add
online training
options to meet
different groups’
needs
Simplify application
process
Link SEED Registry
to PD opportunities.
Make SEED Registry
an interactive
system
2E. Retention and
Turnover
Recruitment
platform
entry and exit
survey

151
3. Overview of Recommendations
In summary, we provided recommendations in 12 compensation and competency areas.
Table 3C describes a summary of recommendations in the C3 Alaska Wage and
Compensation Model. Based on research findings and feedback we received from
Alaskan ECE educators and leadership, we identify 1A (ECE and K-3 minimum wage
parity), 1B (fair and transparent pay scale), 1C (tenure and competency recognition), 2A
(professional development), and 2B (workforce registry) as high cost and high return
strategies. We recommend partnerships between the state of Alaska, thread, and
private investors through the Social Impact Bond model to accomplish these goals. The
expected outcomes to be measured are:
Higher retention of quality educators
Higher percentage of new educators’ entry to the field
Families’ better satisfaction with child care experiences
Better learning environments for young children
Better disciplinary approaches by educators
Better child development outcomes

152
Table 3C. C3 Alaska Summary of Recommendations
Goals Recommendations
Action Level Implementation High
Cost
High
Return
Long-
term
Mid-
range
Imme-
diate State SEED
Learn
&Grow
1. Commitment to Compensation: Impact and Improve ECE Educators’ Wage and Compensation
1A. ECE and K–3 Minimum Wage
Parity
Set a goal of accomplishing K–3 parity in minimum wage by
2025. √ √ √
1B. Fair and Transparent Pay
Scale
Support ECE programs to establish their own pay scale that
reflects experience years and education. √ √ √
Encourage ECE programs to provide transparent pay scale
information, which will provide valid data for leadership. √ √
1C. Tenure and Competency
Recognition
Award ECE educators’ tenure for demonstrated competency
based on years of experience in the field. √ √ √
1D. Full-Time Status Convene a multi-sector taskforce to examine impact, barriers,
and benefits of promoting more staff to full-time status. √ √ √
1E. Benefits Support ECE programs to develop, deliver, and document
benefits packages for educators. √ √
Establish partnerships to provide universal health insurance
options and retirement plans. √ √ √
1F. Support of Living Expenses Seek ways to address ECE educators’ living expenses needs
through innovative partnerships with public and private
sectors.
√ √ √
1G. Broader ECE Community Address wage and compensation issues of broader ECE
community, including assistant teachers √ √
2. Commitment to Competency: Strengthen Competency of ECE educators (further research recommendations for thread)
2A. Professional Development Further examination of specific professional development needs related to content and delivery mechanisms
for Alaskan ECE educators. √
2B. Workforce Registry Improvement of the SEED Registry to provide seamless support for ECE educators and to increase their
participation. √
2C. Support for Broader ECE Exploration and consideration of the unique needs of the broader ECE community, including family child care.
2D. Mental Health and Leadership
Support Offering mental health and leadership support to improve the quality of the workforce.
2E. Retention and Turnover Implementation of entry and exit surveys to understand ECE educators’ job attitudes and turnover intention.
Exploration of the possibility of providing a recruitment platform through the SEED Registry.

153
Appendices

154
Appendix 1A.
Annual Median Salary of Educators across States in 2015
Reprinted from “High-Quality Early Learning Settings Depend on a High-Quality
Workforce,” by U.S. Department of Health and Human Services and U.S. Department of
Education (2016). Copyright 2016 by U.S. Department of Health and Human Services
and U.S. Department of Education.
Original Source of Data:
U.S. Census Bureau, 2014 ACS 1 Year data; U.S. Bureau of Labor Statistics, 2015
Occupational Statistics; Head Start Program Information Report (2015).
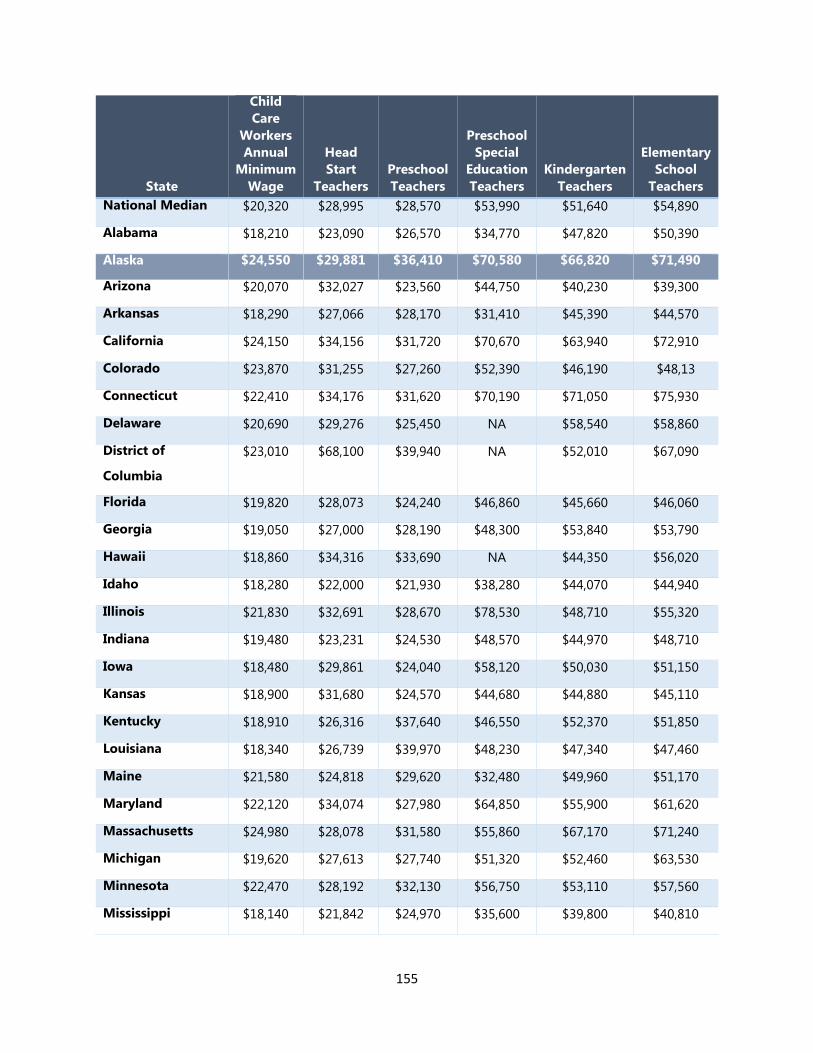
155
State
Child
Care
Workers
Annual
Minimum
Wage
Head
Start
Teachers
Preschool
Teachers
Preschool
Special
Education
Teachers
Kindergarten
Teachers
Elementary
School
Teachers
National Median $20,320 $28,995 $28,570 $53,990 $51,640 $54,890
Alabama $18,210 $23,090 $26,570 $34,770 $47,820 $50,390
Alaska $24,550 $29,881 $36,410 $70,580 $66,820 $71,490
Arizona $20,070 $32,027 $23,560 $44,750 $40,230 $39,300
Arkansas $18,290 $27,066 $28,170 $31,410 $45,390 $44,570
California $24,150 $34,156 $31,720 $70,670 $63,940 $72,910
Colorado $23,870 $31,255 $27,260 $52,390 $46,190 $48,13
Connecticut $22,410 $34,176 $31,620 $70,190 $71,050 $75,930
Delaware $20,690 $29,276 $25,450 NA $58,540 $58,860
District of
Columbia
$23,010 $68,100 $39,940 NA $52,010 $67,090
Florida $19,820 $28,073 $24,240 $46,860 $45,660 $46,060
Georgia $19,050 $27,000 $28,190 $48,300 $53,840 $53,790
Hawaii $18,860 $34,316 $33,690 NA $44,350 $56,020
Idaho $18,280 $22,000 $21,930 $38,280 $44,070 $44,940
Illinois $21,830 $32,691 $28,670 $78,530 $48,710 $55,320
Indiana $19,480 $23,231 $24,530 $48,570 $44,970 $48,710
Iowa $18,480 $29,861 $24,040 $58,120 $50,030 $51,150
Kansas $18,900 $31,680 $24,570 $44,680 $44,880 $45,110
Kentucky $18,910 $26,316 $37,640 $46,550 $52,370 $51,850
Louisiana $18,340 $26,739 $39,970 $48,230 $47,340 $47,460
Maine $21,580 $24,818 $29,620 $32,480 $49,960 $51,170
Maryland $22,120 $34,074 $27,980 $64,850 $55,900 $61,620
Massachusetts $24,980 $28,078 $31,580 $55,860 $67,170 $71,240
Michigan $19,620 $27,613 $27,740 $51,320 $52,460 $63,530
Minnesota $22,470 $28,192 $32,130 $56,750 $53,110 $57,560
Mississippi $18,140 $21,842 $24,970 $35,600 $39,800 $40,810
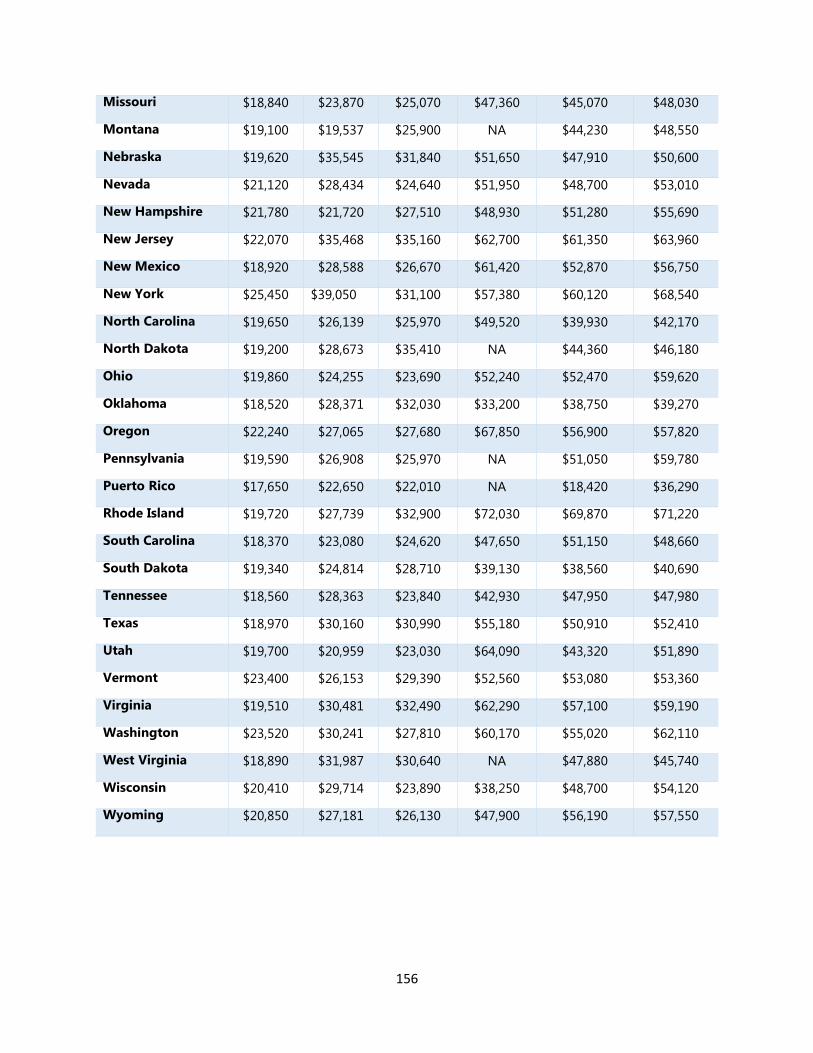
156
Missouri $18,840 $23,870 $25,070 $47,360 $45,070 $48,030
Montana $19,100 $19,537 $25,900 NA $44,230 $48,550
Nebraska $19,620 $35,545 $31,840 $51,650 $47,910 $50,600
Nevada $21,120 $28,434 $24,640 $51,950 $48,700 $53,010
New Hampshire $21,780 $21,720 $27,510 $48,930 $51,280 $55,690
New Jersey $22,070 $35,468 $35,160 $62,700 $61,350 $63,960
New Mexico $18,920 $28,588 $26,670 $61,420 $52,870 $56,750
New York $25,450 $39,050 $31,100 $57,380 $60,120 $68,540
North Carolina $19,650 $26,139 $25,970 $49,520 $39,930 $42,170
North Dakota $19,200 $28,673 $35,410 NA $44,360 $46,180
Ohio $19,860 $24,255 $23,690 $52,240 $52,470 $59,620
Oklahoma $18,520 $28,371 $32,030 $33,200 $38,750 $39,270
Oregon $22,240 $27,065 $27,680 $67,850 $56,900 $57,820
Pennsylvania $19,590 $26,908 $25,970 NA $51,050 $59,780
Puerto Rico $17,650 $22,650 $22,010 NA $18,420 $36,290
Rhode Island $19,720 $27,739 $32,900 $72,030 $69,870 $71,220
South Carolina $18,370 $23,080 $24,620 $47,650 $51,150 $48,660
South Dakota $19,340 $24,814 $28,710 $39,130 $38,560 $40,690
Tennessee $18,560 $28,363 $23,840 $42,930 $47,950 $47,980
Texas $18,970 $30,160 $30,990 $55,180 $50,910 $52,410
Utah $19,700 $20,959 $23,030 $64,090 $43,320 $51,890
Vermont $23,400 $26,153 $29,390 $52,560 $53,080 $53,360
Virginia $19,510 $30,481 $32,490 $62,290 $57,100 $59,190
Washington $23,520 $30,241 $27,810 $60,170 $55,020 $62,110
West Virginia $18,890 $31,987 $30,640 NA $47,880 $45,740
Wisconsin $20,410 $29,714 $23,890 $38,250 $48,700 $54,120
Wyoming $20,850 $27,181 $26,130 $47,900 $56,190 $57,550

157
Appendix 1B.
Federal Efforts to Support the Early Childhood Workforce

158
Reprinted from “High-Quality Early Learning Settings Depend on a High-Quality
Workforce,” by U.S. Department of Health and Human Services and U.S. Department of
Education (2016). Copyright 2016 by U.S. Department of Health and Human Services
and U.S. Department of Education.

159
Appendix 1C.
An Analysis of T.E.A.C.H.

160
Each state has different pay scales, eligibility, as well as alignment with the Quality Rating and Improvement System. We
conducted an in-depth analysis of T.E.A.C.H. analysis to understand compensation strategies in various states.
State T.E.A.C.H. Agency Effects Found Resources
Alabama Alabama Partnership for Children
Average increase in compensation was 8.9% for associate degree participants and 5.4% for bachelor’s degree; average retention rate was 96% for associate degree participants and 98% for bachelor’s degree participants; 100% of recipients and their employers would recommend T.E.A.C.H.
https://smartstartalabama.org/our-work/t-e-a-c-h/
Colorado Early Childhood Council Leadership Alliance (ECCLA)
100% of participants would recommend; 5% wage increase; 0% turnover
https://ecclacolorado.org/t-e-a-c-h-early-childhood-colorado-scholarship-program/
Delaware Delaware Association for the Education of Young Children
89% of associate degree scholars remained with their sponsoring employer; 88% of Bachelor degree scholars remained with their sponsoring employer
https://deaeyc.org/t-e-a-c-h-early-childhood
District of Columbia
National Black Child Development Institute
All participants’ compensation increased by 5% or $0.41 per hour; the average GPA for associate degree participants was 3.16 and the average GPA for bachelor’s degree participants was 3.06; average of 13.5 credit hours for associate degree and 13.4 credit hours for bachelor’s degree
https://teach.nbcdi.org/
Florida Children’s Forum, Inc
More than 37,000 scholarship awarded since 1998; turnover rate is less than 6% for participants; recipients took 17, 689 credit hours over the past year; average GPA among participants was 3.33; participants
http://teach-fl.org/

161
had an average increase in wages of 6.4% over the fiscal year; turnover rate for recipients wad 6%
Indiana Indiana Association for the Education of Young Children (IAEYC)
Average increase in compensation was 6% for associate degree participants and 9% for bachelor’s degree; average retention rate was 98% for associate degree participants and 99% for bachelor’s degree participants
http://www.iaeyc.org/programs-research/teach-early-childhood-indiana/
Iowa Iowa Association for the Education of Young Children
95% retention rate for their job; all participants reported that they would recommend T.E.A.C.H.
http://www.iowaaeyc.org/teach.cfm (http://www.iowaaeyc.org/scholarship-options.cfm)
Michigan Michigan Association for the Education of Young Children (MIAEYC)
1,789 participants took 7,108 credits; 5% turnover rate as compared to 13% nationally
http://www.miaeyc.org/professional-development/t-e-a-c-h-scholarships/
Minnesota Child Care Aware® of Minnesota
14% wage increase for those with an associate degree; 11% for a bachelor’s degree; 5% turnover rate for those with an associate degree; 6% for a bachelor’s degree; 93% still working in early childhood education; average associate degree recipients completed 15 credits, bachelor's degree recipients completed 17 credits
http://childcareawaremn.org/professionals-caregivers/grants-scholarships/teach-scholarships
Missouri Child Care Aware® of Missouri
11 college credit hours earned per contract (with an average GPA of 3.2); 5% average increase in salary per completed contract; 97% retention of recipients with completed contract
https://teach-missouri.org/
Nebraska Nebraska Association for the
An average wage increase for participants with an associate degree scholarship was 8.7%; those participants had 93%
http://www.nebraskaaeyc.org/teach-early-childhoodreg.html

162
Education of Young Children
retention rate; an average wage increase for participants with an bachelor’s degree scholarship was 8.6%, those participants had 97% retention rate; 100% of recipients and employers would recommend T.E.A.C.H.
Nevada NevAEYC Participants had an average of 8% increase in compensation; T.E.A.C.H. recipients have less than 6% turnover rate; 94,458 credits earned
http://nvteach.org/the-teach-program/
North Carolina Child Care Services Association
Earn more each year in program; turnover rate goes down each year in program
https://www.childcareservices.org/teach-nc/
Ohio Ohio Child Care Resource and Referral Association
94% retention rate; 8% compensation increase per year per employee
https://occrra.org/wd/
Pennsylvania Pennsylvania Child Care Association
Average increase in compensation was 7% for associate degree participants and 5.7% for bachelor’s degree; average retention rate was 98% for associate degree participants and 100% for bachelor’s degree participants
https://www.pacca.org/teach.php
Rhode Island Rhode Island Association for the Education of Young Children
Average increase in compensation was 8.7% for associate degree participants and 11.3% for bachelor’s degree; average retention rate was 97% for associate degree participants and 93% for bachelor’s degree participants; average GPA was 3.38 for associate degree participants and 3.74 for bachelor’s degree participants
http://teach-ri.org/
South Carolina South Carolina Center for Child
8% earnings gain annually; 14% average annual site-based turnover rate
http://www.sc-ccccd.net/TEACH/TEACH.html

163
Care Career Development
Texas Texas Association for the Education of Young Children
1,023 scholarships awarded; 550 credentials earned; average wage increase was 13% for bachelor’s degree participants and 17% for associate’s degree participants; retention rate was 100% for bachelor’s degree participants, 94% for associate’s degree participants, and 90% for CDA Assessment participants
http://www.texasaeyc.org/programs/teach (http://www.texasaeyc.org/programs/teach/scholarship_models)
Utah Utah Association for the Education of Young Children
Average wage increase for those who completed their contract year was 4%
http://www.uaeyc.org/t.e.a.c.h.-early-childhood.html
Vermont Vermont Association for the Education of Young Children
Average increase in compensation for associate degree participants was 10.1%; average retention rate for associate degree participants was 93%; average GPA for associate degree participants was 3.43
http://vaeyc.org/programs-and-services/teach/ (http://vaeyc.org/programs-and-services/teach/scholarship-options/)
Wisconsin Wisconsin Early Childhood Association (WECA)
Average increase in compensation was 7% for associate degree participants and 5% for bachelor’s degree; average retention rate was 93% for associate degree participants and 92% for bachelor’s degree participants; 98% of recipients and 89% of employers would recommend T.E.A.C.H.
https://wisconsinearlychildhood.org/programs/t-e-a-c-h/ (https://wisconsinearlychildhood.org/programs/t-e-a-c-h/scholarship-types/)

164
Appendix 2A:
Educators Survey Open-ended Questions Raw Data

165
Q10 - If you would like to leave any comment about your answer to the previous question, please
leave here.
So very expensive to live in Alaska. And I have huge medical bills because my insurance has a high deductible.
I have a lot of debt from advanced degrees
Going to school and working is the situation where I can't cover all of the costs.
The state supost to pay 10 hrs . but realy they pay 8 hrs.
I rent a dry cabin out of town. I cannot afford to rent closer to town. I grow some food and sometimes use the food bank. My child gets free lunch during school year
I would like to be paid more.
I live within my means and don't take out loans.
We are in debt to cover basic expenses like medical
If I was a single parent, I would need assistance to provide for my family's basic needs. 6 of our 9 employees are receiving state assistance.
29,000
I am attending college for elementary education in Washington state, so I am only able to work during breaks like winter and summer breaks. I just got hired for a new child care job so I am unsure about some of these questions since I don't start working until next week.
I do not recieve any income. All tuition goes to cover the employee payroll and bills.
Supporting two people off of one income is very difficult and would not be possible without the assistance of a credit card.
I was on a contract, self-employed. No benefits.
I was out of work for the past few months so I don't have a complete tax return to base my answer on.
Where we live in Northwest Alaska, we have the highest cost of living in the state. Most of my wages go to heating fuel, utilities, and part of our house payment.
We live paycheck to paycheck.
Student loans are murdering me
I just started working inAlaska April 2019. From Southern California
I work too many hours, it should to pay all of my expenses,. It is not fare :(
This is also with the support and income from my husband's income.
Housing, food, and utilities are all very expensive here. I rent from family to make ends meet.
My salary does not cover my children's health insurance nor my mortgage payment.
N/a

166
100% of my wages from my full time job cover my monthly expenses including housing, utilities, insurances, car, debts, gas and food. My second and third job are for spending money.
Some months better than others...barely cover monthly expenses with nothing left over...live paycheck to paycheck.
My husband earns more money than I do. He works for CBJ full time, year round. I work for the JSD full time, 10 months a year. It is still a challenge to cover all expenses and our children's activities with the high cost of living in Juneau.
Periods without pay are difficult and either contract work or unemployment help.
I am single and share an apartment with roommates. My wage would not cover my expenses if I lived alone or had children to care for.
I’m retired and do this as a community service.
My wage per month is not enough.
I love children and want the best for them. Here in ak they have a very aggressive angry approch to the children. I have kids comming to me weekly in tears due to another staff members actions
I am Salary employee.
A little over half of my monthly salary goes to pay rent. Rent is very expensive.
I would like to have a better salary
it takes my husband and my low wages to skim by
I would not be able to cover my expenses if my husband did not have a good job
I went from 48 weeks of 40 hours to 12 weeks of 30 hours and 38 weeks of 40 hours. More than 50% of my wages goes towards housing. I've had to use earnings from current and past PFD's to meet my expenses. I utizlize WIC, TEFAP and the food pantry at work.
Being selfemployed means we paid 15%, employee taxes, workers comps, liability insurance, property taxes, home and auto insurance, health insurance. Last year between me and husband made only $46,000 profit. Our expenses which includes medical collection, children braces, rent, plus business expenses were $50,000 over income.
I feel like as childcare providers we should get paid more We do lots of training and a lot of work for the development and learning for children
My salary is not enough to get a decent a BR apartment and go to school at the same time
My spouse and I cover our expenses hence why I picked part
I support only myself on my salary.
I left work because the pay didnt even cover gas after i paid for friends to watch my boys.
Now that I am separating from my partner, I am finding that even this executive salary is difficult o love on if you want to be a home owner
Just started employment in Alaska, moved from California.
I work two other part time jobs as well
167
medical and dental expenses could derail me at any time
in alaska wages vs cost of living is very high. though it may seem as we make more we dont when bassic neccessities are extrememly expensive
The wage doesn't leave much room for emergencies.
I currenlty do the job of 3-4 people, when staff is not avalbule, I am the cokk, van driver, assitant teacher and lead teacher, and break relife and the assistant administrator.
As a previous in home daycare provider licensed in the state of Alaska I can say with confidence that the current rates for our subsidy program do not even begin to touch the basic costs of running an in-home daycare. Without a food subsidy or an energy subsidy I was forced to find other employment and close my daycare to meet the needs of my growing family. We need more input for actual real costs in bush Alaska.
Between my income combined with my husband's, we can make it work. My husband's job also offers a subsidy program (DOD). Without that, we would not be able to afford child care for our two girls.
Husband is on social security. My wages don’t quite cover the balance. We are looking for work.
My wage covers "most" of my expenses because we own our vehicle outright and have worked to decrease out debt significantly, otherwise it would only cover "part" of my expenses
Food stamps have been necessary
I have three children and medical expenses are very high.
I still live with my parents
My wage covers all of my expenses but due to student loans things can be tight
It's tight month-to-month.
I am married and depend on our combined salaries. My wage does not cover half of our combined expenses.
I currently live with my parents as I do not make enough to live on my own.
I typically have a $1,000 + balance on my credit card at the end of each month.
Approx $12,000 of above income was taxable per diem as I travel away from home approx 15 weeks per year.
Retired so did not answer
I have find a new apartment and have been having a hard time finding something in my budget.
I take home 1604.80/month after deductions. Our health care benefits costs are high.
We also rely on rental income
Living frugal and alone, my wage covers all my bills with little leave until next pay check
Some months my wage is more/less, friending on my enrollment. This is an average.

168
Its not enough to live off of...not in alaska..
My salary is not suitable for a single income parent. It covers day care only which is also expensive.
I have student loans for my masters degree. I'm required to have a masters degree to the ILP programs. Yet there is no help to repay my loans and I am paid 20-30,000 less than a school district with the same years of experience and college education!!! Something is not balanced!
No
I am salaried, so some of this is different
I work 30 hours a week at a part time job as well
My husbands income pays for most of our expenses.
Wages for early childhood educators does not make ends meet
My income is very fluid because I am a sole proprietor. My income is whatever is left after expenses each month
My husband works seasonally.
My partner works a part time job and is a full time student. Those funds combined supports our household.
after taxes and health insurance, I still need the child support I get from my child's father to help cover most expenses for my child, including after school care and extra-curriculars.
I have another part-time job to supplement my employment.
My partner supplies some of the wages for our household so we can cover all expenses.

169
Q13 - If you would like to leave any comment regarding your answers in this section, please leave
here.
If you would like to leave any comment regarding your answers in this section, please leave here.
I am not employee for another agency because I have my husband support.
I am a full time teacher in a public school
My husband works 2 jobs to help us with rent and any other bills. My teaching job only pays for part of the insurance.
I would like the help in medical and food.
I did not receive medical insurance through work because it felt cost prohibitive even though I was not exempt from the fine. My workplace offers more of the benefits listed than I clicked on, because I chose not to accept them.
My little one is our foster child. We receive state childcare for now. We will be adopting within the next 3 months and will loose the assistance.
Medicaid, food stamps, WIC, Child Care Subsidy, Temporary Assistance
I qualify for medicaid but I am a tribal member so I did not need to renew it since I am covered by my tribe for medical.
Was on Medicaid but my salary made me over income and I did not qualify.
I hold 3 other jobs and have to be very careful with my money.
Providers should have benefits a least sick days!
I am Spanish interpreter to make more income
I work for a CCR&R Agency
I have adjunct work to try and continue my professional development and for added income.
These answers are relevant to my current position at thread and not representative of my work in a child care program.
N/a
I love my job. It allows me to be near my children and earn money. I am part of a wonderful teaching community. I love our school- but I don't know how sustainable it is for me long term. Our school is an "alternative program" and attracts many students who do not thrive in the mainstream- yet we do not get funded in an equitable way. It has been a challenge. As the admin assistant I am often the first point of contact outside of the teacher for all of the discipline issues or sick children. I am also covering classrooms and recess quite often out of necessity for the school to function. This is stressful. I love our community- but the work can be a real challenge.
we work in a classroom of 18 children with about 8 Speicle Needs children. there are only two teachers and neather are traned to work with speical Needs childfen. the pay dose not reflect the work that is done.
Looking for a second job
We have PTO based on an accrual system.

170
I feel we dont get payed well when we are the people that plant the seeds and help them grow. I feel many teachers could care less about teaching so the let the kids run wild
the time I spend at my work does not allow me to take a second job. Most do joyner want to hire a part time or weekend only
It's my own business cannot leave. My other job is on call.
Our center recieves states support called the Child Care Grant and the Child Care Assistant. Parents have to apply for it. We also receive a federal grant to help with food costs called the CACFP
Because I make minimum-wage I have four children I have to collect assistance even though I work full-time
Goverment funded assistance doesn't support single working college students, I wish they did it will make easier to juggle things.
My husband is the main provider.
I have over a decade and half of experience in the field and my M.Ed; while the staff who work for me make way less and work part-time split shift positions, I do myself often put in 60-75 hours of work weekly; it is unsustainable for me
Pick up seasonal work
WIC
My husband works hard to provide for the family
I make too much money for the subsidies.
when i first started out in this field and my husband didn't make as much money as he does now, we did use WIC and child care subsidy
I have thought about getting a second PT job to supplement my income and/or pay off student loans but my current position requires flexibility to work nights/weekends regularly and it would be difficult to find another position that could work around my primary job
I have held another paid job during the course of this job in order to supplement my income.
I have tried to apply for Medicaid here in the state of Alaska, but they say I make “too much”. I have neglected going to the doctor for medical issues because I cannot cover the co-pay.
If I was unmarried (or had children), I would have a second job.
I have 4 other jobs
No other job, but do supplement income with a rental
With being able to get by currently have not thought about other employment, but may do a driving service in the near future to supplement for expenses.
According to these public support places I make to much money. Which makes no sense to me
It is a pitty that funding does not support paying ILP Developmental Specialists equal to special education teachers working for a school district
I love my job and makiing a difference in children's lives for 42 years. It has been good to our family.
Do not qualify for these services.

171
I work as an early intervention specialist a coupe days a month
I am at the point where you don’t make enough to get expenses covered but you Make too much for getting food stamps. I need to go to food banks often.
Minimum wage has to be set up in early childhood education programs in AK.
Even though my wage is higher than teaching staff, the demands of overseeing the program are great and once overtime is factored in the wage is reduced since I am salaried.
I occasionally will accept side jobs to help out with bills, (i.e. house sitting, baby sitting, etc.)
I do receive child support for my son.

172
Q18 - Could you tell us why you want to leave?
Moving up in pay, into private therapy services
UAA college lost its accreditation
I’m a certified teacher ecc - 8th grade. When I need to make more money, I’ll need to go back to the school dist. 3x the money plus better retirement benefits
I would like to pursue a career in nursing and I just got my CNA license and would like to make more money doing that.
Retirement
retirement
moving to a different state
My position is the admin assistant but so far I have to cover classroom and am not able to fulfill my job duties. With respect the admin is doing the best she can but low staff and when you jump all the the place in all position with this pay grade is not worth it.
I need to find employment with health insurance and retirement. I also need to increase my earnings to support my family.
Career progression
Will be moving for spouse job
Low salery
no income
As a State Certified Teacher, I could have better wages and all the above benefits.
The pay, time off.
better pay
Was not retained
Lack of communication- upper management adding on too many new programs on without providing high quality care for current programs
I’m ready for something new.
I do not plan to stay in Alaska
I have pursued and completed a BAS in Early Childhood hoping move up as well as impact the field in doing so. Unfortunately there is so competitive pay after finishing school and BAS degrees are not even required for some admin positions. Many employees are able to get those jobs just because of number of years in the field. What is so frustrating is the fact that we want our staff to be educated but if there are non personal opportunities to gain from that, why would anyone bother to spend their money and time. It’s unfortunate and I had to pay the price.
Alaska politics are scary. Tired of living in my town. Want to be closer to family in lower 48
More pay, summer off & longer days off for holidays

173
retirement
retiring
retirement
The job is very stressful and not always effective/meaningful. I want a job that I can really invest in. Money is also a factor. I don't feel confident that I'll be able to support myself and that's a very uncomfortable feeling.
I am a retired teacher and this child development position was to supplement my income
Pursue a different field
I want to doing something differ i bebdoing it for ten year.
Lots of work, lower pay, even though I love it
To be home with my kids
Im at the top of the payscale and need to make more
Stress of job—early intervention has too many things to document and it distracts from work
Husband’s job will transfer
Pay and workload. Grossly underpaid and overworked!
High stress of working in a public school- many children with trauma and not enough in school support for these children. Due to JSD budget our school only has a part time administrator and many students with high needs. Also lack of substitute teachers. When teachers are sick there are often no subs- which means the administrator or myself covers the classroom- this leads to us being behind on our own work.
retire
the Dricater dose not support the teachers. or care about the program or kids. the rules for staff and parents change on a daily bases.
Low pay, limited opportunities for promotion, unorganized company structure
I will be finishing my Master in Ed. Leadership and wish to find a Manager position with another agency as there is no room for growth at my current agency.
Not enough hours and pay
Moving out of State to be closer to family
I am not confident this job can support me as I progress towards larger financial goals (homeownership, parenthood, etc).
Teachers out here are to mean to the kids
to live here it takes over half of my monthly salary to pay rent and buying groceries is the very expensive. I don't earn enough to keep supporting my family. I want to move back to the another state where the rent is more affordable.
not enough money to truly survive or support moving up in education

174
More money
The salary doesn't compensate for the work load.
I plan to retire in 4-5 years, but I'm considering leaving sooner for 40 hours year around.
Retirement. This is a post retirement position.
Wage is not livable and support from administrators does not meet expectations
Not enough support from the management and not enough professional training.
Retirement
Pay doesn't the basics. We save money having me at home.
affect policy at a higher level; pay increase
I don’t want to live paycheck to paycheck anymore. I need a sustainable wage.
Unorganized, not following best practice
Benifits, increase pay, summers off.
I want to start a family and could not handle the stress of the job while doing that.
Maybe moving to another state
I have no retirement or medical benefits
To much stress and not info pay for the amount of work that I do. I also have been dinedad days off. I have to come in early before my shift and stay late. I also dont get hardly any breaks or noen at all.
Military family and we are transferring to a new duty station.
There is not retirement at this job. I want to be able to establish a retirement fund.
The pay and benefits aren’t enough to live on. Some centers require too much work for one person to handle, yet expect excellence. Some have a double standard and play favorite, giving preferential hours and training/advancement opportunities to family and friends.
Stress of operating a program without enough qualified staff
Pursuing my degree in teaching, when finished I will teach
Pursue ABA
no benefits, low wage
I need more benefits
Teacher are overworked and under recognized. I say this with a sad heart, but it is too hard to be both a parent and teacher if these children. There is little support for teachers dealing with children with behaviors and the political climate is demoralizing.
Need higher pay with benefits

175
I've been here over 10 years and there are no advancement opportunities unless the admin positions turn over
Turnover is high, pay is so-so, don't love the work, and looking to leave the state.
I can't afford to my bills
I don’t want to leave but my husband is military and we relocate every few years.
I am not making enough, and it is getting difficult to get by. I live paycheck to paycheck.
I need more consistency in my hours. I've lost my passion for teaching.
Moving out of State
Our Title I public school system is a joke. I prefer to work with this population, but I cannot continue to watch them suffer due to others lack of professionalism. Even with a 70-90% growth achievement in my classrooms, I am not treated as an equal. I have found that people are content with maintaining the current system and if you try to change a system that is not working, you're met with hostility. Oh, and the politics with who you know and that defining your stance in a district is ridiculous. You can totally fail a school, but if you know the right people you're still viewed to be "doing your best".
I cannot afford to retire on my current salary, have little retirement set aside and will pursue a different career.
Looking forward to retirement
Moving out of state.
Licensing requirements, even for an in-home program, are ridiculous. I undertake there needs to be regulation but the requirements don't even make sense for many in-home programs. Not worth the time and money it takes . Also, blanket continuing education requirements are also off-base. I have a master's in early childhood, yet I have to keep taking courses I could be teaching...
Too stressful and too much staff turn over
The amount of work and responsibility this job entails does not compare to the salary I make. I love what I do but it just doesn’t suit me financially.
pay scale way to low fo the college education requied and low medical benefits and minimal holidays
I’ve been the owner and operator for the past 12 years. I love what I do, but I’m tired and ready for a change. Im currently on a 5 year plan to move onto something else
I cannot afford to live on 12/hr. My work is skilled and my pay does not reflect that at all. AND no benefits. I am forever a welfare recipient with this job.
retiring at 72
Homeschooling
Not enough money to cover the cost of living
I can’t afford to live off of my current salary. Even with my degree I will not make enough to afford the basics.
Stay home with children.

176
Stress level is very high, parent support is minimal, wages do not sustain living expenses
the amount of work isn't worth the pay and lack of benefits
Low pay and no benefits
I am getting too old to keep up with the demands of my job
Lack of staffing leads to overworked managers and lacking management skills.
Advancement in my career and family life. I am looking for a more family friendly workplace as my partner and I are planning to have another child and need more flexibility in my job so that we can do that and better benefits.
The pay is not worth it
Moving out of Juneau
I'm not satisfied with my job and I need to earn more.

177
Q21 - What would motivate you not to leave your current position?
What would motivate you not to leave your current position?
Higher pay, support for further education, less turn over with other employees
I like my job
A reliable work environment from the supervisors to co-workers.
a more supportive atmosphere in administration
My boss.
More volunteers in the classroom on a regular basis, such as from UAF
Better management and better pay
Higher wages and benefits like health insurance and retirement.
More pay
increase pay
None
The flexibility to work around my school schedule, especially since I go to school in a different state.
Increase in pay and benefits
More competitive salary and job stability.
Good wages, pay for hours actually worked and stable program for children.
Full time status and better pay
higher pay and less documentation of children
N/A
Negative behaviors in the classroom and lack of administrative and parent/family support
Employee wellness- stressful work environment- negitive environment- safety of children
More flexibility in taking time off
I love where I work. I love the people, and there is not a lot of stress. I spent 9 years of my life in public K-12 special education. After reflecting on the experience, I spent 9 years of my life stressed out and under-appreciated. I now feel appreciated with my work and don't foresee leaving. The benefits and pay are also great.
a stipend to pay for student loans
I love my job
Better pay and health insurance

178
A higher salary for sure.
More hands on interactions with children, higher pay and better benefit options for my family/
More meaningful work connected to my skill set, better personal leave and benefits, and higher pay.
Higher pay and/or better benefits,
higher salary
not having job security, stress, conflict
The children in my care
More training and a high paid
I don’t thinking on that, but could be awesome to taking care about,medical insurance, for all providers.
More support for the duties that seem not to demand my skill set. I think it's a waste of time for me to be making copies or cleaning up after lunch. I'd rather be prepping, working with parents, or teaching.
Moving to a new town
Higher pay
Respect, increase in pay
Student Loan Forgiveness
Money and administrative support...teacher aides, smaller classes, etc.
More funding to the JSD for a full time administrator and more interventionists for the classroom.
better working conditions - active board of directors, higher salary, less stress
More Pay and support for the Mangers. More support in the classroom.
More money
Pay increase. Organization re-structure. More challenging opportunities.
Advancement and raise in salary.
More hours, better pay
Strong job security, more academic freedom, and higher wages.
i'm extremely happy where i am
a much higher salary increase and health insurance benefits
More supportive state government of ece
Teachers changing there additudes towardes the childrren as well as pay

179
Higher pay, better work environment
Higher salary
Job stability and higher pay.
Having extra income to cover and paid off my debts, save to take care of my family, and be able to affor medical and health related expenses. Having money to spoil myself once in a great while is also a good motivator.
More opportunities to work hand in hand with staff and or families
more respect, compensation and support
The children; Am more concern about turn over effects to them.
Better pay and leadership that actually understands early childhood and doesnt see the kids as dollar signs.
Better compensation. I’d like to not have to stretch my money so thin. I’d like to be able to afford going to the movies once and a while or a night out.
Vacation & time off to avoid burn out. More pay, more breaks, an extra person to help kiddos who need extra supoort, a cook, a cleaning crew at the end of day for major cleaning. So ican spend quality time wigh kiddos.
Higher pay and better classroom support
Benefits, Retirement
to be treated the way they expect us to treat the families and community we serve; after all we are part of that community as a whole
Higher salary
Higher pay$$$$$
I would want to ipen my own center within in the next year - year and half
Recognizing and finding remedies for the redundancies within state licensing. Increased pay without straining parents/better ratios for subsidies with the state.
I’m not sure.
Money I guess, insurance options I could afford
more money
A political turnaround. Finding education, supporting teachers, building programs for gifted, smaller class sizes- the system is going to crash and they will blame teachers. It’s not moral, ethical or fair. I want out.
Higher salary and benefits
Increase in pay to feel better compensated for my education/experience and amount of time it takes to do this work; Reduction in work load to reduce stress; Feeling effective and like what I do makes a difference
More money. But even if that happened I'd still leave this position in 2-3 years max.

180
Higher pay
More pay
Increase in pay
Significant pay increase and a promotion.
I believe I'm past the point of caring.
A change in job duties that would allow me to feel creative and inspired again.
This is a grant funded position- I am hopeful I will either be able to take another management position in this organization or work toward a PhD and move to the university when this grant ends
The ability to earn enough to retire.
Being able to eat.
Nothing
Higher compensation
#1 competative salary and benefits that commisserate with my education (job minimum requirements), years of experience, and effective outcomes for my students and families!
Shorter hours, more emotional support,
A living wage would be a huge start.
A higher paying salary and support for graduate school
Being paid fairly for the amount of education I have received
If I was caring for orphans, I'd stay
higher pay, POSITIVE parent involvement, less stress
the ability to pay myself and all of my staff a living wage and give them raises as they gain skill and knowledge of ECE
Higher Pay
Children and my word given
Having the budget to put more staff in leadership positions
Higher pay
I am currently motivated by the fact that it is not the friendliest time to be Gay. My workplace fully embraces me and treats me exactly as the other employees. I am a valuable member to my agency, just like each of us are, and am valued for my opinions and being an individual. It is scary to see friends who are LGBTQ+ facing discrimination and our protections being stripped. I know my boss "has my back" and I have told her as much in appreciation.
Income and quality of life.

181
Higher pay, better benefits, feeling like a valued member of the team at the center, being listened to by the higher-ups and having my needs taken seriously.
Q24 - Please briefly describe professional development activities that you participated in.
College courses
trainings, volunteering
Conferences and ongoing long distance class
Annual conferences for NAEYC, DEC, AERA, training for infant massage, autism screening
Conferences for NAEYC and local too.
I plan and facilitate the on-site professional development for classroom staff in our program. I also attended an early childhood conference in April.
college courses
Local conference with pull out topic sessions
I’ve done online trainings
Online workshops
training, workshops,conferences
Conscious discipline training
Sur floortime course, wary childhood mental health conference
Course work to fulfill 24 hours of continued education per year for employment
thread training
CDA Credentialing
related to my specific discipline
conferences, reflective supervision/practice
strengthening families, infants and toddlers training
NAEYC Conference, THREAD training, CLASS Tool training meetings
Attended strengthening families, health and safety, mandated reporting, social and emotional development,
conferences and webinars beyond the agency required trainings
CDA, administrator training, continuing education credits.
Mentor program, curriculum class, instructional coaching session
Training days

182
Mandatory Child Abuse Reporter training, Suspension and Expulsion Policy Training, Inclusive Learning Environment, Avoid the Frustration, Talk with Your Hands, ERS: Block Area, Why the Kids Bite, ERS: Reading Area, Introduction to Autism Disorder & Early Signs, A Blueprint for Action: Preventing Suspension and Expulsion, Respect Diversities, Let's Get Up and Move.
Symposium/conference, in person and online training
CPR/First Aid, Circle of seccurity
College classes
elementary education program at Pacific Lutheran University. I had my practicum in a kindergarten class this school year.
CDA, conferances, teleconferances
I put on a training for the agency about functional play. I have attended several other training put on by the agency in house and one early intervention conference.
Required 6 hours for job-health and safety trng.
On line college classes
circle of security, coaching
CLASSstone, ChildPlus, Flip, Wellness Training
Trainings by the district, coaching and a mentor
curriculum, social emotional learning, cooperative learning strategies, positive discipline
on-line training, college courses, conferences
Mental health seminar and blood born pathogens, Confidentiality
Obtaining a CDA
Webs of support, state mandated trainings
College coursework
Required trainings for individuals/Online trainings /STEM-based training/Zero to Three:The Growing Brain
NAEYC conferences, both local and state
Childcare education institute & Mat-su foundation community seminars
Child development Conference, mandatory health and safety training, face to face child development training
Educational Trainings, Reflective Supervision
Seed, learn and grow,Naeyc, thread
online for kindergarten readiness, in service pertinent to certain students

183
I am a regular participant attending to Thread trainings. I am working on my CDA and the Learn and Grow program.
Training
Professional Development Day (twice a year, for training and workshops)
training classes and a conference
Many online and in-person trainings.
professional seminars, a coaching training, and a conference
AAEYC Conference, Infant Mental Health Conference, Fred Pryor training, Early EdU Alliance Institute
Early Childhood Education
Enrolled in A Masters Program
coaching
Taining in First Aide and CPR, How to deal with children who has autism, Interactions with children, safety way of diaper changing, how to deal children tantrums and so much more
Learning and Grow program
Speakers, books, on line trainings
Behavior training, technology training
Classroom management
CDA renewal
Online training
college courses, CCEI
Continuing Ed related to service delivery
College classes
AEYC Symposium
mental health conference, infant learning program 2 day workshop, ASHA birth-3 webinar series
Trauma informed care, conscious discipline, Three P'sree P's
Aeyc conference, online courses, and Inservice trainings
aeyc conference, online trainings, workshop
local child care conference, thread workshops
Early EdU Institute, Fred Pryor Training

184
Head Start Leadership Training, Pre-K CLASS Train the Trainer
Trainings at work and online
Infant Leanring Program_ Feeding Development, Vision and Hearing Screenings, Cultural Competency
Conference
Foundations training, district curricular training
my program provides online trainings free of chagre for the staff, as well as keeps their fingers on the pulse of up coming trainings tha apply and would be interesting to each of us
only trainings inside our school
coaching, training
Cogitive Coaching seminars, AAEYC 2018 Conference.
Conferences
ECE College classes and professional trainings
Clases at University
workshops, conference
Cda, online training
Take thread classes
professional development training easrly childhood related
Symposium on Homelessness/Weaving Our Strengths Together Conference on ACES, Resilience and Trauma Informed Care/Excel Basics and Beyond the Basics training.
Reflective Supervision training, Facilitating Attuned Interactions (FAN)
Online training and professional development classes
Child Care Licensing, Child Development
Conferences and mentorship
Conferences, webinars, coaching training
AK-Infant Mental Health Conference; Annual Early Intervention conference; NRF certification; AK-AIMH Endorsement
Family engagement
College classes, online trainings and NAEYC conference
Thread Trainings
Mentorship

185
Leadership Challenge, http://www.leadershipchallenge.com/Services.aspx; through the Alaska Children's Trust, https://www.alaskachildrenstrust.org/aces-initiative; the state to meet health and Safety regulations; through the Weikart Center for continious improvement tool focused on SEL, http://www.cypq.org/content/selpqa
CPR and first aid. Continuing Education trainings
Workshops, conference, on-line classes
college classes in ECE
AEYC conference, university MA courses, educational conferences
NAEYC conference
SIDS, Strengthening In Famiies, Youth Mental First Aid, Zero to Three, Caring for Out of Home Youth, AEYC conference , Behaviors training
Community seninars: ACES (underststanding adverse childhood experenses), Undoing Racism Workshop
I took three college classes and attended a two day workshop
local early childhood conference, some trainings
online trainings, college courses
homelessness training, begining of school year training , ACES, FAN , car seat tech training
More Than Words training, Feeding Course with Melanie Potock, most weeks there is staff training at work for an hour
Trainings and extending education credits
In house trainings and AAEYC conference
I tack college courses to obtain my bacholors in childed development. I also do 24 hours of certified training a year.
CDA certification, trainings, college coursework etc
Conferences, NAEYC classes/enrollment, Thread seminars, distance courses via universities, BLS training
State training
annual hours for licensing, AEYC annual conference
Online courses
national conferences
coaching, CLASS, mid-manager training, dual language learners
Feeding conference, STAT-MD training, online ASHA conference
NEAR At HOME, FAN, Enrollment and Recruitment conference, Manager training,

186
College courses
In person, virtual, and online for reflective practice and professional licensure-specific training
completed MEd; many conferences and webinars as well
CDA
NAYEC active member, all mandatory certified. .
Online trainings
EC conferences, seminars, webinars, in-service
AAEYC conference as well as guest speakers in-office.
Getting my CDA
CDA
food program training, eccrs training
Child Safety course online, First Aid & CPR
AEYC Conferences, Management Training
Professional Development Days at work, earned my CDA
BA in Early Childhood Education (Conferred in 2018), Training at Anchorage School District
Conferences, webinars
self-study online training
webinars
I am graduating with a masters in early childhood special education this summer.
ASQ Train-the-Trainer 3-day workshop, History & Hope Trauma Informed Care 2-day workshop
It was on several things.
On-line training, local conference
Graduate courses in child & adolescent development, online courses through CCEI, health & safety training through Better Kid Care.
Workshop for toddler age. Strengthening families.
Management retreat; group bonding, strengthening group dynamics
Youth mental first aid, zero to 3 workshop, behaviors and self care workshop, CPI, SIDS and Shaken Baby, Caring for Kids in Foster care
Thread training on classroom policies, University course on EDEC

187
Paid training and college course work
Enhancement trainings, CDA
assessment, infant mental health, working with OCS & court, seed training, mandt,
20-25 hours of annual trainings required by the state of Alaska child care program office
All teachers must complete 20 hrs annually of continuing education.
I attend on line classes, resertification for food program, trainings locally.
Online modules
Child Plus
cultural activities, Inupiaq language activity, Yup'ik dance, and curriculum.
National conference, online training
online training
Infant Mental Health Confrence, Spring Infant Learning Conference
I am in my last year of my bachelors degree in early education
Certificate program
Betterkidcare
I took classes through LifeWays North America
CPR/ead, cda courses, creative curriculum courses
Infant and Early Childhood Mental Health Conference
workshops through Thread Alaska and a college course
university classes
Online Course work
Lead/Kaizen Training, Traveled to 3 sites
Training
Child abuse course and infectious diseases control on online course.
continuing education
NAEYC
Reflective supervision, two training institutes for mental health.
Training Classes, Conferences

188
College courses and on job training thru THREAD and state mandated training
Seminar and workshop
Required training and annual CPR training
I went to a conference in the winter; I've taken a few workshops on teacher development

189
Q30 - If you would like to leave any comment regarding your answers above, please leave here.
As the owner, I do not get a paycheck yet. I expanded my daycare and funds are tight, but I would never leave my daycare for another facility. I love these kids too much.
I do feel emotionally drained from this work, but it's simultaneously rewarding and enjoyable.
I wish that we could have more supplies for our kids.
Energy/ satisfaction influenced by support or lack of support from administration
I feel that pedagogy should be used to evaluate pay along side education and experience. I have worked with many people with both and yet they did not have the heart needed to work with children, or even other adults. When toxic people remain in the workplace because they look good on paper it emotionally drains the people around them with a genuine passion for children's social and emotional development. I have seen many peers leave the field because of toxic peers that were not weeded out by their university or workplace.
I feel the wage does not reflect my knowledge and experience. Other programs with higher wages are very difficult to come by.
N/A
We are the highest paid Center in Juneau, AK
I have worked in the public schools, at Head Start and a start up Community Preschool. The pay was discouraging at Head Start though I was a certified teacher. The community school paid more but no benefits and I worked long hours at all my jobs. My tiny isolated community does not have many well paying jobs for educators. I work at the community preschool because I want it to thrive for our local children. ot have
I have enjoyed working with children. I may still do that but I’m ready to do something else that pays better and works with my schedule.
A few of these questions are not relevant to me as I own my own childcare program. I work very hard to stay inspired and provide a quality preschool program, but it is out of my home. I am compensated well as I am the owner, but there is a huge overhead cost in providing quality care and I put an incredible amount of work in to keep this program what I strive for it to be. It is by far and above the most demanding job I have ever had. I should also note that I would be unable to make it doing this business if my husband did not have a great benefits package for our family.
I work with a variety of families, some days are great, some are good and some are stressful
I learn to love my profession all this training years make me appreciate and have a wide view of child development. We have on our hands the most precious years of a human being. Zero to three years are the most important to impact the kids’s brain. On my opinion we should to have a better compensation for our dedication, time and education we give to our profession.
I work for a CCR&R
Interest, investment and autonomy are most important in my work, then benefits and flexibility (personal leave and family commitments)are important, and then take home pay. These are the 3 most important aspects of my employment.
I would like to continue working on the field of early ages, I love teaching.
I believe pay rate should be based on quality of work and not just education
190
I should mention that my wages and benefits reflect a collective bargaining agreement negotiated by our small union
I love my job, school, and school philosophy. They are like my family. I plan to stay in my position until mg children are through the program. I wish that education was more of a priority in our state so that our school could have the funding it needs. I am lucky to work for the Juneau school district where wages are much higher that private preschools and childcares. I will never go back to a private preschool or childcare due to the ridiculously low wages for the very important work.
My work doesn’t raise our pay even with trainings and education and if they do it is very little sometimes not even a dollar raise.
I believe pay should be structured based on education/training, experience, and merit
I love y program, i feel valued ad supported in a way that i havent before and i havent seen in quite some time
We need to teach our children about mother earth be for technology. Technology may have possitivity but we need to learn how to live with out it.
I feel that in this field we need more paid vacaciones, because I work with infants which I reallyl love but the constant crying and the look of good eficiente and educated coworker make work more And have more responsibility I give my best the parents respect me and really appreciate my work
As an owner I would have a better program if I could offer higher wages and benefits. Employees would be less stressed in their personal life. A higher pay scale would also help me give incentives to those that complete higher education.
I love what I do at my program and would definitely plan on staying until I retire if the pay were higher and I worked 40 hours year around.
Having to recruit employees, plus the higher percentage of quiting is a big struggle and an stressor. I'm depressed and overworked.
I'm currently exhausted because it is summer time, and I would rather be off but I have to work. My vacation is coming up soon.
I absolutely love the center I work at I just wish that she could pay us more but I do know most centers in Juneau Alaska can’t pay their employees enough because they don’t get enough funding to support that I feel like that’s not fair because we do so much work and we should be appreciated for
I look for a company that supports their employees and children in their program and just treating them like incomes.
Unless childcare centers start getting more subsidized income from the state or muni. There is no way to be paying employees more. Unless you transport that burden onto the parents and childcare is already too expensive for the working parents that rely on it to get to work every day.
Alaska has been very challenging to work in. There are many aspect to deal with, and at times difficult to find a good team flow. I would love more hands on with kids rather than cooking and cleaning. I have missed oportunity for learning when warming up food & trying to close ( clean) when i still have kiddos.
I already receive professional development, but would appreciate a bit more. Overall I want to be able to live, eat, stay healthy, and occasionally enjoy myself without having to work three jobs.
There should be more benefits and higher pay. I dont think people realize its one of the hardest jobs. Also you should get paid by years of experience because some didnt have an opportunity or have the money to go to school. The child care centers and preschools should have more training places.
I like my work. I'm good at it. I like children. But I can't stay in the field because I have no retirement. I've stayed too long already
191
I am now a higher pay but that is because i have been at my place of work for 8 years. It is really not that high compared to other jobs.
I believe more funding in general should be allocated to early intervention. What could be avoided in expenditures if we caught issues early?
I am a Teacher Assistant but expected to do the the Teacher dutties in my class and my wages do not reflect it.
I feel that I do far to many things that are outside of my job description to be payed as little as I do.
I run a nonprofit childcare facility, and often the staff are more difficult than the children
I believe my wage is high for my field, but I believe it should be higher based on my education and experience. If I held the same position in another field, I would make significantly more. I wish we had better benefits and retirement, but I know my employer cannot afford it.
I think ongoing training and education is necessary but not enough credit is given to experience. I’ve worked in centers where they hired people with a degree and they knew all the buzzwords but absolutely nothing about children.
Overall I love what I do and I feel passionate about children and families, but the stress of doing this job has reached a boiling point to which I am not sure I will be able to tolerate for much longer
I am looking lately at other job options, but not planning to leave my current job.
I work out the budget for my program and know that funding does not allow for more.
the centers that I chose to work for the money as long as it meets the minimum that my husband and I need to survive is not important. It the philosophy and how they treat the staff and kids that make the final decision.
I do not currently work in a child care facility, I work for the CCR&R. I answered why I chose to first enter the EC field. Now my motivation is improve the quality of child care in AK
I love my coworkers and my center, and it would take a very large increase in pay for me to leave, as well as the knowledge that the new center has an equally fantastic team.
We are the only services in the area. Other services are a plane or boat ride away.
I am moving and find job opportunities are slim in Williston, ND with a much lower pay scale
The pay is not so much a factor, the fact you can do a crap job and be paid high for it is upsetting. I believe teachers should be paid based on their willingness to always be and do better and the results seen through the children then work with.
I love the field of ECE. The reason I would not select if starting over is that I realize as I approach retirement age that I would be able to retire soon if I had worked in elementary/public school system instead of ECE. Even our tax code continues to devalue ECE as evidenced by Educator Expense deduction limited to K-12 teacher, principals, and counselors. Some public perception and policy-makers, who lack understanding of early learning continue to view ECE as "babysitting."
I recently switched jobs within the early childhood/ school age field because I was not adequately compensated (struggled to cover expenses/ made sacrifices at home) and was feeling emotionally drained from working unpaid overtime. I have since moved to a similar position but at an infant/toddler center
I will stay with my current employer until I am ready to make a career change.
I'm self-employed. My families can't afford what it would take to be paid an appropriate wage. My choice to keep prices reasonable... but it's hard to sustain.

192
pay and benefits should reflect professional credentials like public school districts. These are federal and state job training requirements!
We can continue our education all we want; it will never be reflected in our pay or benefits.
I like my job, and i like working with kids and helping them, and working with their parents in the healthyness of their kid.
The cost of childcare in Alaska, especially rural Alaska is astronomically high, which I know affects how much early childhood educators get paid.
Infant Mental Health is my passion
After 6 years in AK, I am burnt out as an administrator. The State and THREAD have pushed programs and the challenges of hiring and retaining staff is too great.

193
Q33 - If you would like to leave any comment about your answer to the previous question, please
leave here.
I feel that the kids should receive all the help in education as possible.
at this stage, retirement or reason to remain are at the forefront of my thoughts
My healthcare insurance is through my spouse
I think all of the above are needed and respect for education in general is important!
Insurance is not an issue for me since I have it through my husband
We are in this field because we love children but one of the issues that concern us is health, we don’t have health insurance, we deserve this benefit, We are raising the future of this country.
I work for a CCR&R but the above also applies to when I worked in a center.
I don't teach in a classroom. If I did, paid planning time would be #5 before job stability
my teacher's retirement plan covered my medical and dental pla
My number one financial stress are my student loan debts and Public Service Loan Forgiveness and this cooter bag Betsy DeVos who trying to dismantle the only system in place to help those in public service
I feel we should be paid more. We are the ones who teach these kids what they know to be who they are.
I wish we got paid more for the work we do
My husband’s job provides our health insurance thankfully.
If I did not receive health insurance through my mom I would be more concerned about it.
It’s a rewarding field with a hard time compensating what people are worth. My husband luckily has health insurance so my family doesn’t have to worry
I am an administrator, so some of the factors (paid planning time) were irrelevant to me.
My employer's benefits package is excellent for me, that is why I am able to say that I wish I had a higher salary, all else being the same. Also, the "threat" of job cuts occurs every year, ostensibly because of our funding structure and status as a non-profit agency.
My priorities are not the standard early educator - I don't work in a child care facility and don't require planning time; My employer provides health insurance but I have other coverage so it's a lower priority for me; I have a M.Ed and don't expect to take additional college courses
As Director/department head advancement is not an issue for me personally, although if that were not the case, it would rank higher on the list as would increase retirement benefits which was not listed.
I think you could add the word effective in front of on-sight training/paid professional development activities, I have never attended a PD that applies/is followed through in the school.
I am in good health and have health insurance through my husband's former employment. If I didn't have that, health insurance would rank higher. I now work as a coach, but when I was teaching I valued that more.
Without full time status, there are no benefits offered at my current position.

194
These aren't relevant to my daycare. I think one of the issues with childcare is how in-home programs are often overlooked and/or treated like centers. They could be so much more.
Number one on my list is job satisfaction. At the end of the day I know I have used my education, training, and have made a difference in the lives of the families I work with. I'm able to do this because of great leadership I serve with.
I have always been self-employed as the owner of home bases, then three centers. So some of it does not apply well
I get insurance through my husband's work
None

195
Appendix 2B:
Leadership Survey Open-ended Questions Raw Data

196
Wage and compensation priorities
Lack of staff and lack of qualified staff is one of the most serious issues facing Alaska's ECCE workforce. We often hear qualified staff leave ECCE and move to the school district and other professions because of better wages and opportunities for benefits. It will be important as we move forward with a wage compensation model to address this. Increased wages/equity with school district wages are needed for qualified individuals who have attained levels 6 and above on the career ladder. Incorporating years of validated experience and knowledge in the ECCE field is a future exploration for the SEED and the SEED Career Ladder. Support for college coursework is in place through a reimbursable service agreement between the CCPO and UAF. PDR funds may also be used to support higher education as well as paid professional development activities. On site training support is available. Opportunities to advance and job stability are supported through 1-5. Items 8-10 are already addressed by many programs.
In our program we need to also prioritize the need for positions
One thing to change in the current compensation model
Have a longevity bonus built in for people who complete full year
Have a standard compensation scale, based on education, training, experience and that accounts for cost of living differences across the state
Add retention wage stipends based on years in a position
I would reevaluate the PDR for FY 2021 and redirect some of the funds currently going to the PDR to UAF to increase the number of scholarships available to individuals wishing to advance in the ECCE field; separate the funding for higher education versus training for better data collection and analysis.
More control with compensation policy
To be able to afford merit increases
More government help for wage bonuses because small nonprofit centers can’t charge parents higher tuition to pay teachers more
The State of Alaska Child Care Assistance Program should have similar rates for Centers and Homes. Many at risk children often need to be removed from large centers with large groups of children and rotating staff to a smaller environment with a consistent caregiver, however the parents on assistance often have to pay a higher co-pay when they transfer from a Center to a Home because the assistance rates are significantly different and do not successfully financially assist the at risk/low income families.
I would give bonus pay for attendance and dependability
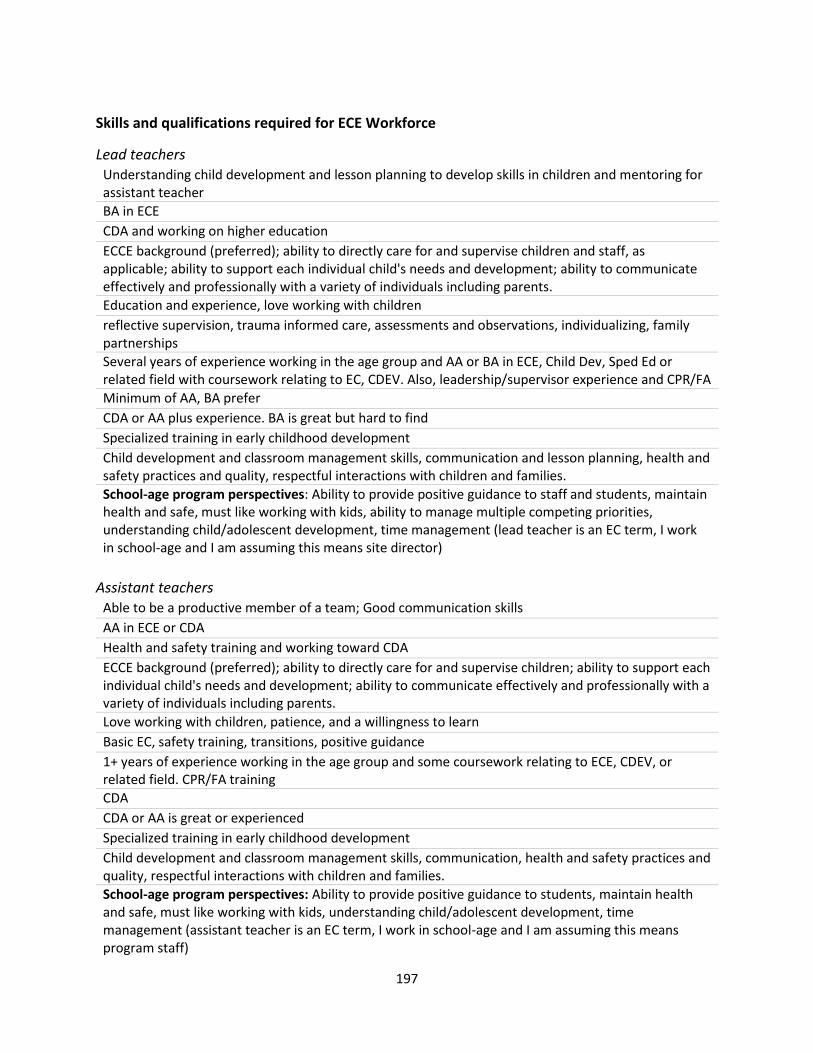
197
Skills and qualifications required for ECE Workforce
Lead teachers Understanding child development and lesson planning to develop skills in children and mentoring for assistant teacher
BA in ECE
CDA and working on higher education
ECCE background (preferred); ability to directly care for and supervise children and staff, as applicable; ability to support each individual child's needs and development; ability to communicate effectively and professionally with a variety of individuals including parents.
Education and experience, love working with children
reflective supervision, trauma informed care, assessments and observations, individualizing, family partnerships
Several years of experience working in the age group and AA or BA in ECE, Child Dev, Sped Ed or related field with coursework relating to EC, CDEV. Also, leadership/supervisor experience and CPR/FA
Minimum of AA, BA prefer
CDA or AA plus experience. BA is great but hard to find
Specialized training in early childhood development
Child development and classroom management skills, communication and lesson planning, health and safety practices and quality, respectful interactions with children and families.
School-age program perspectives: Ability to provide positive guidance to staff and students, maintain health and safe, must like working with kids, ability to manage multiple competing priorities, understanding child/adolescent development, time management (lead teacher is an EC term, I work in school-age and I am assuming this means site director)
Assistant teachers Able to be a productive member of a team; Good communication skills
AA in ECE or CDA
Health and safety training and working toward CDA
ECCE background (preferred); ability to directly care for and supervise children; ability to support each individual child's needs and development; ability to communicate effectively and professionally with a variety of individuals including parents.
Love working with children, patience, and a willingness to learn
Basic EC, safety training, transitions, positive guidance
1+ years of experience working in the age group and some coursework relating to ECE, CDEV, or related field. CPR/FA training
CDA
CDA or AA is great or experienced
Specialized training in early childhood development
Child development and classroom management skills, communication, health and safety practices and quality, respectful interactions with children and families.
School-age program perspectives: Ability to provide positive guidance to students, maintain health and safe, must like working with kids, understanding child/adolescent development, time management (assistant teacher is an EC term, I work in school-age and I am assuming this means program staff)

198
Family child care providers Good Organizational skills
AA in ECE or CDA
CDA and or ECE administrator credential
ECCE background (preferred); business knowledge and/or education and experience (preferred); knowledge of statutes and regulations governing the program/facility and the ability to ensure compliance; ability to directly care for and supervise children; ability to support each individual child's needs and development; ability to communicate effectively and professionally with a variety of individuals including parents.
Education and experience, love working with children, good business model
1+ years of experience working in the age group and some coursework relating to ECE, CDEV, or related field. CPR/FA training, safe environments/ITERS/ECERS assessment
CDA
Licensed, Insured, Health & Safety Training and Prevention is priority. Administrative skills (record keeping, policies, communication, advertising, community involvement, program management, supplies, upgrades, money management and planning). Understanding and Experience with Child Development. Develop a consistent daily schedule to meet all children and provider needs. Provide and understand the importance of the childcare play and learning environment/activities. Have the skills to Promote appropriate social skills, children self-awareness, and independence through practice. Trainings and Experience assist in providing this knowledge. Also, an extreme amount of patience and strong communication skills.
Specialized training in early childhood development
School-age program perspectives: Ability to provide positive guidance to children, maintain health and safety, maintain finical records, manage multiple competing priorities, and understand child/adolescent development; time management
Directors/administrators Fiscal management to effectively utilize existing resources and grant writing experience
BA in ECE
ECE Administrator Credential
Leadership; ECCE background (preferred); business knowledge and/or education and experience; knowledge of statutes and regulations governing the program/facility and ability to ensure compliance; ability to communicate effectively and professionally with a variety of individuals; ability to ensure staff have the resources and tools necessary to successfully deliver services.
Education and experience, love of children, people person, team player, strong leadership qualities
Leadership and management
BA in ECE with knowledge of administrative tasks
College degree with relevant coursework
Same as Family Child Care Providers
Specialized training in early childhood development
Budgeting, CACFP, grant writing, H.R. and program management experience. Vision/leadership skills, advocacy quality assurance

199
School-age program perspectives: Ability to provide positive guidance to staff, maintain finical records, support staff professional growth, ability to manage multiple competing priorities, understanding child/adolescent development, time management (I work in school-age and I am assuming this means Program Manager or non-direct service leadership)
Ongoing State Resources – SEED Registry
Incentives of the SEED Registry for its participants A way to track education & training for those starting out in the ECE field
Documentation of professional development, reimbursement
Funding for trainings
Professional career ladder, access to eligible financial supports, quality trainer and training system, data and advocacy for ECE field
Opportunity to: have a central location to track training and professional development (assists with child care licensing monitoring); be part of the larger ECCE field; to support the field as far for data collection purposes to strengthen awareness about and needs of the field ultimately needed if additional funding/resources are needed to support the field. Participation in the registry also opens doors to other resources such as PDRs and TRs, UAF funding for scholarships, thread training, etc.
Better wage and job stability
Education funding
Reimbursement for school/training
Help with paying fees for college classes and CDA
Career pathway, support toward professional development, training opportunities, a place to house your education documentation
Ability to track progress, help the center advance up the quality improvement system, ability to qualify as lead teacher, etc.
SEED offers professional development reimbursement to eligible programs such as licensed child care settings.
Scholarships, record of professional development, training and levels of advancement on the professional development track.
Access to resources to find quality child care providers, and educational materials
They offer training, evaluate transcripts, financial incentives
200
Recommendations for ongoing quality improvements of the SEED Registry
Give training providers the capabilities to upload trainings
SEED should conduct regularly occurring (annual) survey of SEED participants to determine stratification, needs, and barriers, improve SEED registration process now not in 2 years from now, SEED should be the leading voice advocating in AK for professional development, wages/salaries, and other EC/SA related issues.
Streamlined application process, early educator access to their SEED info and transcripts
Data system enhancements (already in progress) to streamline process and make it more user friendly for individual participants, facilities/programs, as well as agencies with oversight of facilities/programs, etc.
Continued communication with early childhood educators to inform good policy
Think about all the degrees/certifications/coursework that a person truly needs to be on each level
Multiple pathways up the ladder
Flexibility to address range of degrees (Masters in Education, Attorney), clearer & faster communication
When tracking Home Providers trainings - I don't see an easy way for providers that have been licensed for several years (prior to the SEED registry keeping track) who have completed the required annual training hours to upload those training hours and topics in the registry. Possibly work with Licensing to obtain those records and upload them for the providers. In many years past Home providers provided a list to licensing along with copies of the training certificates.
Continuity from year to year in SEED level giving to CCA's. More timely support.

201
Ongoing State Resources – LEARN & GROW
Benefits of LEARN & GROW for its participants Training and supports to help programs starting out and continuing with quality improvement
Funding, professional development supports
Stipends for participation and moving up the steps
Quality standards/activities framework, Training, Technical assistance, intensive resources, financial reward,
Additional supports and resources such as technical assistance, consultation, coaching, mentoring, etc. to advance the program/facility's quality. Opportunity to communicate to parents/public the quality of their program/facility and importance of early childhood and why they are participating.
Knowledge of the Early Childhood field in Anchorage and Alaska and support
Provide the framework for quality
Framework for quality improvement, technical assistance, financial incentive, discounts on supplies
Show they’re a quality center, qualify for certain levels, advertise itself, identify areas needing improvement or attention
Recognition for ongoing quality improvement activities
Recognition be levels to demonstrate a programs professional level. Scholarships for advancement and training.
Specialized training in early childhood development
Recommendations for ongoing quality improvements of LEARN & GROW Have more opportunities for bulk uploads on program side or trainers side
L&G could use to be more transparent about what it is and the type of supports/service provided if you enroll
Increase incentives
Pending full roll out of all five levels
Continue to meet with all partners to get perspective and truly listen to feedback
Quicker and clearer communication with centers, assistance to centers to provide or pay for trainings
Continue to recognize the difference between a Home and Center regarding professional development and the levels of recognition. Help families identify the differences when listing programs levels on referral sites.
This QRIS system has taken years and years and providers are not listened to.

202
Barriers to Change
Barriers to change in SEED Registry, Learn & Grow, and funding mechanism in Alaska Getting program, community, and state buy-in
Fiscal climate of the state of Alaska, SEED and L&G connection to licensing,
Lack of respect and funding from current Governor and his administration for anything ECE
We need to diversify funding to grow and sustain the system. There is currently only one primary funder and only two others contributing to system.
Full buy in and willingness to invest (financially or non-financially, in-kind, etc.) in Learn & Grow from the various oversight/stakeholder agencies of the programs/facilities eligible to participate. Because a fully functioning professional development system (SEED) to include a wage compensation model has not yet been rolled out but is anticipated with ths work and all five levels of Learn & Grow have not yet been implemented with the resources currently available it is difficult to determine what additional resources (financial and staff) are needed.
Current economic challenges in Alaska
Long standing distrust of SEED and thread which are perceived to be the same, SEED training requirements that are coincidently only provided by thread
They are all governed by the same organization THREAD. There needs to be more partnership with other agencies and organizations as a part of their executive team/committees
The current administration doesn't see the benefits of ECE and takes away funding
Knowledge gaps, capacity
Societally too many people still view childcare as unnecessary babysitting. Political budget cuts to assistance programs. Govt help to centers is needed to pay teachers more.
The loss of accreditation for the early education program with the University of AK will not assist in the financial promotions that thread offers for higher education.
Broadband speed
I don't think any of the SEED people have operational experience and they expect support for unrealistic goals. There does not seem to be anyone to share concerns with.

203
Potential solution for overcoming those barriers Starting more conversations/ Sharing more information. Excited about upcoming media campaign. That can be a huge opportunity.
Make being a leading voice/advocate for the field top priority, continue making it both system clear and transparent - explain funding sources - connection to thread - etc.
New Governor and administration
A compensation model that is understood and supported by the public so that SEED can solicit additional resources
Roll out fully functioning (desired) SEED and Learn & Grow systems with currently available resources, and restrict or limit participation as needed while using data to track and inform decisions for asks to advance this work. Increase communication and marketing of these systems to inform and education the public, when applicable/desired.
Engagement and communication with Early Childhood Educators and the public regarding benefits of early childhood programs
Q & A sessions, good marketing, consistent information being shared, surveys
Bring all partners together to have a real discussion and also ensure all parties are involved with the executive committee not just people who represent more than one agency/organization and say each partner had a voice.
We have to change the mindset of the community
Electing leaders who value early childhood ed and understand the many varied aspects of the problem
Approach a trade school to implement an early care and learning degree/certification program.
It would be great to not hear the thread director say 'we'll discuss this off-line'. It appears that decisions are made by them and we are there for the optics.

204
Final suggestions to improve the compensation and other systems for the childcare workforce
Sharing the information to stakeholders
Provide stable funding for programs.
Develop creative partnerships with DOL, apprenticeship programs, work ready organizations, high school career tech programs. Benefits could be offered to more teachers to offset wages and provide concrete support. The state could build pay incentives for teachers or programs based on teacher longevity, education and training milestones
Would like to suggest the group consider ensuring that whatever wage compensation incentive/enhancement that is put in place is in addition to a facility/program ensuring as a business that they have a successful business model/plan that ensures financial resources are available to pay their staff at least minimum wage. The wage compensation from SEED is in addition to and that accountability, including fiscal accountability is built in at all levels (individual, program, system, etc.). Also, in general, for the state leadership team not to take on any new projects/priorities and to stay focused on fully rolling out these systems.
Engagement and communication with Alaskan families and Early Childhood Educators regarding benefits of early childhood programs
The state needs to take a more active role in ensuring they appreciate and support Early Education
Small centers without endowments or corporate homes can’t increase child tuition to pay teachers more. Govt help is needed.
As stated - Child Care Assistance rates should be the same or very similar for Centers and Homes so that low income families can afford Home Child Care. Continue with the collaborated training and distribution for upgraded and needed items such as the cribs and sleeping mats.
Less money for 'referral systems' and more practical training upon request.

205
Appendix 3A.
Research Methodology
Phase 1: National Landscape Review
-Research Articles
-Policy Reports
-Currently Available ECE Wageand Compensation Programs
-QRIS Standards
Phase 2: Research in Alaska: Needs Assessment
-Educator Survey (n=288)
-In-depth Interviews (n=12)
-SEED Steering CommitteeLeadership Survey (n=16)
-Leadership FocusGroup/Interviews (n=5)
Phase 3: Validation Study
-In-depth ValidationInterviews (n=8)
-Final Recommendations
3C-Alaska
Alaska’s
Commitment to
Compensation
and Competency
206
References
Ackerman, D. J. (2006). The costs of being a child care teacher: Revisiting the problem of
low wages. Educational Policy, 20(1), 85-112.
Barnett, W. S., & Kasmin, R. (2017). Teacher compensation parity policies and state-
funded pre-k programs. Center for the Study of Child Care Employment,
University of California, Berkeley.
Butrymowicz, S., & Mader, J. (2016). How the military created the best child care system
in the nation. Retrieved from https://hechingerreport.org/how-the-military-
created-the-best-child-care-system-in-the-nation/.
Center for the Study of Child Care Employment. (2018). Early Childhood Workforce Index
[PDF file]. Retrieved from http://cscce.berkeley.edu/files/2018/06/Early-
Childhood-Workforce-Index-2018.pdf.
Child Care Aware of America (2019). 2019 State Child Care Facts in the State of Alaska.
Retrieved from
https://cdn2.hubspot.net/hubfs/3957809/State%20Fact%20Sheets%202019/Alask
a%202019.pdf
Child Care WAGE$ Iowa (n.d.). Retrieved from http://www.iowaaeyc.org/wage.cfm.
Cleveland, G. H., & Hyatt, D. E. (2002). Child care workers’ wages: New evidence on
returns to education, experience, job tenure and auspice. Journal of Population
Economics, 15, 575-597.
Clotfelter, C., Glennie, E., Ladd, H., & Vigdor, J. (2006). Would higher salaries keep
teachers in high-poverty schools? Evidence from a policy intervention in North
Carolina. Journal of Public Economics, 92, 1352-1370.
CWAGES. (n.d.). Retrieved from http://sfoece.org/cwages/.
Deci, E. L., & Ryan, R. M. (2000). The" what" and" why" of goal pursuits: Human needs
and the self-determination of behavior. Psychological Inquiry, 11(4), 227-268.

207
Deckop, J. R., Konrad, A. M., Perlmutter, F. D., & Freely, J. L. (2006). The effect of human
resource management practices on the job retention of former welfare clients.
Human Resource Management, 45(4), 539–559.
DoDEA Sure Start Program. (2018). Retrieved from
https://www.dodea.edu/Offices/PolicyAndLegislation/upload/RG-1307-01-Sure-
Start-Program-Ch-1-2-May-2018.pdf.
Fitzgerald, M. M. (2014). Head Start Professional Development: great leadership, great
intentions and great expectations. NHSA Dialog, 17(3).
Gable, S., Rothrauff, T. C., Thornburg, K. R., & Mauzy, D. (2007). Cash incentives and
turnover in center-based child care staff. Early Childhood Research Quarterly, 22,
363-378.
Gaylor, E., Ferguson, K., McCracken, M., Wei, X., & Spiker, D. (2018). Evaluation of child
outcomes in nine Child-Parent Centers: Report for 2016-17. Prepared for IFF Pay
for Success I, LLC. Menlo Park, CA: SRI International.
Georgia Department of Early Care and Learning. (2018). Georgia’s pre-K program 2018-
2019 school year: Pre-K providers’ operating guidelines. Retrieved from
http://www.decal.ga.gov/documents/attachments/GuidelinesText.pdf.
Ghazvini, A., & Mullis, R. L. (2002). Center-based care for young children: Examining
predictors of quality. The Journal of Genetic Psychology, 163(1), 112-125.
Gilpin, G. A. (2011). Reevaluating the effect of non-teaching wages on teacher attrition.
Economics of Education Review, 30, 598-616.
Grayson, J. L., & Alvarez, H. K. (2008). School climate factors relating to teacher burnout:
A mediator model. Teaching and Teacher Education, 24(5), 1349-1363.
Guarino, C. M., Santibanez, L., & Daley, G. A. (2006). Teacher recruitment and retention:
A review of the recent empirical literature. Review of Educational Research, 76(2),
173-208.

208
Hale-Jinks, C., Knopf, H., & Kemple, K. (2006). Tackling teacher turnover in child care:
Understanding causes and consequences, identifying solutions. Childhood
Education, 82(4), 219-226.
Hanushek, E. A., & Rivkin, S. G. (2007). Pay, working conditions, and teacher quality. The
Future of Children, 17(1), 69-86.
Head Start Bureau. (2013). Head Start fact sheet. Retrieved from
https://eclkc.ohs.acf.hhs.gov/hslc/data/factsheets/docs/hs-program-fact-sheet-
2013.pdf.
Head Start Program Information Report (2015). Summary data for FY2015. Retrieved
from http://eclkc.ohs.acf.hhs.gov/hslc/data/factsheets/docs/hs-program-fact-
sheet-2015-final-2.pdf.
Heckman, J. J., Moon, S. H., Pinto, R., Savelyev, P. A., & Yavitz, A. (2010). The rate of
return to the High/Scope Perry Preschool Program. Journal of Public Economics,
94, 114–128.
Hendricks, M. D. (2014). Does it pay to pay teachers more? Evidence from Texas. Journal
of Public Economics, 109, 50-63.
Herzenberg, S., Price, M., & Bradley, D. (2005). Losing ground in early childhood
education: Declining workforce qualifications in an expanding industry, 1979-
2004.
Hill H. D. (2013). Paid sick leave and job stability. Work and Occupations, 40(2).
Holochwost, S. J., DeMott, K., Buell, M., Yannetta, K., & Amsden, D. (2009). Retention of
staff in the early childhood education workforce. Child Youth Care Forum, 38,
227-237.
Jeon, L., Buettner, C. K., & Grant, A. A. (2018). Early childhood teachers’ psychological
well-being: Exploring potential predictors of depression, stress, and emotional
exhaustion. Early education and development, 29(1), 53-69.
209
Johnco, C., Salloum, A., Olson, K. R., & Edwards, L. M. (2014). Child welfare workers’
perspective on contributing factors to retention and turnover: Recommendations
for improvement. Children and Youth Services Review, 47, 397-407.
Kelly, S. (2004). An event history analysis of teacher attrition: Salary, teacher tracking,
and socially disadvantaged schools. The Journal of Experimental Education, 72(3),
195-220.
King, E. K., Johnson, A. V., Cassidy, D. J., Wang, Y. C., Lower, J. K., & Kintner-Duffy, V.
L. (2016). Preschool teachers’ financial well-being and work time supports:
Associations with children’s emotional expressions and behaviors in classrooms.
Early Childhood Education Journal, 44, 545-553.
Kontos, S., & File, N. (1992). Conditions of employment, job satisfaction, and job
commitment among early intervention personnel. Journal of Early Intervention,
16(2), 155-165.
Levitan, S. (1969) The Great Society’s Poor Law: A new approach to poverty. Baltimore,
MD: Johns Hopkins University Press.
Living Wage Calculator (n.d.). Retrieved from http://livingwage.mit.edu/states/02
LoCasale-Crouch, J., Konold, T., Pianta, R., Howes, C., Burchinal, M., Bryant, D.,...Barbarin,
O. (2007). Observed classroom quality profiles in state-funded pre-kindergarten
programs and associations with teacher, program, and classroom characteristics.
Early Childhood Research Quarterly, 22(1), 3-17. doi: 10.1016/j.ecresq.2006.05.001
Manlove, E. E., & Guzell, J. R. (1997). Intention to leave, anticipated reasons for leaving,
and 12-month turnover of child care center staff. Early Childhood Research
Quarterly, 12, 145-167.
McDonald, P., Thorpe, K., & Irvine, S. (2018). Low pay but still we stay: Retention in early
childhood education and care. Journal of Industrial Relations, 60(5), 647-668.

210
McLean, C., Dichter, H., & Whitebook, M. (2017). Strategies in pursuit of pre-K teacher
compensation parity: Lessons from seven states and cities. Berkeley, CA: Center
for the Study of Child Care Employment, University of California, Berkeley and
New Brunswick, NJ: the National Institute for Early Education Research.
National Academies of Sciences, Engineering, and Medicine. (2018). Transforming the
Financing of Early Care and Education. Washington, DC: The National Academies
Press.
National Survey of Early Care and Education. (2013). Number and characteristics of early
care and education (ECE) teachers and caregivers: Initial findings from the
National Survey of Early Care and Education (NSECE). Washington, DC: Office of
Planning, Research and Evaluation, Administration for Children and Families, U.S.
Department of Health and Human Services.
Phillips, D., Howes, C., & Whitebook, M. (1991). Child care as an adult work environment.
Journal of Social Issues, 47(2), 49-70.
Phillips, D., Mekos, D., Scarr, S., McCartney, K., & Abbott-Shim, M. (2000). Within and
beyond the classroom door: Assessing quality in child care centers. Early
Childhood Research Quarterly, 14, 475-496.
Pianta, R., Howes, C., Burchinal, M,, Bryant, D., Clifford, R., Early, D., & Barbarin, O. (2005).
Features of pre-kindergarten programs, classrooms, and teachers: Do they predict
observed classroom quality and child–teacher interactions? Applied
Developmental Science, 9(3), 144-159. doi: 10.1207/s1532480xads0903_2
Shdaimah, C., Palley, E., & Miller, A. (2018). Voices of child care providers: An exploratory
study on the impact of policy changes. International Journal of Child Care and
Education Policy, 12(4), 1-18.
Stearns, S. C., & D'Arcy, L. P. (2008). Staying the Course: Facility and Profession Retention
Among Nursing Assistants in Nursing Homes. The Journals of Gerontology, 63(3),

211
113–121.
Stockard, J., & Lehman, M. B. (2004). Influences on the satisfaction and retention of 1st-
year teachers: The importance of effective school management. Educational
Administration Quarterly, 40(5), 742-771.
Stoney, L., Bronfin, M., & Rahim, M. C. (2016). Giving credit where it’s due: School
readiness tax credits benefit Louisiana families and communities [PDF file].
Retrieved from
http://media.wix.com/ugd/43cca3_5dd38dfb258f476b81b2432d9ee6c356.pdf
Stremmel, A. J. (1991). Predictors of intention to leave child care work. Early Childhood
Research Quarterly, 6, 285-298.
Sure Start Program Guide. (2009). Retrieved from
https://www.dodea.edu/Curriculum/eChildhood/upload/guide_surestart.pdf
Temple, J. A., & Reynolds, A. J. (2015). Using benefit-cost analysis to scale up early
childhood programs through Pay-for-Success financing. Journal of benefit-cost
analysis, 6(3), 628–653. doi:10.1017/bca.2015.54
Thorpe, K., Boyd, W. A., Ailwood, J., & Brownlee, J. (2011). Who wants to work in
childcare? Pre-service early childhood teachers’ consideration of work in the
childcare sector. Australasian Journal of Early Childhood, 36(1), 85-94.
Torquati, J. C., Raikes, H., & Huddleston-Casas, C. (2007). Teacher education, motivation,
compensation, workplace support, and links to quality of center-based child care
and teachers’ intention to stay in the early childhood profession. Early Childhood
Research Quarterly, 22(2), 261-275.
Trawick-Smith, J., & Dziurgot, T. (2010). Untangling teacher–child play interactions: Do
teacher education and experience influence “good-fit” responses to children's
play? Journal of Early Childhood Teacher Education, 31(2), 106-128. doi:
10.1080/10901021003781148
212
Ullrich, R., Hamm, K., & Schochet, L. (2017). 6 policies to support the early childhood
workforce. Center for American Progress.
United Way of Salt Lake (2015). Initial Results Released for First Social Impact Bond for
Early Childhood Education Show Success. Salt Lake City, UT.
U.S. Department of Health and Human Services and U.S. Department of Education.
(2016). High-quality early learning settings depend on a high-quality workforce.
Retrieved from https://www.acf.hhs.gov/ecd/high-quality-early-learning-settings-
depend-on-a-high-quality-workforce.
Vermont Association for the Education of Young Children. (n. d.). T.E.A.C.H. scholarship
options. Retrieved from http://vaeyc.org/programs-and-
services/teach/scholarship-options/.
Wells, M. B. (2015). Predicting preschool teacher retention and turnover in newly hired
Head Start teachers across the first half of the school year. Early Childhood
Research Quarterly, 30, 152-159.
Whitebook, M. (1999). Child care workers: High demand, low wages. The Annals of the
American Academy of Political and Social Science, 563, 146-161.
Whitebook, M., & McLean, C. (2017). In pursuit of pre-K parity: A proposed framework
for understanding and advancing policy and practice. Center for the Study of
Child Care Employment and National Institute on Early Education Research.
Whitebook, M., Phillips, D., & Howes, C. (2014). Worthy work, STILL unlivable wages: The
early childhood workforce 25 years after the National Child Care Staffing Study.
Berkeley, CA: Center for the Study of Child Care Employment, University of
California, Berkeley.
Whitebook, M. & Sakai, L. (2003). Turnover begets turnover: an examination of job and
occupational instability among child care center staff. Early Childhood Research
Quarterly, 18, 273-293.