Embed Size (px)
Citation preview

01
02
03
04
05
06
07
08
09
10
11
12
13
14
15
16
17
18
19
20
21
22
23
24
25
26
27
28
29
30
31
32
33
34
35
36
37
38
39
40
41
42
43
44
45
46
Elsevier AMS Job code: TEAI Ch02-N53027 25-4-2007 5:34p.m. Page:27 Trim:165×240MM TS: Integra
Font: Times Size:10/12pt Margins:Top:20MM Gutter:20MM T.Width:125mm 1 Color COP: Recto Depth: 46 lines
Advances in Airline Economics, Vol 2Darin Lee (Editor)© 2007 Elsevier B.V. All rights reserved
2Wage Determination in the US AirlineIndustry: Union Power Under ProductMarket Constraints∗
Barry T. Hirsch†
ABSTRACT
The chapter analyzes wages in the US airline industry, focusing on the role of collectivebargaining in a changing product market environment. Airline unions have considerablestrike threat power, but the exercise of bargaining power is constrained by the financialhealth of carriers. Since airline deregulation, compensation has waxed and waned in responseto the industry’s economic environment. Airline workers capture sizable rents followinggood times and provide concessions following lean times. Compensation at legacy carriershas been restructured, some from within and some from outside of bankruptcy, but it remainsto be seen whether compensation will continue its long-run movement toward opportunity
AU1
costs. Evidence from the CPS for 1995–2006 shows that wage premiums for airline industryworkers, particularly for pilots, remain with existing premiums almost entirely a unionphenomenon. Much of the gap in wage scales between major and mid-size carriers was
AU2
erased in the mid-2000s concessionary cycle, but these rates remain much higher than rates
∗ Prepared for the volume, Advances in Airline Economics, Volume II: The Economics of Airline Institutions,Operations and Marketing (editor, Darin Lee, 2007, forthcoming). Helpful comments were received fromGary Fournier, Jim Gillula, Darin Lee, Nick Rupp, and seminar participants at the University of Kentucky andthe Southern Economic Association meetings. I thank Dan Kasper and Darin Lee for providing Form 41 laborcost data. Figures cited in Section 5 reflect work done with Michael Wachter and James Gillula, presentedin United Airlines’ 1113(c) bankruptcy hearing. The views expressed in this chapter are mine and need notreflect the opinion of others.† E.M. Stevens Distinguished Professor of Economics, Trinity University, San Antonio, TX 78212. Voice(210)999-8112; e-mail [email protected]; homepage www.trinity.edu/bhirsch.

01
02
03
04
05
06
07
08
09
10
11
12
13
14
15
16
17
18
19
20
21
22
23
24
25
26
27
28
29
30
31
32
33
34
35
36
37
38
39
40
41
42
43
44
45
46
Elsevier AMS Job code: TEAI Ch02-N53027 25-4-2007 5:34p.m. Page:28 Trim:165×240MM TS: Integra
Font: Times Size:10/12pt Margins:Top:20MM Gutter:20MM T.Width:125mm 1 Color COP: Recto Depth: 46 lines
28 BARRY T. HIRSCH
at regional carriers. Compensation levels at regional carriers may approximate opportunitycost – the compensation that would be necessary to attract and retain qualified employeesthroughout much of the industry. Because unions retain bargaining power at the majorcarriers, wages are likely to head upward as carriers’ financial health returns. Such wagelevels may or may not be sustainable in the inevitable next downturn.
1 INTRODUCTION
The air transportation industry has realized rapid growth throughout its history. Despitethis growth, carrier profitability since deregulation has proven volatile and corporateviability far from certain. With one exception, every major carrier at the time of deregu-lation in 1978 has either failed, had its operations merged into another airline, or been inbankruptcy protection. The exception, American Airlines, narrowly avoided bankruptcyin 2003 following wage concessions from its unions.
As is the case for most companies, labor compensation among airlines accounts fora substantial share of total costs.1 In much of the industry, compensation is determinedthrough collective bargaining; thus, workers’ pay may deviate substantially from oppor-tunity costs. While union density economy-wide has sharply declined, the airline industryhas remained highly unionized. The percentage of workers who are union members inthe air transportation industry was 49.2% over the 1973–1978 regulatory period and49.4% in 2005. Union coverage rates for flight personnel and ground workers are higher.In contrast, private sector union density economy-wide fell from 24.2% in 1973 to 7.8%in 2005.2 No private sector industry has union density as high as does air transportation.3
More than any other private industry, airlines face unions who possess substantialbargaining power, that power emanating from the ability of a strike to shut down andbankrupt a carrier. Of course, it is not in the interests of workers and their unions todestroy their employers, so union demands are constrained by the financial health ofcarriers. Hence, the airline industry has developed a compensation pattern in which itsunion workers “tax” potential profits following the onset of good times, but agree tomoderate contractual pay increases or provide wage and benefit concessions followingthe onset of bad times. For many if not most airlines and their unions, this product market
1 During much of the 1980s and 1990s, labor costs accounted for about a third of total expenses. This sharepeaked at 38% in 2002, a level not seen since 1979 and in the earlier regulatory period. The labor costpercentage fell substantially after 2002, to 36% in 2003, 30% in 2004, and 26% in 2005 (24% in 2005:4). Fuelcosts, which accounted for 12% of total expenses in 2002, rose to 23% of expenses in 2005 (Air TransportAssociation, 2006, Labor and Fuel tabs).2 Union density figures are compiled from the Current Population Survey (CPS). The 1973–1978 air trans-portation figure is in Hirsch and Macpherson (2000, p. 136), while the 2005 figures for air transportation andthe private sector are from Hirsch and Macpherson (2003, updated annually at www.unionstats.com). Prior to2003, the air transportation industry included air courier services (e.g., largely nonunion FedEx), which weresmall during 1973–1978. Were these included in the 2005 figure, union density would be about 10 percentagepoints lower.3 Two industries have higher union density, the predominantly public railroad transportation industry and theentirely public US Postal Service (www.unionstats.com).

01
02
03
04
05
06
07
08
09
10
11
12
13
14
15
16
17
18
19
20
21
22
23
24
25
26
27
28
29
30
31
32
33
34
35
36
37
38
39
40
41
42
43
44
45
46
Elsevier AMS Job code: TEAI Ch02-N53027 25-4-2007 5:34p.m. Page:29 Trim:165×240MM TS: Integra
Font: Times Size:10/12pt Margins:Top:20MM Gutter:20MM T.Width:125mm 1 Color COP: Recto Depth: 46 lines
WAGE DETERMINATION IN THE US AIRLINE INDUSTRY 29
union wage cycle has been accompanied by a contentious labor relations environmentwith no small amount of distrust on all sides.4�5
Following the strong financial health of the industry in the late 1990s, generous laborcontracts and high labor costs took force in the early 2000s. The increased compensationwas accompanied by a “perfect storm” of negative events – a recession in 2001, sharpdeclines in traffic following the 11 September, 2001 attacks, Internet pricing, increasingmarket shares among “low-cost carriers” and concomitant declines among hub-basedlegacy carriers, and, more recently, high fuel costs over a sustained period (whichbegan to moderate in the latter half of 2006). The convergence of high operating costsand intense price competition resulted in bankruptcies among four legacy carriers (USAirways, United, Delta, and Northwest) and several mid-size and regional carriers.During 2004–2006, wages and benefits among the legacy carriers have been falling,either under the threat of or following bankruptcy.6
The recent restructuring of labor costs in an increasingly competitive airline industryhas been substantial. Lower labor costs, a decrease in debt burden among carriersemerging from bankruptcy, relatively strong demand, and reduced capacity among thelegacy carriers have improved major carriers’ financial prospects. At the same time, highfuel costs and, more fundamentally, the emergence of more competitive product marketsand a high level of price competition, have served to keep profits at low levels, at leastthrough mid-year 2006. But the future will not be an extension of the present. Duringthe two decades following airline deregulation, periods of union wage concessions havebeen followed by rebounding wages as airlines’ profits recovered. Continuation of thispattern requires not only the presence of strong unions that can appropriate companyprofits, but also product market innovations and a degree of pricing power that generateprofits to be taxed.7
The purpose of this chapter is to examine the role of unions and describe recent wagedetermination in the airline industry. A key question posed in this study is whether or
4 There is a large industrial organization literature on the airline industry, but little on the airline labor market.References to past studies are provided in Hirsch and Macpherson (2000); see, for example, Card (1998),Crémieux (1996), and Johnson (1995). Nay (1991) provides an early statement on union wage cycles in theairline industry.5 Airlines differ from other US private sector industries in that collective bargaining is governed not by theNational Labor Relations Act (NLRA), but by the Railway Labor Act (RLA) of 1926, amended in 1936 toapply to the airline as well as railroad industry. As compared to the NLRA, the RLA provides more specificityas to the negotiation and mediation procedures that parties must adopt in a labor dispute prior to a strike.The bargaining structure that evolved under the RLA was decentralized, with separate unions by craft andcarrier-specific contracts.6 Companies in bankruptcy cannot unilaterally void their union contracts and implement lower pay but,under U.S.C. § 1113(c), can request that a bankruptcy judge do so. The company must show that wage andbenefit cuts are necessary for the company to successfully emerge from bankruptcy and that the cuts areequitable. The equity provision can be examined through a comparison of contract rates with estimates ofmarket compensation and by showing how pay cuts are distributed across employee groups. In most cases,the employer and union agree on new wage and benefit terms, often with prodding from the judge, prior to adecision being made on voiding a contract.7 Although not addressed in this chapter, union wage demands may be constrained by a company’s level ofdebt, given that increasing leverage reduces liquidity. Knowing this, union companies’ optimal debt levels willbe higher than for nonunion companies. For theory, supporting evidence, and references to prior literature, seeMatsa (2006).

01
02
03
04
05
06
07
08
09
10
11
12
13
14
15
16
17
18
19
20
21
22
23
24
25
26
27
28
29
30
31
32
33
34
35
36
37
38
39
40
41
42
43
44
45
46
Elsevier AMS Job code: TEAI Ch02-N53027 25-4-2007 5:34p.m. Page:30 Trim:165×240MM TS: Integra
Font: Times Size:10/12pt Margins:Top:20MM Gutter:20MM T.Width:125mm 1 Color COP: Recto Depth: 46 lines
30 BARRY T. HIRSCH
not the current decrease in wages and benefits in the industry represents a permanentshift in the level of compensation, or whether there will be a resumption of the historicalcycle of rising union wage premiums following the onset of good times and subsequentwage concessions following lean times. In order to address this question, it is critical toestimate the level of opportunity cost wages in the airline industry. Subject to a numberof caveats, well know in the labor economics literature, compensation in competitivemarkets will tend toward opportunity wages – what similar workers in similar jobsmight have obtained in alternative employment.8 Compensation cannot be expected tofall below a competitive level, at least not for any sustained period. Thus, a reasonedjudgment as to the pattern of future wages in the airline industry requires that we knowhow airline wages diverge from opportunity wages. To estimate this divergence, it isnecessary not only to compare the wages of unionized airline employees at legacycarriers to wages elsewhere in the airline industry, but also to the opportunity wagesoutside the industry.
The plan of the chapter is as follows. Section 2 provides a brief discussion of how thelevel and dispersion in airline labor costs have changed over time. Section 3 providesanalysis on overall airline industry wage differentials using the Current PopulationSurvey (CPS) for 1995 through 2006, focusing on the unionized sector of the airtransportation industry. Section 4 follows with a more detailed focus on union andnonunion CPS wage differentials by airline industry “craft” (pilots, flight attendants,mechanics, fleet service, agents, and other). In Section 5, carrier contract data arepresented that permit a comparison of pay by craft at major carriers with pay for thosesame occupations at regional airlines. A final section of the chapter addresses, but doesnot fully answer, the two questions stated above. First, given the evidence, what is thelevel of opportunity cost wages? Second, will the future be one in which earnings movetoward opportunity costs or will we continue to observe cycles in which union wagesrise well above and subsequently fall toward opportunity costs, depending largely onairlines’ ability to pay?
2 AIRLINE LABOR COSTS OVER TIME
Labor cost is only one of many determinants of an airline’s financial health, but it isan important one. In each of the three years from 2001–2003, the four airlines withthe highest compensation per employee (Form 41 salaries and benefits, as presented
8 A wage premium is defined here as payments to labor beyond long-run opportunity costs; that is, whatworkers could have earned in an alternative job path entailing similar investments in training and similarworking conditions. Employees’ current pay is often greater than the pay they could get at an alternative job.These short-run premiums (quasi-rents) derive from costs associated with job mobility, firm- and industry-specific skills, and implicit contracts in which earnings deviate from spot marginal products. Efficiency wagetheory proposes that in some settings, wages in excess of opportunity cost may lower per unit costs and arethus consistent with profit maximization. The reasoning is that in workplaces with high monitoring costs,voluntary effort may increase in response to high wages, either to reduce the risk of firing or as a result ofpositive reciprocity (these explanations seem to apply less readily to union than nonunion workplaces). Fordiscussion, see Cahuc and Zylberberg (2004, pp. 353–360).
01
02
03
04
05
06
07
08
09
10
11
12
13
14
15
16
17
18
19
20
21
22
23
24
25
26
27
28
29
30
31
32
33
34
35
36
37
38
39
40
41
42
43
44
45
46
Elsevier AMS Job code: TEAI Ch02-N53027 25-4-2007 5:34p.m. Page:31 Trim:165×240MM TS: Integra
Font: Times Size:10/12pt Margins:Top:20MM Gutter:20MM T.Width:125mm 1 Color COP: Recto Depth: 46 lines
WAGE DETERMINATION IN THE US AIRLINE INDUSTRY 31
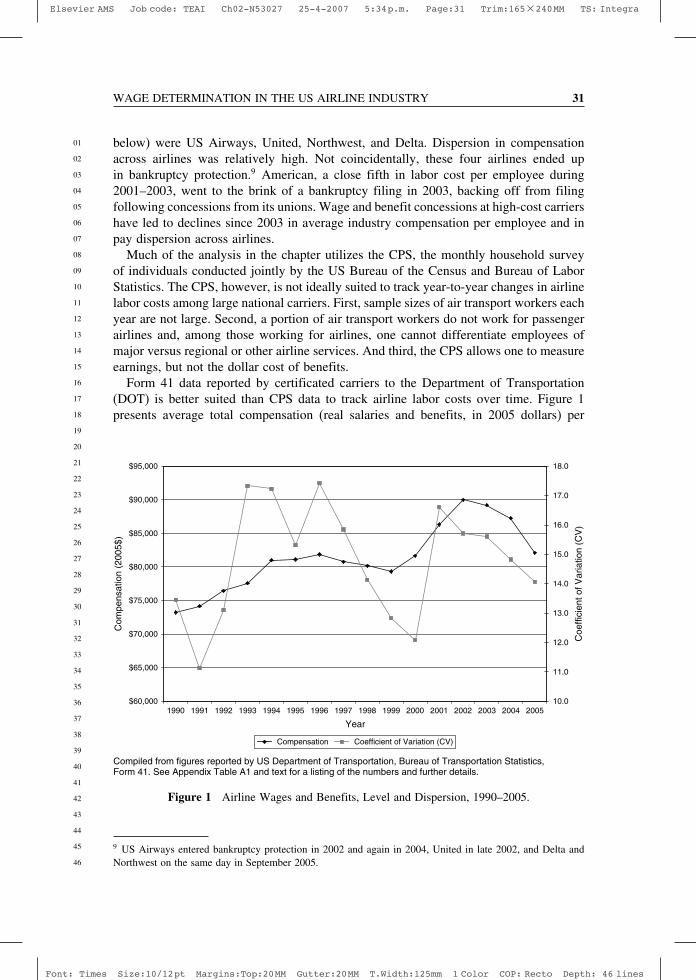
below) were US Airways, United, Northwest, and Delta. Dispersion in compensationacross airlines was relatively high. Not coincidentally, these four airlines ended upin bankruptcy protection.9 American, a close fifth in labor cost per employee during2001–2003, went to the brink of a bankruptcy filing in 2003, backing off from filingfollowing concessions from its unions. Wage and benefit concessions at high-cost carriershave led to declines since 2003 in average industry compensation per employee and inpay dispersion across airlines.
Much of the analysis in the chapter utilizes the CPS, the monthly household surveyof individuals conducted jointly by the US Bureau of the Census and Bureau of LaborStatistics. The CPS, however, is not ideally suited to track year-to-year changes in airlinelabor costs among large national carriers. First, sample sizes of air transport workers eachyear are not large. Second, a portion of air transport workers do not work for passengerairlines and, among those working for airlines, one cannot differentiate employees ofmajor versus regional or other airline services. And third, the CPS allows one to measureearnings, but not the dollar cost of benefits.
Form 41 data reported by certificated carriers to the Department of Transportation(DOT) is better suited than CPS data to track airline labor costs over time. Figure 1presents average total compensation (real salaries and benefits, in 2005 dollars) per
$60,000
$65,000
$70,000
$75,000
$80,000
$85,000
$90,000
$95,000
1990 1991 1992 1993 1994 1995 1996 1997 1998 1999 2000 2001 2002 2003 2004 2005
Year
Compiled from figures reported by US Department of Transportation, Bureau of Transportation Statistics,Form 41. See Appendix Table A1 and text for a listing of the numbers and further details.
Com
pens
atio
n (2
005$
)
10.0
11.0
12.0
13.0
14.0
15.0
16.0
17.0
18.0
Coe
ffici
ent o
f Var
iatio
n (C
V)
Compensation Coefficient of Variation (CV)
Figure 1 Airline Wages and Benefits, Level and Dispersion, 1990–2005.
9 US Airways entered bankruptcy protection in 2002 and again in 2004, United in late 2002, and Delta andNorthwest on the same day in September 2005.

01
02
03
04
05
06
07
08
09
10
11
12
13
14
15
16
17
18
19
20
21
22
23
24
25
26
27
28
29
30
31
32
33
34
35
36
37
38
39
40
41
42
43
44
45
46
Elsevier AMS Job code: TEAI Ch02-N53027 25-4-2007 5:34p.m. Page:32 Trim:165×240MM TS: Integra
Font: Times Size:10/12pt Margins:Top:20MM Gutter:20MM T.Width:125mm 1 Color COP: Recto Depth: 46 lines
32 BARRY T. HIRSCH
airline employee during 1990–2005, and the dispersion across airlines in average com-pensation (Appendix Table A1).10 The data include all major and most national carriers.11AU3
The number of carriers differs by year, as smaller airlines move in and out of the industryor mergers occur; there was a maximum of 19 in 2000 (with 12 in 1990 and 13 in2005).12 Calculations are based on weighted averages, with airline employment by yearas weights. Compensation and, subsequently, costs per available seat mile (ASM) areexpressed in 2005 dollars using the CPI-U (current series).
As is evident in Figure 1, average real compensation among carriers (shown bythe “diamonds”) increased briskly through 1994, stayed relatively flat (or fell slightly)throughout the rest of the 1990s, and then increased after 1999. One sees large increasesin average real compensation in 2000, 2001, and 2002, followed by small, moderate, andlarge decreases in 2003, 2004, and 2005, respectively. The real level of compensationin 2005 is similar to that seen in the mid-1990s.
Also shown in Figure 1 (see the “squares”) is the dispersion in compensation acrosscarriers, measured by the employment weighted coefficient of variation. High pay disper-sion generally produces cost differences that cannot be sustained. Dispersion decreaseswhen low-pay airlines play catch-up and/or when high-pay airlines fall back toward thepack. Pay dispersion had declined during the late 1990s, but increased following payhikes taking effect in 2001–2003. Wage and benefit concessions since 2004 among thehigh-cost carriers have reduced pay dispersion.
Figure 2 provides an alternative measure of labor costs constructed from Form 41 data,measuring cents per ASM, in 2005 dollars, for 1990–2005. Obviously, labor costs perseat mile are affected not only by costs per worker, but also by employment, productivity,airline capacity, and the like. The pattern evident in Figure 2 (see the “diamonds”) is oneof a gradual but steady decline in real labor costs per ASM from 1990 through 1997,modest increases in costs until 2000, an upward break with sharply increased costs in2001 and 2002, followed by substantial decreases after 2002, from 4.7 cents per ASM in2002 to 3.3 cents in 2005. The recent decline in costs per seat mile came about not onlythrough decreases in compensation per worker, but by steep declines in employment atthe legacy carriers.
Figure 2 also shows the dispersion across carriers in labor costs per ASM. Thecoefficient of variation (the “squares”) stayed constant at about 20 through the 1990s, butdeclined sharply in 2003–2005 to about 15. Undue weight should not be placed on thissingle statistic, but by this measure the cost structure across airlines was more similar
10 The values shown in Figures 1 and 2 are provided in Appendix, Table 1. Daniel Kasper and DarinLee of LECG kindly made available Form 41 information on compensation and labor costs per ASMby airline. Employment data for certificated carriers, used to construct weights, were obtained from theBureau of Transportation Statistics at http://www.bts.gov/programs/airline_information/number_of_employ-ees/certificated_carriers/index.html.11 The DOT defines a national airline as having at least $100 million in annual revenue and a major airline$1 billion.12 In 2000, included airlines accounted for 91 % of total employment among all DOT 41 “major” and “national”certificated carriers (excluding Airborne Express, FedEx, and UPS). In 1990 and 2005, the correspondingnumbers were 87% and 81%, respectively. The “low” figure in 2005 reflects sharp declines in employmentat the included large legacy carriers included in Figure 1, coupled with growth in employment among smallairlines not included.

01
02
03
04
05
06
07
08
09
10
11
12
13
14
15
16
17
18
19
20
21
22
23
24
25
26
27
28
29
30
31
32
33
34
35
36
37
38
39
40
41
42
43
44
45
46
Elsevier AMS Job code: TEAI Ch02-N53027 25-4-2007 5:34p.m. Page:33 Trim:165×240MM TS: Integra
Font: Times Size:10/12pt Margins:Top:20MM Gutter:20MM T.Width:125mm 1 Color COP: Recto Depth: 46 lines
WAGE DETERMINATION IN THE US AIRLINE INDUSTRY 33
3.00
3.25
3.50
3.75
4.00
4.25
4.50
4.75
5.00
1990 1991 1992 1993 1994 1995 1996 1997 1998 1999 2000 2001 2002 2003 2004 2005
Year
Labo
r C
ost p
er A
SM
(20
05$)
10
12
14
16
18
20
22
24
26
Coe
ffici
ent o
f Var
iatio
n (C
V)
Labor Costs per ASM Coefficient of Variation (CV)
Compiled from figures reported by US Department of Transportation, Bureau of Transportation Statistics,Form 41. See Appendix Table A1 and text for a listing of the numbers and further details.
Figure 2 Labor Costs and CV Per Available Seat Mile, 1990–2005.
in 2005 than at any time since at least 1990. All else the same, similar cost structuresacross airlines should be associated with more stable prices and financial outcomes.
3 WAGE DIFFERENTIALS IN THE AIR TRANSPORTATIONINDUSTRY: MEASUREMENT AND DATA
Are unionized airline workers paid wages above (long run) opportunity cost? If so,how large are these premiums? Do wage premiums vary across airline crafts? Anddo nonunion as well as union airline workers receive premiums? These seeminglystraightforward questions are not easy to answer, at least not in a precise manner.The difficulty arises from a combination of methodological issues (e.g., what are theappropriate comparison groups for airline workers) and data limitations (e.g., companylevel data do not provide measures of worker attributes, while public data on individualsand their attributes do not permit one to easily examine differentials within the industry –say across major versus regional carriers or among those at passenger airlines versusair freight companies). Of course, limitations arise to some greater or lesser degree inall research endeavors. For the research questions posed in this chapter, a variety ofevidence allows one to paint a reasonably clear picture of wage determination in theairline industry.
This section follows and extends the approach utilized by Hirsch and Macpherson(2000) in their study of wage determination in the airline industry from 1973 through

01
02
03
04
05
06
07
08
09
10
11
12
13
14
15
16
17
18
19
20
21
22
23
24
25
26
27
28
29
30
31
32
33
34
35
36
37
38
39
40
41
42
43
44
45
46
Elsevier AMS Job code: TEAI Ch02-N53027 25-4-2007 5:34p.m. Page:34 Trim:165×240MM TS: Integra
Font: Times Size:10/12pt Margins:Top:20MM Gutter:20MM T.Width:125mm 1 Color COP: Recto Depth: 46 lines
34 BARRY T. HIRSCH
1997. The CPS analysis uses individual wage and salary worker data for September 1995through May 2006.13 Following Hirsch and Macpherson, six air transportation groups ofworkers are identified using the CPS – five airline crafts plus a residual category. Thefive craft groups are pilots, flight attendants, mechanics, fleet service (ramp and utility)workers, reservation agents and clerks, and an “other” category. For the five airlinecraft groups, comparison groups of individuals comprising nonairline workers employedin specific sets of occupations are identified. Workers in those occupations serve ascomparison (control) groups in order to measure relative wages. For the “Other” categoryof airline workers, a comparison group of nonairline workers across the economy is used.Relative wage differentials between the air transport and comparison group workers areestimated within a regression framework, controlling for measurable worker, location,and job characteristics. Section 4 and Appendix Table A2 describe the construction ofthe CPS comparison groups for each of the six air transport groups.
The empirical approach is as follows. Separate wage equations by craft are estimated,with each regression sample from the 1995–2006 CPS including both an airline “treat-ment” group (pilots, etc.) and a large comparison group of workers. From each wageequation, whose coefficients are determined largely by the nonairline comparison group,I calculate log wage differentials for union and nonunion air industry workers, rela-tive to measurably similar comparison group workers outside the air transport industry.Industry-wide wage differentials based on the full sample of air transport workers arecalculated based on the weighted average across the six groups, using fixed air transportemployment weights over the time period. In addition to controlling for a typical setof worker human capital, demographic, and location characteristics reported in the CPS(e.g., schooling, age, region), an occupational skill level and working condition variable,constructed by the BLS, is matched to the CPS. The principal purpose of this additionalcontrol variable is to account for occupational skill differences not captured by workerschooling and experience measures.
Specifically, let
ln Yigt = ��kgtXikgt +��gUAirigt +��gNAirigt +��cOcccit +� ln Skilli +it� (1)
where ln Y is the natural logarithm of the wage, i designates individual, g indexes sixairline craft groups and their corresponding control groups, and t is year. Included in Xare k worker and labor market control variables (listed below) with k the correspondingcoefficients. A “level of work” variable, “Skill”, defined at the detailed occupation levelis shown separately since results are presented with and without its inclusion. “Air” is adummy variable set to 1 for each of the g air industry craft groups. “Air” is interactedwith index variables designating whether a worker is covered (U ) or not covered (N )by a collective bargaining agreement. Occ is a set of c broad occupation dummies usedonly in the regression for “Other” air industry workers – the nonspecified craft group
13 September 1995 is the first month following 1994 CPS revisions in which imputed earners, excluded fromthe analysis (see below) can be identified. May 2006 was the latest CPS file released when this paper’sempirical analysis was executed. This 10-plus year period includes both low and high points in airlinewage-profit cycles.

01
02
03
04
05
06
07
08
09
10
11
12
13
14
15
16
17
18
19
20
21
22
23
24
25
26
27
28
29
30
31
32
33
34
35
36
37
38
39
40
41
42
43
44
45
46
Elsevier AMS Job code: TEAI Ch02-N53027 25-4-2007 5:34p.m. Page:35 Trim:165×240MM TS: Integra
Font: Times Size:10/12pt Margins:Top:20MM Gutter:20MM T.Width:125mm 1 Color COP: Recto Depth: 46 lines
WAGE DETERMINATION IN THE US AIRLINE INDUSTRY 35
and an economy-wide control group. Year dummies for 1997 through 2006 are includedin X, with 1995–96 the omitted base period.
Coefficients �g and �g provide estimates of log wage differentials by airline craftgroup g for union and nonunion workers, respectively, in both cases as compared tothe appropriate comparison group made up as a mix of union and nonunion workers.14
Weighted averages of these coefficients thus provide estimates of the airline wagedifferentials d of interest. That is
du = �wug�g (2)
dn = �wng�g (3)
Estimates of the air transport log wage differentials are shown for union air transportworkers (du), nonunion air transport workers (dn), and union and nonunion combined.The differentials are estimated with and without control for ln Skill. The weights wg forunion and nonunion workers represent the CPS employment shares of the six air industryworker groups fixed over the 1995–2006 period.15 CPS wage differentials were alsoestimated by year, but are not presented. Little systematic pattern is found, presumablydue to large year-to-year variation in the air transport industry samples reporting earnings.
The air transport and comparison group samples include full-time nonstudent wageand salary workers ages 18 and over. To enhance the relevance of the comparison group,excluded are workers with less than a high school degree (with the GED categorizedas high school) and education beyond a masters degree. No education restrictions areplaced on the air transport sample. In the regression analysis, the relatively few airlineworkers with less than a high school degree are assigned to the high school category andthose few with a degree beyond the masters level are assigned to the masters category.
With the exception of flight personnel (pilots and flight attendants), full-time status isdefined as reporting 35 or more usual hours per week on the principal job. The reportingof hours worked by flight personnel presents a problem, however, since some reportonly paid flight hours, while others report all hours away from home. Flight personnelwho report 15 or more hours worked per week are retained as full-time workers. Usualweekly earnings reported by pilots and flight attendants is only weakly related to theirreported weekly hours worked, ruling out the calculation of an hourly wage based onweekly earnings divided by weekly hours (construction of the wage is described below).
Approximately 25–30% of workers in the CPS are either unwilling or unable to reporttheir earnings. These individuals have weekly earnings “allocated” by the Census basedon an imputation procedure in which nonrespondents are assigned the earnings of a“donor” with an identical set of match characteristics (Hirsch and Schumacher, 2004).
14 That is, union status is not included as a control in X. The assumption here is that the opportunity costwage for each group is best approximated by an implicitly weighted average of union and nonunion wages.15 The weights are calculated prior to omission of imputed earners and using CPS employment weights. Useof fixed weights over time means that changes in the wage gap estimates result from wage changes and notfrom worker mix changes. Since imputation rates can differ across airline craft groups, weights are determinedprior to the exclusion of earnings nonrespondents.

01
02
03
04
05
06
07
08
09
10
11
12
13
14
15
16
17
18
19
20
21
22
23
24
25
26
27
28
29
30
31
32
33
34
35
36
37
38
39
40
41
42
43
44
45
46
Elsevier AMS Job code: TEAI Ch02-N53027 25-4-2007 5:34p.m. Page:36 Trim:165×240MM TS: Integra
Font: Times Size:10/12pt Margins:Top:20MM Gutter:20MM T.Width:125mm 1 Color COP: Recto Depth: 46 lines
36 BARRY T. HIRSCH
All those with imputed earnings are excluded from the analysis. It is important that theybe excluded in order to avoid severe attenuation toward zero in wage gap estimates withrespect to the airline industry and union status. Neither industry nor union status is amatch criterion used to assign a donor’s earnings to a nonrespondent. Hence, air transportindustry nonresponents will typically be assigned the earnings of nonairline donors.Union nonrespondents will typically be assigned the earnings of nonunion donors. Broadrather than detailed occupation is an imputation match criterion, thus nonrespondingpilots (aircraft mechanics, etc.) will typically not be assigned the donor’s earnings ofother pilots (aircraft mechanics, etc.). When the exclusion of imputed earners (or use ofa bias correction method) is absent, wage differentials with respect to industry, unionstatus, and other nonmatch criteria will be seriously attenuated. Hirsch and Schumacher(2004) show that “match bias” (i.e., the attenuation in coefficient estimates) roughlyequals the proportion of nonrespondents.16 Imputed earners cannot be identified in theCPS between January 1994 and August 1995. Hence the analysis in this chapter beginswith September 1995.
Public use files of the CPS include an edited usual weekly earnings measure that is top-coded (i.e., capped). For years prior to 1998 (and after 1989), weekly earnings are cappedat $1,923 ($100,000 annually) and for years since 1998 at $2,885 ($150,000 annually).Apart from pilots and a few managerial or professional workers, few air transportindustry workers have top-coded earnings. For nonpilot air transportation workers andall comparison group workers with weekly earnings at the cap, they are assigned theestimated mean earnings above the cap based on year and gender-specific estimates thatassume a Pareto distribution for earnings beyond the median (see Hirsch and Macpherson,2006, p. 6; posted at www.unionstats.com). Values are moderately higher than 1.5 timesthe cap, with somewhat smaller female than male means and growth over time.
Top-coded earnings among pilots is widespread, more so than for any other occupationin the CPS, but the right tail of their earnings distribution is probably less skewedthan implied by the Pareto distribution (i.e., fewer extremely high earnings). DuringSeptember 1995–August 1996, the first 12 months used in our sample, 20.0% of pilotswho reported earnings were above the $1,923 weekly earnings cap, as compared to 9.6%in 2000 and 14.3% in 2005 with the higher $2,885 cap that began in 1998 (Hirschand Macpherson, 2006).17 Because many senior pilot contracts are for amounts not farabove the cap, I assign pilot means above the cap that are much lower than the Paretomeans. For the years prior to 1998, pilots with weekly earnings greater than $1,923have their earnings set at 1.25 times the cap, or $2,404. For years beginning in 1998,pilots with weekly earnings greater than $2,885 have their earnings set at 1.25 timesthe cap, or $3,606. These estimates seem likely to be conservative (i.e., produce toolow a pilot/nonpilot wage differential). Moreover, use of the same multiple for all years
16 Match categories include education, age, gender, race, hours worked, broad occupation, and receipt of tips,commission, or overtime. Bias due to imperfect matching (e.g., a PhD matched to an earnings donor from theBA or above category) is analyzed in Bollinger and Hirsch (2006).17 The pilot sample in 2005 has an unrepresentative number of high earners as compared to earlier years and2006.

01
02
03
04
05
06
07
08
09
10
11
12
13
14
15
16
17
18
19
20
21
22
23
24
25
26
27
28
29
30
31
32
33
34
35
36
37
38
39
40
41
42
43
44
45
46
Elsevier AMS Job code: TEAI Ch02-N53027 25-4-2007 5:34p.m. Page:37 Trim:165×240MM TS: Integra
Font: Times Size:10/12pt Margins:Top:20MM Gutter:20MM T.Width:125mm 1 Color COP: Recto Depth: 46 lines
WAGE DETERMINATION IN THE US AIRLINE INDUSTRY 37
fails to capture some of the highest pilot contract increases and subsequent concessionsrealized over this period.18 AU4
For air transport workers apart from pilots and flight attendants, plus all comparisongroup workers, the wage is defined as follows. Hourly earnings are calculated as equalto usual weekly earnings (which includes typical overtime, tips, and commissions)divided by usual hours worked per week.19 For pilots and flight attendants, reportedhours worked per week are ignored, since variability across workers contains littleinformation.20 For pilots, the wage is calculated as weekly earnings divided by 40, whilefor flight attendants’ weekly earnings are divided by 36. This approach is explainedbelow. Finally, the earnings measure for all workers is converted to 2005 dollars usingthe CPI-U (Current Series).
One cannot avoid making some rather arbitrary assumption as to how job-relatedhours among flight personnel compare to work hours among other workers. The earningsmeasure that is used implicitly assumes that job-related time spent by pilots (flight hours,wait time, and travel time) entails similar disutility on average as does 40 h of paid workplus nonpaid travel time for nonflight air transport and comparison group workers. Forflight attendants, the assumption is that a typical week is equivalent to 36 h of work incomparison group jobs. Pilots’ mean reported hours worked in the CPS is 40.9 overall(and 39.7 for union pilots). Flight attendants’ mean reported hours worked in the CPSis 32.5 overall (and 32.0 for those unionized). If the hours assumptions of 40 and 36 forpilots and flight attendants, respectively, overstate (understate) the disutility associatedwith hours worked by flight personnel, then the wage differential estimates for thesegroups are too low (high).
Included in X – the control variables – are education dummies (5) reflecting levelsfrom a minimum of a high school degree (including a GED) through a masters degree,potential experience in quartic form separately and interacted with gender (experiencebeing proxied by the minimum of age minus years schooling minus 6 or years since age16), gender, race/ethnicity (4), foreign born, region (8), metropolitan area size (6, withnonmetro the base), year dummies (10), and broad occupation dummies (11, includedonly for the “Other” group regression).
In addition to the control variables in X, earnings differentials are estimated with anincluded occupation or job duties variable, ln Skill, compiled by the BLS for the approx-imately 500 Census occupation groups. As described in Pierce (1999), the unit of anal-ysis for the National Compensation Survey is the detailed occupation cross-classified bywork level. The NCS uses the Census occupation codes (COC) included in the CPS. Foreach Census occupation, 10 job attribute factors are defined, each with various levels.
18 Regression estimates of pilot earnings premiums are about 0.10 log points higher when Pareto means ratherthan the more conservative 1.25 multiples are used.19 A small number of individuals do not report usual hours worked per week and instead have their hoursworked value imputed (i.e., assigned) by the Census. These individuals are excluded from the estimationsample. For nonflight personnel and all comparison group workers, individuals who report “variable” weeklyhours have the wage determined by usual weekly earnings divided by hours worked last week, which addsnoise to the independent variable but is unlikely to bias coefficients.20 Commercial airlines hire few part-time pilots or flight attendants. Recall that those reporting less than 15 hworked per week are excluded from the sample.
01
02
03
04
05
06
07
08
09
10
11
12
13
14
15
16
17
18
19
20
21
22
23
24
25
26
27
28
29
30
31
32
33
34
35
36
37
38
39
40
41
42
43
44
45
46
Elsevier AMS Job code: TEAI Ch02-N53027 25-4-2007 5:34p.m. Page:38 Trim:165×240MM TS: Integra
Font: Times Size:10/12pt Margins:Top:20MM Gutter:20MM T.Width:125mm 1 Color COP: Recto Depth: 46 lines
38 BARRY T. HIRSCH
These are as follows: knowledge (9 levels), supervisory controls (5), guidelines (5), com-plexity (6), scope and effect (6), personal contacts (4), purpose of contacts (4), physicaldemands (3), work environment (3), and supervisory duties (5). Each of these job attributefactors and levels were awarded “quality points” by BLS analysts in order to developa single occupational job attribute index. This occupational job factor index is highlycorrelated with earnings (Pierce, 1999). Allegretto et al. (2004) have previously mergedthis BLS index with the CPS and used it in their study of public school teacher salaries.
The job factor index, referred to here as “Skill” (but which measures a broad range ofattributes, as indicated above), was obtained from the BLS for 1990 COC, used in the CPSthrough 2002. Beginning in 2003, the CPS adopted 2000 COC, many of which cannotbe mapped one-to-one with the 1990 COC. Codes used for the five airline crafts couldbe mapped cleanly. For the remaining air transport industry workers and all comparisongroup workers beginning in 2003, each worker was assigned a 1990 COC based eitheron a direct match to their current COC or from a probabilistic mapping between 1990and 2000 COC provided by the Census. “Skill” was then matched to each worker’sassigned 1990 COC. Included in the earnings equations is ln(Skill). Its coefficient �represents an elasticity; e.g., � = 0�25 implies that earnings increase 2.5% for each 10%increase in the skill index. The BLS skill index does not cover Census occupations thatare exclusively federal (e.g., Postal Service workers), private household, and agriculture,forestry, and fishing occupations. The exclusion of these occupations from the analysisreduced sample sizes very little. Earnings equation results (not including “Skill”) withand without these occupations are nearly identical.
4 EARNINGS IN AIR TRANSPORTATION AND AMONGCOMPARISON GROUPS: DESCRIPTIVE EVIDENCE
This brief section provides descriptive evidence from the CPS on earnings differentialsbetween union and nonunion air transportation workers and “comparable” workers out-side the airline industry. A subsequent section examines the earnings premium estimatesderived from the regression analysis.
Table 1 provides the CPS sample sizes, employment weights, mean earnings (in2005$), and BLS “Skill” index values for the air transportation industry, for each airlinecraft group (separately by union status), and for the corresponding comparison groups.As noted previously, the earnings sample for September 1995 through May 2006 includesonly those who respond to the earnings question and not those whose earnings have beenimputed (assigned) by the Census. The CPS sample size of air transportation industryworkers over the period 1995–2006 is 6,835, with roughly equal numbers of pilots,flight attendants, and mechanics (about 900 each). The sample size of agents (reservationagents, gate agents, and stores employees) is moderately larger (about 1,200), whilethe sample size of the fleet service workers (i.e., baggage handlers, cleaners, and otherground workers) is substantially smaller. The residual group of “Other” air transportworkers is quite large, about 2,600. Estimates of industry wage differentials are based onthe weighted average of estimates across the six employee groups (jointly and separatelyby union status). The group weights (shown in rows labeled “Weights”) are calculated

01
02
03
04
05
06
07
08
09
10
11
12
13
14
15
16
17
18
19
20
21
22
23
24
25
26
27
28
29
30
31
32
33
34
35
36
37
38
39
40
41
42
43
44
45
46
Elsevier AMS Job code: TEAI Ch02-N53027 25-4-2007 5:34p.m. Page:39 Trim:165×240MM TS: Integra
Font: Times Size:10/12pt Margins:Top:20MM Gutter:20MM T.Width:125mm 1 Color COP: Recto Depth: 46 lines
WAGE DETERMINATION IN THE US AIRLINE INDUSTRY 39
Table 1 CPS Mean Wages (2005$) and Skill Index, by Airline Craft and Comparison Groups
Union andNonunion
Union Nonunion ComparisonGroups
All air transportWage $22.88 $27.03 $19.68 $19.29Skill index 1,274 1,241 1,299 1,282N 6,835 2,971 3,864 877,302
PilotsWage $43.09 $49.38 $30.86 $27.30Skill index 2,225 2,225 2,225 1,864N 879 580 299 76,702Weight 0.125 0.197 0.072
Flight attendantsWage $21.24 $22.09 $18.99 $15.56Skill index 933 933 933 896N 893 648 245 278,593Weight 0.134 0.219 0.070
MechanicsWage $23.73 $26.58 $20.84 $18.75Skill index 1,577 1,578 1,577 1,204N 924 465 459 36,419Weight 0.131 0.156 0.112
Fleet serviceWage $15.38 $17.67 $13.49 $12.85Skill index 508 446 560 437N 343 155 188 16,050Weight 0.042 0.046 0.038
AgentsWage $16.41 $17.84 $15.32 $13.69Skill index 733 727 737 661N 1,203 523 680 14,682Weight 0.175 0.157 0.189
OtherWage $20.23 $21.55 $19.83 $19.29Skill index 1,312 1,019 1,400 1,282N 2,643 609 2,034 877,302Weight 0.393 0.225 0.520
Means are compiled from the CPS monthly earnings files, September 1995–May 2006. Wages, shown in2005$, measure the hourly earnings for non-flight personnel, calculated over the sample (of size N) excludingimputed earners. For flight personnel, wages are calculated based on weekly earnings and an assumed 40 hweek for pilots and 36 h week for flight attendants. The airline and comparison worker groups are describedin the text. The BLS Skill index points are described in text and in Pierce (1999). Group weights, calculatedfrom CPS employment weights for the CPS sample including imputed earners, are used to compile the overallindustry and combined craft wage differentials shown in Table 2.

01
02
03
04
05
06
07
08
09
10
11
12
13
14
15
16
17
18
19
20
21
22
23
24
25
26
27
28
29
30
31
32
33
34
35
36
37
38
39
40
41
42
43
44
45
46
Elsevier AMS Job code: TEAI Ch02-N53027 25-4-2007 5:34p.m. Page:40 Trim:165×240MM TS: Integra
Font: Times Size:10/12pt Margins:Top:20MM Gutter:20MM T.Width:125mm 1 Color COP: Recto Depth: 46 lines
40 BARRY T. HIRSCH
from the CPS sample, including those who do not report earnings, using the employmentweights that the Census attaches to each surveyed worker.
For most craft groups, the raw mean union wages are considerably higher than forthe comparison group, while the nonunion air transport means are modestly higher.Interesting are means of the BLS occupational skill index. In some cases, includingthe overall industry comparison to the economy-wide comparison group, the skill indexmean for the air transport and comparison groups are highly similar. Where the skillvalues are similar, the suggestion is that the comparison group is closely matched tothe air transport treatment group. Where there is a difference, it illustrates the potentialimportance of the skill index control for more precise estimates of wage differentials.For example, aircraft mechanics (engine and non-engine) have higher occupational skillratings than do the other mechanics with whom they are compared. Apart from pilotsand flight attendants, who have unique CPS occupation codes, mean values of “Skill”are not identical for union and nonunion workers within a craft, since craft groupscan include more than one CPS occupation (e.g., mechanics include aircraft enginemechanics, aircraft mechanics excluding engine, and mechanic supervisors) and unionand nonunion workers need not be equally distributed across these detailed occupations.
5 EARNINGS DIFFERENTIAL ESTIMATES IN THE AIRTRANSPORT INDUSTRY AND BY AIRLINE CRAFT
In this section, earnings differential estimates between air transport workers and “compa-rable” workers and levels of work economy-wide are examined. The results are presentedin Table 2, first the differentials for the entire air transportation industry and then for eachairline worker group. Estimates of d are presented separately for union and nonunionworkers and from earnings equations with and without inclusion of the BLS skill index.Estimates are for the entire 1995–2006 period, since sample sizes by year and by craftare too small to reliably identify year-to-year movements. Appendix Table A3 providesinformation identical to that shown in Table 2, except that results are estimated for theyears 2003–2006 rather than 1995–2006. The reason for showing estimates beginning in2003 is a change that year in CPS occupation and industry definitions (the switch from1990 to 2000 Census codes). Because of similarity in results, discussion is restricted toTable 2, apart from noting that small sample sizes for the 2003–2006 estimates reducetheir reliability, particularly for the individual crafts.
It is worth emphasizing that our CPS analysis includes only wages and salaries andnot benefits. Economy-wide, unionized workers realize a “benefits premium” that islarger than the wage premium (Freeman, 1981). In the airline industry, union contractsamong the major airlines provide benefit levels well beyond those seen economy-widefor full-time workers in the private sector (Wachter, 2004). As evident in Table 1, theoverall skill index rating for workers within the airline industry is nearly identical tothat seen for the economy-wide comparison group (1,274 versus 1,282). This makes thecomparison of benefits among major carriers with the average economy-wide particularlyrelevant, even though such analysis lacks worker and job controls. Were it possible

01
02
03
04
05
06
07
08
09
10
11
12
13
14
15
16
17
18
19
20
21
22
23
24
25
26
27
28
29
30
31
32
33
34
35
36
37
38
39
40
41
42
43
44
45
46
Elsevier AMS Job code: TEAI Ch02-N53027 25-4-2007 5:34p.m. Page:41 Trim:165×240MM TS: Integra
Font: Times Size:10/12pt Margins:Top:20MM Gutter:20MM T.Width:125mm 1 Color COP: Recto Depth: 46 lines
WAGE DETERMINATION IN THE US AIRLINE INDUSTRY 41
Table 2 CPS Log Wage Differentials by Airline Worker Group and Union Status, 1995–2006
Group Skill Index All Union NonunionIncluded
All air transport industryNo 0.130 0.249 0.040Yes 0.108 0.226 0.019
Industry craftsNo 0.189 0.283 0.072Yes 0.154 0.249 0.037
PilotsNo 0.290 0.407 0.066Yes 0.245 0.365 0.013
Flight attendantsNo 0.209 0.246 0.110Yes 0.182 0.224 0.070
MechanicsNo 0.189 0.297 0.080Yes 0.115 0.223 0.005
Fleet serviceNo 0.114 0.220 0.008Yes 0.112 0.219 0.006
AgentsNo 0.118 0.182 0.069Yes 0.107 0.171 0.058
OtherNo 0.038 0.132 0.010Yes 0.036 0.147 0.003
See note to Table 1. Estimates are based on the CPS monthly earnings files, September 1995–May 2006. The“Industry Crafts” group includes the five airline crafts but excludes “Other”, while “All Industry” includes“Other” as well. The “All Industry” and “Industry Craft” differentials are compiled based on the weightedaverage of their component parts, using the employment weights shown in Table 1 (with separate weights byunion status). Estimation of differentials explained in text. Differentials are shown with and without controlfor BLS occupational skill index, lnSkill. Other control variables are education dummies (5) reflecting levelsfrom a minimum of a high school degree (including a GED) through a masters degree, potential experiencein quartic form separately and interacted with gender, gender, race/ethnicity (4), foreign born, region (8),metropolitan area size (6, with non-metro the base), year dummies (10), and broad occupation dummies (11,included only for the “Other” group regression).
to estimate a total compensation differential within a regression framework (i.e., withcontrols), the strong suggestion is that compensation premiums would exceed the wagepremiums presented in Table 2.21
21 A minor caveat is that our CPS economy-wide sample of full-time workers excludes those with schoolingless than a high school and greater than a masters degree, while the BLS benefits sample makes no suchrestriction.

01
02
03
04
05
06
07
08
09
10
11
12
13
14
15
16
17
18
19
20
21
22
23
24
25
26
27
28
29
30
31
32
33
34
35
36
37
38
39
40
41
42
43
44
45
46
Elsevier AMS Job code: TEAI Ch02-N53027 25-4-2007 5:34p.m. Page:42 Trim:165×240MM TS: Integra
Font: Times Size:10/12pt Margins:Top:20MM Gutter:20MM T.Width:125mm 1 Color COP: Recto Depth: 46 lines
42 BARRY T. HIRSCH
5.1 Industry Differentials
The top line of Table 2 contains the earnings differential results for the air transportindustry over the combined 1995–2006 period, separately by union status and both withand without inclusion of ln Skill. The industry differential d is the weighted averageacross wage differentials estimated for the five airline craft groups and a remaining“Other” air transport workers group.
The “standard” log wage differential d for 1995–2006, compiled from estimatedwage gaps absent control for “Skill”, is 0.13 log points.22 The “expanded” earningsdifferentials, compiled from regressions that control for “Skill”, reduce d by 0.02 logpoints, from 0.13 to 0.11. The smaller expanded gap estimate reflects not only that airlineoccupations tend to have somewhat higher skill (and other job attribute) ratings than docomparison group workers, but also that these higher skills are not fully accounted forby CPS measures such as schooling and potential experience.
The average differential across all air transport workers masks what are large earn-ings premiums for union workers and little apparent earnings advantage for nonunionworkers. Our preferred measure of d is the expanded measure, which controls for“Skill”. Nonunion air transport workers have an estimated d of only 0.02, indicatingthat nonunion earnings in the industry are roughly comparable to earnings realized bysimilar workers (union and nonunion) performing comparable levels of work outside theindustry. By contrast, union air transport workers realize a substantial earnings premiumof 0.23 log points, well above the level dictated by comparability and a competitivelabor market.23
A sizable share of the air transport sample (in particular the nonunion sample) is inthe “Other” category, which includes workers in a wide range of occupations and someworking for air transport companies other than airlines. In general, these workers tendto have smaller wage advantages than do the traditional airline crafts. If the weightedaverage is constructed from just the five “craft” groups (the row labeled “Industry Crafts”in Table 2), higher estimates of d are obtained – a combined union and nonunion earningsadvantage (controlling for “Skill”) of 0.15, a union premium of 0.25, and a nonuniondifferential of 0.04. In short, the air transportation industry is a high wage industry,with earnings premiums concentrated among union workers, particularly workers in thestandard airline craft groups.
5.2 Pilots
Earnings differential estimates by airline worker group are included in Table 2. Pilotsare first examined. The CPS pilot category includes “aircraft pilots and flight engineers”
22 All differentials are presented as log point wage gaps. Percentage gap estimates can be obtained by[ed – 1]100, where d is the log point gap. For reasons of space and because sample sizes are large, standarderrors are not presented. Standard errors for the industry gaps are approximately 0.007. Standard errors varyacross craft group, but are approximately 0.015 (but somewhat larger for fleet service and smaller for “other”workers).23 The airline union wage advantage is higher, but the same order of magnitude, than are economy-wide union–nonunion wage gaps during this period (Hirsch and Macpherson, 2006, Table 2a). Note that the union airlinedifferential compares unionized air transport workers to a mix of union and nonunion nonairline workers.

01
02
03
04
05
06
07
08
09
10
11
12
13
14
15
16
17
18
19
20
21
22
23
24
25
26
27
28
29
30
31
32
33
34
35
36
37
38
39
40
41
42
43
44
45
46
Elsevier AMS Job code: TEAI Ch02-N53027 25-4-2007 5:34p.m. Page:43 Trim:165×240MM TS: Integra
Font: Times Size:10/12pt Margins:Top:20MM Gutter:20MM T.Width:125mm 1 Color COP: Recto Depth: 46 lines
WAGE DETERMINATION IN THE US AIRLINE INDUSTRY 43
(pre-2003 the occupation is labeled “airplane pilots and navigators”). The comparisongroup for pilots includes full-time workers outside the air transportation industry inoccupations within the following broad categories beginning in 2003: business andfinancial operations, computer and mathematical, architecture and engineering, and life,physical science, and social science occupations. Pre-2003, the categories are labeledprofessional specialty occupations (except health) and technologists and technicians(except health). As for all the comparison group samples, workers with less than a highschool education or a degree beyond a masters are excluded.
The largest earnings premiums for any airline craft group are found for union pilots.Absent control for the BLS skill index, the earnings differential for all pilots is 0.290;with ln Skill included as a control the differential is 0.245. The earnings premium(with “Skill” included) is driven principally by unionized pilots, estimates of d forunion pilots being a sizable 0.365 and for nonunion pilots being 0.013, effectively zero(corresponding estimates without the “Skill” control are 0.407 and 0.066). There are nodoubt some unmeasured differences in skill and experience between union and nonunionpilots, the latter more likely to have less flying experience and to pilot smaller planes.Having said that plane size differs, however, it is not clear how large rate differentialswith respect to aircraft size would be in a competitive labor market. Whatever thosedifferences, they could not account for such large earnings premiums.24
Finally, it is important to note that estimates of pilot earnings differentials are sensitiveto the assumed level of mean earnings above top-coded weekly earnings. As statedpreviously, pilots’ mean earnings above the cap have been “conservatively” assignedas being equal to 1.25 times the top-code amount. This compares to the approximate1.7 times the cap for men (and 1.6 for women) based on the Pareto distribution, themultiples used for the comparison group sample (shown at www.unionstats.com). Hadthe Pareto distribution estimates been used for pilots, estimated earnings premiums forunion pilots would be about 0.10 log points higher than those shown. Because annualpilot sample sizes in the CPS are not large and the number of pilots at the top-codevaries quite a bit from year to year, it is difficult to reliably estimate the time pattern ofchanges in pilot earnings using the CPS.
5.3 Flight Attendants
Flight attendants earnings are compared to those of a comparison group of workers scat-tered across occupations within the broad categories of sales, service, and administrativesupport. I focus on the earnings equation results that include the BLS occupational
24 Reinforcing the finding of a large earnings premium for unionized pilots is the evidence that union pilots atthe major carriers have quit rates that are close to zero (Wachter, 2004). No doubt a part of this low quit ratereflects the fact that wage scales for pilots display substantial growth with respect to seniority, but senioritycannot be transferred across airlines with union contracts. As pilot layoffs have become common at the legacycarriers, some have been willing to “start over” at FedEx or at other carriers where greater job security isexpected (Dade, 2006). Although the wage is not the only determinant of the quit rate, a quit rate close tozero is hard to imagine absent a sizable premium. Economy-wide quit rates in the private sector (includingpart-time workers) are about 25% annually, while for private transportation and public utilities the rate is over15% (US BLS, 2006).
01
02
03
04
05
06
07
08
09
10
11
12
13
14
15
16
17
18
19
20
21
22
23
24
25
26
27
28
29
30
31
32
33
34
35
36
37
38
39
40
41
42
43
44
45
46
Elsevier AMS Job code: TEAI Ch02-N53027 25-4-2007 5:34p.m. Page:44 Trim:165×240MM TS: Integra
Font: Times Size:10/12pt Margins:Top:20MM Gutter:20MM T.Width:125mm 1 Color COP: Recto Depth: 46 lines
44 BARRY T. HIRSCH
skill index, whose inclusion lowers estimates of flight attendant earnings differen-tials by about 0.02–0.03 log points. The estimate for combined union and nonunionflight attendants is an earnings premium of 0.18 log points. As is the case for pilots,the premium varies by union contract coverage. Unionized flight attendants realize a0.22 premium, whereas nonunion flight attendants have a small earnings advantageof 0.07.
Several of the caveats that arise with respect to pilot earnings premium estimates donot arise for flight attendants. First, all but a few transportation attendants employed inthe air transport industry are likely to work for passenger airlines, whereas pilots andsome other air transport crafts are employed in air freight or some other air transportsupport industries. Second, neither skill requirements nor adverse working conditionssystematically increase with plane size (this issue is discussed in Section 5). And third,the entire 0.22 log point difference between union and nonunion flight attendants islikely to represent a premium. Although unionized flight attendants are concentrated atmajor carriers and nonunion flight attendants at nonunion midsize and regional carriers(Delta’s nonunion flight attendants are an exception), large airlines should be able toattract and retain productive flight attendants at wages similar to those received bynonunion workers at small airlines.
5.4 Mechanics
Aircraft mechanics include workers in the air transportation industry whose detailedoccupations are aircraft engine mechanics, aircraft mechanics (except engine), andmechanic supervisors. The comparison group includes workers in all mechanic occu-pations (including supervisors) employed outside the air transportation industry. Theaircraft mechanic occupations are awarded higher skill index ratings than are all othermechanic occupations; hence wage differential estimates with a control for ln Skill aresubstantially lower, by about 0.07 log points, than those excluding ln Skill. Over the1995–2006 period, the estimate of d for mechanics with the skill index (union andnonunion combined) is 0.11 log points, compared to a 0.19 estimate without the skillindex. As with pilots and flight attendants, the wage premium story is really a union story.Over the entire period, the log wage premium for union aircraft mechanics (with skillincluded) is 0.22, as compared to effectively zero (0.01) for nonunion aircraft mechanics.There exist skill differences (e.g., licenses to work on different planes) among aircraftmechanics within the air transport industry that are not observed. If unmeasured skillsare positively correlated with union status, estimates of within-industry union–nonunionwage differences are overstated, although wage gap estimates for all mechanics neednot be biased.
As with the other employee groups, a sizable wage premium for union, but notnonunion, aircraft mechanics is observed. Airlines have limited opportunity to substitutenonunion for union pilots or flight attendants when facing large within-industry wagedifferences. In contrast, airlines have some ability to substitute away from their union-ized mechanics by outsourcing scheduled maintenance and other work to specializedcompanies employing licensed aircraft mechanics (Goodwyn [2006] reports a recentexample of union “in-sourcing”). Although an airline’s mechanics union will bargain to

01
02
03
04
05
06
07
08
09
10
11
12
13
14
15
16
17
18
19
20
21
22
23
24
25
26
27
28
29
30
31
32
33
34
35
36
37
38
39
40
41
42
43
44
45
46
Elsevier AMS Job code: TEAI Ch02-N53027 25-4-2007 5:34p.m. Page:45 Trim:165×240MM TS: Integra
Font: Times Size:10/12pt Margins:Top:20MM Gutter:20MM T.Width:125mm 1 Color COP: Recto Depth: 46 lines
WAGE DETERMINATION IN THE US AIRLINE INDUSTRY 45
limit such substitution, the possibility of substitution should constrain the magnitude ofunion premiums among mechanics.25
5.5 Fleet Service (Ramp) Workers
There are a variety of ground workers, apart from mechanics, who service airplanes.These include baggage handlers, airplane cleaners (utility workers), workers who guideplanes into and out of their gates, and workers who refuel airplanes. Fleet service orramp workers category includes those who work in the air transportation industry andwhose occupations are freight, stock, and material handlers; and vehicle washer andequipment cleaners. The comparison group of workers includes those employed outsidethe air transportation industry in the following occupational categories: nonconstructionlaborers and freight, stock, and material handlers; garage workers; washer-cleaners; andpackers.
Inclusion of the skill index has little effect on estimates of d for ramp workers, thelog wage gap being 0.11 with or without control for ln Skill.26 As with other crafts,nonunion fleet service workers appear to be paid roughly their opportunity costs, with ad estimate of 0.01. Unionized fleet service workers realize an estimated wage premiumof 0.22 log points. As with mechanics, carriers facing high contract rates among fleetservice workers have incentive to outsource some of this work, substituting lower-costcontract workers for their own union employees.
5.6 Reservation Agents and Stores Employees
Airlines have a large number of customer service employees – ticket reservation agentsoutside of airports, ticket and gate agents within airports, and “stores” employees whooversee the recording and distribution of supplies and parts. “Agents” are defined asthose employed in the air transportation industry within the following occupations:reservation and transportation ticket agent; shipping, receiving, traffic clerks; stock clerkand order filler; and customer service representative. The comparison group includesworkers outside the air transportation industry employed in the same occupations asabove, plus those listed as other information and record clerks and as order clerks.
25 When faced with a strike by mechanics in August 2005, Northwest eliminated a large share of theirmechanics jobs through outsourcing and hired (in advance of the strike) replacement workers for the remainingmechanics jobs. One should be reluctant to generalize from the Northwest example. Northwest mechanicswere represented by a “rebel” union (AMFA) which had unseated the IAM, in the process alienating IAM’sremaining Northwest workers and Northwest’s other unions. Northwest’s unionized workers crossed the AMFApicket lines and allowed Northwest to continue operations despite the strike (Carey, 2005). An agreement,ratified in November 2006, allow striking AMFA workers to receive limited amounts of layoff or separationpay. Those accepting layoff status can bid on open technician positions.26 The small effect of the “Skill” index is not surprising, since those working in and outside the air transportationindustry (i.e., the treatment and comparison groups) are drawn largely from the same Census occupations andhence are assigned the same “Skill” values. It seems unlikely to me that the combination of required skills andadverse working conditions in these occupations is so different that it should lead to highly disparate wagesin and outside the air transportation industry.

01
02
03
04
05
06
07
08
09
10
11
12
13
14
15
16
17
18
19
20
21
22
23
24
25
26
27
28
29
30
31
32
33
34
35
36
37
38
39
40
41
42
43
44
45
46
Elsevier AMS Job code: TEAI Ch02-N53027 25-4-2007 5:34p.m. Page:46 Trim:165×240MM TS: Integra
Font: Times Size:10/12pt Margins:Top:20MM Gutter:20MM T.Width:125mm 1 Color COP: Recto Depth: 46 lines
46 BARRY T. HIRSCH
The combined union–nonunion wage differential estimate of d is 0.11 with controlfor ln Skill. Union–nonunion differences here are less than seen with other crafts, witha union wage advantage relative to the nonairline comparison group of 0.17 and anonunion wage advantage of 0.06.
5.7 Other Air Transport Industry Workers
The “other” or miscellaneous category of air transport workers, all those not included inthe previously discussed five crafts, are distributed over a broad range of occupations.The comparison group includes the entire sample of full-time workers outside of the airtransportation industry (recall that the sample excludes those with very low and higheducation levels and for whom the BLS skill index is not defined). Most of these airtransport workers are nonunion. Inclusion of the occupational skill index has little effecton estimates of the differential (broad occupation dummies are included in the “other”earnings equation). The overall earnings differential for the “other” group of workers is0.04. This reflects an earning premium of 0.15 for the small union portion of the groupand a zero estimate for the large nonunion group. More so than for the five airline craftgroups, a nontrivial number of the air transportation industry workers in the “other”occupation category are likely to work at companies other than a passenger airline.
Taking the occupational groups as a whole, a clear pattern emerges from the earningsanalysis in this section. First, there exists a sizable earnings premium among unionworkers in air transportation, relative to a mix of union and nonunion comparison groupworkers. Second, nonunion air transport workers appear to realize little premium com-pared to similar workers doing similar levels of work outside the industry. Althoughthere was evidence of rent sharing among nonunion as well as union airline workersduring the pre-1978 airline regulation period and in the immediate years after deregu-lation (Hirsch and Macpherson, 2000), any remaining rents are now small. What mightbe labeled an airline earnings premium is for the most part a union premium.
6 WAGE DIFFERENCES ACROSS AIRLINES: DOREGIONAL AIRLINE WAGES APPROXIMATEOPPORTUNITY COSTS?
In prior sections, average compensation among national carriers reported in DOT Form41 data have been used to measure changes over time in industry labor costs, whileworker data from the CPS have been examined to estimate wage differentials for unionand nonunion workers throughout the air transport industry, relative to similar workersand jobs outside the industry. In this section, evidence on contractual “top rates” forairline workers across national carriers and regional airlines is reviewed. On the basis ofthis and prior evidence, a question that is explored is whether opportunity cost wage ratesfor major carriers might be approximated by the rates currently seen at regional airlines.
Airline contract data are not publicly available (i.e., not reported to the government),but are assembled by trade groups. The Airline Industrial Relations Conference (Air Con-ference) is made up of a consortium of scheduled national airlines. Each provides their

01
02
03
04
05
06
07
08
09
10
11
12
13
14
15
16
17
18
19
20
21
22
23
24
25
26
27
28
29
30
31
32
33
34
35
36
37
38
39
40
41
42
43
44
45
46
Elsevier AMS Job code: TEAI Ch02-N53027 25-4-2007 5:34p.m. Page:47 Trim:165×240MM TS: Integra
Font: Times Size:10/12pt Margins:Top:20MM Gutter:20MM T.Width:125mm 1 Color COP: Recto Depth: 46 lines
WAGE DETERMINATION IN THE US AIRLINE INDUSTRY 47
labor contracts by craft to the Air Conference, which assembles contract information andterms of employment in their database. Member airlines are provided access to contractinformation from all participating airlines. J. Glass & Associates (a consultancy divisionoverseen by Ford & Harrison, LLP) manages a Regional Airline Association databasewith union and nonunion contract rates and terms of employment for regional airlines.
Wage schedules for national and regional carriers, drawn from the Air Conference andGlass & Associates databases, are provided in a December 2004 analysis by MichaelWachter (2004), who provided expert testimony for United Airlines in their 1113(c)bankruptcy hearing.27 It’s useful to recall the economic setting. In late 2004, high-cost airlines were in a serious financial situation following September 11, a recession,Internet pricing, increased price competition and rising market shares of low-cost carriers,and rising fuel prices. United had received wage concessions in 2003 following their2002 bankruptcy filing, but were asking for further concessions to help achieve aviable business plan that would allow them to emerge from bankruptcy protection. USAirways, which had preceded United into bankruptcy, had recently obtained reducedwage scales for their employees in their bid to emerge from bankruptcy. American hadearlier received concessions from their workers that allowed them to avoid bankruptcy.Delta and Northwest had relatively high contract rates at this time despite prior wageconcessions; these subsequently would be reduced further leading up to and followingtheir 2005 entry into bankruptcy. A relatively “healthy” Continental was less threatenedby bankruptcy, but did receive salary relief from its unions. Compared with the legacyairlines, Southwest was the anomaly in 2004 and remains so today. Although havinghigh contractual top rates, Southwest has a smaller share of employees at its top rates,lower benefit costs, higher labor productivity, lower operating costs, lower debt, anddefined contribution rather than under-funded defined benefit pension plans.
Evidence presented in Wachter (2004) allows one to compare wage rates at the majorcarriers to those among similar crafts at regional airlines. The analysis included twosets of United Airlines contract rates, those in force in December 2004 and those thenproposed by the airline (or, in the case of pilots, rates from a tentative agreement). Theexisting December 2004 rates reflected pay concessions United’s unions had agreed topreviously in 2003. The proposed United rates were nearly identical to those implementedpreviously at US Airways.
In Table 3, United’s post-2004 rates are compared to rates at other major airlines, atmid-size national airlines, and those at regional airlines. The significance of United’spost-2004 rates is that they, along with those at US Airways, can be thought of assetting, at least for a couple of years, a new industry standard.28 It is this “standard” thatis compared to wage schedules at mid-size and regional carriers.
Salary schedules are provided for eight separate worker crafts, summarized in Table 3.These are pilots, flight attendants, mechanics, utility workers, ramp workers, stores
27 The Wachter analysis was conducted with assistance from James Gillula of Global Insight and from me.Views expressed in this chapter are my own and need not reflect those of United, Michael Wachter, or GlobalInsight.28 Delta and Northwest, which entered bankruptcy in 2005 with pay rates well above United, eventuallyimplemented wage schedules similar to United’s post-2004 rates. American and Continental, which receivedconcessions from their unions outside of bankruptcy, have rates somewhat above those of United.

01
02
03
04
05
06
07
08
09
10
11
12
13
14
15
16
17
18
19
20
21
22
23
24
25
26
27
28
29
30
31
32
33
34
35
36
37
38
39
40
41
42
43
44
45
46
Elsevier AMS Job code: TEAI Ch02-N53027 25-4-2007 5:34p.m. Page:48 Trim:165×240MM TS: Integra
Font: Times Size:10/12pt Margins:Top:20MM Gutter:20MM T.Width:125mm 1 Color COP: Recto Depth: 46 lines
Tab
le3
Con
trac
tual
Top
-Rat
esan
dL
ogW
age
Dif
fere
ntia
lsbe
twee
nU
nite
dA
irlin
esan
dM
ajor
,Mid
-Siz
e,an
dR
egio
nal
Car
rier
s,D
ecem
ber
2004
Em
ploy
eeG
roup
Uni
ted
Air
lines
Dec
2004
Uni
ted
Prop
osal
Dec
2004
Ave
rage
atM
ajor
sA
vera
geat
Mid
-siz
eA
vera
geat
Reg
iona
lsU
nite
dPo
st-2
004
vs.M
ajor
s
Uni
ted
Post
-200
4vs
.Mid
-siz
e
Uni
ted
Post
-200
4vs
.Reg
iona
ls
Pilo
ts(m
onth
ly)
$12,
374
$10,
554
$12,
627
$11,
311
$5,8
61−0
.179
−0.0
690.
588
FAs
(mon
thly
)$3
,073
$2,8
95$3
,447
$2,8
63$2
,198
−0.1
750.
011
0.27
5M
echa
nics
$31.
09$2
9.82
$31.
99$2
8.39
$22.
73−0
.070
0.04
90.
271
Util
ity$1
7.50
$16.
65$1
6.83
$13.
49$1
2.39
−0.0
110.
210
0.29
6R
amp
$21.
06$1
9.61
$20.
09$1
7.05
$13.
69−0
.024
0.14
00.
359
Stor
es$2
1.06
$19.
61$1
9.86
$16.
82$1
3.93
−0.0
130.
153
0.34
2C
SR$2
1.75
$20.
25$2
0.31
$16.
86$1
3.82
−0.0
030.
183
0.38
2R
SR$2
1.01
$19.
56$1
9.58
$15.
95N
/A−0
.001
0.20
4N
/A
The
dolla
rra
tes
are
repo
rted
inW
acht
er(2
004)
.T
heU
nite
dpr
opos
edw
ages
are
trea
ted
asa
roug
hap
prox
imat
ion
ofpr
evai
ling
wag
esat
the
maj
orca
rrie
rsfo
llow
ing
wag
eco
nces
sion
sat
maj
orai
rlin
esdu
ring
2005
and
2006
.T
hela
stth
ree
colu
mns
show
the
diff
eren
cein
log
ofth
eav
erag
ew
ages
betw
een
the
Uni
ted
prop
osal
and
the
resp
ectiv
eav
erag
esat
the
maj
ors,
mid
-siz
e,an
dre
gion
alai
rlin
es.
All
wag
essh
own
refl
ect
top-
rate
s(m
axim
umse
nior
ity).
For
pilo
tsan
dfl
ight
atte
ndan
ts,
mon
thly
rate
sar
eba
sed
ona
75-h
yiel
d.O
ther
rate
ssh
own
are
hour
lyra
tes.
RSR
(res
erva
tion
serv
ice
repr
esen
tativ
es)
are
note
mpl
oyed
bym
ostr
egio
nalc
arri
ers.
Ave
rage
sat
six
maj
orca
rrie
rs(e
xclu
ding
Uni
ted)
,mid
-siz
e,an
dre
gion
alai
rlin
esar
eun
wei
ghte
d.A
list
ofca
rrie
rsin
clud
edin
each
cate
gory
ispr
ovid
edin
the
text
and
info
otno
te29
.
01
02
03
04
05
06
07
08
09
10
11
12
13
14
15
16
17
18
19
20
21
22
23
24
25
26
27
28
29
30
31
32
33
34
35
36
37
38
39
40
41
42
43
44
45
46
Elsevier AMS Job code: TEAI Ch02-N53027 25-4-2007 5:34p.m. Page:49 Trim:165×240MM TS: Integra
Font: Times Size:10/12pt Margins:Top:20MM Gutter:20MM T.Width:125mm 1 Color COP: Recto Depth: 46 lines
WAGE DETERMINATION IN THE US AIRLINE INDUSTRY 49
employees, customer service representatives (CSR), and reservation service representa-tives (RSR). Recall that the CPS analysis had five airline craft groups. The first threegroups in Table 3 – pilots, flight attendants, and mechanics – align exactly with CPScategories. The next two – utility (cleaners) and ramp workers – were included in theCPS fleet service worker category. The next three categories – stores, CSR, and RSRemployees – were included in the CPS agent category.
The first two columns of Table 3 provide the top-rate salary rates by craft for Unitedbefore and after December 2004. It is the post-2004 rate that will be treated as anapproximation of the industry standard for major and national airlines. The next threecolumns present the unweighted average of rates at the six major airlines other thanUnited (American, Continental, Delta, Northwest, Southwest, US Airways), midsizenational airlines, and at regional airlines.29 The use of top rates (maximum seniority)means that what is being compared is a wage contract structure across airlines ratherthan payroll cost differences. At the legacy airlines, a large proportion of workers are atthe top rates. Generally, the average wage within an airline will be below the top rate,although this need not be true since average wages include overtime pay and possiblepay supplements (e.g., international rates for flight attendants) not included in the toprate. New or expanding airlines will have fewer workers with high seniority, hencedifferences in top rates across carriers may not fully reflect current payroll differencesbetween legacy and low cost carriers. Over time, there should be a narrowing payrollcost gap as the age structure of the legacy and low cost carriers becomes more similar.
For all crafts other than pilots and flight attendants, hourly wage rates are provided.The rate for mechanics is an “all-in top rate” that includes the top-step base pay andmaximum license, skill, line, and longevity pay. For pilots at the major and mid-sizenational carriers, the pay shown is a monthly pay based on a 75-hour yield for a 12thyear captain flying a weighted average of planes within each airline’s fleet. Pilot ratesat regional carriers are for a 12th year captain flying a weighted average of 50-seat andlarger jets. Pay shown for flight attendants is likewise based on a 75-hour yield, withtop-step base and incentive pay (but excluding international pay).
The last three columns of Table 3 provide the log wage differential between United’spost-2004 rates of pay and the end-of-year 2004 pay in the three sectors of the airlineindustry – other major airlines, mid-size national airlines, and regional carriers. Asevident from these columns, United’s proposed (and eventual) rates for pilots, flightattendants, and, to a lesser extent, mechanics, would be below the average of other majorairlines. In 2005 and 2006, rates at Delta and Northwest would decrease to a level similarto those at United. The United top rates for pilots, flight attendants, and mechanics weresimilar to those seen at mid-size national airlines. Rates for the remaining crafts would besimilar to December 2004 rates at other major airlines and above rates at mid-size carriers.
The importance of Table 3 stems from the results reported in the final column, thedifference in log wages between the United proposed wages, a stand-in for what wouldemerge as the national carrier “industry standard,” and the unweighted averages of up
29 The mid-size national airlines are AirTran, Alaska, America West, ATA, Frontier, JetBlue, and Midwest. Theregionals are Air Wisconsin, Allegheny, American Eagle, Atlantic Southeast, Chautuaqua, Comair, ExpressJet,Horizon, Independence, Mesa, Mesaba, MidAtlantic, Midwest Connect, Piedmont, Pinnacle, PSA, SkyWest,and Trans States. Rates were not provided for all airlines in every craft.

01
02
03
04
05
06
07
08
09
10
11
12
13
14
15
16
17
18
19
20
21
22
23
24
25
26
27
28
29
30
31
32
33
34
35
36
37
38
39
40
41
42
43
44
45
46
Elsevier AMS Job code: TEAI Ch02-N53027 25-4-2007 5:34p.m. Page:50 Trim:165×240MM TS: Integra
Font: Times Size:10/12pt Margins:Top:20MM Gutter:20MM T.Width:125mm 1 Color COP: Recto Depth: 46 lines
50 BARRY T. HIRSCH
to 18 regional airlines (but fewer in some crafts). These craft-specific wage gaps arelarge – 0.59 log points (80%) for pilots, 0.28 (32%) for flight attendants, 0.27 (31%) formechanics, 0.30 (34%) for utility, 0.36 (43%) for ramp workers, 0.34 (41%) for storesworkers, and 0.38 (46%) for gate agents (there are few reservation agents among theregional airlines).30
Do wages at regional airlines approximate opportunity costs? By opportunity costwages, what is meant is a compensation structure that in a competitive labor market couldin the long run attract and retain a labor force with “appropriate” skills (appropriate mean-ing profit-maximizing, with there being a trade-off between compensation and produc-tivity). Wachter (2004) suggests that the wage scales seen at regional airlines provide anapproximation of opportunity cost wages, based on the similarity of jobs at the majorand regional carriers and small differences between regional wage scales and averagepublished wage rates within the same broad occupation categories economy-wide.
Although this claim is difficult to establish in a rigorous manner, it is plausible.The earlier CPS analysis implements comparability through the estimation of earningsmodels intended to compare air transport workers with measurably similar workersin broadly similar jobs outside the air transport industry. Jobs are made statisticallyequivalent, at least in principle, through measures of worker and job attributes. Theanalysis found rough equivalency between nonunion wages among craft workers in theair transportation industry and “comparable” workers outside the industry. Given highrates of union coverage among major carriers (Delta being the exception), then manyof these nonunion workers are employed by mid-size and regional carriers, as well asair transportation companies other than certificated carriers. The CPS analysis cannotcompare identical jobs, but it does approximate what airline workers might have earnedin an alternative career path (i.e., long-run opportunity costs).
The regional airline comparison seen in Table 3 provides an alternative way toassess comparability. The analysis compares workers in the same (i.e., comparable)occupation within the same industry. Such a wage comparison provides a control forskills, worker preferences, and working conditions. This is an important advantage, buthas the disadvantage that wages for all jobs within an industry may be impacted bynoncompetitive wage determination (e.g, union bargaining power), resulting in wagelevels above opportunity cost.31
Although comparing wages within the industry provides a seemingly precise jobsmatch, it cannot be asserted that jobs and workers within the industry are literallyidentical. Some (unknown) portion of each of the gaps between wages at the major and atregional carriers reflects differences in worker skills or in the nature of the job. Even werethere competitive wage determination throughout the airline industry, wage differencesbetween the major and regional carriers would remain. Today’s wages at regional
30 The stated percentage differences are calculated using the “low” regional airline average wage as the base.The log gaps (times 100) provide a value in between percentages calculated using the low and high wages asbase. The log of the average wage across airlines (used in the calculation) is a little larger than the average oflog wages.31 In particular, the concern is that union power in the industry (both union coverage and the threat oforganizing uncovered workers) raises the level of nonunion wages and regional carrier wages to exceedopportunity costs.

01
02
03
04
05
06
07
08
09
10
11
12
13
14
15
16
17
18
19
20
21
22
23
24
25
26
27
28
29
30
31
32
33
34
35
36
37
38
39
40
41
42
43
44
45
46
Elsevier AMS Job code: TEAI Ch02-N53027 25-4-2007 5:34p.m. Page:51 Trim:165×240MM TS: Integra
Font: Times Size:10/12pt Margins:Top:20MM Gutter:20MM T.Width:125mm 1 Color COP: Recto Depth: 46 lines
WAGE DETERMINATION IN THE US AIRLINE INDUSTRY 51
carriers are presumably higher than they would be were airline labor markets perfectlycompetitive (e.g., absent union coverage or the threat of organizing). A competitive oropportunity cost wage structure throughout the industry might produce salaries at themajor carriers that are similar to or slightly above what regional carriers pay today.
How similar are workers and jobs at the major versus the regional carriers? Theanswer to this question will differ across craft. Clearly, pilots at major carriers are flyinglarger jets and typically have greater flying experience. A competitive wage structurewould produce higher salaries for pilots flying larger planes and with more experience.But it does not follow that the wage gradient with respect to plane size or experiencewould be as large as is evident today, or that current salaries at regional carriers wouldnot be sufficient to attract to major carriers a sufficient number of pilots skilled at flyinglarge jets. Pilots are highly skilled and there is considerable trust placed on pilots notto make errors. But competitive salaries are determined at the margin and there arelarge numbers of individuals who want to be pilots – and who are able and willing toacquire the skills necessary to be a pilot.32 Regional airlines are able to attract qualifiedapplicants, even where the possibility of moving to a major carrier at far higher payis low. A high proportion of these pilots could and would acquire the licensing to flylarger planes were such jobs available. Nothing in the analysis permits us to say thata competitive salary for pilots of large jets would be precisely at the pay level seentoday for regional jets. But we know that current levels of pay at major carriers (asseen in the 0.59 log wage premium for major carriers over regional carriers) far exceedthe compensation necessary to attract and retain qualified pilots. And we know fromthe CPS analysis that unionized pilots (averaged across the entire air transport industry,including regionals and freight carriers) realize substantial earnings premiums, 0.37 logpoints, relative to what they might have earned in alternative career paths. Thus, salariesseen today for regional pilots may well be a reasonable approximation of what averagesalaries would be for airline pilots across a competitive airline industry labor market.
It is worth noting that a fully competitive labor market would allow movement ofpilots and other workers across carriers, without placing workers at a starting wage scale(zero seniority).33 If an industry were such that most worker skills were firm specific(i.e., not valued at other firms), then we would expect there to be promotion fromwithin and little hiring at other than a junior level. Yet far more than in most industries,worker skills in the airline industry are highly transferable across firms. The skills of apilot (or flight attendant or mechanic) that are valued at one airline are also valued atother airlines. What makes airline skills difficult to transfer and minimize cross-carriermobility of airline workers are not differences in skill requirements, but provisions inunion contracts that strictly tie pay to seniority with one’s current employer. Absentworker mobility across carriers, we cannot know what would be a competitive wagestructure. Mobility would act to limit demands for “high” pay since carriers can hire
32 Ideally, we would like to measure applicant queues and turnover at regional carriers to help determine ifwages are at market clearing levels. Currently, there is an excess supply of pilots throughout the industry.During 2005 FedEx had 14,000 applications for the 420 pilot jobs it filled. UPS hired 233 pilots from among10,000 applicants, 8,000 of whom were passenger pilots (Dade, 2006).33 Defined benefit pension plans also reduce mobility across firms, but these are becoming increasingly rarefor new private sector workers.

01
02
03
04
05
06
07
08
09
10
11
12
13
14
15
16
17
18
19
20
21
22
23
24
25
26
27
28
29
30
31
32
33
34
35
36
37
38
39
40
41
42
43
44
45
46
Elsevier AMS Job code: TEAI Ch02-N53027 25-4-2007 5:34p.m. Page:52 Trim:165×240MM TS: Integra
Font: Times Size:10/12pt Margins:Top:20MM Gutter:20MM T.Width:125mm 1 Color COP: Recto Depth: 46 lines
52 BARRY T. HIRSCH
experienced workers from other carriers. Likewise, mobility would limit the ability offinancially strapped carriers to pay below opportunity cost wages, since workers couldmove to other carriers.
Flight attendant pay is approximately 0.28 log points higher at major carriers than atthe regionals. The principal difference between the two jobs is that flight attendants atthe majors work on larger planes, work in teams rather than solo, and service longerbut fewer flights. It is not at all clear that the differences in required skills and thedesirability of working conditions between working on a large jet versus a small planeshould lead to higher pay at the major carriers. Many (but not all) flight attendants willprefer to work as part of a team and to service longer but fewer flights. Some flightattendants will prefer the more limited range of travel typical of regional airlines; whileothers will prefer the wider range of travel to larger cities, both in the US and abroad. Ifregional airlines can readily attract and retain flight attendants at their current levels ofpay, absent the expectation that they will move to higher paying job at a major carrier,then it is reasonable to argue that competitive pay for flight attendants would not behigher (or substantially higher) than the pay seen today at the regional carriers. The0.22 log point CPS wage premium estimated for union flight attendants (and 0.18 for allflight attendants) reinforces the argument that wage scales at regional carriers roughlyapproximate opportunity costs.
As with pilots, one would expect to see aircraft mechanics who service larger planesand work at major carriers to be paid more than mechanics at regional carriers. But itdoes not follow that competitive differentials between rates at major and regional carriersneed be 31% for mechanics (as in Table 3). The estimated CPS premium for unionaircraft mechanics relative to other types of mechanics economy-wide (conditional onschooling, age, and the occupational skill index, which highly rated aircraft mechanics)is 0.22 log points. If the CPS estimate is correct, then it suggests that competitive wagerates for aircraft mechanics would be lower throughout the industry, with a smaller wagegap between the regional and major carriers.
The remaining airline crafts – ground workers (ramp and utility employees), agents,and stores employees – receive wage rates from 0.30 to 0.38 log points higher at themajor airlines than at regional airlines. The CPS premium for union workers in theseoccupations was about 0.20 log points. Although there are some differences in the natureof these jobs between large and small carriers, the requisite skills and working conditionsshould not require such substantial wage differentials as seen in Table 3. Obviously,competitive wage levels across the entire industry would not precisely equal what isseen today at regional airlines, but these levels might not be too bad an approximation.
In short, both the CPS analysis, comparing unionized workers throughout the airtransport industry with similar workers and levels of job skill outside the airline industry,and the within industry comparison of contract scales at the majors and the regionalcarriers, indicate a wage structure in the airline industry that is well above opportunitycost. Were the labor market in the airline industry a competitive one, absent unions thatpossessed and exercised strong bargaining power, we would see a substantially lowerlevel of compensation in the industry, coupled with easy worker mobility across carriersand few contractual restrictions on outsourcing. Whether airline compensation is headedtoward opportunity costs is addressed in the final section of the chapter.

01
02
03
04
05
06
07
08
09
10
11
12
13
14
15
16
17
18
19
20
21
22
23
24
25
26
27
28
29
30
31
32
33
34
35
36
37
38
39
40
41
42
43
44
45
46
Elsevier AMS Job code: TEAI Ch02-N53027 25-4-2007 5:34p.m. Page:53 Trim:165×240MM TS: Integra
Font: Times Size:10/12pt Margins:Top:20MM Gutter:20MM T.Width:125mm 1 Color COP: Recto Depth: 46 lines
WAGE DETERMINATION IN THE US AIRLINE INDUSTRY 53
7 THE FUTURE – OPPORTUNITY COST WAGESOR UNION WAGE CYCLING?
Workers in the air transportation industry are relatively highly paid. Some of this highpay reflects the training and skills required for jobs in the airline industry. Analysisin this chapter, however, provides evidence of substantial wage premiums in the airtransportation industry. The premiums are realized primarily by union employees atmajor and mid-size airlines. Wages at regional carriers are substantially lower than atlarge national carriers and may roughly approximate what would be opportunity costearnings for the rest of the airline industry. There is little evidence for earnings premiumsamong nonunion workers in the industry, many of whom work in occupations outside thetraditional airline craft groups of pilots, flight attendants, mechanics, fleet service, andagents. Pay premiums are particularly large for unionized pilots, but are also substantialfor other union workers.
Compensation premiums are tied closely to union bargaining power (i.e., the ability toinflict costs through a strike), a strike threat power that appears unparalleled in privateindustry in the US Union ability to acquire wage gains, however, depends cruciallyon the financial health of carriers. During good times, unions capture or “tax” somesizable share of potential profits. During bad times, unions moderate these demandsor agree to wage concessions when firm survival and jobs are threatened. Becausewages and benefits are negotiated and specified in long-term contracts, but the futurefinancial fortunes of the firm are sometimes poorly predicted, changes in compensation(either through new contracts or renegotiation of contracts) lag changes in the productmarket.
What might stop or substantially weaken this lagged wage-profit cycling; that is,a variable union tax on carrier profits? In most US industries, such cycles are notreadily evident because union density is low and competition forces product prices toapproximately reflect opportunity costs (including a normal return on capital). Were therea sufficient number of carriers that had competitive or opportunity cost compensation andwere air fares not determined in partially segmented markets, pricing would consistentlyreflect the costs at these low-cost carriers. There would be little ability for unions toacquire and sustain noncompetitive wages and benefits. Certainly the airline industry isnot immune to such forces. Increased penetration of low-cost carriers has limited thepricing power of major carriers, particularly on heavily traveled point-to-point routes.34
There also exists competition across cities (carriers) when customers prove willing todrive to alternative airports (Fournier et al., 2007). And during time periods and inmarkets with excess capacity, price competition can be keen.35 Such price competitionclearly constrains union bargaining power, but it does not eliminate it.
34 Low-cost carriers, however, have low penetration in low-density origin-to-destination routes, which continueto depend heavily on the hub-based legacy carriers. Analysis by Darin Lee shows that lower cost carriers’ shareof domestic passengers increased from about 10% in 1990 to about 30% in 2004. He also estimates that by 2004,75% of domestic passenger “trips” were exposed to LCC competition. See http://www.darinlee.net/stats.html.35 Busse (2002) finds that carriers in the worse financial condition, particularly those highly leveraged, aremost likely to start price wars. Carriers which most directly compete with price war leaders are more likely tojoin the price war.
01
02
03
04
05
06
07
08
09
10
11
12
13
14
15
16
17
18
19
20
21
22
23
24
25
26
27
28
29
30
31
32
33
34
35
36
37
38
39
40
41
42
43
44
45
46
Elsevier AMS Job code: TEAI Ch02-N53027 25-4-2007 5:34p.m. Page:54 Trim:165×240MM TS: Integra
Font: Times Size:10/12pt Margins:Top:20MM Gutter:20MM T.Width:125mm 1 Color COP: Recto Depth: 46 lines
54 BARRY T. HIRSCH
The bankruptcies of major carriers and concomitant downward adjustment in laborcompensation throughout much of the industry can certainly be seen as a move towarda more competitive wage structure. The increased penetration of low cost carriers andthe enhanced competition within major city hub airports suggests that price competitionwill constrain the future growth in labor costs. I do not predict, however, an imminentor smooth transition to an era of opportunity cost compensation. The airline industryremains highly unionized. As in the past, airlines are likely to reestablish market positionswhere they can be profitable, possibly through innovations or in other ways that cannotbe anticipated. As this is written, airlines are close to the point of solvency due to healthydemand and reduced capacity. If fuel prices moderate and seating capacity remains tight,airlines will resume profitability.
Then the test begins. Unions retain substantial bargaining power and will attempt tomake up for wage and benefit concessions. How this bargaining will play out is hardto predict, but it seems unlikely that airlines can hold compensation down to the levelsacquired in 2005–2006. Of course, the major carriers and their unions will not returnquickly to the types of contracts seen in the early 2000s. It is clear to companies andtheir unions that such rates cannot be sustained. Union demands will be less affected bythe opportunity cost of labor than by carriers’ ability to pay. It is unclear whether or notdemands well in excess of opportunity costs will be or can be rejected by management.36
For the foreseeable future, airline unions will continue to tax carrier profits and we shallsee a continuation of union wage cycling, hopefully at levels more sustainable than inthe past.
The labor relations environment in the airline industry has long been contentiousand characterized by mutual distrust.37 The bankruptcies at US Airways, United, Delta,and Northwest, along with labor concessions at American, Continental, and severalsmaller airlines, have further strained management–labor relations.38 There are mutualbenefits to a more cooperative labor relations environment, however, if it can pro-duce a high level of productivity and sustainable labor costs. Although there is littlereason to expect such an outcome industry-wide, there are forces that may well pushsome carriers in that direction. The financial troubles at major and mid-size carriers,coupled with increasing product market competition, make unions and their membersmore aware than ever that their long-run well-being requires a financially healthy
36 An interesting example of such a dynamic can be seen at (largely nonunion) FedEx, which is currentlyhighly profitable. At the same time that pilot salaries have fallen in the passenger airline industry, union pilotsat FedEx emphasized their company’s profitability and pushed for large pay increases. A lengthy impassebegan in 2004, and remained unresolved until a four-year agreement with industry-leading pay was reachedin August and approved in October 2006 (their 1999 contract remained in force during this period). Similarly,a new UPS pilots’ contract was ratified in August 2006 (the prior contract became amendable at the end of2003). The new contract runs through 2011 and includes substantial pay increases. Pay scales for senior pilotsat the cargo carriers now exceed those for the major carriers. Some employed passenger pilots, concernedabout job security at their current employers, have tried to “start over” at UPS or FedEx, despite the loss ofseniority and a large initial sacrifice in pay (Dade, 2006).37 Exceptions include Southwest Airlines and recent labor relations at Continental. For a discussion, see Gittellet al. (2004).38 Survey evidence in 2005 indicates high levels of anger and militancy among pilots and flight attendants(Comstock, 2006).

01
02
03
04
05
06
07
08
09
10
11
12
13
14
15
16
17
18
19
20
21
22
23
24
25
26
27
28
29
30
31
32
33
34
35
36
37
38
39
40
41
42
43
44
45
46
Elsevier AMS Job code: TEAI Ch02-N53027 25-4-2007 5:34p.m. Page:55 Trim:165×240MM TS: Integra
Font: Times Size:10/12pt Margins:Top:20MM Gutter:20MM T.Width:125mm 1 Color COP: Recto Depth: 46 lines
WAGE DETERMINATION IN THE US AIRLINE INDUSTRY 55
employer. At the same time, Southwest and, to a lesser extent, Continental, provide exam-ples where relatively cooperative labor relations environments are possible and jointlybeneficial.39
Although it is possible that labor relations at the legacy carriers will improve, this isjust a possibility.40 Nothing guarantees that such environments will emerge, or even thatcooperative labor relations can be maintained at Southwest or elsewhere in the industry.What can be predicted is that in absence of the emergence of more cooperative laborrelations environments, we are likely to observe a return to wage and profit cycles,increased penetration of carriers that can achieve and maintain low costs (a function ofproductivity as well as labor compensation), and an uncertain future for the remaininglegacy airlines. Whatever the labor relations path followed in the airline industry, allparties must continue to respond to the competitive forces that have been and willcontinue to ultimately shape the direction of the industry.
APPENDIX
Table A1 Average Compensation and Labor Costs per Available Seat Mile, Major and NationalAirlines, 1990–2005
Year Salaries and Benefits(2005$)
CV Labor Costs, centsper ASM (2005$)
CV
1990 $73,244 13.5 4.70 21.31991 $74,164 11.1 4.66 18.21992 $76,447 13.1 4.54 18.21993 $77,586 17.3 4.43 20.51994 $81,012 17.2 4.41 20.31995 $81,147 15.3 4.33 20.41996 $81,893 17.4 4.24 23.41997 $80,764 15.8 4.23 21.31998 $80,156 14.1 4.29 19.71999 $79,318 12.8 4.30 20.12000 $81,656 12.1 4.36 18.42001 $86,339 16.6 4.60 19.12002 $89,984 15.7 4.66 19.1
(Continued)
39 Little is known about the labor relations environments or human resource strategies employed by low-costcarriers, apart from Southwest. This topic is the subject of research by the Labor and Employment RelationsAssociation (LERA) Airline Industry Council (Gittell and Kochan, 2006). The limited evidence to date suggeststhat there exists substantial heterogeneity across carriers.40 An example of mutually beneficial labor-management cooperation can be seen at American Airlines, alegacy carrier with a rocky labor relations history. A redesign of maintenance operations, based in large parton worker input, has led to significant “in-sourcing” of maintenance from other airlines (Goodwyn, 2006).

01
02
03
04
05
06
07
08
09
10
11
12
13
14
15
16
17
18
19
20
21
22
23
24
25
26
27
28
29
30
31
32
33
34
35
36
37
38
39
40
41
42
43
44
45
46
Elsevier AMS Job code: TEAI Ch02-N53027 25-4-2007 5:34p.m. Page:56 Trim:165×240MM TS: Integra
Font: Times Size:10/12pt Margins:Top:20MM Gutter:20MM T.Width:125mm 1 Color COP: Recto Depth: 46 lines
56 BARRY T. HIRSCH
Table A1 Average Compensation and Labor Costs per Available Seat Mile, Major and NationalAirlines, 1990–2005—Cont’d
Year Salaries and Benefits(2005$)
CV Labor Costs, centsper ASM (2005$)
CV
2003 $89,213 15.6 4.28 17.72004 $87,279 14.8 3.80 16.12005 $82,098 14.1 3.27 14.8
These numbers are shown in Figures 1 and 2. Based on compensation, employment, and ASM informationreported by the US Department of Transportation, Bureau of Transportation Statistics, Form 41. Daniel Kasperand Darin Lee kindly provided current dollar figures by carrier and year on compensation and cost perASM. Current dollar figures were converted to 2005$ and weighted averages were formed based on carrieremployment counts provided in Form 41 data. CV measures the weighted coefficient of variation (standarddeviation divided by mean). See text for further details.
Table A2 Construction of Airline Craft and Comparison Groups in the CPS
Air transportation groupsWorkers employed in air transport industry (code 421 for 1995–2002; code 6070 for 2003–2006)
CPS Occ code Occupation namePilots
1995–2002 226 Airplane pilots and navigators2003–2006 9030 Aircraft pilots and flight engineers
Flight attendants1995–2002 463 Public transportation attendants2003–2006 4550 Transportation attendants
Mechanics1995–2002 508 Aircraft engine mechanics
515 Aircraft mechanics, except engine503 Supervisors, mechanics and repairers
2003–2006 7140 Aircraft mechanics and service technicians7000 First-line supervisors/managers of mechanics, installers, and
repairersFleet service (ramp) workers
1995–2002 883 Freight, stock, and material handlers, n.e.c.887 Vehicle washers and equipment cleaners
2003–2006 9620 Laborers and freight, stock, and material movers, hand9610 Cleaners of vehicles and equipment
Agents and stores1995–2002 318 Transportation ticket and reservation agents
364 Traffic, shipping, and receiving clerks365 Stock and inventory clerks
2003–2006 5410 Reservation and transportation ticket agents and travel clerks5610 Shipping, receiving, and traffic clerks5620 Stock clerks and order fillers5240 Customer service representatives
Other air transport workers: All full-time air transport workers not in one of the above craftsComparison groupsComparison group workers are not employed in the air transportation industry
Occupation codes (occupation codes and names posted at www.unionstats.com)

01
02
03
04
05
06
07
08
09
10
11
12
13
14
15
16
17
18
19
20
21
22
23
24
25
26
27
28
29
30
31
32
33
34
35
36
37
38
39
40
41
42
43
44
45
46
Elsevier AMS Job code: TEAI Ch02-N53027 25-4-2007 5:34p.m. Page:57 Trim:165×240MM TS: Integra
Font: Times Size:10/12pt Margins:Top:20MM Gutter:20MM T.Width:125mm 1 Color COP: Recto Depth: 46 lines
WAGE DETERMINATION IN THE US AIRLINE INDUSTRY 57
Table A2 Construction of Airline Craft and Comparison Groups in the CPS—Cont’d
Pilot comparison group1995–2002 43–79; 173; 213–233; 2352003–2006 500–1960
Flight attendant comparison group1995–2002 243–285; 303–389; 433–447; 456–4592003–2006 3600–3650; 4000–4160; 4300–4650; 4700–4960;5000–5930
Mechanic comparison group1995–2002 505–5492003–2006 7000–7620
Fleet service comparison group1995–2002 883; 889; 885–8882003–2006 9620; 9360; 9610; 9640
Agents and stores comparison group1995–2002 318; 323; 364; 365; 3272003–2006 5410; 5420; 5610; 5620; 5350
Other worker comparison group: All full-time workers not in air transport (plus other samplecriteria)
See text for additional details and discussion on the CPS sample.
Table A3 CPS Log Wage Differentials by Union and Nonunion AirlineWorker Groups, 2003–2006
Group Skill IndexIncluded
All Union Nonunion
All air transport industryNo 0.132 0.240 0.042Yes 0.117 0.224 0.027
Industry craftsNo 0.220 0.284 0.131Yes 0.194 0.261 0.102
PilotsNo 0.318 0.422 0.131Yes 0.285 0.391 0.096
Flight attendantsNo 0.156 0.209 0.009Yes 0.148 0.207 −0.013
MechanicsNo 0.229 0.321 0.092Yes 0.180 0.271 0.042
Fleet serviceNo 0.200 0.126 0.258Yes 0.197 0.126 0.254
AgentsNo 0.197 0.229 0.167
(Continued)

01
02
03
04
05
06
07
08
09
10
11
12
13
14
15
16
17
18
19
20
21
22
23
24
25
26
27
28
29
30
31
32
33
34
35
36
37
38
39
40
41
42
43
44
45
46
Elsevier AMS Job code: TEAI Ch02-N53027 25-4-2007 5:34p.m. Page:58 Trim:165×240MM TS: Integra
Font: Times Size:10/12pt Margins:Top:20MM Gutter:20MM T.Width:125mm 1 Color COP: Recto Depth: 46 lines
58 BARRY T. HIRSCH
Table A3 CPS Log Wage Differentials by Union and Nonunion AirlineWorker Groups, 2003–2006—Cont’d
Group Skill IndexIncluded
All Union Nonunion
Yes 0�173 0.206 0�142Other
No −0�007 0.085 −0�043Yes −0�006 0.093 −0�045
Identical to Table 2, except that the sample period is restricted to the years 2003–2006following a new set of occupation and industry codes. Sample sizes for specific airlinecrafts are very small. See note to Table 2 and discussion in the text.
REFERENCES
Air Transport Association. 2006. U.S. Airline Cost Index: Major & National Passenger Carriers,Fourth Quarter 2005, Washington, DC, July 14, http://www.airlines.org/economics/finance/CostIndex.htm.
Allegretto, S.A., Corcoran, S.P., Mishel, L. 2004. How does teacher pay compare? Methodologicalchallenges and answers. Washington, DC: Economic Policy Institute.
Bollinger, C.R., Hirsch, B.T. 2006. Match bias from earnings imputation in the CPS: The case ofimperfect matching. Journal of Labor Economics 24 (3), 483–519.
Busse, M. 2002. Firm financial condition and airline price wars. RAND Journal of Economics 33(2), 298–318.
Cahuc. P., Zylberberg, A. 2004. Labor Economics. Cambridge, Mass: The MIT Press.Card, D. 1998. Deregulation and labor earnings in the airline industry. In Regulatory Reform and
Labor Markets, edited by J. Peoples. Norwell, Mass: Kluwer Academic Publishing, 183–230.Carey, S. 2005. Northwest, striking mechanics are to meet on talks. Wall Street Journal, October
12, p. B5.Comstock, P. 2006. Work-related views of pilots and flight attendants: Turbulence ahead? Per-
spectives on Work (The magazine of the LERA) 9 (2), 57–59.Crémieux, P. 1996. The effect of deregulation on employee earnings: Pilots, flight attendants, and
mechanics, 1959–1992. Industrial and Labor Relations Review 49 (2), 223–42.Dade, C. 2006. Why some passenger pilots take huge pay cuts to fly cargo. Wall Street Journal,
June 2, p. A13.Freeman, R.B. 1981. The effect of unionism on fringe benefits. Industrial and Labor Relations
Review 34 (4), 489–509.Fournier, G.M., Hartmann, M.E., Zuehlke T. 2007. Airport substitution by travelers: Why do we
have to drive to fly? In Advances in Airline Economics, Volume II: The Economics of AirlineInstitutions, Operations and Marketing, edited by D. Lee, Amsterdam: Elsevier.
Gittell, J.H., Kochan, T.A. 2006. Low cost competition in the global airline industry. Perspectiveson Work (The magazine of the LERA) 9 (2), 55–56.
Gittell, J.H., von Nordenflycht, A., Kochan, T.A., 2004. Mutual gains or zero sum? Labor relationsand firm performance in the airline industry. Industrial and Labor Relations Review 57 (2),163–180.
Goodwyn, W. 2006. American Airlines “insources” maintenance work. All Things Considered.National Public Radio, Dec. 7, at http://www.npr.org/templates/story/story.php?storyId=6594273&sc=emaf.

01
02
03
04
05
06
07
08
09
10
11
12
13
14
15
16
17
18
19
20
21
22
23
24
25
26
27
28
29
30
31
32
33
34
35
36
37
38
39
40
41
42
43
44
45
46
Elsevier AMS Job code: TEAI Ch02-N53027 25-4-2007 5:34p.m. Page:59 Trim:165×240MM TS: Integra
Font: Times Size:10/12pt Margins:Top:20MM Gutter:20MM T.Width:125mm 1 Color COP: Recto Depth: 46 lines
WAGE DETERMINATION IN THE US AIRLINE INDUSTRY 59
Hirsch, B.T., Schumacher, E.J., 2004. Match bias in wage gap estimates due to earnings imputation.Journal of Labor Economics 22 (3), 689–722.
Hirsch, B.T., Macpherson, D.M. 2000. Earnings, rents, and competition in the airline labor market.Journal of Labor Economics 18 (1), 125–55.
Hirsch, B.T., Macpherson, D.M. 2003. Union membership and coverage database from the CurrentPopulation Survey: Note. Industrial and Labor Relations Review 56 (2), 349–54 (accompanyingdatabase at http://www.unionstats.com, updated annually).
Hirsch, B.T., Macpherson, D.M. 2006. Union Membership and Earning Data Book: Compilationsfrom the Current Population Survey (2006 Edition). Washington, DC: The Bureau of NationalAffairs.
Johnson, Nancy Brown. 1995. Pay levels in the airlines since deregulation. In Airline LaborRelations in the Global Era: The New Frontier, edited by P. Cappelli. Ithaca, NY: ILR Press,101–15.
Matsa, D.A. 2006. Capital structure as a strategic variable: Evidence from collective bargaining.Working paper, September 28. Available at SSRN: http://ssrn.com/abstract=933698.
Nay, L.A. 1991. The determinants of concession bargaining in the airline industry. Industrial andLabor Relations Review 44 (2), 307–23.
Pierce, B. 1999. Using the National Compensation Survey to predict wage rates. Compensationand Working Conditions (Winter), 8–16.
US Bureau of Labor Statistics. 2006. Job openings and labor turnover: April 2006. News Release,Table 8, at http://www.bls.gov/news.release/jolts.toc.htm.
Wachter, M.L. 2004. Declaration and Expert Report of Michael L. Wachter. Exhibit 103, in theUnited States Bankruptcy Court for the Northern District of Illinois, Eastern Division, In reChapter 11, UAL Corporation, et al., Case No. 02-B-48191, December.