Embed Size (px)
Citation preview
WAGE DISPERSION AND LABOUR MARKET INSTITUTIONS:A CROSS COUNTRY STUDY
Michael Coelli, Jerome Fahrer and Holly Lindsay
Research Discussion Paper9404
June 1994
Reserve Bank of Australia
Economic Research Department
The views expressed herein are those of the authors and do not necessarily reflectthose of the Reserve Bank of Australia
i
ABSTRACT
This paper examines the issue of wage flexibility in an international context usingsectoral wage dispersion data from fourteen OECD countries. An emphasis isplaced on the evaluation of Australian institutions and data. We draw comparisonsbetween a measure of wage dispersion and the degree of centralisation of acountry's wage setting institution to determine whether decentralised wage settinginstitutions are necessarily associated with more flexible wages. Inter-countrycomparisons are drawn among the levels of wage dispersion over time, and therelationship between wages and demand conditions for labour, includingproductivity and relative prices, are examined. We observe that no strongsystematic relationship exists between wage dispersion and the degree ofcentralisation of labour market institutions. We also find that relative to most otherOECD countries for which data are available, Australian wages were stronglycorrelated both with labour demand conditions and productivity growth over theperiod 1975-90.
ii
TABLE OF CONTENTS
1. INTRODUCTION 1
2. AUSTRALIAN LABOUR MARKET INSTITUTIONS: AN OVERVIEW 3
3. LITERATURE SURVEY 5
4. THE COSTS OF RELATIVE WAGE RIGIDITY 7
5. A MODEL OF WAGE FLEXIBILITY 12
6. EMPIRICAL ANALYSIS 14
6.1 Measuring Flexibility 15
6.2 Wage Dispersion as a Measure of Institutional Structure 17
6.3 The Relationships Among Wages, Productivity, Prices and Growth 23
6.4 The Relationship between Employment and Wages 27
6.5 The Relationships Among Wage Dispersion and VariousMacroeconomic Performance Indicators 29
7. CONCLUSION 33
APPENDIX 1: WAGE DISPERSION SUMMARY STATISTICS 34
APPENDIX 2: DATA SOURCES 41
REFERENCES 43
WAGE DISPERSION AND LABOUR MARKET INSTITUTIONS:A CROSS COUNTRY STUDY
Michael Coelli, Jerome Fahrer and Holly Lindsay
The present trend of labour market reform towards an enterprise focus andaway from occupational 'awards' is a belated recognition of the disaster thatthe Australian industrial relations system has inflicted on us (Blandy, 1993, p.10).
...it should be appreciated that the push for labour flexibility is part of aneconomically and socially conservative agenda that includes an attack on tradeunion power and a reduction in the working conditions that are currentlyenshrined in Australia's industrial award system (Burgess and McDonald,1989, p. 29).
Australian discussion of wage determination is parochial. There is an almosthypnotic fascination with the arbitral system and its trappings, with the resultthat appropriate perspective on wage fixing and economic problems is lost...this navel-gazing leads to the perpetuation of too many myths... (Withers,1986, p. 243).
1. INTRODUCTION
As the first two quotes above demonstrate, labour market reform - perhaps morethan any other issue of Australian economic policy - generates much passionaterhetoric. The current labour market reform agenda in Australia has focused onissues concerning labour market flexibility, typically a poorly defined concept. Onthe basis that centralised wage setting institutions are too "rigid", policies haveevolved to permit wage determination at the enterprise or firm level. The changeshave been based on the belief that centralised systems do not permit sufficientrelative wage flexibility. The resulting distorted price signals in the labour marketcontribute to supply and demand mismatches, impeding productivity growth andreducing the potential for improved economic prosperity in general.
In order to illustrate and analyse these issues, this paper examines data fromfourteen OECD countries which encompass a wide spectrum of wage setting
2
institutions. We present quantitative measures of labour market flexibility based onwage dispersion across sectors, and determine whether a high degree of wagedispersion is necessarily linked with decentralised wage setting institutions. Giventhat a flexible labour market should be characterised by wages which adjust toconditions within the market, we test if such flexible relationships exist. Therelationship among the deviation of sectoral wages from the mean wage andsimilarly, deviations of productivity, prices and growth across countries over asimilar time horizon is estimated to determine if the expected positive relationshipexists between these variables. The linkage between sectoral deviations of wagesand employment growth is also analysed. In addition, we examine the relationshipsbetween our measure of flexibility and various indicators of macroeconomicperformance.
We do not find a strong systematic relationship between our measure of wagedispersion and the degree of centralisation of wage setting institutions. Low wagedispersion can be associated with centralised wage setting institutions, but is notnecessarily so. Insofar as we can compare absolute measures of wage dispersionacross countries, we observe that Australia recorded a relatively high degree ofdispersion in the 1980s compared to other countries despite having a centralisedwage setting system. As expected, we generally find positive relationships amongthe deviations of wages across sectors and the deviations of sectoral productivitylevels and prices. Relative to most other OECD countries examined, deviations ofAustralian wages are found be strongly related to deviations in productivity andprices across sectors. This suggests that, contrary to much popular perception,Australia’s wage setting system has been flexible by international standards, at leastaccording to this method of analysis.
The rest of the paper is organised as follows. In Section 2 we discuss theinstitutional background to the current policy debate in Australia. The existingliterature relating labour market institutions and economic performance is reviewedin Section 3. In Section 4 we present a model which demonstrates the cost ofrelative wage rigidity, while in Section 5 we derive a structural model relatingsectoral wages, productivity and prices. Our measures of wage dispersion arepresented in Section 6 along with the results from our tests of labour marketflexibility across countries. Section 7 concludes.
3
2. AUSTRALIAN LABOUR MARKET INSTITUTIONS: ANOVERVIEW
The Australian system of wage determination is unique among the systems found inindustrial countries. Historically, it has tended to be highly centralised and has beencharacterised as a complex and varying mixture of compulsory arbitration andcollective bargaining. Since the early years of this century, federal and state arbitraltribunals, which were established as independent judicial authorities underparliamentary acts, have played a key role in wage determination.
After a period of evolution away from a formal centralised wage setting systemwhich started in the late 1960s, centralisation was reaffirmed in 1983 following anagreement between the Government and the Australian Council of Trade Unions(ACTU). Under the Prices and Incomes Accord, which came into effect inSeptember 1983, unions agreed that they would make no wage claims beyond thosewhich were agreed to under the Award System. Under the first version of theAccord, wages were indexed to a measure of the cost of living with the implicationthat there was little scope for relative wage changes.
The Accord endured several episodes of economic turmoil in the 1980s; this mayhave been in part because it was relatively more subtle than the automaticindexation systems which had been adopted by other countries. For example, thefirst renegotiation of the Accord took place in September 1985 in the context of asharp fall in the terms of trade and the consequent depreciation of the Australiandollar. The parties agreed to discount the effects of the fall in the exchange rate onthe CPI in order to preserve a real depreciation, and so reduce the negative effectsof the fall in the terms of trade on employment.
Changes made to the Accord in 1987 increased the scope for adjustment of relativewages. It was agreed that the wage indexation process should be abandoned andthat, implicitly, relative wages would be permitted more scope for change. A two-tier system of wage fixation was introduced. The first tier distributed a flat wageincrease to all workers, with emphasis on low wage earners and nation-wideadjustments. The second tier required parties to enter primarily enterprise levelnegotiations to try to offset the cost of pay increases to employers by making theenterprise more competitive through restructuring and other efficiency enhancingchanges.
4
In August 1988, the two-tier system was modified to give a prominent role to theStructural Efficiency Principle. This change formally linked part of the two-stagewage increases to the willingness of unions to cooperate in implementing measuresto improve productivity. An emphasis was placed on strategies which wouldenhance microeconomic efficiency and reduce the problem of restrictive workpractices.1
The main change to the institutional structure of wage fixing was the introduction ofthe Industrial Relations Act (1988), which was designed to provide a more effectivelegislative framework for award restructuring, workplace reform, and settlement ofindustrial disputes. The Industrial Relations Act is seen as having formally laid thefoundations for more decentralised wage setting.
Proceedings of the 1990-91 National Wage Case revealed a broad consensus amongemployers and unions on the need to facilitate efficiency at the enterprise level.There was, however, strong reluctance to accept this policy direction on the part ofthe Industrial Relations Commission (the federal quasi-judicial body whicharbitrates national wage increases). After initially rejecting the change in policy, theCommission formally accepted enterprise bargaining and, since October 1991,enterprise bargaining has been in place officially. In practice, the wage bargainingsystem has not changed profoundly. While the proportion of wage and salaryearners covered by enterprise agreements has increased to about one fifth of totalearners during the first half of 1994 from about one tenth during the same period ayear earlier, a large proportion of the enterprise agreements were determined at theindustry level (for example negotiations took place at the Commonwealthgovernment and the metal trades industry levels). This has raised questions aboutthe actual extent of the change in the wage bargaining system.
As it now exists, the Australian wage bargaining system is a hybrid of centralisedand decentralised systems. While the opportunity for enterprise bargaining exists,the centralised wage setting infrastructure remains in place.
1 These included policies to help encourage skill-related career paths, eliminate impediments to
multi-skilling and broaden the range of tasks that a worker might be required to perform.
5
3. LITERATURE SURVEY
Much work has been done to evaluate the impact of labour market institutions oneconomic performance across countries. In a seminal work by Bruno and Sachs(1984) an index of the degree of centralisation of wage bargaining or ‘corporatism’was constructed which produced a ranking of various countries.2 Bruno and Sachsfound that more corporatist countries (essentially the small non-EC countries ofEurope such as Austria and Sweden) performed better in response to the first oilshock. In particular, it was concluded that in countries with near-universal unioncoverage and highly centralised negotiations, wages were kept closer to market-clearing levels than in more decentralised systems. This conclusion generatedcontroversy and stimulated research by others in the area.
Calmfors and Driffill (1988) defined centralisation as the extent of inter-union andinter-employer cooperation in wage bargaining with the other side. They examinedvarious measures of economic performance and concluded that economicperformance was better in those countries which had either low or high levels ofcentralisation. Countries with moderate degrees of centralisation fared the worst interms of performance. The reasoning behind this conclusion was that large tradeunions inherently recognise their market power and take into account the effectwage increases have on inflation and unemployment. Conversely, unions operatingat the individual firm or plant level have limited market power and competitiveforces are seen to restrain wages. In intermediate cases where unions exert somemarket power but ignore the macroeconomic implications of their actions, relativelypoor macroeconomic outcomes are observed. The result was a hump-shapedrelationship which was related to work done by Olson (1982). Olson's idea was thatorganised interests may be most harmful when they are strong enough to causemajor disruptions but not sufficiently encompassing to bear a significant fraction ofthe costs to society of their actions taken in their own interest.
Soskice (1990) challenged the conclusions of Calmfors and Driffill on the basis thatkey countries were wrongly classified. Using an alternative measure ofcentralisation -- the effective degree of coordination -- the Calmfors and Driffill
2 Following work by Crouch (1985), Bruno and Sachs constructed an index based on the degree
of union centralisation, the extent of shop-floor union power, employer coordination, and thepresence of works councils (associations which represent non-unionised labourers in aunionised shop).
6
result collapsed in a sample of the countries selected. Soskice’s approach measuredthe level at which coordination actually occurred as opposed to the formal locationof bargaining. Soskice assigned numerical values to the degrees of economy-widecoordination and the strength of unions at a local (plant) level. Unemployment rateswere regressed on these two variables. Soskice concluded that wage bargainingsystems with a high degree of coordination are superior to more decentralisedsystems.
Freeman (1988) did not attempt to construct an index of corporatism given theinherent subjectivity of such an exercise. Instead, he used an index which includeddispersion of industry earnings and union density,3 arguing that high wagedispersion reflects decentralisation. Using this method, he found that both high andlow wage dispersion were associated with stronger growth of employment relativeto middle ranking levels of dispersion.
A similar pattern was found by Dowrick (1993) using total factor productivity as ameasure of performance. An examination of OECD data from 18 different countriesover the period 1960 through 1990 revealed a weak inverted hump-shapedrelationship between the degree of centralisation and total factor productivity. Thatis, fully decentralised and fully centralised wage setting systems performed better interms of productivity growth than partially centralised systems. The relationship,however, was found to be asymmetric, with the performance of fully decentralisedsystems somewhat better than fully centralised systems.
The major focus of these papers is on macroeconomic performance and thesensitivity of the wage bargaining system thereon. In a 1986 OECD study onflexibility in the labour market, an analysis of microeconomic aspects was presentedwith reference to different wage setting institutions. Using sectoral data from sixOECD countries which encompassed a reasonably wide variety of institutionalarrangements concerning labour, a simple model was tested to assess the sensitivityof changes of nominal wages to changes in nominal productivity. A statisticallysignificant relationship was found between the two variables in the United States,Japan and Sweden. As the authors expected, Swedish wages were less responsivethan those of the US and Japan to changes in productivity. The elasticity of sectoralwage changes with respect to sectoral value productivity changes was found to be
3 Union density was defined to be the proportion of the workforce belonging to unions.
7
0.26 in the United States over the period 1958 to 1980, 0.21 in Japan over theperiod 1970 to 1979 and in Sweden (over the period 1964 to 1983) the elasticitywas estimated to be 0.03. The OECD concluded that there was a relationshipbetween changes in wages and productivity in countries with very differentcollective bargaining arrangements, with elasticities appearing to be higher incountries with more decentralised wage-setting mechanisms and collectivebargaining. The consistency of this conclusion is contingent on the interpretationthat Japan has a decentralised system.
A recent paper by Calmfors (1993) surveyed the theoretical arguments relatingcentralisation of wage bargaining systems to macroeconomic performance in abroader manner than his earlier work. The theoretical impact of centralisation onthe average wage level, on relative wages, on hiring and investment decisions offirms and on employee effort were among the issues considered. Calmforsconcluded that, on the basis of purely theoretical arguments, the diversity of theimpact of the various factors renders it difficult to arrive at unambiguous policyconclusions concerning the degree of centralisation of wage bargaining systems.This policy conclusion is consistent with earlier empirical work carried out byWithers, Pitman and Whittingham (1986) who argued that there is not necessarily arelationship between the wage determination system and the degree to which changein relative wages reflect change in labour market conditions.
4. THE COSTS OF RELATIVE WAGE RIGIDITY
Although the cost of relative wage rigidity has been asserted many times in theAustralian literature, there has been surprisingly little attempt to demonstrate thiscost theoretically (or empirically).4 In this section we present a simplediagrammatic analysis which illustrates the costs of relative wage rigidity. There areboth welfare costs and losses in aggregate employment as well as a transfer ofsurplus from workers to firms.
4 Keating (1983) addressed this issue using Australian data over the period 1948/49 through
1979/80. Using a simple supply and demand model he concluded that notwithstandingAustralia's highly centralised system of wage determination, wages have been permitted tomove "in generally the right direction" over the period.
8
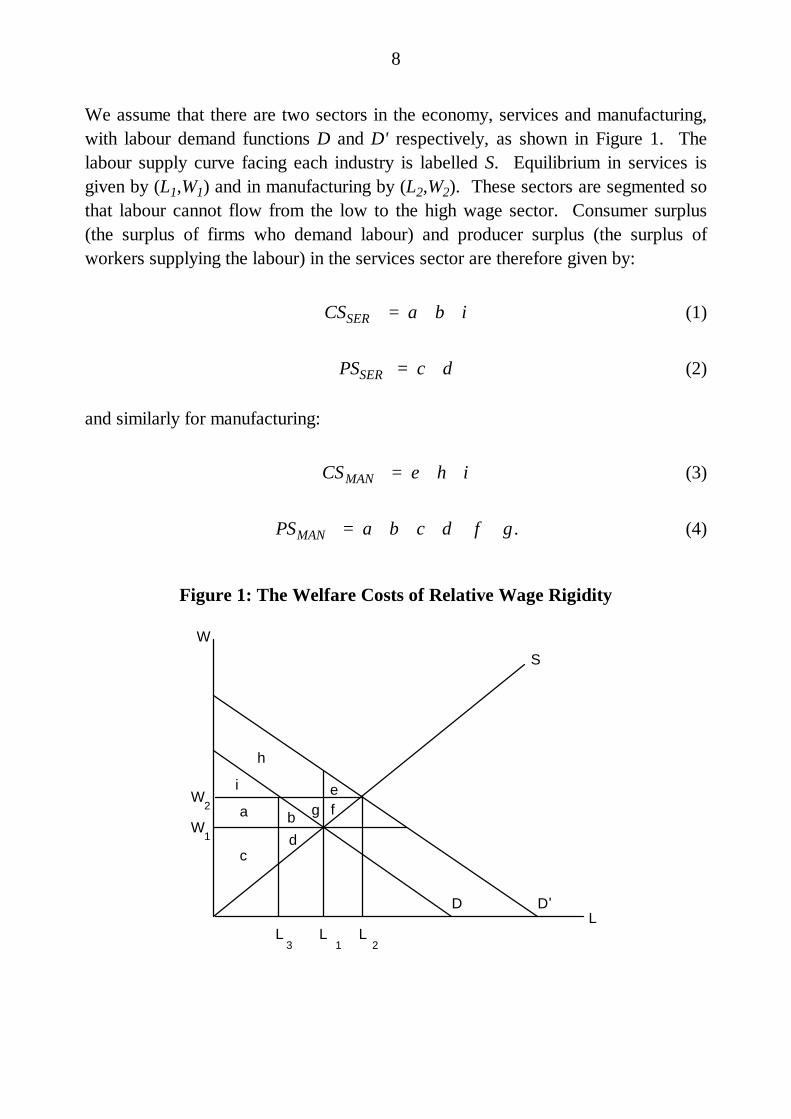
We assume that there are two sectors in the economy, services and manufacturing,with labour demand functions D and D' respectively, as shown in Figure 1. Thelabour supply curve facing each industry is labelled S. Equilibrium in services isgiven by (L1,W1) and in manufacturing by (L2,W2). These sectors are segmented sothat labour cannot flow from the low to the high wage sector. Consumer surplus(the surplus of firms who demand labour) and producer surplus (the surplus ofworkers supplying the labour) in the services sector are therefore given by:
CS a b iSER = + + (1)
PS c dSER = + (2)
and similarly for manufacturing:
CS e h iMAN = + + (3)
PS a b c d f gMAN = + + + + + . (4)
Figure 1: The Welfare Costs of Relative Wage Rigidity
WS
W
L
W2
1
L L L3 21
a b
cd
efg
h
i
D D'
9
Suppose that the services demand curve shifts out to D' and the manufacturingdemand curve shifts in to D with wages adjusting to restore equilibrium.Equilibrium in services is now given by (L2,W2) and in manufacturing by (L1,W1).By assumption, this equilibrium is established by labour supply responses within thetwo segmented labour markets, rather than between them. The change in consumersurplus in each sector is given by:
∆CS i e h i a bSER = + + − + +( ) (5)
∆CS i a b i e hMAN = + + − + +( ) (6)
while the changes in producer surplus are given by:
∆PS a b f gSER = + + + (7)
∆PS a b f gMAN = − + + +( ) . (8)
The net change in consumer surplus accruing in services is in two parts: the gain onthe marginal units of labour e, the gain on the inframarginal units h and the loss onthe inframarginal units a+b. Whether this net change is positive or negative dependson the slopes of the curves and the size of the shift in the demand curve.
The net gain in producer surplus in services can also be broken into two parts: thegain to the inframarginal units a+b+g and the gain to the newly employed marginalunits f. This net gain is unambiguously positive.
The overall gain (sum of ∆CS and ∆PS) in services is also unambiguously positive,and is given by the area e+f+g+h. Additionally, there is a redistribution of welfarefrom firms to workers of a+b.
The gains and losses in the manufacturing sector are the mirror image of those inservices, so that the net welfare gain to the economy is zero. There is however atransfer of welfare from the contracting sector (manufacturing) to the expandingsector (services) of e+f+g+h.
Suppose now that, in the face of these demand shifts, the wage in each sector doesnot change i.e. the wage is fixed at W1 in services and at W2 in manufacturing.
10
Assume that labour employed is the minimum of demand and supply at theprevailing wage (the usual assumption in disequilibrium models).
The wage and employment levels in services are given by (W1,L1), i.e. the pre-demand shift equilibrium, with
CS a b g h iSER = + + + + (9)
PS c dSER = + . (10)
Relative to the post-demand shift, flexible wage equilibrium analysed above:
∆CS a b g h i e h i a b g eSER = + + + + − + + = + + −( ) (11)
∆PS c d a b c d f g a b f gSER = + − + + + + + = − + + +( ) ( ) (12)
The effects of the rigidity on the welfare of firms in services is ambiguous. On theone hand, they gain a+b+g by not having to pay a higher wage to the inframarginallabour units. On the other hand, they lose the surplus on the marginal units theywould have gained had the wage been allowed to rise, and these units beenemployed. This amount is given by the area e.
The effects of this rigidity on the welfare of workers in services is unambiguouslynegative. The inframarginal units lose a+b+g, the extra wage payments they wouldhave received if the wage had been allowed to rise, while the marginal units oflabour which are now not employed lose an amount given by f.
Welfare in the services sector as a whole is down by an amount equal to e+f, andthere is a transfer from workers to firms equal to a+b+g. Employees are worse offcompared to the flexible wage equilibrium because there are fewer of them (L1rather than L2), and they are paid less (W1 rather than W2).
11
In the manufacturing sector the wage and employment levels are given by (W2, L3),with
CS iMAN = (13)
PS a cMAN = + . (14)
Relative to the flexible wage equilibrium analysed above:
∆CS i a b i a bMAN = − + + = − +( ) ( ) (15)
∆PS a c c d a dMAN = + − + = −( ) (16)
The firms lose an amount a from having to pay their inframarginal units more than ifthe wage were allowed to fall, and an amount b, the surplus from the marginal unitsthey would employ in a flexible labour market, but now do not. Employees gain theamount a (the inframarginal workers do not now take a pay cut), but lose theamount d, the surplus to the workers who would be employed if the wage wereallowed to fall.
Welfare in the manufacturing sector as a whole is down by b+d, and there is atransfer from firms to workers equal to a.
For the whole economy the rigidity of each wage leads to:5
• an efficiency loss of (b+d+e+f);
• a loss of employment of (L2-L3); and
• a transfer of (b+g) from employees to firms.
5 We have no way of knowing whether these static losses are large in practice. It is possible
that, were they to be estimated, the amounts would be surprisingly small, just as the staticwelfare losses from restrictions on international trade are also usually estimated to be small(Deardorff and Stern, 1986). However, if these distortions have dynamic effects i.e. affect thegrowth rate of national income and not just its level, then the cost of relative wage rigidity willprobably be quite large, as has recently been found for the dynamic effects of trade restrictions.
12
5. A MODEL OF WAGE FLEXIBILITY
Our analysis in this section is based on a model with n countries each with m sectorscontaining a large number of identical firms. Output in each sector can beinterpreted as being generated by a constant returns to scale, constant elasticity ofsubstitution (CES) production function:
Y a L a Kij ij ij ij ij ijij ij ij= + − − ∞ ≤ ≤( ( ) ) ,/ρ ρ ρ ρ1 11 (17)
where i=1...m refers to a sector in country j=1...n, εij=1/(1-ρij) is the elasticity ofsubstitution, and where the supplies of labour and capital in each sector are assumedto be fixed. As is well known, this production function encompasses the specialcase of ρij=0, implying εij=1, i.e. the Cobb-Douglas production function, with thelabour share of output equal to aij, which is independent of the amount of labour andcapital employed in production. A Cobb-Douglas production function may be auseful approximation for the economy in aggregate. Carmichael and Dews (1987)found this to be the case for Australia. For individual sectors, however, this may notbe the case. The CES function may be a more appropriate choice usingdisaggregated data given its more generalised formulation.
Firms are assumed to maximise profits subject to the production function, leading tothe first order condition that the real wage is equal to the marginal product of labour:
WP
YL
a L a K a Lij
ij
ij
ijij ij ij ij ij ij
ij ij ij ij= = + − − −∂∂
ρ ρ ρ ρ( ( ) ) /1 1 1 1 (18)
and thus the labour share of output in sector i, country j is given by
W LP Y
aL
a L a Kij ij
ij ijij
ij
ij ij ij ij
ij
ij ij=
+ −
ρ
ρ ρ( ).
1(19)
Taking logs and rearranging:
w p p p y l aij j ij j ij ij ij ij− = − + − − +( ) ( )( ) ln1 ρ (20)
13
where variables in lower case are in logarithms, and where p j is the price level incountry j (e.g. the consumer price index).
Equation (20) is an equilibrium relationship between real wages, relative prices andlabour productivity which has an interesting implication for the conduct of enterprisebargaining negotiations. It appears to be the case that, under current enterprisebargaining arrangements, the sine qua non of any real wage increases isdemonstrated productivity improvements of equal size. Yet, from equation (20), itimmediately follows that the percentage change to the profit-maximising competitivewage in a particular sector (or firm) is not in general equal to the percentage changein average labour productivity. Only in the special case of Cobb-Douglasproduction (ρij=0) and no relative price changes (i.e. p pij j− constant over time)will this be so.6
More generally, even with unchanged relative prices, the warranted change in thereal wage (in the sense of being consistent with a competitive market outcome) willexceed the change in productivity when the elasticity of substitution between labourand capital is small, with the converse true when this elasticity is large. Thus, apolicy which seeks to impose real wage increases equal to increases in averagelabour productivity levels throughout the economy is not generally consistent withan efficient and competitive labour market, and may lead to distorted patterns ofwages and employment, which is exactly the problem that enterprise bargaining issupposed to avoid.7
This policy issue aside, one way that we could uncover the degree of wageflexibility in each country would be to regress the real wage w pij j− on the relativeprice variable p pij j− and the average level of labour productivity and test whetherthe coefficient on the former is one and on the latter is 1-ρij. However, this isimpractical as we do not know the true value of the ρij's, and cannot estimate themin the absence of reliable data on sectoral capital stocks.
As an alternative, we construct sectoral wage, productivity and relative pricevariables for each country and conduct correlation and simple regression analysis to 6 We assume that the share parameter, ln aij , does not change over time.7 This was pointed out many years ago by John Pitchford (1972) in a prescient analysis of
Australian wages policy.
14
analyse the relationship among these variables. The variables are defined to be therelative deviations from their respective cross-sectoral means. The results from thecorrelation and regression analysis are compared across countries to determinewhich countries have the most responsive wage setting system.
In this model, the supplies of capital and labour are fixed in each sector. If weallow for factor mobility, the flexibility concept changes. In an economy withhomogeneous workers and perfect labour mobility, workers would immediatelymove from one sector to another in response to wage differentials such that wageand productivity levels should, in effect, be equalised instantaneously across sectors.Wages would not appear to be responsive to productivity and prices, and thedispersion of wages across sectors would be zero. Alternatively, consider the caseof some small degree of heterogeneous labour or costly mobility across sectors.Although wage and productivity deviations may be small compared to the fixedfactor case, we would expect the relationship between wages and productivity tostill be as strong if the market is sending the appropriate signals or is flexible. Forexample, in the case of a low (high) degree of mobility of labour, there would be alarge (small) deviation of wages from mean and, correspondingly, one would expectthe deviation of productivity from the mean to be large (small) as well. Providedfactor mobility is not perfect, the relationship between wage and productivitydeviations as measured by the correlation and regression coefficients should beunaffected by the degree of labour mobility. This follows from the fact that bothcoefficients are independent of scale.
6. EMPIRICAL ANALYSIS
This section presents two measures of relative wage flexibility and drawsconclusions from a cross-country comparison of these measures. Comparisons aredrawn between wage dispersion and the degree of centralisation of a country's wagesetting institution as defined in the existing literature in order to determine ifdecentralisation necessarily implies labour market flexibility. We analyse therelationships among sectoral wages, productivity, prices and growth usingcorrelation and simple regression computations and examine the link between wagesand employment. The section is concluded with an analysis of wage dispersion andseveral macroeconomic performance indicators.

15
6.1 Measuring Flexibility
We have chosen two summary statistics to be our quantitative measures of labourmarket flexibility. The statistics chosen enable comparison across countries andcurrencies; that is, scale effects have been removed. They are the variance of thelogs of wages and the coefficient of variation of wages (the ratio of the standarderror to the sample mean). Data are taken from the OECD National Accountsdatabase, with the choice of countries determined by the availability of sectoraldata.
Wages are calculated as the ratio of compensation of employees to the number ofemployees in each sector. Both data sets reflect full and part-time workers.Compensation of employees data is a national accounting concept which includes allpayments made to labour. In the case of Australia, for example, both award andover-award payments are included in this wage measure.
Dispersion measures are constructed for both nominal wages and real productwages (the ratio of nominal wages to sectoral product deflators) and are presentedin Appendix 1. There are no substantive differences among the series for thepurposes of our analysis. For simplicity we focus on only one measure - thecoefficient of variation of nominal wages.
The OECD data are broken down into ten main industrial sectors, and are on anannual basis. In some countries, certain sector data are amalgamated to achieveconsistency across wages, employment and output measures. While highlydisaggregated data would be desirable in this type of analysis, none is available onan internationally comparable basis, and our data at least capture inter-industrywage dispersion among the major sectors. See Appendix 2 for details. Certainsectors are more important (larger) than others in individual countries, and shouldtherefore have greater influence on wage dispersion measures. In our measures,each sector is weighted by its share of total employment in that country. Theseweights (αij) are fixed over the sample period, and are the average employmentshare over that period.8 Each sector's wage (Wijt) - is weighted and then summed toconstruct a weighted mean (WMjt) for each country in each time period (year):
8 Due to the limited availability of data for each country, the measures are constructed over
different sample periods in many cases (see Appendix 2).

16
WM Wjt iji
m
ijt==∑ α
1(21)
where i=1...m again refers to the industrial sector (m equals 10 in most cases) incountry j=1...n. Squared deviations from this mean are then weighted beforesumming to form the weighted variance (WVjt):
WV W WMjt iji
m
ijt jt= −=∑ α
1
2( ) (22)
The coefficient of variation measure (CVjt) of wage dispersion is then:
CV WV WMjt jt jt= (23)
The variance of the logs measure of wage dispersion is simply WVjt from equation22 where Wijt has been replaced by the log of Wijt (wijt) in equations 21 and 22.The removal of scale effects by dividing the standard deviation of wages by themean level of wages can influence measured dispersion when large changes in theaggregate level of mean wages occur. For example if aggregate mean wagesincrease sharply in the absence of large increases in the deviations of industry wagesfrom the mean, the coefficient of variation will fall sharply.
While each measure has been used previously in the literature on wage dispersion,neither is ideal in theory. Wage structures may change while wage dispersion, asmeasured by either statistic, remains fixed if, for example, high and low-wagesectors switch position. In practice this is not believed to be a problem. Forexample, Freeman (1988) found rank order to persist among sectoral wagerelativities.
Another, more profound problem with the measures is that increases in wagedifferentials can occur independently of labour market flexibility. Withoutinformation on the underlying sector-specific demand and supply elasticities, themagnitude of changes in wage differentials expected of a flexible relative wagestructure is difficult to predict. In other words, the optimal degree of wagedispersion depends on the dispersion of fundamentals, some of which are
17
unobserved. The degree of labour mobility may be one of these fundamentals.High (low) labour mobility may be associated with low (high) wage dispersion.However, by using the same sectors for the calculation of dispersion acrosscountries the international comparability of the measures are enhanced. The factthat the results are drawn from calculations using data from industrialised countriesover a similar time period implies that differences in labour mobility may be small.Nevertheless industrial structure and labour mobility will differ to some extent fromone country to another and this will influence our results.
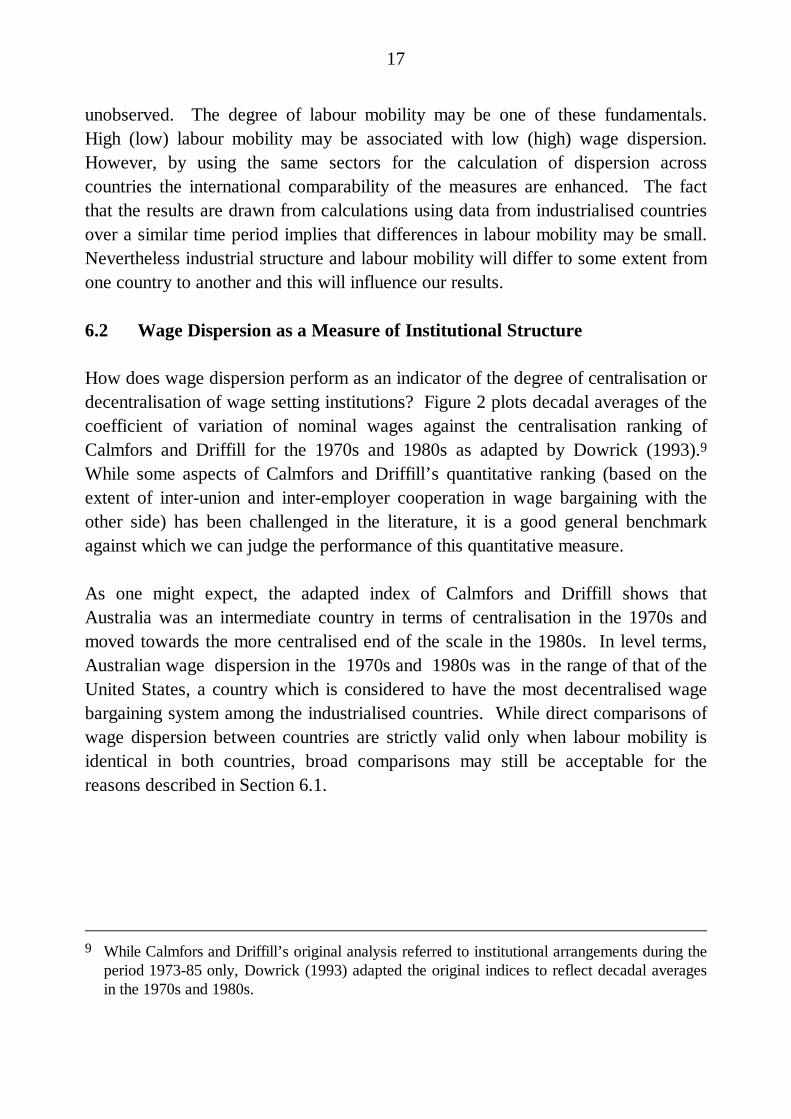
6.2 Wage Dispersion as a Measure of Institutional Structure
How does wage dispersion perform as an indicator of the degree of centralisation ordecentralisation of wage setting institutions? Figure 2 plots decadal averages of thecoefficient of variation of nominal wages against the centralisation ranking ofCalmfors and Driffill for the 1970s and 1980s as adapted by Dowrick (1993).9While some aspects of Calmfors and Driffill’s quantitative ranking (based on theextent of inter-union and inter-employer cooperation in wage bargaining with theother side) has been challenged in the literature, it is a good general benchmarkagainst which we can judge the performance of this quantitative measure.
As one might expect, the adapted index of Calmfors and Driffill shows thatAustralia was an intermediate country in terms of centralisation in the 1970s andmoved towards the more centralised end of the scale in the 1980s. In level terms,Australian wage dispersion in the 1970s and 1980s was in the range of that of theUnited States, a country which is considered to have the most decentralised wagebargaining system among the industrialised countries. While direct comparisons ofwage dispersion between countries are strictly valid only when labour mobility isidentical in both countries, broad comparisons may still be acceptable for thereasons described in Section 6.1.
9 While Calmfors and Driffill’s original analysis referred to institutional arrangements during the
period 1973-85 only, Dowrick (1993) adapted the original indices to reflect decadal averagesin the 1970s and 1980s.
18
Figure 2: Calmfors and Driffill Index of Centralisation and the Coefficient ofVariation of Nominal Wages
1970s
Coefficient of Variation of Nominal Wages
Inde
x of
Cen
tralis
atio
n
1.5
2.5
3.5
4.5
5 10 15 20 25 301.5
2.5
3.5
4.5
US
JapanItalyUK
AustraliaGermany
Denmark
Belgium
Finland Norwayindex index
RHO = -0.49
1980s
Coefficient of Variation of Nominal Wages
Inde
x of
Cen
tralis
atio
n
1.5
2.5
3.5
4.5
5 10 15 20 25 301.5
2.5
3.5
4.5
US
JapanItaly
UK
Australia
GermanyDenmark
Belgium
Finland
Norway
France
Sweden
RHO = -0.47
index index
In overall terms, there is a negative relationship between the measure of wagedispersion and the Calmfors Driffill index of centralisation. The correlation
19
coefficients between the two series for the 1970s and 1980s are -0.49 and -0.47respectively. On the one hand, countries with relatively high levels of wagedispersion such as the US, Japan, and Australia in the 1980s cover the entirespectrum of decentralised to centralised institutions.10 On the other hand, there is agrouping of countries with low wage dispersion around the centralised end of theinstitutional scale. We conclude that low wage dispersion can be associated withcentralised wage setting institutions, but is not necessarily so. Australia recorded arelatively high degree of wage dispersion in the 1980s despite having a centralisedwage setting system.
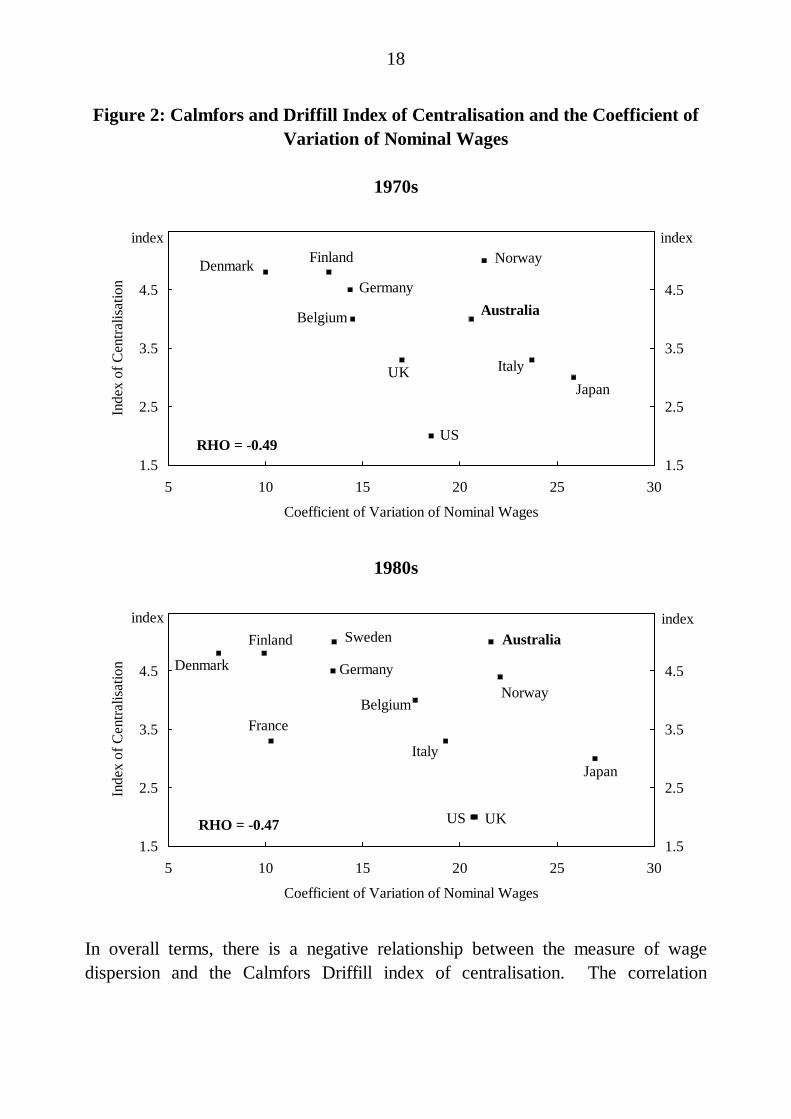
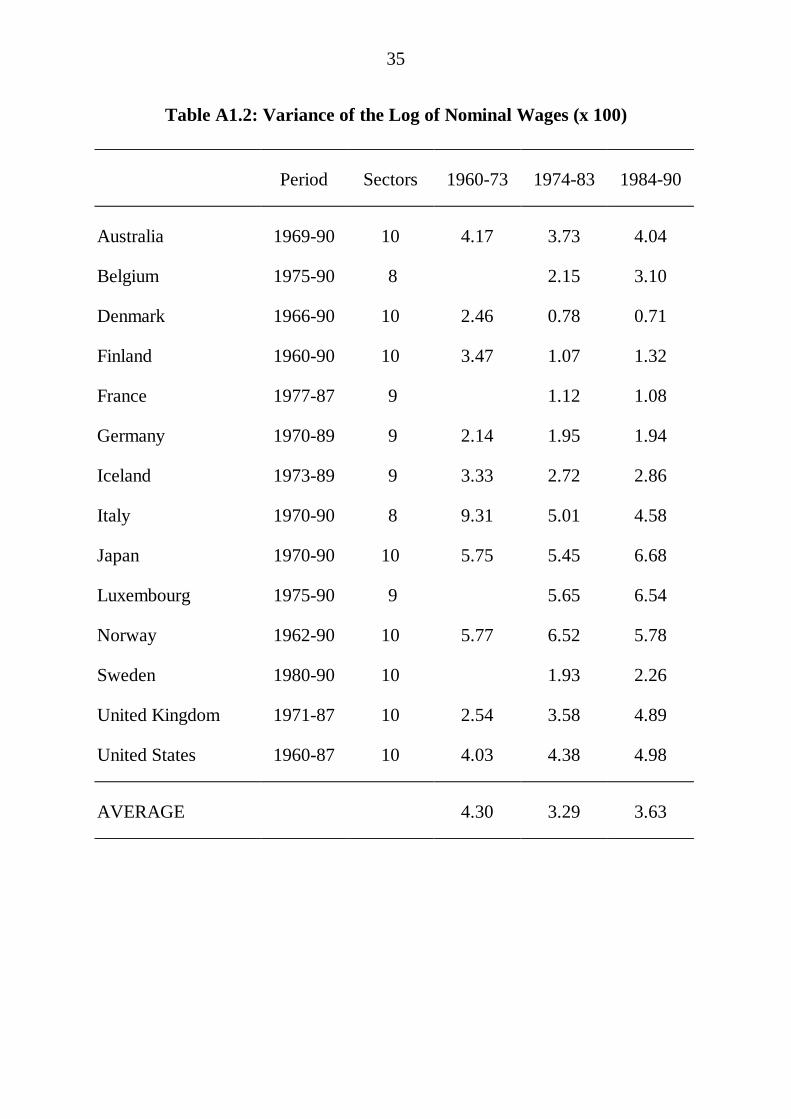
Decadal averages of wage dispersion mask some important changes in the profile ofthe measure, particularly in the case of Australia. Figure 3 illustrates the path ofwage dispersion for Australia and other OECD countries over the periods for whichdata are available.11
Australian wage dispersion has varied widely over the period 1969 to 1990. Thereare three distinct periods characterised by different institutional developments. Thefirst phase covers the end of the 1960s and first half of the 1970s and wascharacterised by sharp changes in wage dispersion and the erosion of the importanceof the National Wage Case System. Between 1969/70 and 1974/75, thecontribution of average male minimum wage increases specified under the nationalwage case system fell from 52.6 to 21.2 per cent (Hancock Report, 1985).
10 As noted above, there has been a debate in the literature about where Japan should appear on
the centralisation scale, with Soskice (1990) arguing that Calmfors and Driffill incorrectlyidentified Japan as a decentralised system when in fact a high degree of coordination is inevidence. Dowrick constructed an alternative index to reflect Sockice's critique. UnderDowrick's alternative measure, Japan would be ranked as a country with highly centralisedwage setting system (the index of centralisation on the vertical axis in Figure 2 would be 6instead of 3). This would still support our conclusion that highly coordinated wage settinginstitutions do not necessarily have low wage dispersion.
11 While the measure of dispersion in Figure 3 is the coefficient of variation of nominal wages,equivalent figures using the variance of the logs of nominal and real product wages and thecoefficient of variation of real product wages can be found in Appendix 1. While the realproduct wage versions have higher variances, the overall pattern of wage dispersion is similar.We have chosen to discuss the nominal wage version in the main body of our text given it has alonger series available for Australia. (In addition, UK data are available only in the nominalseries.)
20
Figure 3: Coefficient of Variation of Nominal Wages
10
15
20
25
1960 1965 1970 1975 1980 1985 199010
15
20
25
Australia
Japan
US
Germany
UK
x 100 x 100
5
10
15
20
1960 1965 1970 1975 1980 1985 19905
10
15
20
AustraliaFinland
Norway
Denmark
Sweden
x 100 x 100
.
5
10
15
20
25
1969 1972 1975 1978 1981 1984 1987 19905
10
15
20
25
x 100x 100
France
Belgium
Italy
Australia
21
Consent agreements and over-award bargaining grew in importance and thearbitration system started to break down. Attempts were made by the Commissionto regain control but these were unsuccessful. Wages increased in excess of theNational Wage Case decisions even though, for example, the 1970 decisionspecified a 6 per cent increase when the inflation rate was only 3.9 per cent. By theend of the first quarter of 1975 average weekly earnings were increasing at anannual rate of about 28 per cent and inflation had accelerated to 17.7 per cent.
The erosion of the arbitration system had unpredictable effects on the level of wagedispersion. Between 1969 and 1972 the measure of wage dispersion increasedsharply. This may have been a result of the breakdown of the national wage casesystem at a time when the labour market was tight. Over the period earnings in thelower wage sectors (community, social and personnel services, trade andagriculture) were increasing at a rate of about 10 per cent per annum while earningsin the higher wage sectors (financial and business services, general government,mining, construction, transport and utilities) were increasing at a rate of 15 per centper year.
Between 1973 and 1975 the mean (weighted) wage increased at a rate of 24 percent per annum. This large increase in the denominator of the coefficient ofvariation dominated the changes in the numerator (the weighted variance of wages)with the total effect being a sharp fall in the dispersion measure over the sub-period.During the sub-period wage dispersion was indeed falling (low and high wagesectors recorded 27 per cent and 20 per cent per annum increases respectively) butdispersion was not falling as rapidly as the coefficient of variation suggests. Highnominal wage inflation had the same effect on the dispersion measures for Finland,Denmark and to a lesser extent, Italy. In the other OECD countries such as the USnominal wage inflation was not as significant. Nominal wages increased by about 8per cent in the United States over the sub-period.
The second phase, between 1975 and 1983, was characterised by a mixture of fulland partial indexation12 until 1981, and a breakdown of indexation thereafter. Asteady increase in wage dispersion was recorded over the period. The indexation
12 Only some decisions by the Arbitration Commission provided full indexation; other decisions
permitted adjustment of less than consumer price increases. Wages were adjusted on aquarterly basis from March 1975 until September 1978. Between 1978 and 1981 wages wereadjusted on a six monthly basis.
22
guidelines permitted exceptional wage increases for change in work value. It alsoseems likely that the over-award and non-award sectors were able to gain from theerosion of the indexation system.
In 1980 and 1981 substantive wage increases were negotiated outside the indexationsystem and the indexation system was cancelled in July 1981. Economic conditionsdeteriorated towards the end of 198213 at which time a wages pause was introducedfor workers covered by Federal awards. The wages pause lasted from December1982 to until the introduction of the Accord in September 1983.
The start of the Accord marked the beginning of the third period. The Accord wasassociated with relatively little change in the level of dispersion until 1988 wheninstitutional adjustments permitted a slight increase in wage dispersion.
How did changes in institutional structure affect wage dispersion in other countries(as illustrated in Figure 3)? Incomes policies were in place in the UK during theearly 1970s; these may have contributed to the low level of wage dispersion.During the mid to late 1970s voluntary wage restraint programmes were adoptedwhich may account for the upward drift of wage dispersion. It was the aim of theThatcher Government, first elected in 1979, to reduce the power of the trade unions.Not surprisingly, wage dispersion drifted upwards during the Thatcher years.
The Scandinavian countries have had a history of highly coordinated wagenegotiations. There is, however, a sharp contrast in the path of wage dispersionbetween Finland and Denmark on the one hand and Norway on the other over theten year period starting in the mid 1960s. Norwegian wage dispersion remainedrelatively flat while that of Finland and Denmark fell conspicuously. The fall inwage dispersion in the latter two countries does not seem to be directly associatedwith any particular changes to their wage determination systems, but rather acombination of factors including differences in their wage indexation systems andthe degree of influence of government in the process of income determination.14 InJapan, the US, Germany, Belgium and France, no major changes were made to
13 The inflation rate exceeded eleven per cent and in November 1982, unemployment approached
nine per cent.14 See Braun (1986) for a fuller exposition of the background factors.
23
wage setting institutions over the periods for which data are available. There arenevertheless some changes in wage dispersion recorded in these countries.
We can conclude that wage dispersion appears to be affected by the type of wagesetting institution but not in any strong systematic manner. Centralised wage settingsystems may deliver flat or decreased wage dispersion and decentralised systemsmay induce increased dispersion. However, other variables which affect wagedispersion, including labour mobility, industrial structure and labour market policies(such as minimum wage legislation) may also play an important role, implying thatcountries which introduce policies to decentralise wage setting may not necessarilyexperience an increase in labour market flexibility.
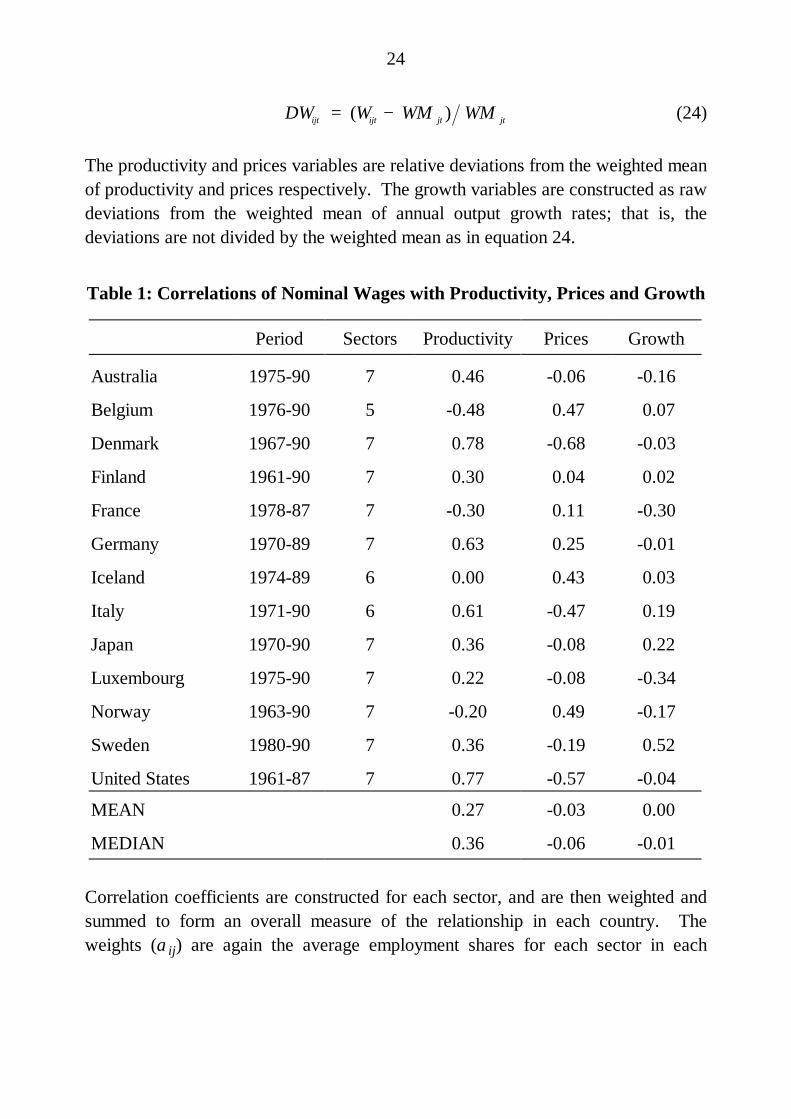
6.3 The Relationships Among Wages, Productivity, Prices and Growth
A flexible labour market should be characterised by wage rates which adjust toconditions within the market. The model presented in Section 5 suggests that thereal wage in any particular sector should reflect the sectoral productivity level andthe relative price of that sector's output. In this section these relationships areanalysed along with one further proposition; that sectoral wages should reflect therelative rate of growth of a sector. The idea is that above average wages arerequired to attract new workers to faster growing sectors.
We begin by calculating some simple correlation coefficients of nominal wages withproductivity, prices and growth individually for each sector15 in each country.While we know that high labour mobility may be associated with low wagedispersion and small deviations of productivity from its mean, the strength of thecorrelation coefficient between these variables will not be affected for the reasonswhich we describe in Section 5.
For this correlation analysis, wages, productivity and prices variables areconstructed as relative deviations from the weighted mean for each sector. Thewages variables (DWijt), for example, are constructed as follows:
15 Three of the sectors used in the last section were removed before conducting the correlation
analysis. These sectors are general government; community, social and personnel services; andfinance, insurance, real estate and business services. The real output data for these sectors areconstructed on an assumption of no labour productivity growth, and are therefore unsuitablefor this analysis.
24
DW W WM WMijt ijt jt jt= −( ) (24)
The productivity and prices variables are relative deviations from the weighted meanof productivity and prices respectively. The growth variables are constructed as rawdeviations from the weighted mean of annual output growth rates; that is, thedeviations are not divided by the weighted mean as in equation 24.
Table 1: Correlations of Nominal Wages with Productivity, Prices and Growth
Period Sectors Productivity Prices Growth
Australia 1975-90 7 0.46 -0.06 -0.16
Belgium 1976-90 5 -0.48 0.47 0.07
Denmark 1967-90 7 0.78 -0.68 -0.03
Finland 1961-90 7 0.30 0.04 0.02
France 1978-87 7 -0.30 0.11 -0.30
Germany 1970-89 7 0.63 0.25 -0.01
Iceland 1974-89 6 0.00 0.43 0.03
Italy 1971-90 6 0.61 -0.47 0.19
Japan 1970-90 7 0.36 -0.08 0.22
Luxembourg 1975-90 7 0.22 -0.08 -0.34
Norway 1963-90 7 -0.20 0.49 -0.17
Sweden 1980-90 7 0.36 -0.19 0.52
United States 1961-87 7 0.77 -0.57 -0.04
MEAN 0.27 -0.03 0.00
MEDIAN 0.36 -0.06 -0.01
Correlation coefficients are constructed for each sector, and are then weighted andsummed to form an overall measure of the relationship in each country. Theweights (αij) are again the average employment shares for each sector in each
25
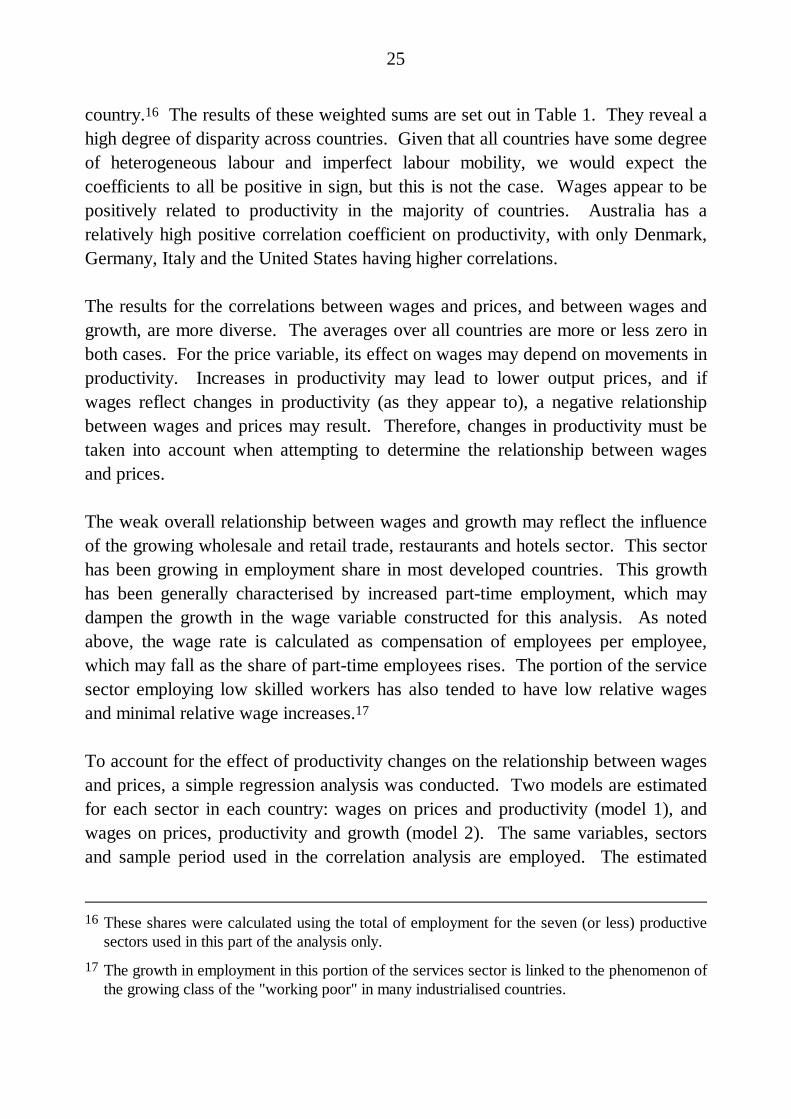
country.16 The results of these weighted sums are set out in Table 1. They reveal ahigh degree of disparity across countries. Given that all countries have some degreeof heterogeneous labour and imperfect labour mobility, we would expect thecoefficients to all be positive in sign, but this is not the case. Wages appear to bepositively related to productivity in the majority of countries. Australia has arelatively high positive correlation coefficient on productivity, with only Denmark,Germany, Italy and the United States having higher correlations.
The results for the correlations between wages and prices, and between wages andgrowth, are more diverse. The averages over all countries are more or less zero inboth cases. For the price variable, its effect on wages may depend on movements inproductivity. Increases in productivity may lead to lower output prices, and ifwages reflect changes in productivity (as they appear to), a negative relationshipbetween wages and prices may result. Therefore, changes in productivity must betaken into account when attempting to determine the relationship between wagesand prices.
The weak overall relationship between wages and growth may reflect the influenceof the growing wholesale and retail trade, restaurants and hotels sector. This sectorhas been growing in employment share in most developed countries. This growthhas been generally characterised by increased part-time employment, which maydampen the growth in the wage variable constructed for this analysis. As notedabove, the wage rate is calculated as compensation of employees per employee,which may fall as the share of part-time employees rises. The portion of the servicesector employing low skilled workers has also tended to have low relative wagesand minimal relative wage increases.17
To account for the effect of productivity changes on the relationship between wagesand prices, a simple regression analysis was conducted. Two models are estimatedfor each sector in each country: wages on prices and productivity (model 1), andwages on prices, productivity and growth (model 2). The same variables, sectorsand sample period used in the correlation analysis are employed. The estimated
16 These shares were calculated using the total of employment for the seven (or less) productive
sectors used in this part of the analysis only.17 The growth in employment in this portion of the services sector is linked to the phenomenon of
the growing class of the "working poor" in many industrialised countries.
26
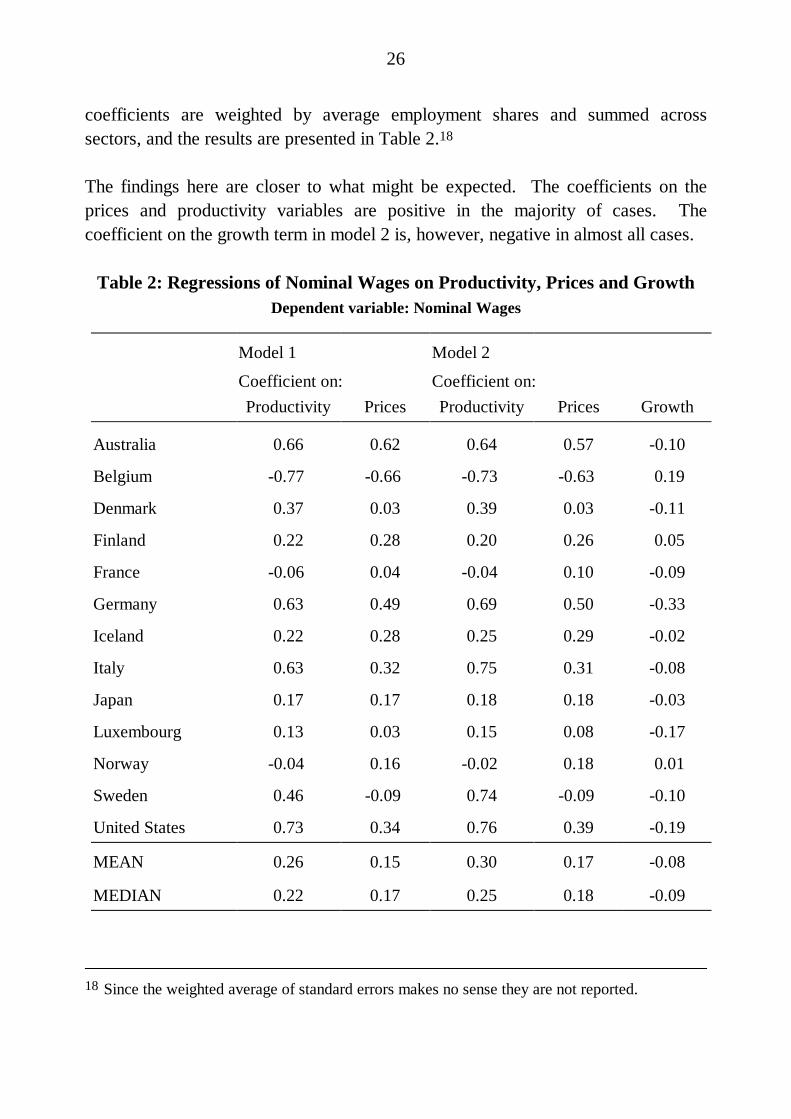
coefficients are weighted by average employment shares and summed acrosssectors, and the results are presented in Table 2.18
The findings here are closer to what might be expected. The coefficients on theprices and productivity variables are positive in the majority of cases. Thecoefficient on the growth term in model 2 is, however, negative in almost all cases.
Table 2: Regressions of Nominal Wages on Productivity, Prices and GrowthDependent variable: Nominal Wages
Model 1 Model 2
Coefficient on: Coefficient on:Productivity Prices Productivity Prices Growth
Australia 0.66 0.62 0.64 0.57 -0.10
Belgium -0.77 -0.66 -0.73 -0.63 0.19
Denmark 0.37 0.03 0.39 0.03 -0.11
Finland 0.22 0.28 0.20 0.26 0.05
France -0.06 0.04 -0.04 0.10 -0.09
Germany 0.63 0.49 0.69 0.50 -0.33
Iceland 0.22 0.28 0.25 0.29 -0.02
Italy 0.63 0.32 0.75 0.31 -0.08
Japan 0.17 0.17 0.18 0.18 -0.03
Luxembourg 0.13 0.03 0.15 0.08 -0.17
Norway -0.04 0.16 -0.02 0.18 0.01
Sweden 0.46 -0.09 0.74 -0.09 -0.10
United States 0.73 0.34 0.76 0.39 -0.19
MEAN 0.26 0.15 0.30 0.17 -0.08
MEDIAN 0.22 0.17 0.25 0.18 -0.09
18 Since the weighted average of standard errors makes no sense they are not reported.
27
This is likely a consequence of the growth of the wholesale and retail trade,restaurants and hotels sector. Alongside the United States, Australia has some ofthe highest coefficients on productivity and prices among the countries in oursample. This tends to suggest that over the period 1975 through 1990 Australianwage setting behaviour generally reflected key factors related to the demand forlabour.
In terms of the relationship between the level of wage dispersion and the strength ofthe relationship among wages, productivity and prices generally, there does notappear to be anything systematic. Moreover, the relationship does not appear to bea function of the degree of centralisation of wage setting institutions. For example,Italy and Germany both recorded high coefficients along with the US and Australia.Sweden and Denmark recorded weak relationships between wages and prices butstrong ones between wages and productivity. These countries display a widevariation in both wage dispersion and degree of centralisation. This would implythat an increase in wage dispersion and/or a move towards a less centralised systemmay not necessarily bring about a stronger response of wages to demand conditions.
6.4 The Relationship between Employment and Wages
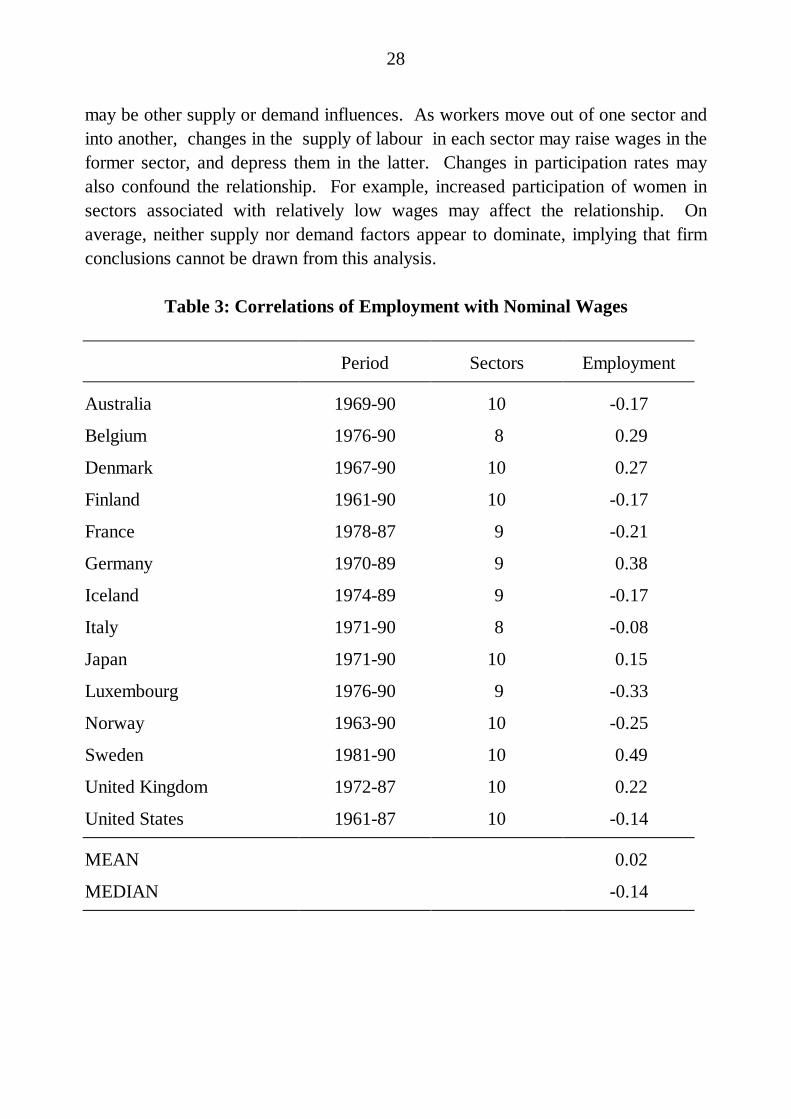
One major benefit of having a wage setting system where remuneration reflects thedemand conditions for labour is that wages can act as a signal to potentialemployees to move from one sector to another. Higher wages in the moreproductive and more profitable sectors will attract workers to those sectors wherethey are more highly valued. In this section, the relationship between deviations ofemployment and wages from their respective means is analysed. Correlationcoefficients are calculated for employment with wages for each sector19 in eachcountry. Coefficients are again weighted and summed in the manner employedabove. The results are set out in Table 3.
The average across countries suggests that there is little systematic relationshipbetween employment and wages. The correlation is negative for Australia. Apartfrom the potentially positive effect of wages on employment described above, there
19 The three sectors removed from the analysis in the previous section (namely general
government, community, social and personnel servicesand finance, insurance, real estate andbusiness services) have been included in the analysis here, as real output data are notemployed.
28
may be other supply or demand influences. As workers move out of one sector andinto another, changes in the supply of labour in each sector may raise wages in theformer sector, and depress them in the latter. Changes in participation rates mayalso confound the relationship. For example, increased participation of women insectors associated with relatively low wages may affect the relationship. Onaverage, neither supply nor demand factors appear to dominate, implying that firmconclusions cannot be drawn from this analysis.
Table 3: Correlations of Employment with Nominal Wages
Period Sectors Employment
Australia 1969-90 10 -0.17
Belgium 1976-90 8 0.29
Denmark 1967-90 10 0.27
Finland 1961-90 10 -0.17
France 1978-87 9 -0.21
Germany 1970-89 9 0.38
Iceland 1974-89 9 -0.17
Italy 1971-90 8 -0.08
Japan 1971-90 10 0.15
Luxembourg 1976-90 9 -0.33
Norway 1963-90 10 -0.25
Sweden 1981-90 10 0.49
United Kingdom 1972-87 10 0.22
United States 1961-87 10 -0.14
MEAN 0.02
MEDIAN -0.14
29
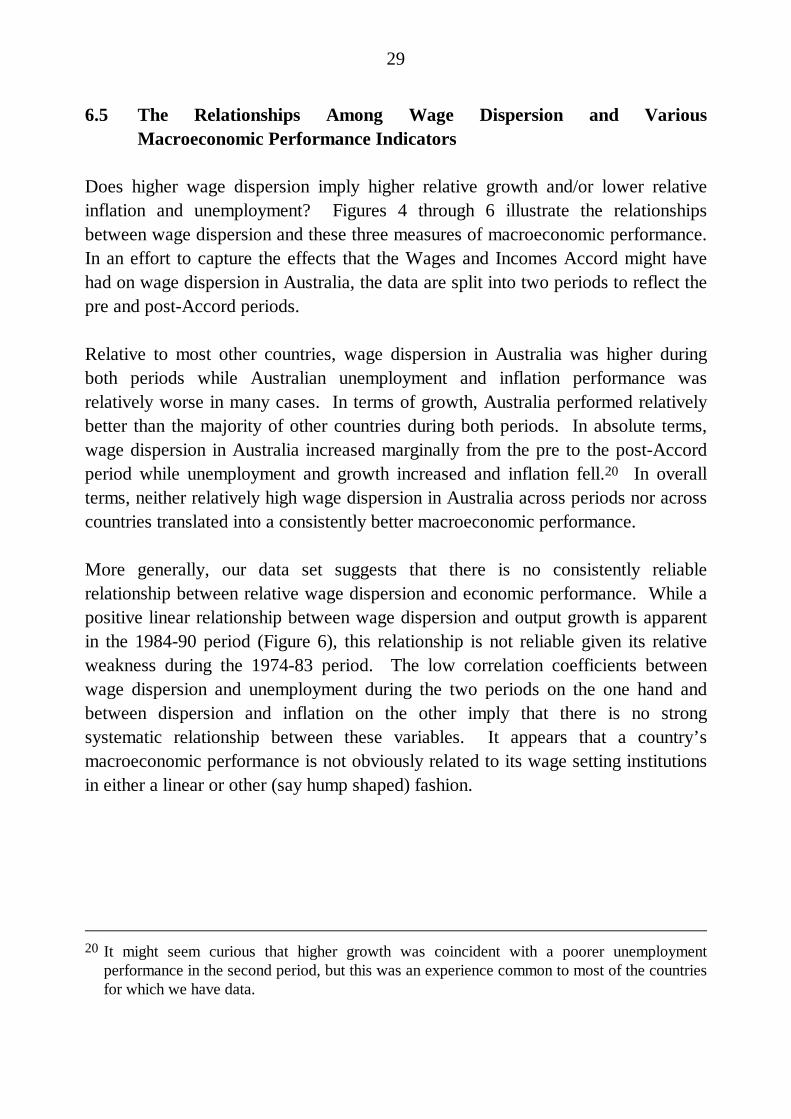
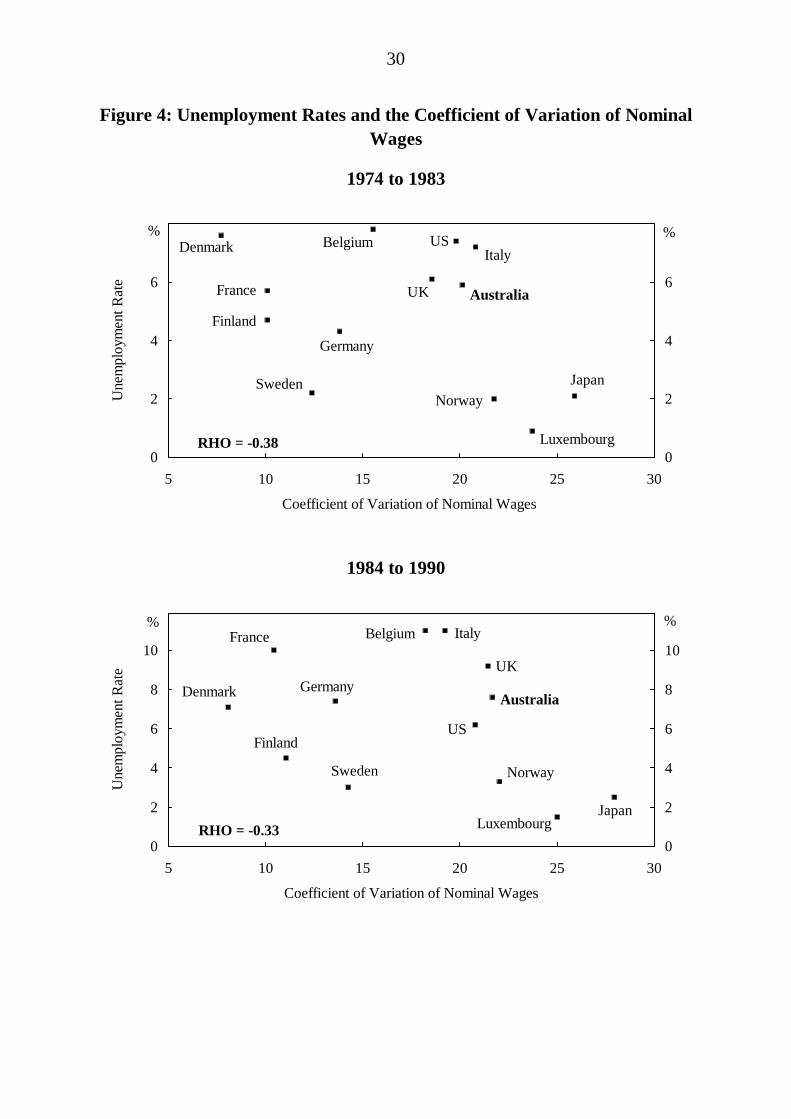
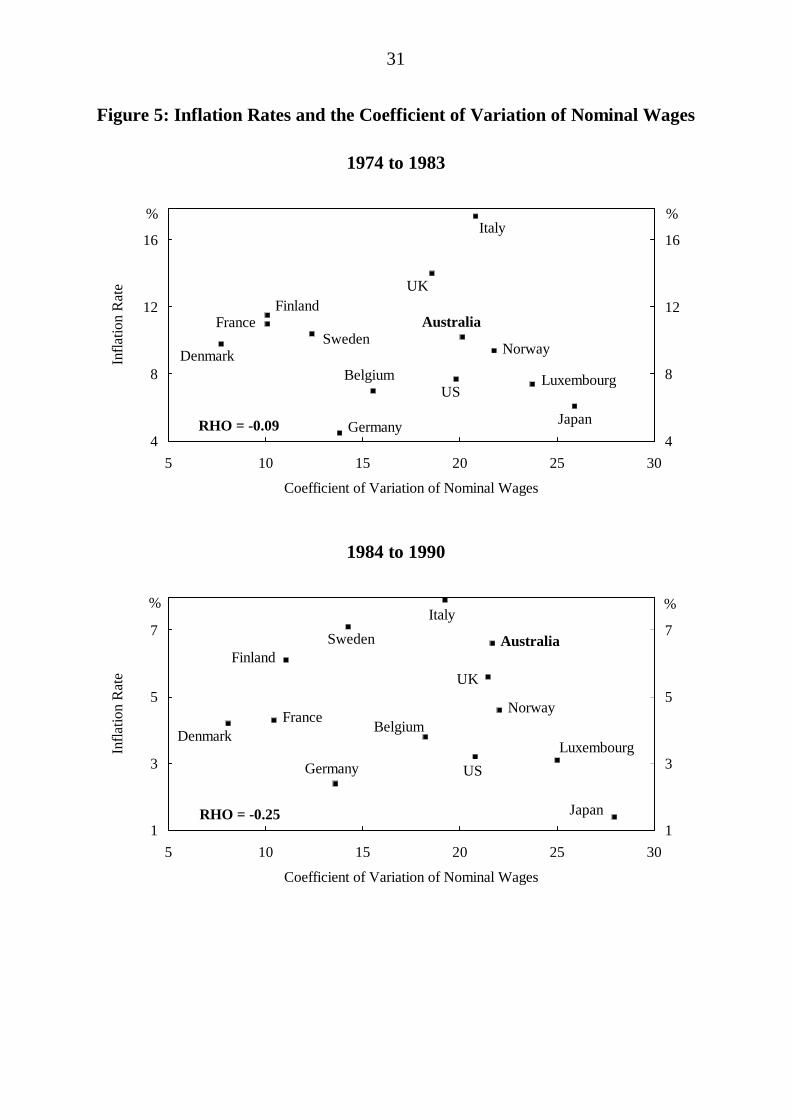
6.5 The Relationships Among Wage Dispersion and VariousMacroeconomic Performance Indicators
Does higher wage dispersion imply higher relative growth and/or lower relativeinflation and unemployment? Figures 4 through 6 illustrate the relationshipsbetween wage dispersion and these three measures of macroeconomic performance.In an effort to capture the effects that the Wages and Incomes Accord might havehad on wage dispersion in Australia, the data are split into two periods to reflect thepre and post-Accord periods.
Relative to most other countries, wage dispersion in Australia was higher duringboth periods while Australian unemployment and inflation performance wasrelatively worse in many cases. In terms of growth, Australia performed relativelybetter than the majority of other countries during both periods. In absolute terms,wage dispersion in Australia increased marginally from the pre to the post-Accordperiod while unemployment and growth increased and inflation fell.20 In overallterms, neither relatively high wage dispersion in Australia across periods nor acrosscountries translated into a consistently better macroeconomic performance.
More generally, our data set suggests that there is no consistently reliablerelationship between relative wage dispersion and economic performance. While apositive linear relationship between wage dispersion and output growth is apparentin the 1984-90 period (Figure 6), this relationship is not reliable given its relativeweakness during the 1974-83 period. The low correlation coefficients betweenwage dispersion and unemployment during the two periods on the one hand andbetween dispersion and inflation on the other imply that there is no strongsystematic relationship between these variables. It appears that a country’smacroeconomic performance is not obviously related to its wage setting institutionsin either a linear or other (say hump shaped) fashion.
20 It might seem curious that higher growth was coincident with a poorer unemployment
performance in the second period, but this was an experience common to most of the countriesfor which we have data.
30
Figure 4: Unemployment Rates and the Coefficient of Variation of NominalWages
1974 to 1983
Coefficient of Variation of Nominal Wages
Une
mpl
oym
ent R
ate
0
2
4
6
5 10 15 20 25 300
2
4
6
Luxembourg
JapanNorway
Sweden
Finland
Germany
France AustraliaUK
Denmark Belgium USItaly
% %
RHO = -0.38
1984 to 1990
Coefficient of Variation of Nominal Wages
Une
mpl
oym
ent R
ate
0
2
4
6
8
10
5 10 15 20 25 300
2
4
6
8
10
LuxembourgJapan
Sweden Norway
FinlandUS
Denmark GermanyAustralia
UK
France Belgium Italy% %
RHO = -0.33
31
Figure 5: Inflation Rates and the Coefficient of Variation of Nominal Wages
1974 to 1983
Coefficient of Variation of Nominal Wages
Infla
tion
Rat
e
4
8
12
16
5 10 15 20 25 304
8
12
16
Germany
Belgium
Japan
LuxembourgUS
NorwayDenmarkSweden
AustraliaFranceFinland
UK
Italy%
RHO = -0.09
%
1984 to 1990
Coefficient of Variation of Nominal Wages
Infla
tion
Rat
e
1
3
5
7
5 10 15 20 25 301
3
5
7
Japan
GermanyLuxembourg
US
BelgiumDenmarkFrance
Norway
UKFinland
AustraliaSweden
Italy
RHO = -0.25
%%
32
Figure 6: Real Output Growth and the Coefficient of Variation of NominalWages
1974 to 1983
Coefficient of Variation of Nominal Wages
Rea
l Out
put G
row
th
1
2
3
5 10 15 20 25 301
2
3
LuxembourgUKSweden
Denmark
Germany
US
BelgiumFrance
AustraliaFinland Italy
Japan
Norway% %
RHO = 0.33
1984 to 1990
Coefficient of Variation of Nominal Wages
Rea
l Out
put G
row
th
2
3
4
5 10 15 20 25 302
3
4
DenmarkSweden
France
Belgium Norway
Germany Italy UK
AustraliaFinland
US
Luxembourg Japan
% %RHO = 0.71
33
7. CONCLUSION
Our cross-country analysis of relative wage data suggests that the Australian labourmarket may have been relatively more flexible over the 1970s and 1980s thanpopular perception holds. Insofar as cross-country comparisons of wage flexibility(as measured by wage dispersion across ten sectors) can be made, we observe thatAustralian wage flexibility was on the scale of that in the United States - a countrywhich is considered to have a flexible labour market. Moreover, Australian wagesappear to have been relatively strongly correlated with factors influencing labourdemand, a desirable property when labour is heterogeneous. In fact, the relationshipbetween Australian sectoral wages, productivity and relative prices was among thestrongest in the OECD countries for which data were available.
International experience shows that wage dispersion may be affected by changes towage setting institutions within some countries. However, a strong relationship wasnot found between the degree of centralisation of wage setting institutions and wagedispersion across countries. Countries with similar levels of wage dispersiondisplayed a diversity of labour market institutions. While we did find positivecorrelations between wages, productivity and prices in the majority of countries, thecross-country evidence was insufficient to draw general conclusions. Overall, thesensitivity of wages to demand conditions does not appear to be systematicallyrelated to the degree of centralisation of the wage setting system.
34
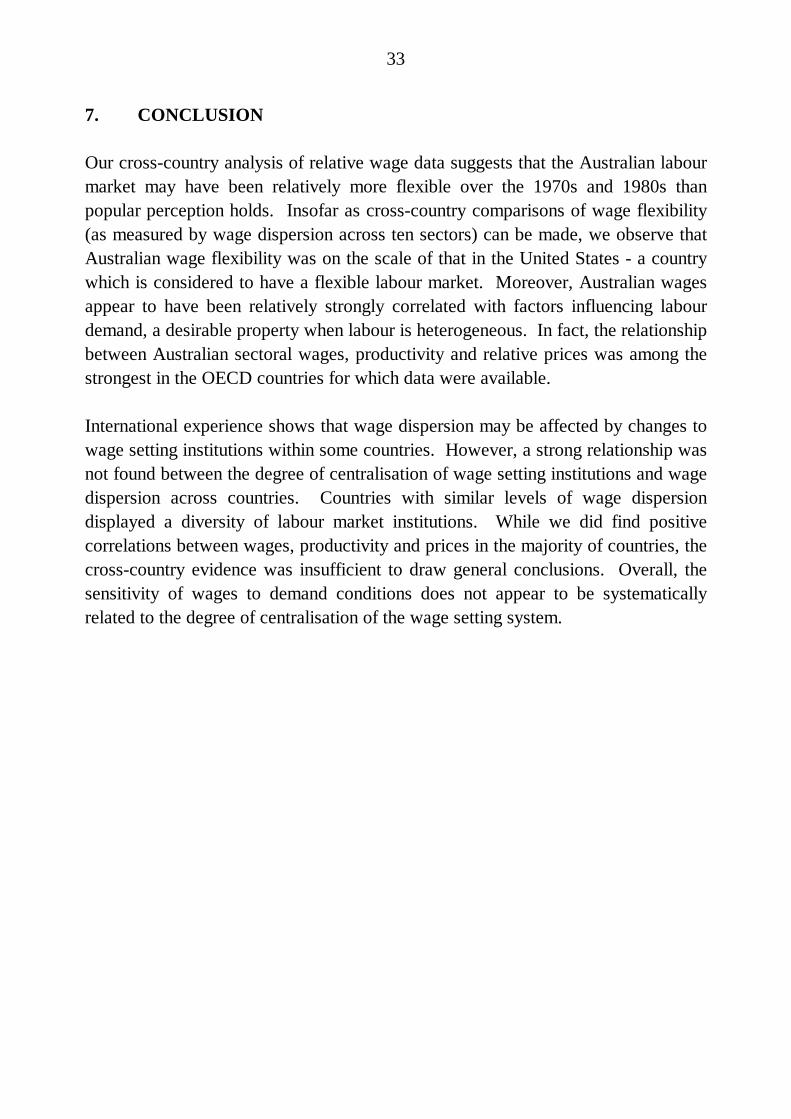
APPENDIX 1: WAGE DISPERSION SUMMARY STATISTICS
Table A1.1: Coefficient of Variation of Nominal Wages (x 100)
Period Sectors 1960-73 1974-83 1984-90
Australia 1969-90 10 22.3 20.1 21.7
Belgium 1975-90 8 15.5 18.2
Denmark 1966-90 10 14.0 7.7 8.1
Finland 1960-90 10 18.5 10.1 11.1
France 1977-87 9 10.1 10.4
Germany 1970-89 9 14.6 13.8 13.6
Iceland 1973-89 9 18.7 17.3 19.2
Italy 1970-90 8 27.0 20.8 19.2
Japan 1970-90 10 25.4 25.9 28.0
Luxembourg 1975-90 9 23.7 25.0
Norway 1962-90 10 20.0 21.8 22.0
Sweden 1980-90 10 12.4 14.3
United Kingdom 1971-87 10 16.0 18.6 21.5
United States 1960-87 10 18.0 19.8 20.8
AVERAGE 19.5 17.0 18.1
35
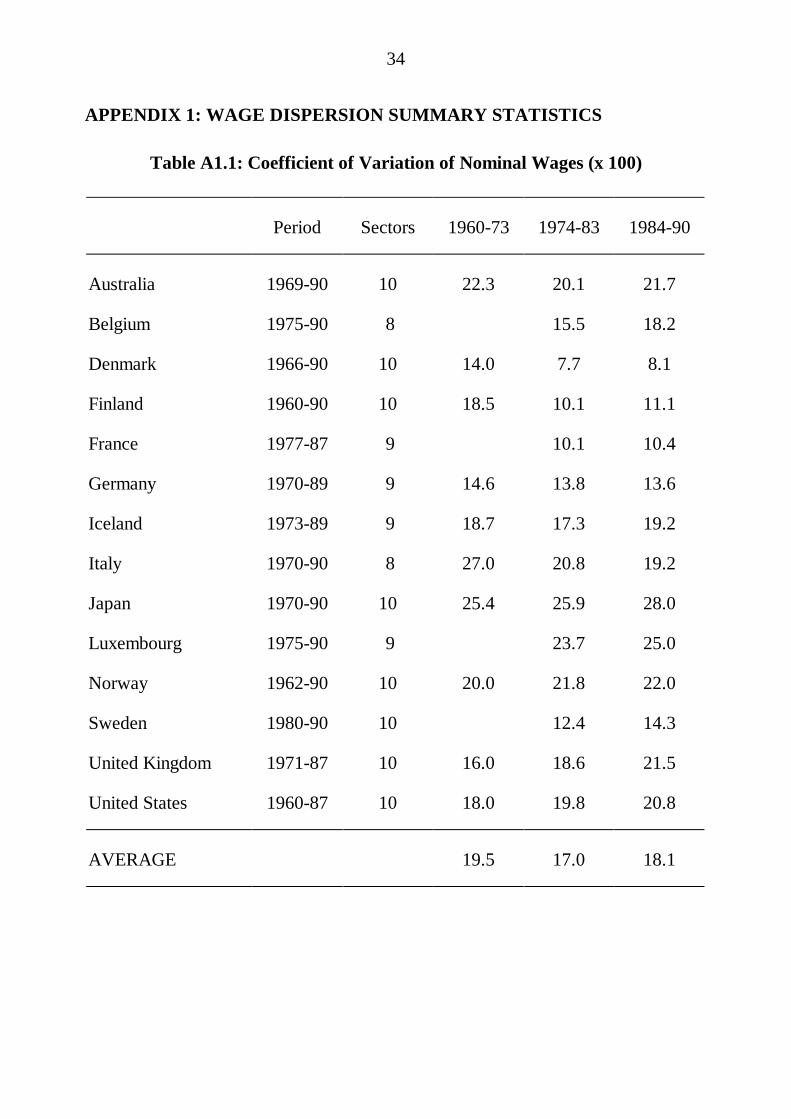
Table A1.2: Variance of the Log of Nominal Wages (x 100)
Period Sectors 1960-73 1974-83 1984-90
Australia 1969-90 10 4.17 3.73 4.04
Belgium 1975-90 8 2.15 3.10
Denmark 1966-90 10 2.46 0.78 0.71
Finland 1960-90 10 3.47 1.07 1.32
France 1977-87 9 1.12 1.08
Germany 1970-89 9 2.14 1.95 1.94
Iceland 1973-89 9 3.33 2.72 2.86
Italy 1970-90 8 9.31 5.01 4.58
Japan 1970-90 10 5.75 5.45 6.68
Luxembourg 1975-90 9 5.65 6.54
Norway 1962-90 10 5.77 6.52 5.78
Sweden 1980-90 10 1.93 2.26
United Kingdom 1971-87 10 2.54 3.58 4.89
United States 1960-87 10 4.03 4.38 4.98
AVERAGE 4.30 3.29 3.63
36
Figure A1.1: Variance of the Logs of Nominal Wages
0
2
4
6
1960 1965 1970 1975 1980 1985 19900
2
4
6
Australia
Japan
US
Germ any
UK
x 100 x 100
0
2
4
6
1960 1965 1970 1975 1980 1985 19900
2
4
6
Australia
Finland
Norway
Denmark
Sweden
x 100 x 100
.
0
3
6
9
1969 1972 1975 1978 1981 1984 1987 19900
3
6
9
Australia
Italy
FranceBelgium
x 100 x 100
37
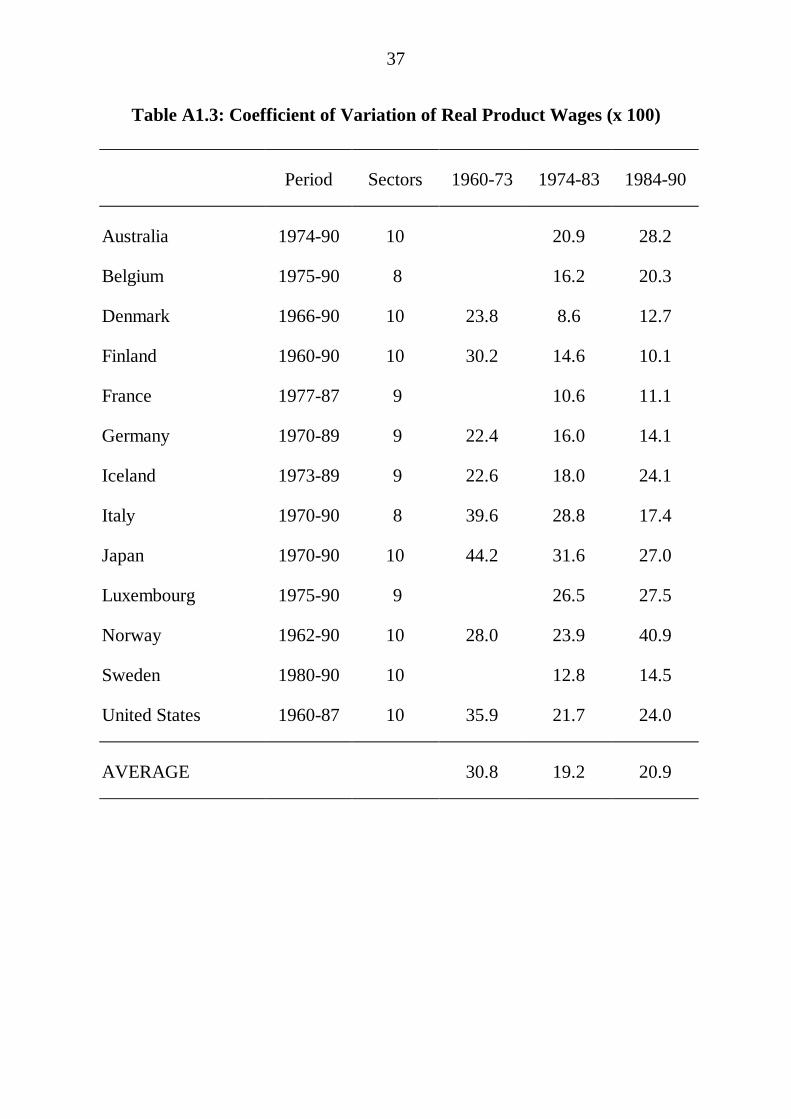
Table A1.3: Coefficient of Variation of Real Product Wages (x 100)
Period Sectors 1960-73 1974-83 1984-90
Australia 1974-90 10 20.9 28.2
Belgium 1975-90 8 16.2 20.3
Denmark 1966-90 10 23.8 8.6 12.7
Finland 1960-90 10 30.2 14.6 10.1
France 1977-87 9 10.6 11.1
Germany 1970-89 9 22.4 16.0 14.1
Iceland 1973-89 9 22.6 18.0 24.1
Italy 1970-90 8 39.6 28.8 17.4
Japan 1970-90 10 44.2 31.6 27.0
Luxembourg 1975-90 9 26.5 27.5
Norway 1962-90 10 28.0 23.9 40.9
Sweden 1980-90 10 12.8 14.5
United States 1960-87 10 35.9 21.7 24.0
AVERAGE 30.8 19.2 20.9
38
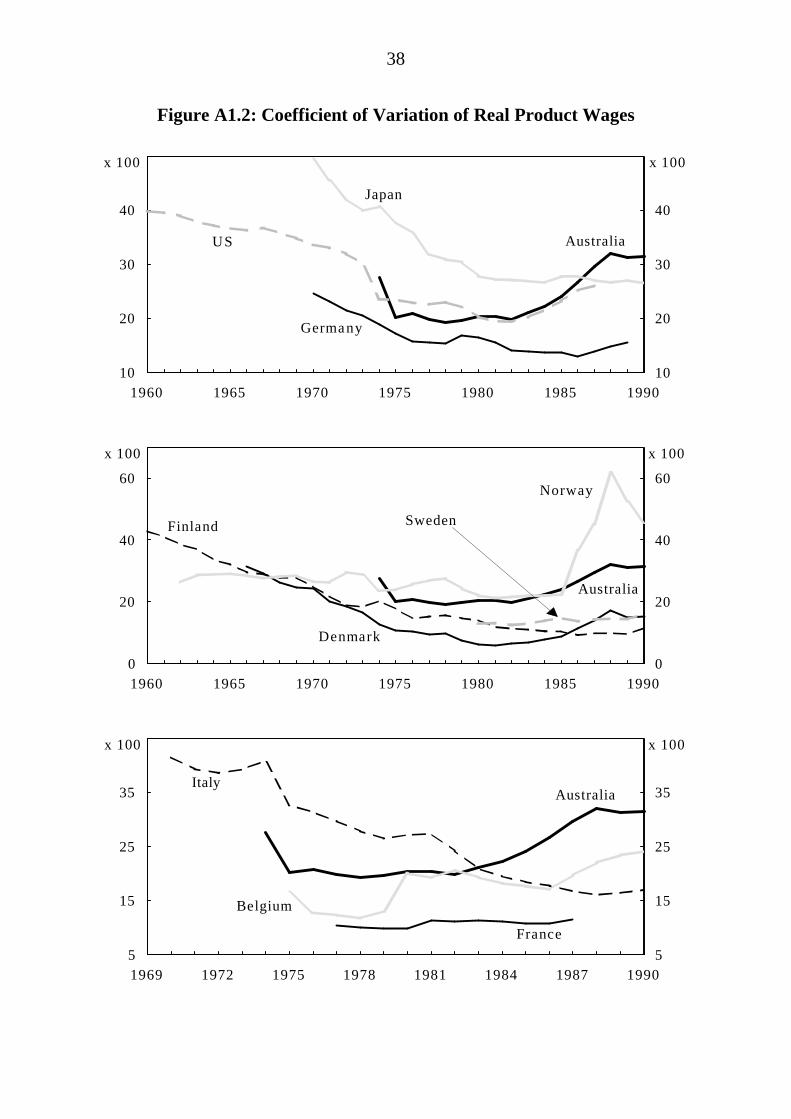
Figure A1.2: Coefficient of Variation of Real Product Wages
10
20
30
40
1960 1965 1970 1975 1980 1985 199010
20
30
40
Australia
Japan
US
Germany
x 100 x 100
0
20
40
60
1960 1965 1970 1975 1980 1985 19900
20
40
60
Australia
Finland
Norway
Denmark
Sweden
x 100 x 100
5
15
25
35
1969 1972 1975 1978 1981 1984 1987 19905
15
25
35AustraliaItaly
France
Belgium
x 100 x 100
39
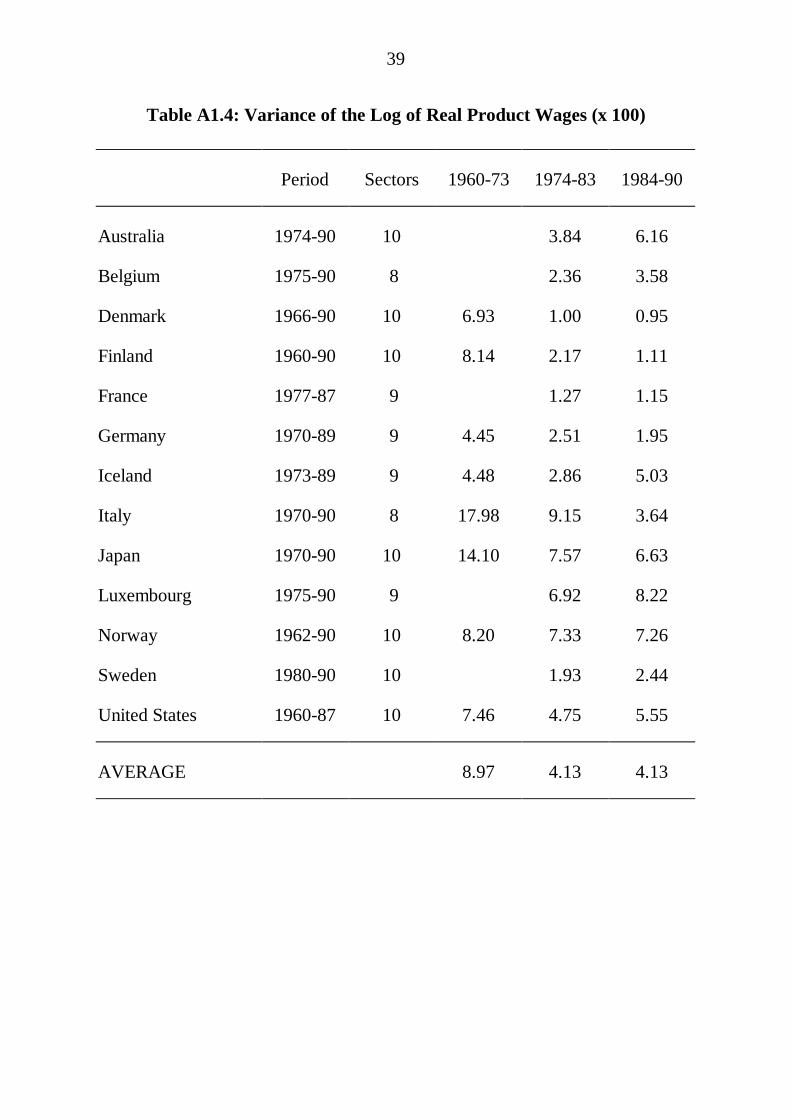
Table A1.4: Variance of the Log of Real Product Wages (x 100)
Period Sectors 1960-73 1974-83 1984-90
Australia 1974-90 10 3.84 6.16
Belgium 1975-90 8 2.36 3.58
Denmark 1966-90 10 6.93 1.00 0.95
Finland 1960-90 10 8.14 2.17 1.11
France 1977-87 9 1.27 1.15
Germany 1970-89 9 4.45 2.51 1.95
Iceland 1973-89 9 4.48 2.86 5.03
Italy 1970-90 8 17.98 9.15 3.64
Japan 1970-90 10 14.10 7.57 6.63
Luxembourg 1975-90 9 6.92 8.22
Norway 1962-90 10 8.20 7.33 7.26
Sweden 1980-90 10 1.93 2.44
United States 1960-87 10 7.46 4.75 5.55
AVERAGE 8.97 4.13 4.13
40
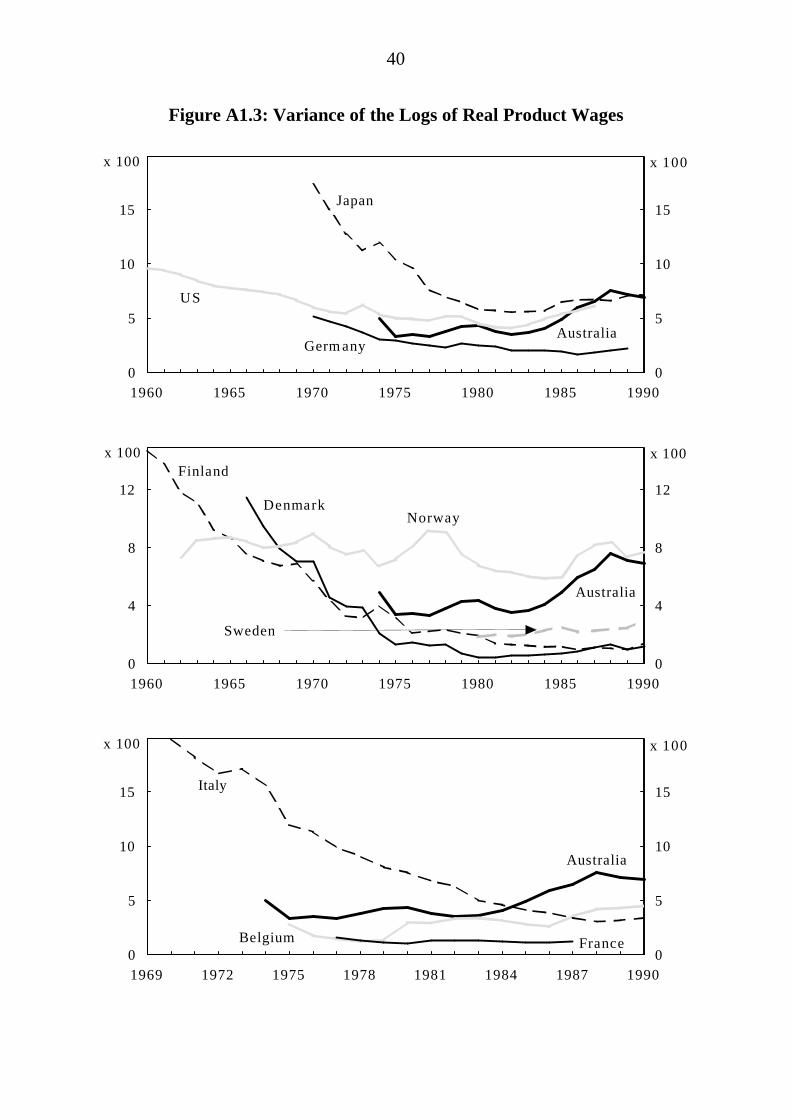
Figure A1.3: Variance of the Logs of Real Product Wages
0
5
10
15
1960 1965 1970 1975 1980 1985 19900
5
10
15
Australia
Japan
US
Germ any
x 100 x 100
0
4
8
12
1960 1965 1970 1975 1980 1985 19900
4
8
12
Australia
Finland
NorwayDenmark
Sweden
x 100 x 100
0
5
10
15
1969 1972 1975 1978 1981 1984 1987 19900
5
10
15
Australia
Italy
FranceBelgium
x 100 x 100

41
APPENDIX 2: DATA SOURCES
The sectoral data used in the analysis was taken from the OECD's "NationalAccounts", Vol. 2, on magnetic tape. Data from tables 1, 12, 13 and 15 wereemployed. Unemployment data were obtained from the OECD Economic Outlook,no. 52.
The disaggregated sectors are as follows:
1. Agriculture, hunting, forestry and fishing
2. Mining and quarrying
3. Manufacturing
4. Electricity, gas and water
5. Construction
6. Wholesale and retail trade, restaurants and hotels
7. Transport, storage and communication
8. Finance, insurance, real estate and business services
9. Community, social and personnel services
10. Producers of government services
Sectors 8, 9 and 10 were excluded from the correlation and regression analysis. Thereal output data for these sectors are generally constructed using an assumption ofno employment productivity growth, and were thus unsuitable for this part of theanalysis.
42
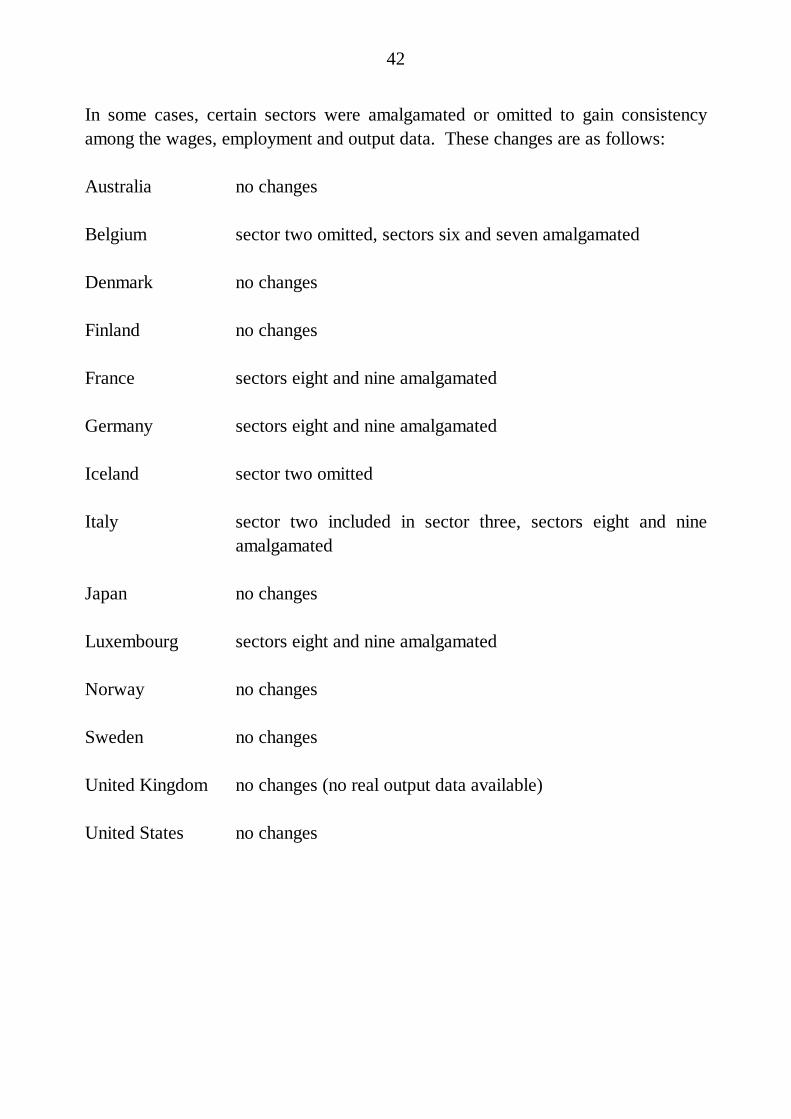
In some cases, certain sectors were amalgamated or omitted to gain consistencyamong the wages, employment and output data. These changes are as follows:
Australia no changes
Belgium sector two omitted, sectors six and seven amalgamated
Denmark no changes
Finland no changes
France sectors eight and nine amalgamated
Germany sectors eight and nine amalgamated
Iceland sector two omitted
Italy sector two included in sector three, sectors eight and nineamalgamated
Japan no changes
Luxembourg sectors eight and nine amalgamated
Norway no changes
Sweden no changes
United Kingdom no changes (no real output data available)
United States no changes
43
REFERENCES
Blandy, R. (1993), Economic Rationalism and Prosperity, Paper presented to theConference on Economic Rationalism: Economic Policies for the 90's, University ofMelbourne, 15-19 February.
Braun, A. R. (1986), Wage Determination and Incomes Policy in OpenEconomies, International Monetary Fund, Washington.
Bruno, M. and J. Sachs (1984), "The Economics of Worldwide Stagflation", BasilBlackwell, Oxford.
Burgess, J. and D. MacDonald (1989), The Emerging Labour FlexibilityImperative: The Political Economy of Labour Market Reform in Australia,Newcastle University Occasional Paper No. 168.
Calmfors, L. (1993), Centralisation of Wage Bargaining and MacroeconomicPerformance: A Survey, OECD Economics Department Working Paper, 131.
Calmfors, L. and J. Driffill (1988), "Centralisation of Wage Bargaining andMacroeconomic Performance", Economic Policy, 6, pp. 13-61.
Carmichael J. and D. Dews (1987), "The Role and Consequence of Investment inRecent Australian Economic Growth", Reserve Bank of Australia, ResearchDiscussion Paper 8704.
Committee of Review into Australian Industrial Relations Law and Systems(1985), "Australian Industrial Relations Law and Systems", Vol. 2.
Crouch, C. (1985), "Conditions for Trade Union Restraint", in L. Lindberg andC.S. Maier (ed.), The Politics of Inflation and Economic Stagnation, BrookingsInstitution, Washington.
Deardorff, A. V. and R. M. Stern (1986), The Michigan Model of WorldProduction and Trade: Theory and Applications, Cambridge, Mass., MIT Press.
Dowrick, S. (1993), Wage Bargaining Systems and Productivity Growth in OECDCountries, Economic Planning Advisory Council Background Paper No. 26.
44
Freeman, R. (1988), "Labour Market Institutions and Economic Performance",Economic Policy, 6, pp. 64-80.
Hancock Report: See Committee of Review into Australian Industrial RelationsLaw and Systems (1985).
Keating, M. (1983) "Relative Wages and the Changing Industrial Distribution ofEmployment in Australia", The Economic Record, 59, pp.384-397.
Nickell, S. (1990), "Unemployment: A Survey", The Economic Journal, 100,pp. 391-439.
Olson, M. (1982), The Rise and Decline of Nations, Yale University Press, NewHaven, Connecticut.
Organisation for Economic Cooperation and Development (1986), "Flexibility inthe Labour Market: The Current Debate", OECD, Paris.
Organisation for Economic Cooperation and Development (1992), "NationalAccounts", Vol. 2, OECD, Paris.
Organisation for Economic Cooperation and Development (1992), "OECDEconomic Outlook", No. 52, OECD, Paris.
Pitchford, J.D. (1972), "The Usefulness of the Average Productivity WageAdjustment Rule", in J.W. Neville and D.W. Stammer (eds.), Inflation andUnemployment, (Ponguin, Ringwood, Victoria), pp. 225-234.
Soskice, D. (1990), "Wage Determination: The Changing Role of Institutions inAdvanced Industrialised Countries", Oxford Review of Economic Policy, 4, pp. 36-61.
Withers, G. (1986), "Australian Wages and Labour Market Adjustment: AComparative International Assessment", in J. Niland (ed.), Wage Fixation inAustralia, Allen & Urwin, Sydney, pp. 243-255.
Withers, G., D. Pitman and B. Whittingham (1986), "Wage Adjustments andLabour Market Systems: A Cross-Country Analysis", The Economic Record, 62,pp. 415-426.