Embed Size (px)
Citation preview

A Deeper Analysis of Compensation and Benefits Data from
Valuing Our Nonprofit Workforce
By Owen Berson and Lyn Freundlich
Wage Equity Matters
2 Wage Equity Matters
Introduction
For the past several years, TSNE MissionWorks has been looking at key trends in leader-ship, compensation, staff development and other areas that impact the resiliency of the nonprofit sector. Valuing Our Nonprofit Workforce compensation studies (2017, 2014 and 2010), Opportunity in Change (2017, with The Boston Foundation) and Leadership New England study (2015) all point to the impact that low pay, long hours and little preparation for advancement are having on our nonprofit workforce.
Valuing our Nonprofit Workforce 2017 is the third regional compensation survey commis-sioned by TSNE MissionWorks (formerly Third Sector New England). Initially, the report was commissioned to fill an information gap in hard-to-find salary data for small- to mid-sized nonprofits that work in the area of social justice and to provide salary information for titles unique to this field. Thanks to our sponsors we are able to provide access to this data free of cost.
Now with three surveys over seven years, we have an opportunity to look at compensation trends across the region. Understanding the relationship between salaries and the rising cost of living provides insight into the wage pressures our workforce is facing and how it may be working against our ability to attract and retain successful employees. In addition, our sector is experiencing the long-predicted departure of baby boomer leaders, so ensur-ing a well prepared and well-compensated workforce that is ready to take on leadership roles is more important than ever.
In our 2015 Leadership New England report we found that 40% of departing leaders who said that they were planning to leave their posts within two years indicated that higher pay or more robust benefits would make them consider staying longer.1 The Building Movement Project’s recent report Race to Lead: Confronting the Nonprofit Racial Leadership Gap found that inadequate pay is one of the most significant challenges respondents face in their work, second only to a demanding workload. Fifty-one percent (51%) of respondents who are People of Color and 46% of White respondents said that inadequate salaries are “often” or “always” a challenge or frustration.2
Without adequate compensation, a nonprofit career path isn’t sustainable for many people, and we will likely lose talented prospective leaders to other industries if we do not pay attention to the compensation and benefits we offer our workforce. In this report, we will explore how nonprofit workers are compensated and what it means to our ability to attract and retain a vibrant, diverse and talented pool of emerging leaders.

www.tsne.org 3
AcknowledgementsWe are grateful to the many people who contributed their time and effort to the release of this report, analysis and searchable salary database. We thank Rita Haronian of Nonprofit Compensation Associates. For TSNE MissionWorks, we thank Rodney Byrd who served as project manager for the report, Owen Berson who assisted with the survey data and co-authored this analysis with Lyn Freundlich. Sandy St. Louis and Ning Yuan provided expertise in the presentation and communication of the survey results, with a focus on developing and maintaining an easy to use and informative online searchable database presenting the findings on pay, across many different factors, along with a downloadable survey format.
The sponsors and partners that provided funding and promotional support play a vital role in ensuring widespread participation from a variety of nonprofits across the region, including: Associated Grant Makers, Barr Foundation, Bay Path University M.S. Programs in Nonprofit Management and Strategic Planning, Berkshire Taconic Community Foundation, The Boston Foundation, The Cape Cod Foundation, The Cape and Islands Part-nership for Nonprofit Advancement, Community Foundation of Southeastern Massachusetts, The Community Foundation for Greater New Haven, Community Foundation of Western Massachusetts, Connecticut Community Foundation, Connecticut Community Nonprofit Alliance, Employers Association of the NorthEast, Essex County Community Foundation, Fairfield County’s Community Foundation, Greater Worcester Community Foundation, Hartford Foundation for Public Giving, Human Service Forum, The Hyams Foundation, Inspirica, Inc., Jane Doe, Inc., Massachusetts Council of Human Service Providers, Inc., Massachusetts Cultural Council, Massachusetts Nonprofit Network, Northwest Connecticut Community Foundation, Rhode Island Foundation, United Way of Rhode Island, van Beuren Charitable Foundation, Westchester Community Foundation
Our partners also make it possible for us to distribute this salary data and analysis for free, so that even the smallest nonprofits have access to compensation and benefits data to inform their pay structures and decisions.
You can read the entire Valuing Our Nonprofit Workforce report: www.tsne.org/valuing-our-nonprofit-workforce
Associated Grant Makers
Berkshire Taconic Community Foundation The Cape Cod Foundation The Community Foundation for Greater New Haven
Essex County Community Greater Worcester Community Foundation The Hyams Foundation
Thanks to our Sponsors

4 Wage Equity Matters
Understanding the DataWhen considering this data over time, it is important to note that because we are not able to track salaries for the same positions within the same organizations, the data is not statistically conclusive. Also, the sample of organizations responding are self-selected, not scientifically selected. In addition, our geographic region expanded with each survey. As a result, we need to be cautious about attaching too much significance to these findings. With those caveats, however, we can look at trends. We can begin to understand whether, and how, wages have increased over time. We also considered other variables like organizational size, field of service, and the race and ethnicity of employees. We only had large enough numbers of White, Black, and Hispanic/Latino employees reported to be able to discuss trends in these groups. We collected data on other racial and ethnic groups, and we report that data in charts about our total sample, however, we do not have enough data to be able to draw conclusions about trends in this smaller subset.3
In 2010, 202 organizations participated in our study, representing 131 job titles and over 30,000 employees. Participation in our 2014 report grew to 250 organizations, representing 134 job titles and nearly 31,000 individual employees. This year, 342 organizations responded and the newest report includes data for 171 job titles and over 35,000 individuals.
Survey sample 2010 2014 2017
Participating organizations 202 250 342Job titles 131 134 171Employees 30,000 31,000 35,000
Annual operating budgets of responding organizations in each study ranged in size from less than $100,000 to over $100,000,000. Staff sizes ranged from one to more than 1,000. The majority of respondents are from organizations with budgets under $10,000,000.
Operating budget 2010 2014 2017 up to $249,999 32 31 33$250,000 - $999,999 38 53 64$1,000,000 - $2,499,999 43 46 73$250,000,000 - $9,999,999 38 66 84$10,000,000 - $24,999,999 32 33 54$25,000,000 and over 19 21 34 Staff size 2010 2014 2017 1 - 5 46 45 866 - 10 23 32 3911 - 25 34 41 5926 - 50 21 37 2951 - 100 11 20 42101 - 250 32 39 49 51 and more 35 36 38
The 2017 survey participants are classified into one of 19 separate fields of service. One hundred and ninety-five (195) or 57% provide services to underserved populations; 15% focus on community development, social justice, civil rights or policy change. The 2014 and 2010 lists of fields of services are slightly different, but 13% of the organizations responding have missions focused on social justice.
Mission focus 2010 2014 2017Community and economic development, social justice, 13% 13% 15%civil rights or policy change participants
Direct services participants 56% 56% 57%

www.tsne.org 5
The geographic region expanded from one study to the next. Our 2010 report covered nonprofit organizations in Massachusetts and a small number located in Rhode Island. In 2014 we expanded into a small part of Connecticut. We are grateful to have enlisted five Connecticut-based funders and partner organizations enabling us to report data from an additional 224 organizations.
Nonprofits in southern New England employ a greater percentage of the workforce compared to other parts of the country. As of 2015, nonprofits employed 10% of the U.S. workforce, and nearly 17% of the workforce in MA, nearly 14% of the CT workforce, and over 18% of the RI workforce.4 Looking at the nonprofit workforce in this region is therefore especially important since it makes up a sizeable part of our local economy.
Geographic Location of Responding Organizations
Region # of Organizations
Route 195/Eastern Route 95, Windham County CT, New London County CT, 33Bristol County MA, Rhode Island
New Haven CoastalMiddlesex County CT, New Haven County CT 26
New England GatewayFairfield County CT, Westchester County NY 41
Greater HartfordHartford County CT, Tolland County CT 88
Western MA and Litchfield County CTLitchfield County CT, Berkshire County MA, 41Franklin County MA, Hampden County MA, Hampshire County MA
Eastern MA, Not Including BostonEssex County MA, Middlesex County MA 41(other than Cambridge), Norfolk County MA, Worcester County MA
Boston & CambridgeSuffolk County MA, City of Cambridge MA 41 Cape Cod & The IslandsBarnstable County MA, Dukes County MA, 31Nantucket County MA, Plymouth County MA
Total 342

6 Wage Equity Matters
Trends in Executive CompensationExecutive Director TenureSeveral studies have predicted that the retirement of baby boomer Executive Directors (EDs) and founders will increase this decade. Therefore, we would expect a corresponding increase in the percentage of EDs who have served zero to 2.9 years in their current position. This pattern is evident between the years 2010 and 2014, but it decreases in 2017. This may be a result of different survey samples. Or perhaps when the economy recovered between 2010 and 2014, people who had postponed retirement took the opportunity to do so. Anecdotally, though, more of those leaders are retiring now than in 2014 because many waited for their investments to recover. It will be interesting to look at this data again in two to three years to see if the predicted mass exodus of long-term leaders becomes evident.
Years of service (in current position) 2010 2014 2017
0 – 2.9 years 15.79% 26.9% 20.1%3 – 6.9 years 29.3% 22.5% 27.3%7 – 9.9 years 8.4% 10.6% 11.2%10 or more years 46.6% 40.1% 40.9%
Executive Director Incentive PayIn 2017, 34% of organizations report that they have a formal policy that allows for incentive pay for Executive Directors. This number has steadily increased from 13% in 2010 and 22% in 2014. The chart below indicates that few small organizations provide incentive pay and that this practice is more common among groups with budgets over $1,000,000. It should be noted that the Association of Fundraising Professionals (AFP) opposes the practice of providing percentage-based compensation for nonprofit staff responsible for fundraising. In fact, AFP “believes that individuals serving a charity for compensation must accept the principle that charitable purpose, not self-gain, is paramount.”5
Organizational size Percent providing incentive pay
Less than $250,000 6%$250,000 - $999,999 23%$1,000,000 - $2,499,999 34%$2,500,000 - $9,999,999 45%$10,000,000 - $24,999,999 39%$25,000,000 and over 38%
Gender Pay GapThe overall number of Executive Directors who are women has modestly increased over the seven years represented in our studies. The wage gap between women and men in the executive director position has remained unchanged. We also collected data on the gender cat-egory ‘other,’ however, we did not have sufficient data to report on people who identify with other genders.
2010 2014 2017
Total percentage of ED/CEO jobs held by women 54% 59% 61%Women EDs/CEOs in organizations under $250,000 74% 75% 85%Women EDs/CEOs in organizations over $25M 25% 40% 32%Percent women EDs/CEOs earn in relationship to men 71% 76% 75%

www.tsne.org 7
Executive Racial Demographics Demographics and SalariesExecutive Directors and CEOs do not always represent the demo-graphics of their organization’s staff or constituents. Over 90% of the EDs/CEOs in our 2010, 2014 and 2017 studies were White. Given that 57% of all employees represented in our survey are White, White people are over-represented in these roles. We have not seen meaningful increases in ED/CEO diversity across our three surveys. The percentage of Black EDs/CEOs has hovered just over 3%, and the percentage of Hispanic/Latino EDs/CEOs increased from 0% to 2%, an increase so small it is difficult to tell whether it is significant. No other racial/ethnic group made up more than 2% of the ED/CEOs represented in the 2017 study, and none of these groups saw any consistent trends of increases or decreases in representation.
When we compare the ED/CEO demographics to the overall demographics of our survey sample from those years, we notice that White people are consistently over-represented in ED/CEO roles.
White CEOs, 91%
American Indian/Alaska Native
Black
Hispanic/Latino
Asian
Native Hawaiian/Pacific Islander
Mixed Race
Other
Employees 57%
CEOs, 4%Employees 28%
CEOs, 2%Employees 11%
CEOs, 2%Employees 1%
CEOs, 1%Employees 0%
CEOs, 0%Employees 0%
CEOs, 1%Employees 2%
CEOs, 1%Employees 1%
White CEOs, 94%
American Indian/Alaska Native
Black
Hispanic/Latino
Asian
Native Hawaiian/Pacific Islander
Mixed Race
Other
Employees 64%
CEOs, 3%Employees 24%
CEOs, 1%Employees 9%
CEOs, 1%Employees 2%
CEOs, 0%Employees 0%
CEOs, 0%Employees 0%
CEOs, 0%Employees 1%
CEOs, 0%Employees 0%
White CEOs, 92%
American Indian/Alaska Native
Black
Hispanic/Latino
Asian
Native Hawaiian/Pacific Islander
Mixed Race
Other
Employees 61%
CEOs, 4%Employees 27%
CEOs, 0%Employees 8%
CEOs, 2%Employees 2%
CEOs, 1%Employees 0%
CEOs, 0%Employees 0%
CEOs, 1%Employees 1%
CEOs, 1%Employees 1%
2017
2014
2010
Racial Demographics of Employees and CEOs
There have been no notable changes in the racial demographics of our survey samples from 2010 to 2017. When comparing the demo-graphics of our survey sample to data on the demographics of the workforce in our region, our sample has a higher percentage of Black employees and a lower percentage of White employees than southern New England’s workforce as a whole. In the 2017 VONW study, 28% of employees were Black, compared with 8.5% in the region’s workforce, and 56% of VONW employees were White, compared with 84% White people in the region’s workforce in 2016.6
Given the sample, we would expect to see staff who are People of Color more represented in nonprofit leadership roles, which is not the case. Other recent reports about the diversity of EDs/CEOs in the nonprofit sector note a similar pattern that the percentage of executives who are People of Color has not changed much in the past decade.

8 Wage Equity Matters
Wages and Trends for Other WorkersSalary increasesIn this year’s study, 70% of responding organizations anticipated giving staff raises. This is consistent with data from the 2014 study (71%) and sig-nificantly more than in 2010 (58%). For those planning to provide raises, the average salary increase budgeted is 2.99%, which is relatively similar to data from previous studies: 3.07% in 2014 and 3.17% in 2010.
Typically, when nonprofit organizations are in a financial position to provide raises they give their staff across the board cost of living increases (COLAs), merit increases or a combination of both. Though the increases themselves haven’t changed dramatically over our three surveys, the percent of responding organizations that are giving merit increases has steadily risen from 39% in 2010 to 43% in 2014 to 52% in 2017. This may be indicative of an increase in available funds. Often, when there are few resources for providing raises, organizations opt to use those limited resources to increase everyone’s salary. When their salary increase budgets are more significant, they may elect to differentiate between poor, average and excellent performers. The fact that reported average merit increases are larger than average COLAs supports this conclusion.
% respondents that give COLA
Average COLA increase in the previous 12 mos.
% respondents that give merit increases
Average merit increase in the previous 12 mos.
2010 35% 2.76% 39% 3.26%2014 26% 2.02% 43% 3.29%2017 25% 2.34% 52% 3.39%
The other interesting trend is that when asked about overall salary increases for existing staff (which would include COLA, merit increases, and other types of raises) the smallest organizations reported the largest anticipated raises. It may be that because salaries at the smallest organiza-tions tend to be lower, larger increases were planned in order to catch up with the cost of living or raises were given to retain staff.
This trend is consistent across all three survey years. Interestingly, those small organizations with budgets under $250,000 expected to give their biggest raises (an average of 4.75%) in 2010 followed by 2014 (4.54%) with the smallest amounts in the most recent survey (3.71%). If the inference above is indeed true, more significant salary increases may have been most critical in terms of retention in 2010 when groups were hardest hit by economic conditions.
Projected overall salary increases
Organization size 2010 2014 2017
Up to $249,999 4.75% 4.54% 3.71%$250,000 - $999,999 3.26% 3.42% 3.46%$1,000,000 - $2,499,999 2.97% 2.76% 3.04%$2,500,000 - $9,999,999 2.69% 2.99% 2.82%$10,000,000 - $24,999,999 3.23% 2.75% 2.69%$25,000,000 and over 2.58% 3.36% 2.51%
Employee Turnover RatesIn 2014, we noted that voluntary turnover rates for full-time employees increased from 12% to 17% and for part-time employees from 11% to 21%. We hypothesized that the increased turnover rate was in response to an improving economy. As we came out of recession, organizations began growing again and adding jobs, so positions to apply for were more widely available. The improved economy may also have contributed to an increased sense of comfort for people making job or career changes that they may have rejected during the recession. Our 2017 data indicates a bit of correction for full-time employees – the rate is 15%. But it is even higher at 24% for part-time employees.
Voluntary Turnover Rates 2010 2014 2017
Full-time 12% 17% 15%Part-time 11% 21% 24%

www.tsne.org 9
By profession In 2014 we reported that executive, administrative and finance jobs were the only categories for which the median pay for every position in-creased. In 2017, there wasn’t such a clear trend. Salaries for executive positions increased from 2014 to 2017 consistently. Wages for finance and technology positions increased. And most of the administrative and fundraising positions reported higher wages on average in 2017 than in 2014. That said though, salaries for 93% of the job titles reported in 2017 increased; in 2014 that number was 79%.
As the population ages, the need for direct service staff will increase. Boston.com predicts that wages for Mental Health and Substance Abuse Social Workers as well as for Home Health Aids will increase7. This trend is reflected in our data. We looked at positions in the Medical and Clinical Services and Social Services and Mental Health categories for which we had median wage increase data for both of the periods between 2010 to 2014 and 2014 to 2017. The median wage increases were larger between 2014 and 2017 than between 2010 and 2014 for 87% of the titles in those job categories that represent direct client or patient service positions.
By level As one would expect, senior level employees earn significantly more than mid- and entry-level staff. In this study, Executive Directors (median sal-ary = $120,203) are not the highest earners, though. Directors of Medical Services are the highest earners (median salary = $245,326). Psychiatrists come in second (median salary = $230,006). This makes sense, given the relatively high salaries for MDs in general, with average physician wages of $253,000 in the Northeast.8
Other notably high paying senior level positions are those in fund development (Development Director median salary = $85,238), finance (Controller = $86,065) and technology (IT Director = $91,458). In Leadership New England nonprofit leaders and board members report that fund development is their most significant challenge thus the high value placed on the role of Development Director.9 According to the U.S. Bureau of Labor Statistics, employment of financial analysts is projected to grow 12% from 2014 to 2024, faster than average for all other occupations.10 And attracting and retaining qualified and talented high-level technology staff is challenging in light of the technology start-up surge.
By raceThe racial demographics of the ten lowest paid jobs are very similar to the overall survey sample demographics in 2017. However, White em-ployees are noticeably over-represented in the ten highest paid jobs while Black and Hispanic/Latino employees are under-represented. Even though they make up only about 56% of the total sample from our 2017 report, White employees hold 91% of the ten highest paying positions. Black employees hold only 3% and Latino employees hold only 2% of these highest paying jobs. There hasn’t been a trend toward more equitable representation since we conducted the first survey in 2010.
Our data continues to show a large income disparity between the highest and lowest paid nonprofit jobs in our region, which is correlated with the race of employees holding those jobs. This pay disparity can make a huge difference in terms of quality of life. It also perpetuates racial inequities by reinforcing the wealth gap we see in our society, which many organizations are trying to address.

10 Wage Equity Matters
White 10 Highest paid, 89%
American Indian/Alaska Native
Black
Hispanic/Latino
Asian
Native Hawaiian/Pacific Islander
Mixed Race
Other
All employees 57%
10 Highest paid, 3%All employees 28%
10 Highest paid, 3%All employees 11%
10 Highest paid, 3%All employees 1%
10 Highest paid, 1%All employees 0%
10 Highest paid, 0%All employees 0%
10 Highest paid, 1%All employees 2%
10 Highest paid, 0%All employees 1%
White 10 Highest paid, 90%
American Indian/Alaska Native
Black
Hispanic/Latino
Asian
Native Hawaiian/Pacific Islander
Mixed Race
Other
All employees 64%
10 Highest paid, 4%All employees 24%
10 Highest paid, 2%All employees 9%
10 Highest paid, 3%All employees 2%
10 Highest paid, 0%All employees 0%
10 Highest paid, 0%All employees 0%
10 Highest paid, 0%All employees 1%
10 Highest paid, 0%All employees 0%
White 10 Highest paid, 86%
American Indian/Alaska Native
Black
Hispanic/Latino
Asian
Native Hawaiian/Pacific Islander
Mixed Race
Other
All employees 61%
10 Highest paid, 6%All employees 27%
10 Highest paid, 4%All employees 8%
10 Highest paid, 3%All employees 2%
10 Highest paid, 0%All employees 0%
10 Highest paid, 0%All employees 0%
10 Highest paid, 1%All employees 1%
10 Highest paid, 1%All employees 1%
White 10 Lowest paid, 56%
American Indian/Alaska Native
Black
Hispanic/Latino
Asian
Native Hawaiian/Pacific Islander
Mixed Race
Other
All employees 57%
10 Lowest paid, 29%All employees 28%
10 Lowest paid, 11%All employees 11%
10 Lowest paid, 1%All employees 1%
10 Lowest paid, 0%All employees 0%
10 Lowest paid, 0%All employees 0%
10 Lowest paid, 1%All employees 2%
10 Lowest paid, 1%All employees 1%
White 10 Lowest paid, 40%
American Indian/Alaska Native
Black
Hispanic/Latino
Asian
Native Hawaiian/Pacific Islander
Mixed Race
Other
All employees 64%
10 Lowest paid, 47%All employees 24%
10 Lowest paid, 10%All employees 9%
10 Lowest paid, 1%All employees 2%
10 Lowest paid, 0%All employees 0%
10 Lowest paid, 0%All employees 0%
10 Lowest paid, 2%All employees 1%
10 Lowest paid, 0%All employees 0%
White 10 Lowest paid, 60%
American Indian/Alaska Native
Black
Hispanic/Latino
Asian
Native Hawaiian/Pacific Islander
Mixed Race
Other
All employees 61%
10 Lowest paid, 18%All employees 27%
10 Lowest paid, 16%All employees 8%
10 Lowest paid, 2%All employees 2%
10 Lowest paid, 0%All employees 0%
10 Lowest paid, 0%All employees 0%
10 Lowest paid, 2%All employees 1%
10 Lowest paid, 2%All employees 1%
Racial Demographics of All Employees and those in 10 Highest and Lowest Paid Jobs
2017
2014
2010
2017
2014
2010
Employees in the 10 Highest paid positions Employees in the 10 Lowest paid positions
www.tsne.org 11
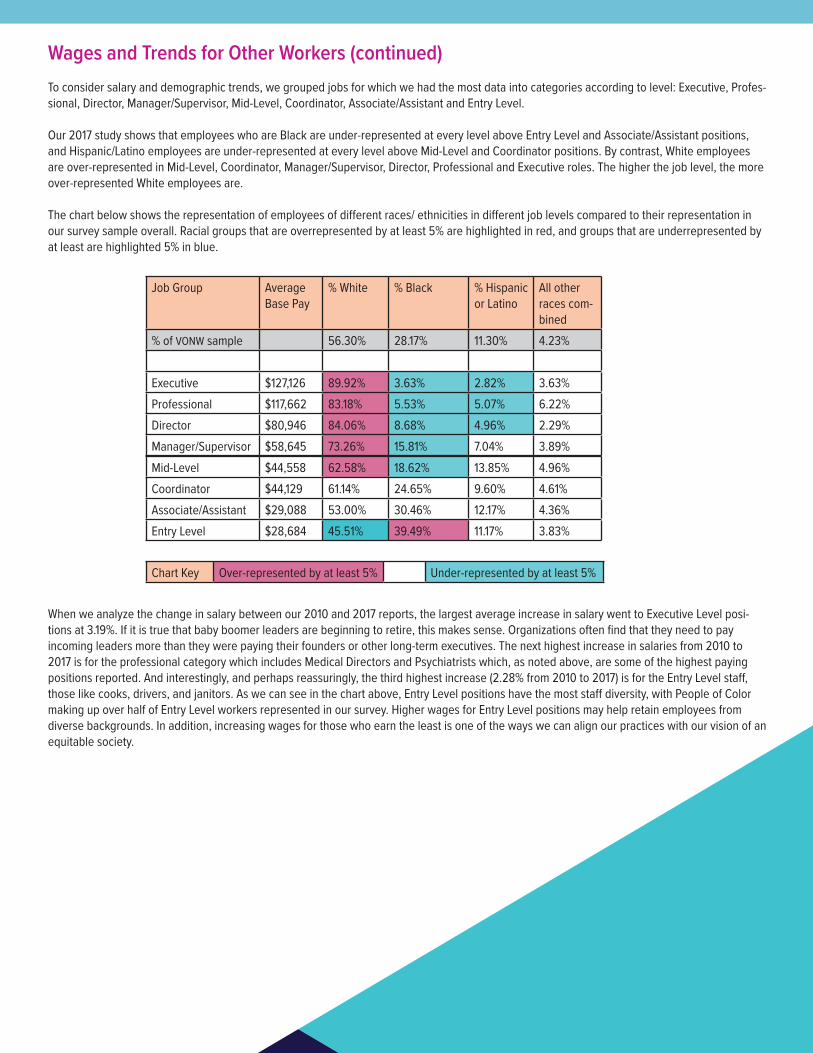
Wages and Trends for Other Workers (continued)To consider salary and demographic trends, we grouped jobs for which we had the most data into categories according to level: Executive, Profes-sional, Director, Manager/Supervisor, Mid-Level, Coordinator, Associate/Assistant and Entry Level.
Our 2017 study shows that employees who are Black are under-represented at every level above Entry Level and Associate/Assistant positions, and Hispanic/Latino employees are under-represented at every level above Mid-Level and Coordinator positions. By contrast, White employees are over-represented in Mid-Level, Coordinator, Manager/Supervisor, Director, Professional and Executive roles. The higher the job level, the more over-represented White employees are.
The chart below shows the representation of employees of different races/ ethnicities in different job levels compared to their representation in our survey sample overall. Racial groups that are overrepresented by at least 5% are highlighted in red, and groups that are underrepresented by at least are highlighted 5% in blue.
When we analyze the change in salary between our 2010 and 2017 reports, the largest average increase in salary went to Executive Level posi-tions at 3.19%. If it is true that baby boomer leaders are beginning to retire, this makes sense. Organizations often find that they need to pay incoming leaders more than they were paying their founders or other long-term executives. The next highest increase in salaries from 2010 to 2017 is for the professional category which includes Medical Directors and Psychiatrists which, as noted above, are some of the highest paying positions reported. And interestingly, and perhaps reassuringly, the third highest increase (2.28% from 2010 to 2017) is for the Entry Level staff, those like cooks, drivers, and janitors. As we can see in the chart above, Entry Level positions have the most staff diversity, with People of Color making up over half of Entry Level workers represented in our survey. Higher wages for Entry Level positions may help retain employees from diverse backgrounds. In addition, increasing wages for those who earn the least is one of the ways we can align our practices with our vision of an equitable society.
Job Group Average Base Pay
% White % Black % Hispanic or Latino
All other races com-bined
% of VONW sample 56.30% 28.17% 11.30% 4.23%
Executive $127,126 89.92% 3.63% 2.82% 3.63%Professional $117,662 83.18% 5.53% 5.07% 6.22%Director $80,946 84.06% 8.68% 4.96% 2.29%Manager/Supervisor $58,645 73.26% 15.81% 7.04% 3.89%Mid-Level $44,558 62.58% 18.62% 13.85% 4.96%Coordinator $44,129 61.14% 24.65% 9.60% 4.61%Associate/Assistant $29,088 53.00% 30.46% 12.17% 4.36%Entry Level $28,684 45.51% 39.49% 11.17% 3.83%
Chart Key Over-represented by at least 5% Under-represented by at least 5%

12 Wage Equity Matters
Diversity in the Leadership PipelineTo increase the diversity of EDs/CEOs and other senior leadership roles, nonprofits need to pay attention to the leadership pipeline, both within their organization and in the sector as a whole. But as baby boomers are retiring and boards are looking for new leadership, many nonprofits do not feel they have people prepared to move into leadership roles. The Leadership New England data shows a sharp underinvestment in leader-ship development by nonprofits in the region. The report cites that only one-third of leaders and board members said their organizations have enough people who are ready to step into leadership roles when needed—those who do invest in professional development were significantly more likely to think their organizations have enough bench strength. It also indicates only half (54%) of leaders said their organizations budget for professional development of staff.11 Having diverse, highly prepared professionals at all levels of nonprofit organizations ensures that the sector will be ready to handle the transitions of executives and other senior staff.
Typically, the private sector has hired internal candidates into leadership positions at higher rates than the nonprofit sector. The benefit is clear; internal applicants understand an organization’s work and culture, they have relationships with key staff and constituents and they can hit the ground running.
Taking into account the cost to hire and the time it takes to get up to speed, external hires are more expensive than internal hires. A 2014 Harvard Business Review piece points to research in corporate settings that indicates outside hires take twice as long to ramp up as leaders promoted from within. And in that sector, only one of five executives hired from outside are considered high performers. Forty percent (40%) of them fail within their first 18 months.12 In the nonprofit sector, only 30% of open C-suite positions over a two year period were filled by an internal candidate.13 If the nonprofit sector experiences a failure rate that is even close to that of the private sector, the cost of replacing departing leaders with external candidates is significant.
It is important to understand why leaders leave in the first place. “The top reason for leaving was low compensation (57% reported it), nearly as important was frustration with lack of professional development opportunities, which half of the respondents cited as their reason for departure.”14
To take advantage of the benefits of internal leadership hires, organizations will need to be creative in building pathways to leadership and professional development with an intentional approach to retention of staff from diverse backgrounds. Since our sample of the region’s nonprofits has a higher percentage of staff who are Black than our region’s workforce overall, this approach provides a natural pipeline of diverse candi-dates for vacant leadership roles.15 Whether promoting internally or recruiting talent from other parts of the sector, the diversity at different job levels in nonprofit organizations will affect the possibilities of diversifying the sector’s leadership.
In the past two years, only 30% of open C-suite positions in the non-profit sector were filled by an inter-nal candidate (the rate at for-profits is 60% of positions).

www.tsne.org 13
We know that nonprofit managers, directors, executives and board members are less diverse groups than the nonprofit workforce overall. They are also the people responsible for decisions about hiring and promotions. In relation to executive hiring, other national data indicates that 90% of board chairs and 84% of board members are White, which matches closely with the 90% of CEOs who are White.16 The tendency is for people to hire those they perceive as similar to themselves. The Race to Lead report found that despite similar levels of preparation, People of Color were more likely to feel they needed to develop additional technical and management skills. In focus groups, the researchers found, “People of Color feel that they need twice the degrees for the same position as compared to their White colleagues.”17 Organizations will need to make an ongoing commitment to understand and counteract the effects of implicit bias in order to increase leadership diversity. We need to consider important questions about increasing equity in the hiring and promotion process and how to create more paths to professional development.
Respondents in the Race to Lead survey agreed/strongly agreed that executive recruiters don’t do enough to find a diverse pool of qualified candidates for top-level nonprofit positions (80% POC vs 67% whites), predominantly white boards often don’t support the leadership potential of staff of color (71% POC vs 62% whites), and organizations often rule out candidates of color based on the perceived ‘fit’ with the organization (66% POC vs 48%). This last question often reflects implicit bias.18
In addition, low wages in the sector may be reducing the pipeline of future leaders, particularly leaders of color, at the very moment we need it most. If nonprofits can’t offer a livable wage to the staff in those lower job levels, staff may need to leave the organization or the sector in order to meet their basic needs and financial goals. In the Race to Lead report, when survey respondents were asked about reasons they were not inter-ested in pursuing leadership in the nonprofit sector, 21% of respondents who are People of Color, compared to 10% of White people, responded that they were pursuing opportunities outside the nonprofit sector.19

14 Wage Equity Matters
What Hasn’t Changed: We (still) don’t pay enoughThe good news is that the number of employees represented in these studies earning less than $28,000 annually is steadily decreasing. In 2017 that number is 33%. In comparison, 43% earned less than $28,000 in 2014 and 51% earned less than $28,000 in 2010. The bad news is that $28,000 buys less than ever. Because of inflation, a worker in December 2016 would need to earn $31,000 to have equivalent buying power as a worker who earned a $28,000 salary in July 2010.20 Among employees whose pay is reported in the 2017 survey, 44% are paid less than $31,000 per year. So, in fact, we haven’t really made any progress since 2014.
Consider the implications for these employees. The chart below shows that paying for housing in Boston costs $19,032 for an individual living in a one bedroom apartment and $11,442 for someone sharing a 2 bedroom apartment and splitting utilities with a roommate. Even in Hartford, CT or Providence, RI, housing costs for someone living alone will consume around 34% of a $31,000 income. $31,000 is a somewhat more livable wage for a Hartford or Providence-based nonprofit employee sharing a two bedroom home. However, factoring in child care, which ranges on average from $12,075 per year in Providence to $16,430 in Boston, student loan payments of an average annual payment of $3,360, or both, makes it clear that $31,000 isn’t a livable wage in any of these cities.21 With a higher proportion of the workers in the lower levels and lowest paid roles being Black and Hispanic/La-tino employees, we know that these inadequate wages particularly affect nonprofit employees who are People of Color.
Annual cost 1 bedroom with utilities 1/2 of 2 bedroom with shared utilities
Boston $ 16,740 $ 19,032 $ 10,296 $ 11,442 Hartford $ 10,884 $ 13,176 $ 6,798 $ 7,944 Providence $ 10,392 $ 12,684 $ 6,282 $ 7,428
Perhaps more alarming is the conversation we had recently with staff of a human services agency in the region. In the course of conducting focus groups about organizational values and compensation, we learned that a significant portion of direct care staff earned so little that they qualified for the very services they were providing to clients. No one was proud of this or thought it was consistent with their values. But because of the way state funds are allocated, their hands were tied. In fact, an employee in Massachusetts or Rhode Island who earns $31,000 or less and is the sole income earner in a one- or two-person household would be eligible for some forms of public assistance.22
One hundred and fifty-four (154) of the 342 organizations participating in this study identified their field of service as child and youth services and advocacy; elderly and disabled services and advocacy; food programs and pantries, nutrition, agriculture; or community and economic develop-ment. It is likely that most, if not all of these groups are striving to provide clients and constituents with tools and resources to transition from poverty to stability. And it is fair to say that most organizations represented by this survey would stand in support of that goal. And yet a third of our workforce is paid so little they themselves may be considered working poor and unable to make the gains we seek for those we serve.
What this means for the futureIf we continue to fail to address low wages and the racial inequities in pay and leadership, nonprofits risk losing credibility. By paying sub-par wages while defending workers’ rights or advocating for an increase in the minimum wage, we expose ourselves to being called hypocritical. When the public interest group US PIRG opposed the Department of Labor’s ruling that would require employers to pay overtime wages to staff earning less than $47,500, they immediately become the subject of immense criticism. The Nonprofit Quarterly referred to their position as “bi-zarre,” “head-scratching,” and reflective of a “special brand of chutzpah.”23 But, in the larger picture, paying low wages is endemic in our sector.
We are at a critical juncture. Long-time leaders are leaving. A new generation is emerging who does not necessarily equate living their values, passions and ideals with working in a nonprofit. The growth of the innovation sector and companies purporting to ‘do well by doing good’ means more competition for talented people looking for meaningful work. As a 2016 piece in Fast Company points out, “Millennials do not recognize the walls between sectors. They are pursuing social impact wherever they are… It’s almost as if there never had been an assumption that driving social change was only the job of the social sector.”24 While this may be good news for society overall, this shift could pose long-term challenges for recruitment to the nonprofit sector.
As long as nonprofits play a role in addressing society’s most pressing social issues, mission-focused groups must operate in a way that reflects the vision they hold for the world outside of their office walls. That may mean making hard choices about how we accomplish our goals and priori-tizing adequately compensating workers. When we underpay employees we misrepresent the true cost of doing this work. As long as we do the work for less than it would otherwise cost a government agency, philanthropic organization, or for-profit entity, there is actually a disincentive to consider any other model. If the nonprofit sector continues to do more with less, especially less money for our workers, we end up perpetuating poverty and inequality in our society.

www.tsne.org 15
Call to ActionWe know most nonprofits are resource constrained, trying to tackle some of our society’s most difficult problems with limited funding. Still, with careful analysis and creative problem solving, organizations can improve equity and move closer to paying a livable wage. Some organizations like Rainier Valley Corps (RVC) have put much thought into equity and pay issues for their staff and how to align their compensation practices more closely with their organization’s goals and values. RVC knows that nonprofit work is fulfilling but “lowered wages that demand employees trade mission for cash lead to burnout, turnover, and sector departure [and] reduce the pool of qualified applicants, shorting our programs of needed skills and experience.”25 After thorough research on what constituted a living wage in their city, RVC rolled their year-end bonuses into their hourly pay, while also reducing employees’ expenses by increasing some key benefits. They acknowledge the difficult tradeoffs required to achieve adequate pay levels and plan to reassess their decisions as needed. Nonetheless, RVC strives to align their compensation system with their organizational values.
These decisions aren’t easy and always involve tradeoffs. Because of the budget constraints nonprofit organizations face, raising pay or increas-ing benefits may mean hiring fewer staff or scaling back service delivery. In the face of the dire needs in our society, these may not seem like acceptable options. However, as a sector, we must recognize that high turnover among nonprofit workers also has a significant cost. This cost is not only financial, but also social, resulting in reduced service quality and weaker relationships with our constituents.
The issues our nonprofit organizations are trying to address are complex and persistent. And yet it sometimes appears we are trying to address them using a crisis approach. We need to look at the long-term and systemic implications of our strategies. Are nonprofit employment practices worsening problems like economic inequity and insecurity that many of our organizations are trying to combat? Are we burning out our staff and pushing them out of the sector, instead of cultivating their skills? If we could improve pay, benefits, and quality of life for nonprofit employees, we might retain more of the brilliant and diverse workers in our sector. Our organizations and the communities we serve would benefit from their leadership and life experience.
As our nation’s population ages, our sector continues to experience a rising demand for direct service roles, many of which are entry and assistant level positions. Our region’s nonprofits already have diverse talent in these job levels. What can we do to make these positions an on-ramp to our sector instead of a revolving door?
Assess the full compensation packageBecause employers provide both compensation and benefits, it makes sense to assess them together. In addition to salary, employers can con-sider the value that other benefits have to their staff, including insurance, retirement plan contributions, paid time off, transportation assistance, etc. Quality of life for nonprofit professionals also includes factors such as flexibility and the number of hours in a full-time week. Communicate with and listen to staff to understand their needs and priorities, and what changes would be most beneficial to their well-being. Keep in mind that different employees will likely have different preferences and priorities given their personal situation. For example, their health insurance needs may depend on whether they have children. The value they place on transportation benefits may depend on how they get to work. It likely won’t be possible to meet everyone’s needs and preferences, so remember to assess the effects on equity when implementing compensation and benefits changes.
Invest in professional developmentInvesting in the professional development of staff at all levels is an important way to support their readiness to take on increased responsibility and leadership positions. As the Leadership New England data makes apparent, organizations that invest in professional development are much more likely to believe that internal staff are prepared to move into leadership roles.26
Professional development can take many forms, from internal trainings, funding to pursue outside courses, cross-training across roles or depart-ments, opportunities to present to community partners or at conferences, and completing stretch assignments. A strong culture of supervision and organizational values around learning will support these efforts. Organizational leaders and supervisors need to encourage learning through action and reflection. Part of creating a culture that fosters learning is recognizing that developing leaders will make mistakes, and create support systems that allow staff to continually reflect and improve.
Committing to the professional development of staff also shows that an organization values them as people and sees their potential to learn and grow. Demonstrating this faith in employees boosts morale and may encourage people to be more productive or stay longer.

16 Wage Equity Matters
Call to Action (continued)Dismantle the overhead mythBy paying staff a more livable wage, nonprofits help adjust the expectations of funders and donors about the true cost of the work. Over time, nonprofits can work to dismantle the myth that low overhead is an absolute good. Organizations including Fund the People, GuideStar, BBB Wise Giving Alliance, and Charity Navigator are advocating for this shift in thinking. They are encouraging donors and funders to assess organizations based on impact rather than overhead ratios, and to invest in staff development and organizational capacity building.27 The nonprofit and philan-thropic sectors need to shed the mentality that paying nonprofit staff as little as possible is a sign of organizational fiscal responsibility. Fair and equitable wages will make nonprofit work a viable career path and help our sector attract the workers we need to achieve our missions.
Recognize and combat implicit biasImplicit bias shows up in many places, and organizations need to be aware of its effects and implement measures to combat it. In hiring pro-cesses, recruiting more broadly, beyond known networks, can increase the diversity of the candidate pool. Strong EEO and culture statements can send an encouraging message to diverse applicants. However, they are only truly useful when backed by organizational commitments and prac-tices. The Harvard Business Review conducted studies that show candidates of color are in fact less likely to “whiten” their resumes in response to job ads which mention valuing diversity. However, even organizations that explicitly mentioned diversity in job postings called back more than twice as many candidates of color with whitened versions of their resume. So unless “pro-diversity statements” are backed by intentional prac-tices to counter implicit bias, they can do more harm than good.28
There are other things employers can do, such as removing identifying information from resumes before screening them. Organizations can also implement a policy of not proceeding with candidate selection until they have a certain level of diversity among their qualified candidate pool. These steps can increase the likelihood of hiring qualified candidates of color. Anyone involved in hiring processes should be trained on what implicit bias is and how to avoid it, and interview processes should be designed to reduce the opportunities for implicit bias to influence decision making. When hiring Executive Directors, nonprofit boards should be sure to ask prospective search firms about their experience and past level of success recruiting diverse pools of qualified candidates.29
Organizations should consider publishing starting salary ranges in job listings, and implementing other measures to reduce pay disparities.30 Clearly defining how salaries are set can reduce inequities, since men are more likely to negotiate salary than women. Also, although research has shown that Black job seekers negotiated comparably to White job seekers, employers expected Black candidates to negotiate less, and thus perceived Black job seekers as pushier. As a result, the Black candidates received lower starting salaries.31 Limiting salary negotiation can thus limit gender and racial pay disparities. Less room for employer discretion means less potential for implicit bias to affect decisions. The Massa-chusetts Act to Establish Pay Equity will go into effect in July 2018, prohibiting employers from asking for salary history before making a job offer. Employers in other states could choose to adopt the same practice. Asking salary history perpetuates pay inequity because it allows employers to continue to pay marginalized people less just because their previous employers did.
Another important measure is assessing performance evaluation and salary increase processes for implicit bias. Organizations should conduct regular salary audits for outliers and consistency. Evaluation of compensation levels should factor in organizational values and market data, like that provided by the VONW report, to determine an appropriate compensation structure.
Proactively address racial equity issuesThe Race to Lead report illuminates that People of Color are frustrated by the expectation to represent a community in a way that many fewer White staff members are called to do. One respondent wrote “[the organization] looked to me to solve all the problems with racism within the organization. By default, People of Color often become the face of accountability or point of feedback in such situations. It put a huge responsi-bility on me; over time, I spent at least 50% of my time doing that work…rather than my job description…A lot of my work was invisible.”32 When considering what work people do for our organizations, we need to account for the work staff put in to educating others within the organization about race, diversity and inclusion issues. This work is often not included in job descriptions, and not compensated. To reduce this burden, White leaders and staff members need to proactively address issues of race and equity within their organization’s culture and operations. Instead of waiting until People of Color bring up racial equity, White people need to take initiative to engage with these issues.
Looking toward the futureOur nonprofit sector is full of smart, committed people taking on our society’s most pressing and persistent issues. We can use the skill and dedi-cation of our diverse workforce, and the growing body of research on racial disparities, to transform the way our nonprofit sector functions. It will not be easy, but it is within our power to create the kind of equity within our organizations that we would like to see in the world.

www.tsne.org 17
Endnotes
1. Hez G. Norton and Deborah S. Linnell. Leadership New England: Essential Shifts for a Thriving Nonprofit Sector, 15. 2. Sean Thomas-Breitfeld and Frances Kunreuther. Race to Lead: Confronting the Nonprofit Racial Leadership Gap, 14.3. The full list of racial/ethnic groups included in our survey is as follows: American Indian/ Alaska Native; Asian; Black; Hispanic/ Latino; Native Hawaiian/ Pacific Islander; White; Mixed Race; Other.4. https://independentsector.org/about/the-charitable-sector/5. http://www.afpnet.org/ethics/ethicsarticledetail.cfm?itemnumber=7346. https://www.bls.gov/lau/table14full16.pdf7. https://www.boston.com/jobs/untagged/2013/12/23/in-the-year-2016-the-30-fastest-growing-jobs8. http://www.businessinsider.com/how-much-salary-does-a-doctor-make-2015-49. Leadership New England, 26.10. https://www.bls.gov/ooh/business-and-financial/financial-analysts.htm11. Leadership New England, 11.12. https://hbr.org/2014/01/for-senior-leaders-fit-matters-more-than-skill13. https://hbr.org/2015/12/nonprofits-cant-keep-ignoring-talent-development14. https://hbr.org/2015/12/nonprofits-cant-keep-ignoring-talent-development 15. https://www.bls.gov/lau/table14full16.pdf16. Leading with Intent: 2017 National Index of Board Practices, 10.17. Race to Lead, 11.18. Race to Lead, 16.19. Race to Lead, 9.20. https://data.bls.gov/cgi-bin/cpicalc.pl21. http://www.bestplaces.net/compare-cities (rent)https://www.expatistan.com/cost-of-living (utilities)https://www.bostonglobe.com/2014/07/02/map-the-average-cost-for-child-care-state/LN65rSHXKNjr4eypyxT0WM/story.html (child care)http://www.cicmoney101.org/Articles/Budgeting-for-Student-Loan-Repayment.aspx (student loans)22. https://www.benefits.gov/benefits/benefit-details/1280 (MA SNAP)https://www.benefits.gov/benefits/benefit-details/1576 (MA heating assistance)https://www.benefits.gov/benefits/benefit-details/1236 (CT SNAP)https://www.benefits.gov/benefits/benefit-details/1552 (CT heating assistance)https://www.benefits.gov/benefits/benefit-details/1336 (RI SNAP)https://www.benefits.gov/benefits/benefit-details/1572 (RI heating assistance)23. https://nonprofitquarterly.org/2016/11/18/nonprofit-wage-ghettos/24. https://www.fastcompany.com/3060085/millennials-are-reshaping-the-world-of-social-impact25. https://rainiervalleycorps.org/2017/07/take-achieve-living-wage-seattle/26. Leadership New England, 11.27. Leadership New England, 40. http://overheadmyth.com/ http://www.fundthepeople.org/28. https://hbr.org/2016/03/the-unintended-consequences-of-diversity-statements29. https://hbr.org/2017/06/7-practical-ways-to-reduce-bias-in-your-hiring-process30. https://hbr.org/2014/12/what-hr-can-do-to-fix-the-gender-pay-gap31. https://hbr.org/2017/06/7-practical-ways-to-reduce-bias-in-your-hiring-process32. Race to Lead, 14.

18 Wage Equity Matters
Notes

www.tsne.org 19
Notes

©2018 by TSNE MissionWorks. All rights reserved.