Embed Size (px)
Citation preview
GLOBAL WAGE REPORT 2016/17WAGE INEQUALITY IN THE WORKPLACE
Daniel Kostzer
Senior Regional Wages Specialist,
ILO
1 Global Wage Report 2016/17
Part I: Major Trends in Wages
• Global trends
• Wages, productivity and labour shares
Part II: Wage Inequality in the Workplace
• The extent of wage inequality
• Within & between enterprises
• Gender pay gaps
Part III: Summary & Conclusion
Outline
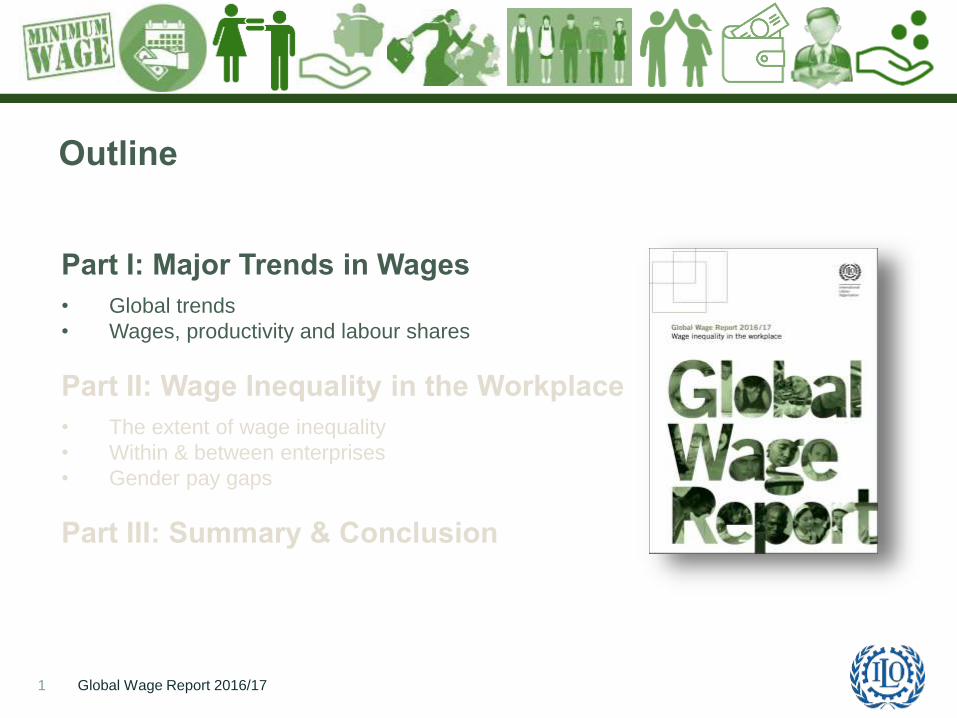
There is growing recognition that wage trends have
been problematic in many countries …
Global Wage Report 2016/172
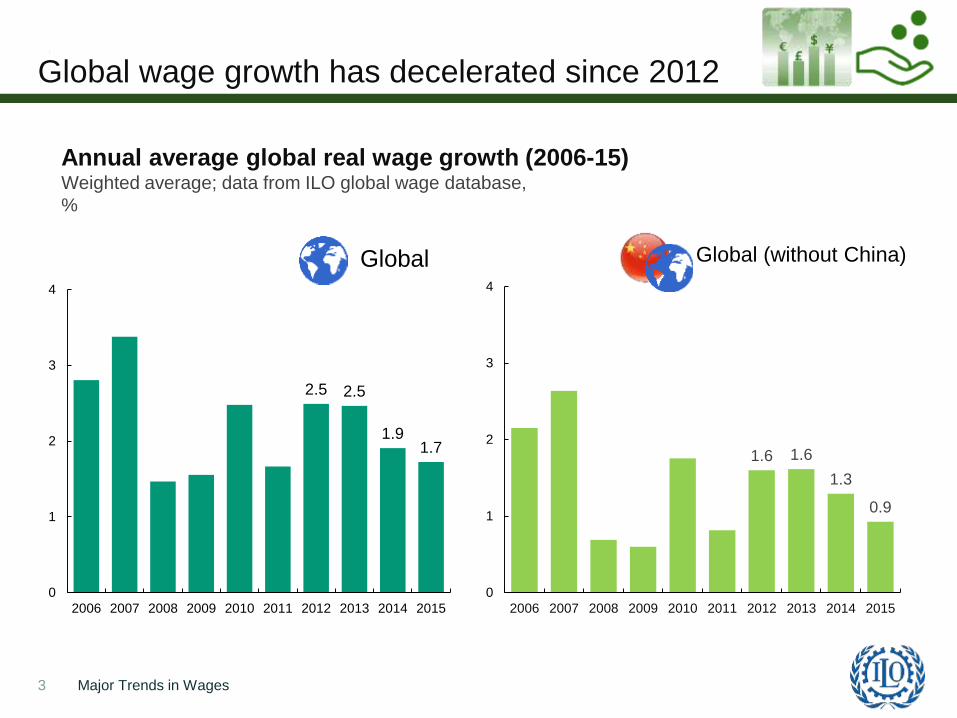
2.5 2.5
1.91.7
0
1
2
3
4
2006 2007 2008 2009 2010 2011 2012 2013 2014 2015
Global
1.6 1.6
1.3
0.9
0
1
2
3
4
2006 2007 2008 2009 2010 2011 2012 2013 2014 2015
Global (without China)
Global wage growth has decelerated since 2012
Major Trends in Wages3
Annual average global real wage growth (2006-15)Weighted average; data from ILO global wage database,
%
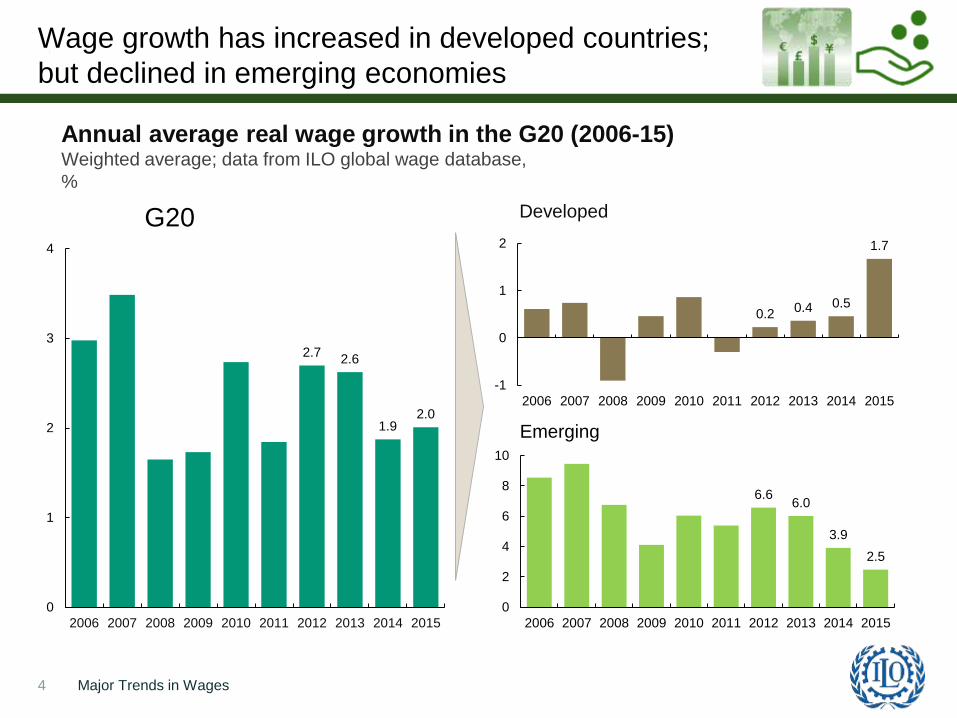
6.66.0
3.9
2.5
0
2
4
6
8
10
2006 2007 2008 2009 2010 2011 2012 2013 2014 2015
Emerging
Wage growth has increased in developed countries;
but declined in emerging economies
Major Trends in Wages4
Annual average real wage growth in the G20 (2006-15)Weighted average; data from ILO global wage database,
%
2.72.6
1.92.0
0
1
2
3
4
2006 2007 2008 2009 2010 2011 2012 2013 2014 2015
G20
0.20.4 0.5
1.7
-1
0
1
2
2006 2007 2008 2009 2010 2011 2012 2013 2014 2015
Developed
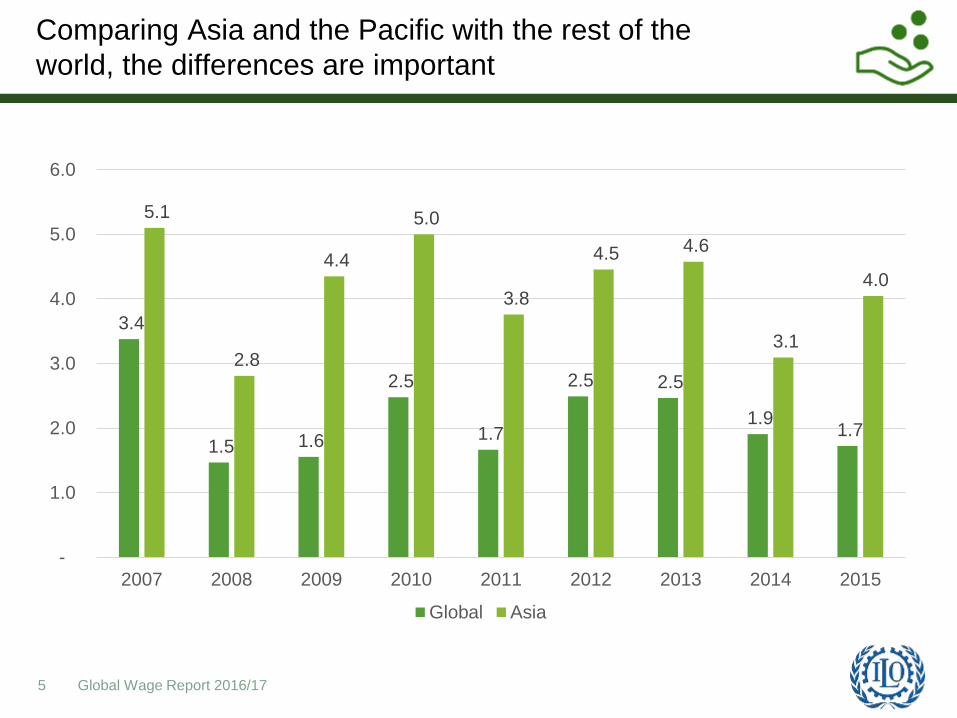
Comparing Asia and the Pacific with the rest of the
world, the differences are important
Global Wage Report 2016/175
3.4
1.5 1.6
2.5
1.7
2.5 2.5
1.9 1.7
5.1
2.8
4.4
5.0
3.8
4.5 4.6
3.1
4.0
-
1.0
2.0
3.0
4.0
5.0
6.0
2007 2008 2009 2010 2011 2012 2013 2014 2015
Global Asia
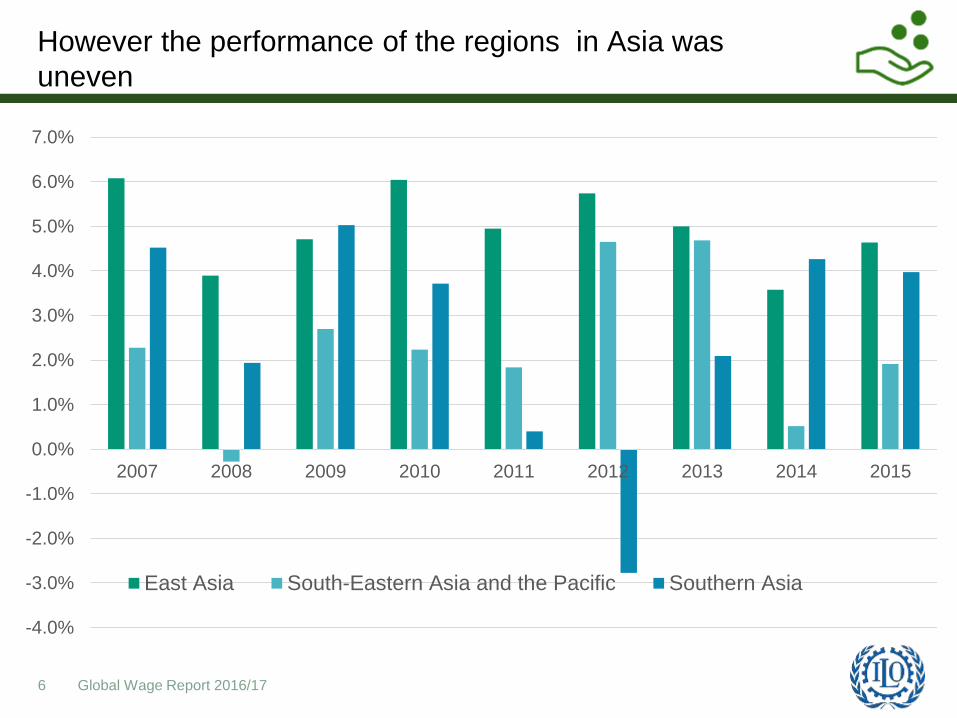
However the performance of the regions in Asia was
uneven
Global Wage Report 2016/176
-4.0%
-3.0%
-2.0%
-1.0%
0.0%
1.0%
2.0%
3.0%
4.0%
5.0%
6.0%
7.0%
2007 2008 2009 2010 2011 2012 2013 2014 2015
East Asia South-Eastern Asia and the Pacific Southern Asia
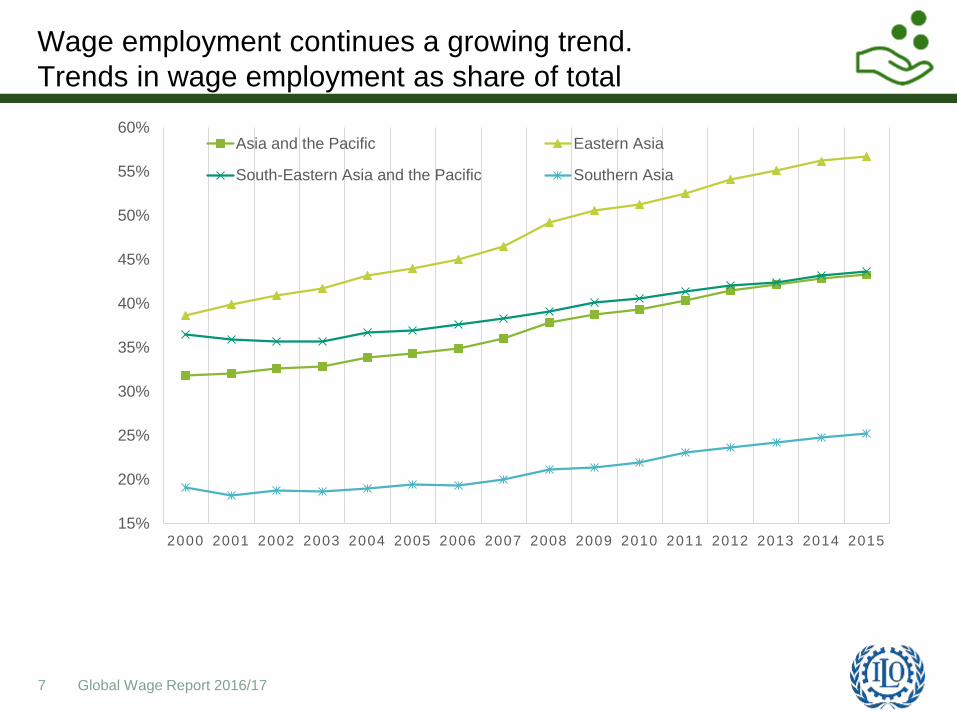
Wage employment continues a growing trend.
Trends in wage employment as share of total
Global Wage Report 2016/177
15%
20%
25%
30%
35%
40%
45%
50%
55%
60%
2000 2001 2002 2003 2004 2005 2006 2007 2008 2009 2010 2011 2012 2013 2014 2015
Asia and the Pacific Eastern Asia
South-Eastern Asia and the Pacific Southern Asia
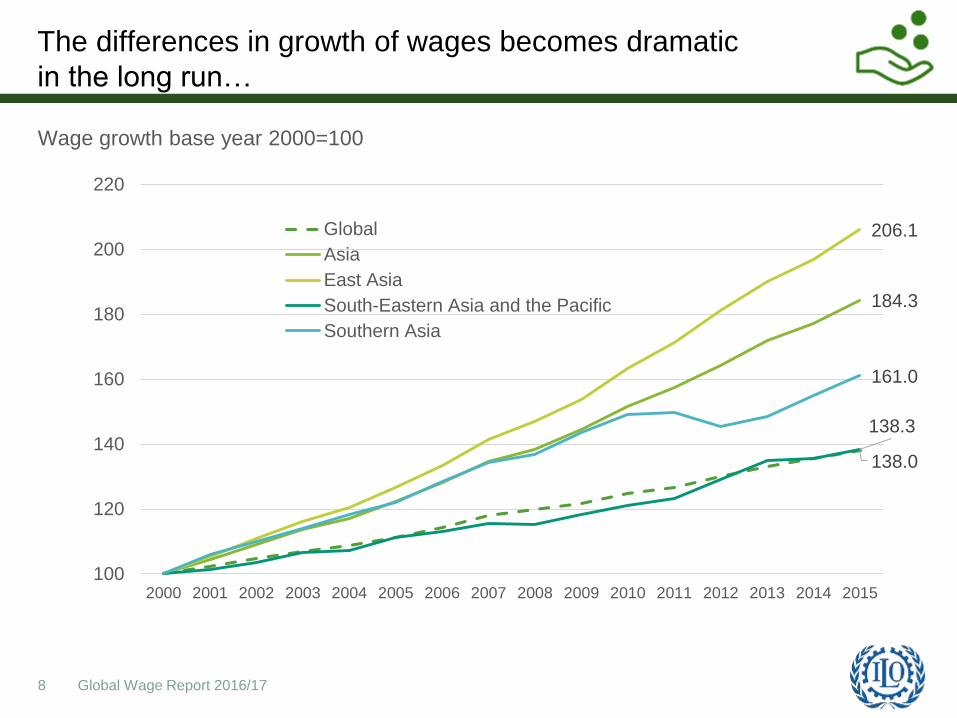
The differences in growth of wages becomes dramatic
in the long run…
Global Wage Report 2016/178
Wage growth base year 2000=100
138.0
184.3
206.1
138.3
161.0
100
120
140
160
180
200
220
2000 2001 2002 2003 2004 2005 2006 2007 2008 2009 2010 2011 2012 2013 2014 2015
Global
Asia
East Asia
South-Eastern Asia and the Pacific
Southern Asia
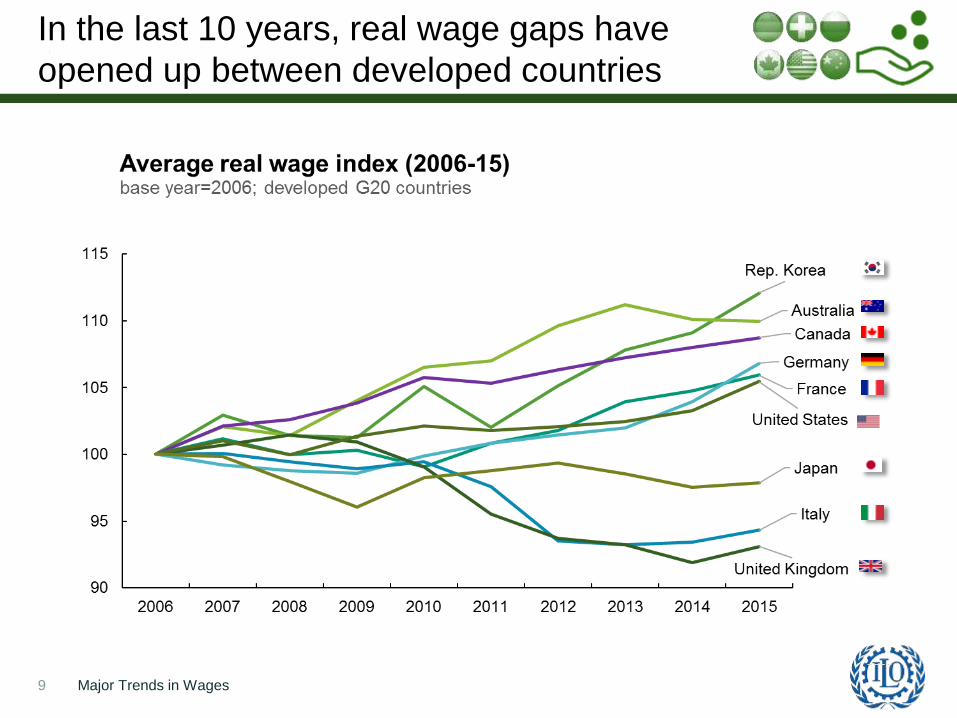
In the last 10 years, real wage gaps have
opened up between developed countries
Major Trends in Wages9
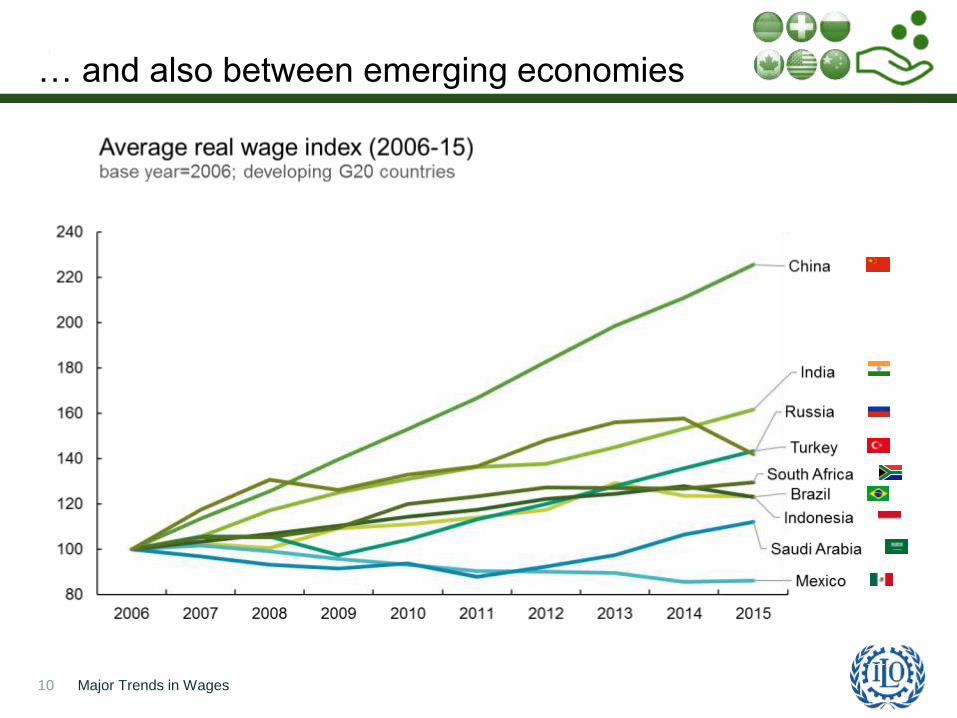
… and also between emerging economies
Major Trends in Wages10
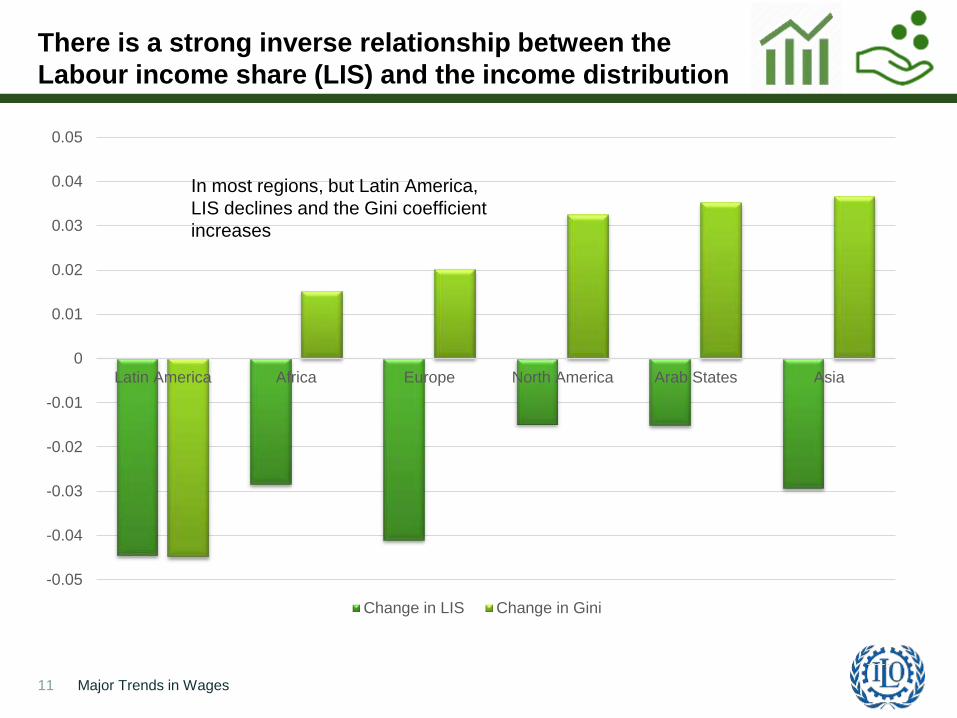
There is a strong inverse relationship between the
Labour income share (LIS) and the income distribution
Major Trends in Wages11
-0.05
-0.04
-0.03
-0.02
-0.01
0
0.01
0.02
0.03
0.04
0.05
Latin America Africa Europe North America Arab States Asia
Change in LIS Change in Gini
In most regions, but Latin America,
LIS declines and the Gini coefficient
increases
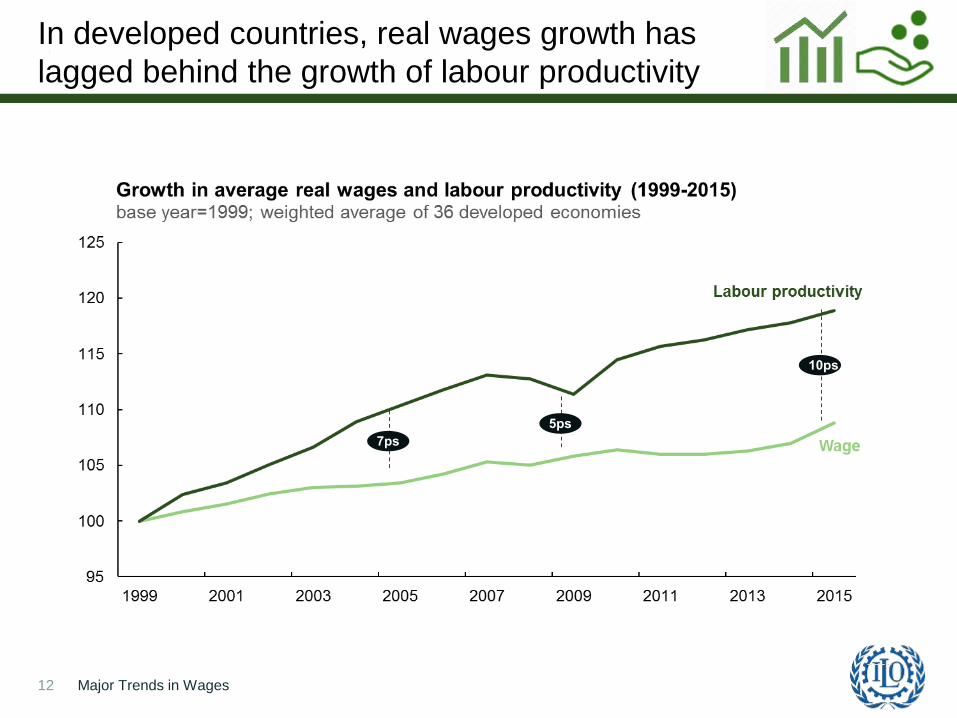
In developed countries, real wages growth has
lagged behind the growth of labour productivity
Major Trends in Wages12
7ps
5ps
10ps
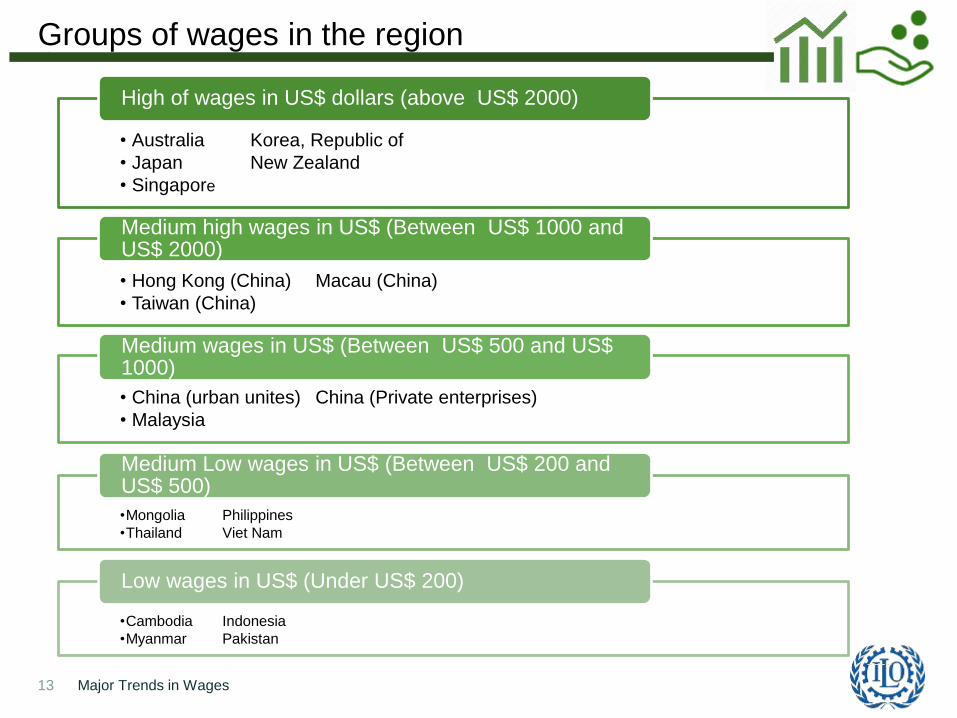
Groups of wages in the region
Major Trends in Wages13
• Australia Korea, Republic of
• Japan New Zealand
• Singapore
High of wages in US$ dollars (above US$ 2000)
• Hong Kong (China) Macau (China)
• Taiwan (China)
Medium high wages in US$ (Between US$ 1000 and US$ 2000)
• China (urban unites) China (Private enterprises)
• Malaysia
Medium wages in US$ (Between US$ 500 and US$ 1000)
•Mongolia Philippines
•Thailand Viet Nam
Medium Low wages in US$ (Between US$ 200 and US$ 500)
•Cambodia Indonesia
•Myanmar Pakistan
Low wages in US$ (Under US$ 200)
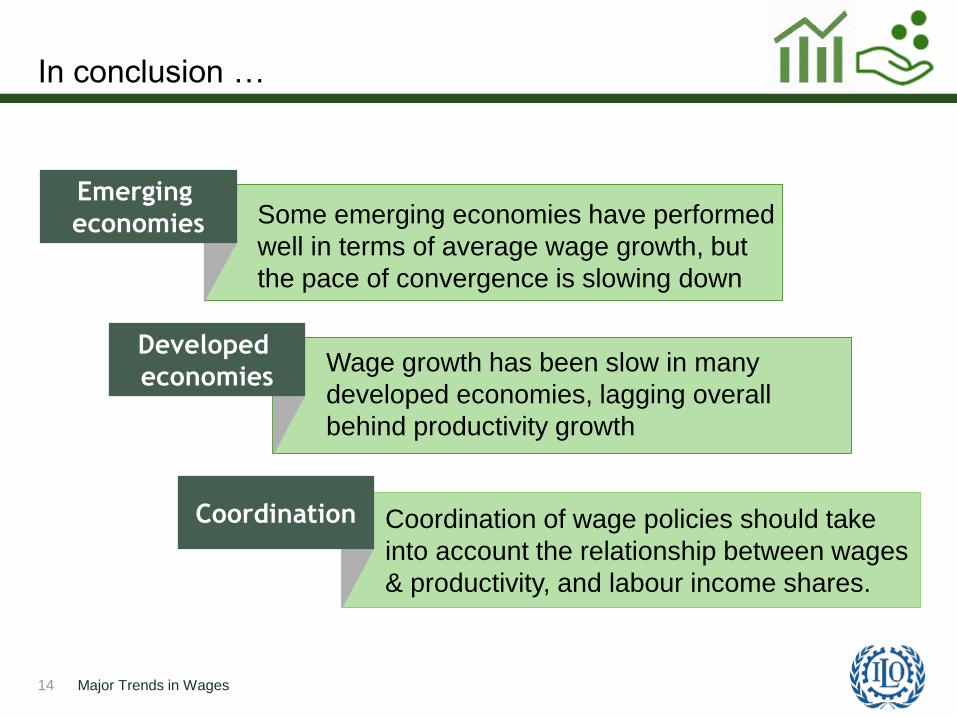
Coordination of wage policies should take
into account the relationship between wages
& productivity, and labour income shares.
In conclusion …
14 Major Trends in Wages
Emerging
economies Some emerging economies have performed
well in terms of average wage growth, but
the pace of convergence is slowing down
Developed
economiesWage growth has been slow in many
developed economies, lagging overall
behind productivity growth
Coordination
15 Global Wage Report 2016/17
Part I: Major Trends in Wages
• Global trends
• Wages, productivity and labour shares
Part II: Wage Inequality in the Workplace
• The extent of wage inequality
• Within & between enterprises
• Gender pay gaps
Part III: Summary & Conclusion
Outline
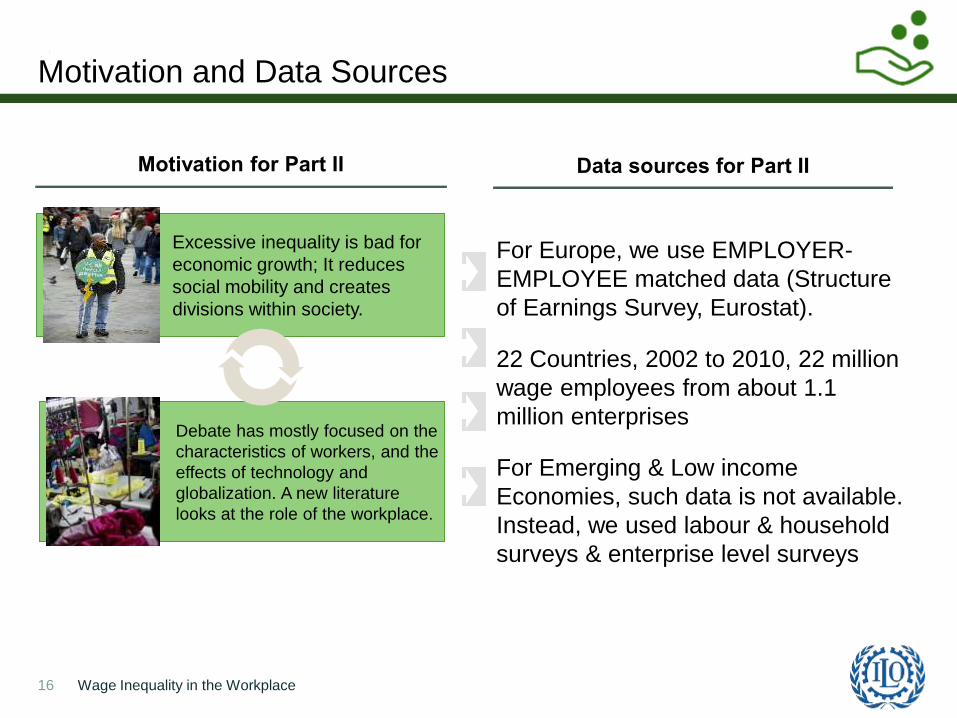
Motivation and Data Sources
16 Wage Inequality in the Workplace
Motivation for Part II
Debate has mostly focused on the
characteristics of workers, and the
effects of technology and
globalization. A new literature
looks at the role of the workplace.
Excessive inequality is bad for
economic growth; It reduces
social mobility and creates
divisions within society.
For Europe, we use EMPLOYER-
EMPLOYEE matched data (Structure
of Earnings Survey, Eurostat).
22 Countries, 2002 to 2010, 22 million
wage employees from about 1.1
million enterprises
For Emerging & Low income
Economies, such data is not available.
Instead, we used labour & household
surveys & enterprise level surveys
Data sources for Part II
0.5 0.8
1.0 1.3 1.5 1.7 1.9 2.2
2.5 3.1
4.7
12.5
0
2
4
6
8
10
12
14
1st 2nd-10th 2nd 3rd 4th 5th 6th 7th 8th 9th 91st -99th
100th
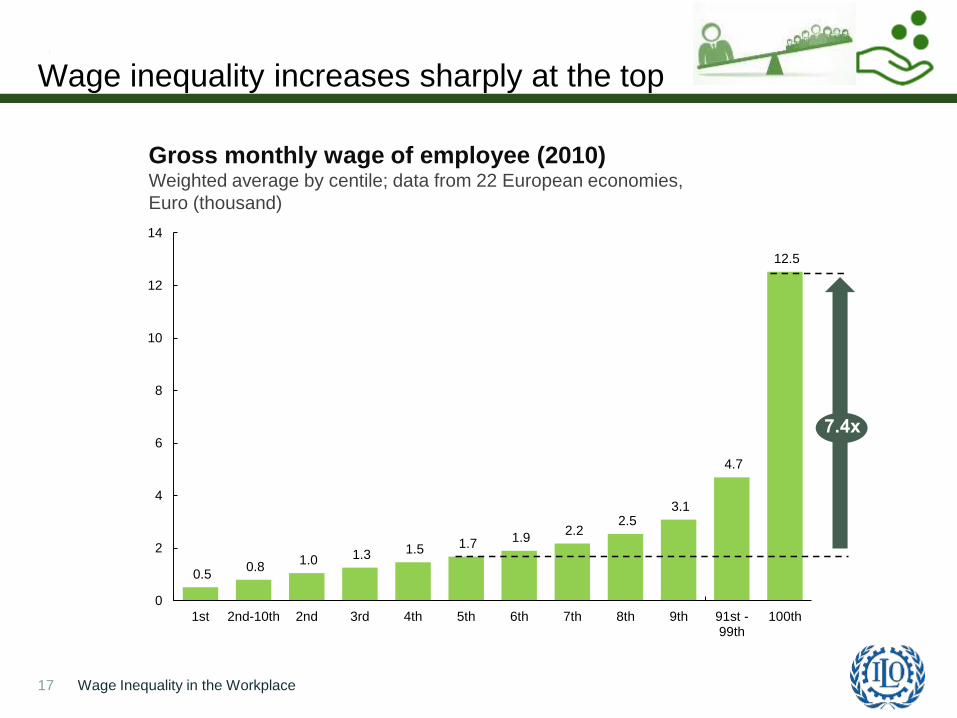
Wage inequality increases sharply at the top
Wage Inequality in the Workplace17
Gross monthly wage of employee (2010)Weighted average by centile; data from 22 European economies,
Euro (thousand)
7.4x
16
71
0
20
40
60
80
100
Finland
9
56
0
20
40
60
80
100
Spain
0
20
40
60
80
100
United Kingdom
14
91
0
20
40
60
80
100
France
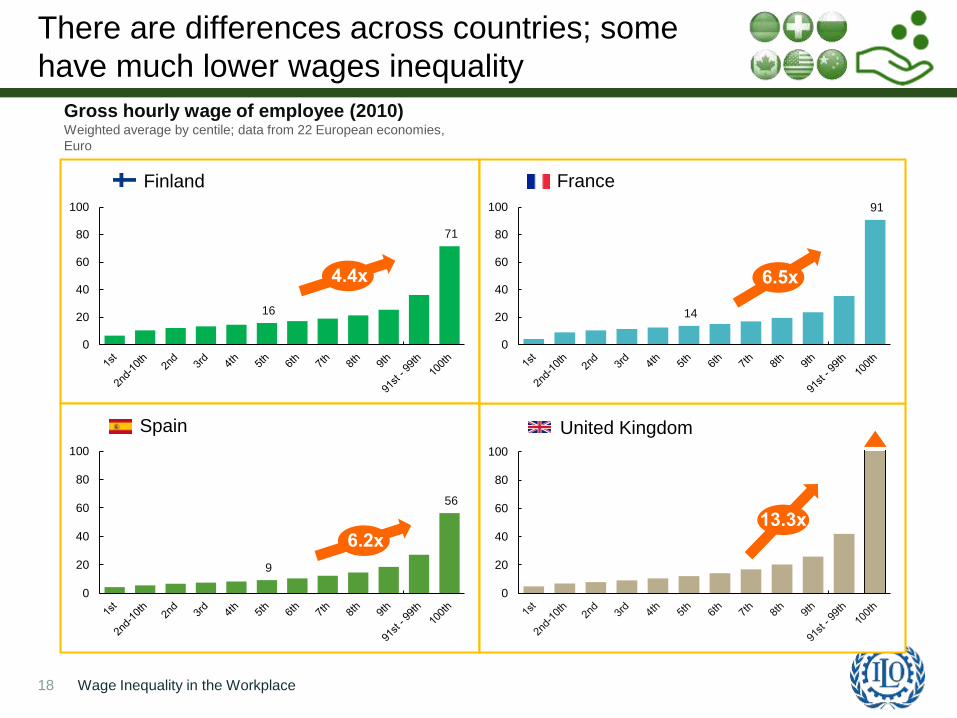
There are differences across countries; some
have much lower wages inequality
18
Gross hourly wage of employee (2010)Weighted average by centile; data from 22 European economies,
Euro
Wage Inequality in the Workplace
4.4x
6.2x13.3x
0
1
2
3
4
5
6
0 10 20 30 40 50 60 70 80 90 100
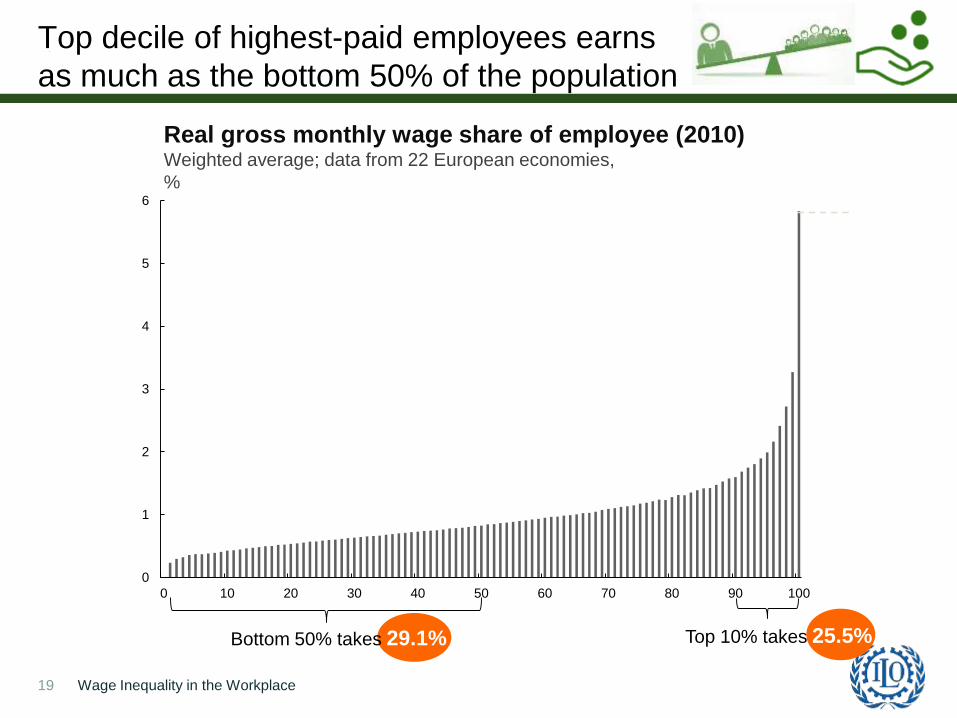
Top decile of highest-paid employees earns
as much as the bottom 50% of the population
Wage Inequality in the Workplace19
Real gross monthly wage share of employee (2010)Weighted average; data from 22 European economies,
%
D90Bottom 50% takes 29.1% Top 10% takes 25.5%
3.6%
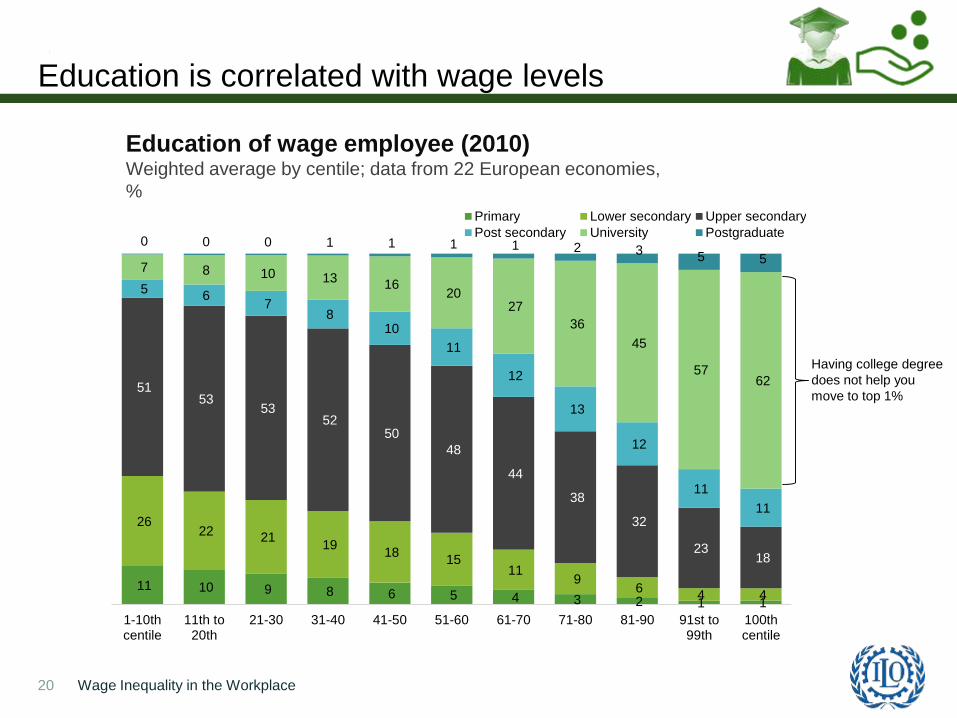
Education is correlated with wage levels
Wage Inequality in the Workplace20
Education of wage employee (2010)Weighted average by centile; data from 22 European economies,
%
11 10 9 8 6 5 4 3 2 1 1
26 22 21
19 18
15 11
9 6
4 4
51 53
53 52
50
48
44
38
32
23 18
5 6
7 8
10
11
12
13
12
11
11
7 8 10 13 16
20 27
36
45
57 62
0 0 0 1 1 1 1 2 3 5 5
1-10thcentile
11th to20th
21-30 31-40 41-50 51-60 61-70 71-80 81-90 91st to99th
100thcentile
Primary Lower secondary Upper secondary
Post secondary University Postgraduate
Having college degree
does not help you
move to top 1%
-4
-3
-2
-1
0
1
2
3
4
5
6
1 6 11 16 21 26 31 36 41 46 51 56 61 66 71 76 81 86 91 96
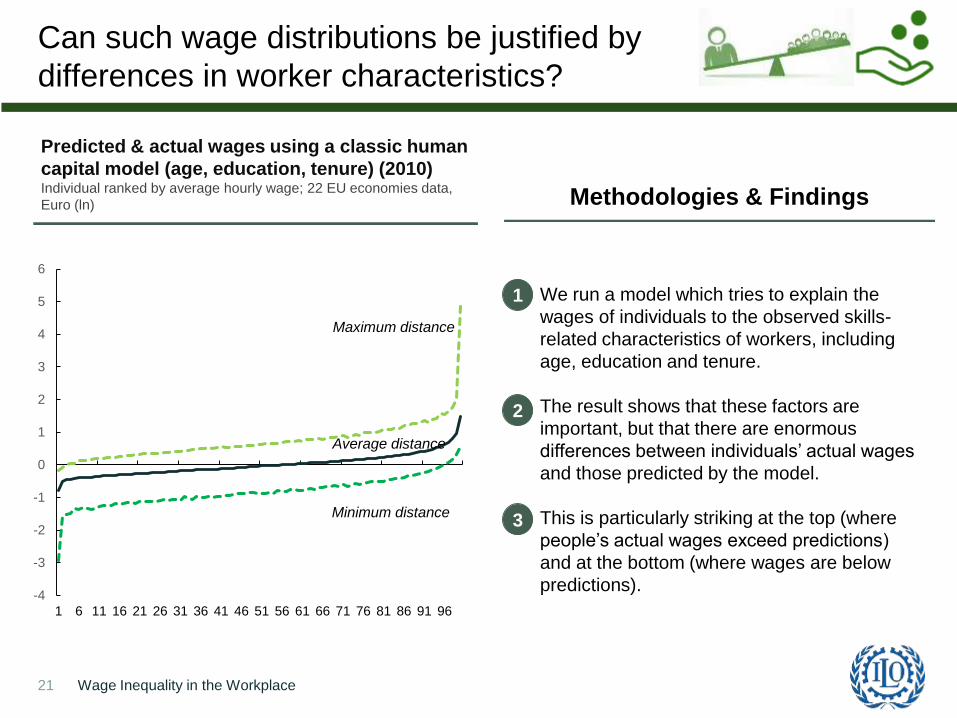
Can such wage distributions be justified by
differences in worker characteristics?
Wage Inequality in the Workplace21
Maximum distance
Minimum distance
Average distance
Methodologies & Findings
Predicted & actual wages using a classic human
capital model (age, education, tenure) (2010)Individual ranked by average hourly wage; 22 EU economies data,
Euro (ln)
• We run a model which tries to explain the
wages of individuals to the observed skills-
related characteristics of workers, including
age, education and tenure.
• The result shows that these factors are
important, but that there are enormous
differences between individuals’ actual wages
and those predicted by the model.
• This is particularly striking at the top (where
people’s actual wages exceed predictions)
and at the bottom (where wages are below
predictions).
1
2
3
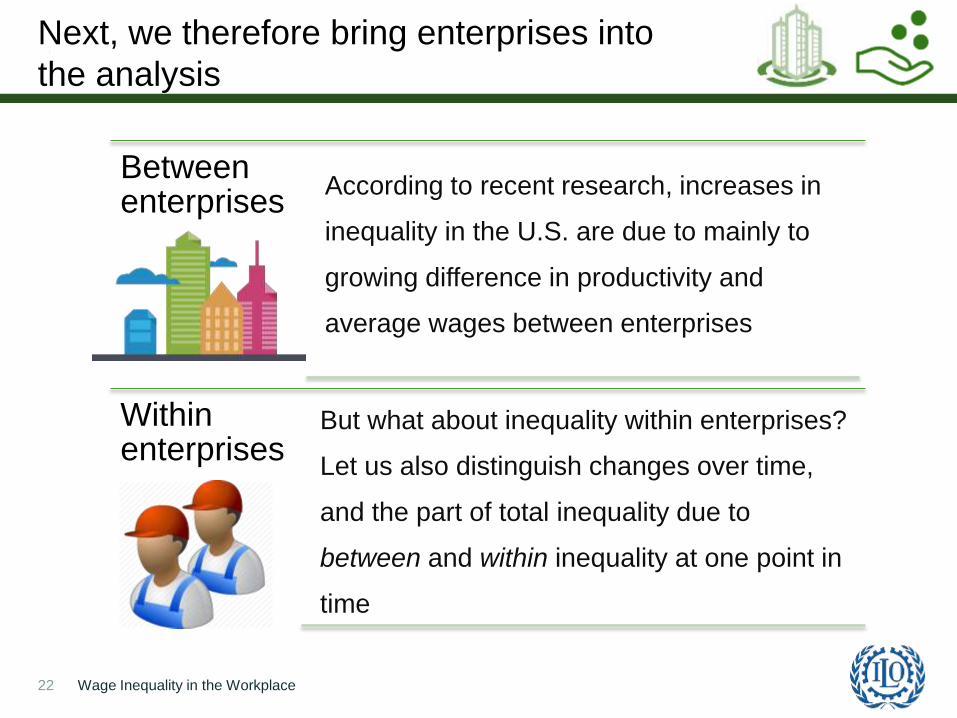
Between enterprises
According to recent research, increases in
inequality in the U.S. are due to mainly to
growing difference in productivity and
average wages between enterprises
Within enterprises
But what about inequality within enterprises?
Let us also distinguish changes over time,
and the part of total inequality due to
between and within inequality at one point in
time
Next, we therefore bring enterprises into
the analysis
Wage Inequality in the Workplace22
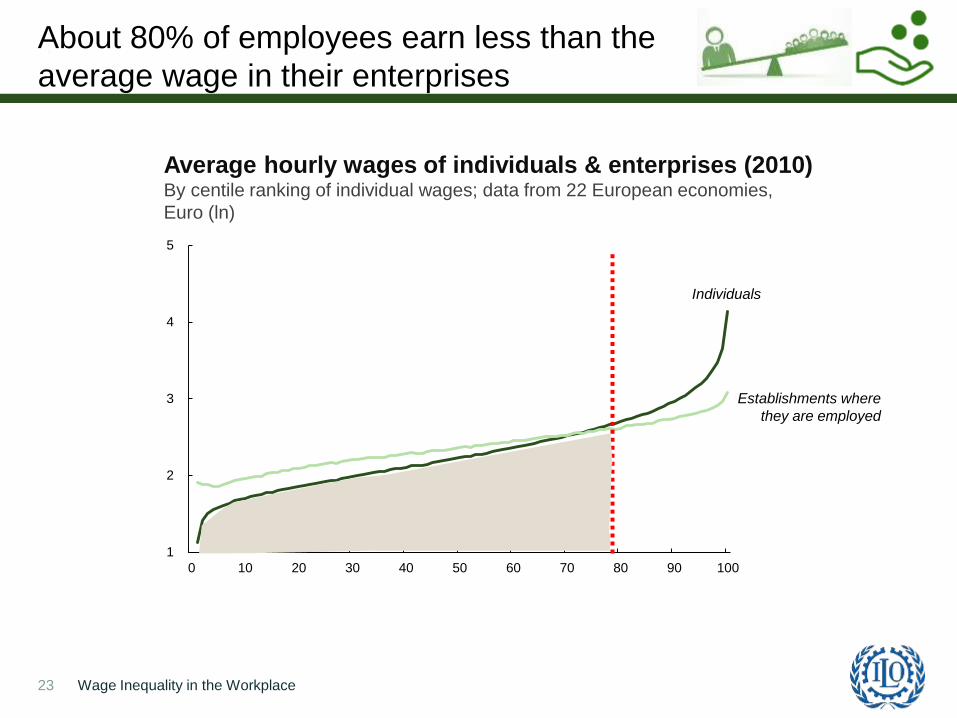
About 80% of employees earn less than the
average wage in their enterprises
Wage Inequality in the Workplace23
Average hourly wages of individuals & enterprises (2010)By centile ranking of individual wages; data from 22 European economies,
Euro (ln)
1
2
3
4
5
0 10 20 30 40 50 60 70 80 90 100
Individuals
Establishments where
they are employed
0
20
40
60
80
100
120
140
0 5 10 15 20 25 30 35 40 45 50 55 60 65 70 75 80 85 90 95
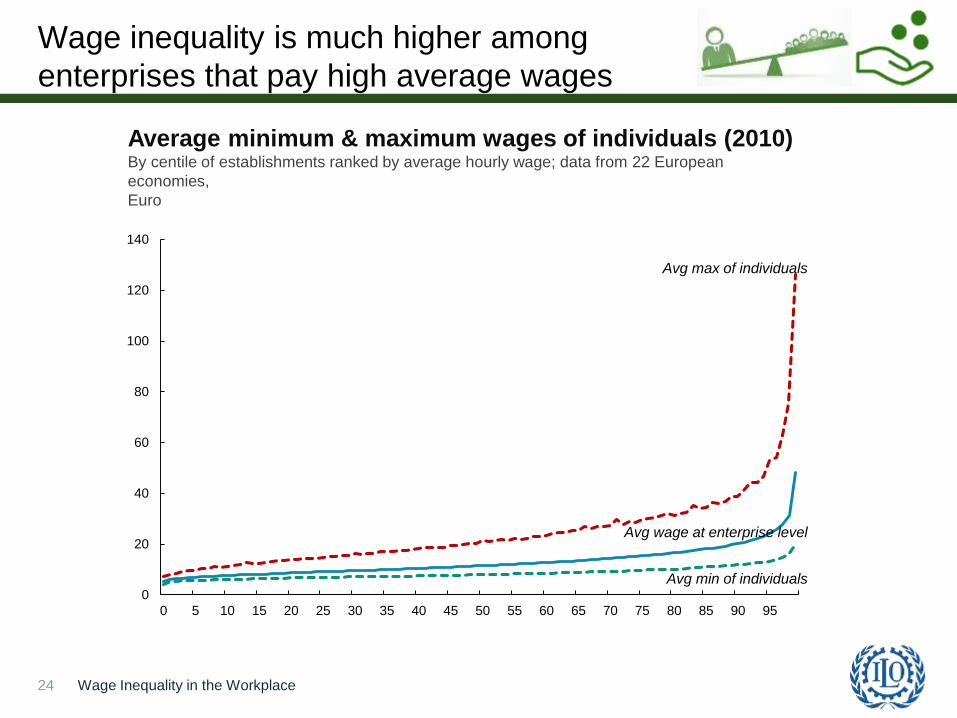
Avg min of individuals
Avg max of individuals
Avg wage at enterprise level
Wage inequality is much higher among
enterprises that pay high average wages
Wage Inequality in the Workplace24
Average minimum & maximum wages of individuals (2010)By centile of establishments ranked by average hourly wage; data from 22 European
economies,
Euro
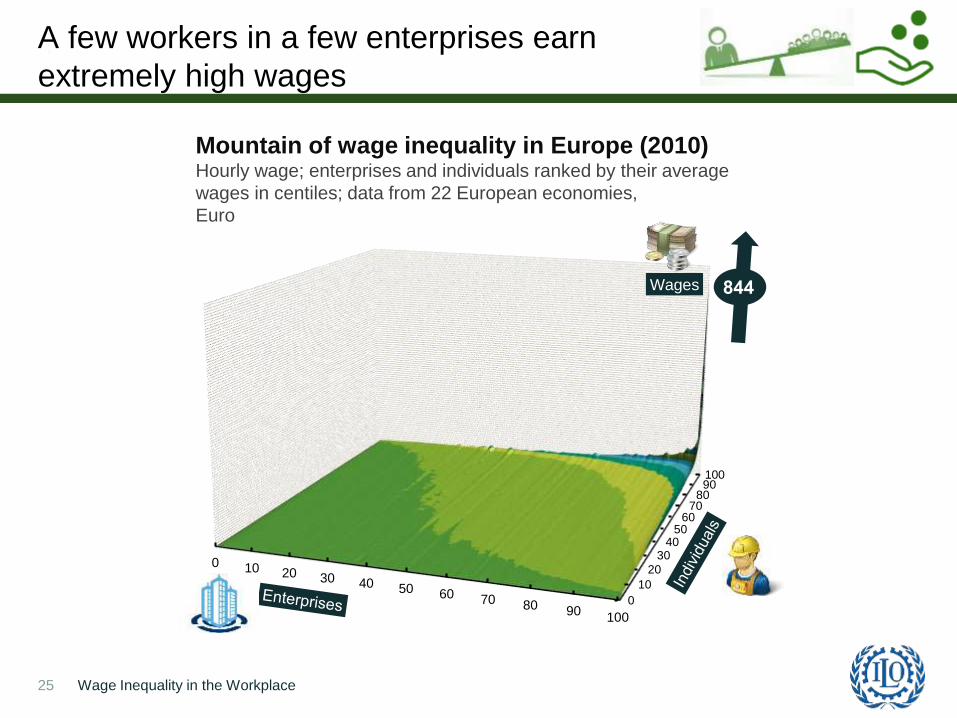
A few workers in a few enterprises earn
extremely high wages
Wage Inequality in the Workplace25
Mountain of wage inequality in Europe (2010)Hourly wage; enterprises and individuals ranked by their average
wages in centiles; data from 22 European economies,
Euro
0
10
20
3040
5060
7080
90100
0 10 20 30 40 50 60 70 80 90100
Wages 844
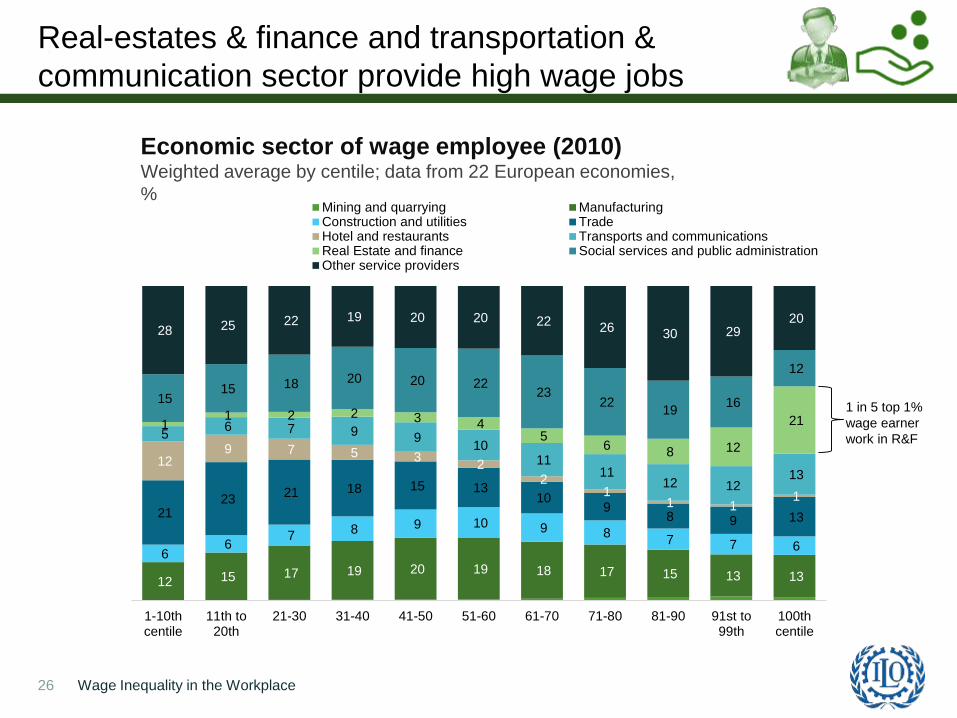
Real-estates & finance and transportation &
communication sector provide high wage jobs
Wage Inequality in the Workplace26
Economic sector of wage employee (2010)Weighted average by centile; data from 22 European economies,
%
12 15 17 19 20 19 18 17 15 13 13
6 6
7 8 9 10 9 8
7 7 6
21 23
21 18 15 13 10
9 8 9 13
12 9 7 5 3
2 2
1 1 1
1
5 6 7 9 9
10 11
11 12 12
13
1 1 2 2 3 4
5 6
8 12
21
15 15 18 20 20 22
23 22
19 16
12
28 25 22 19 20 20 22 26
30 29 20
1-10thcentile
11th to20th
21-30 31-40 41-50 51-60 61-70 71-80 81-90 91st to99th
100thcentile
Mining and quarrying ManufacturingConstruction and utilities TradeHotel and restaurants Transports and communicationsReal Estate and finance Social services and public administrationOther service providers
1 in 5 top 1%
wage earner
work in R&F
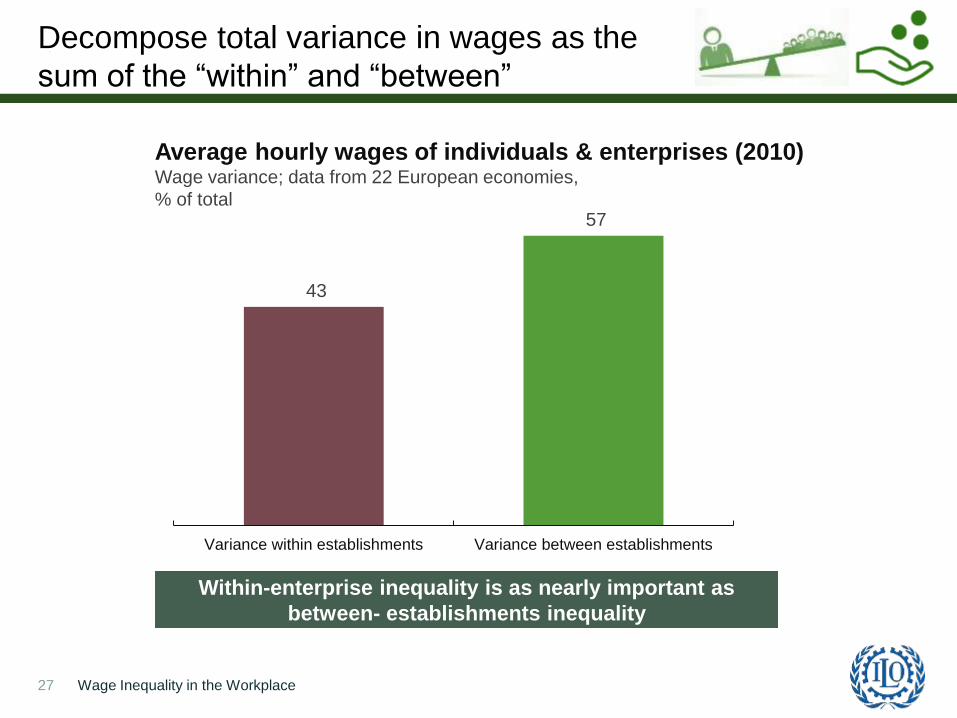
Decompose total variance in wages as the
sum of the “within” and “between”
Wage Inequality in the Workplace27
Average hourly wages of individuals & enterprises (2010)Wage variance; data from 22 European economies,
% of total
43
57
Variance within establishments Variance between establishments
Within-enterprise inequality is as nearly important as
between- establishments inequality
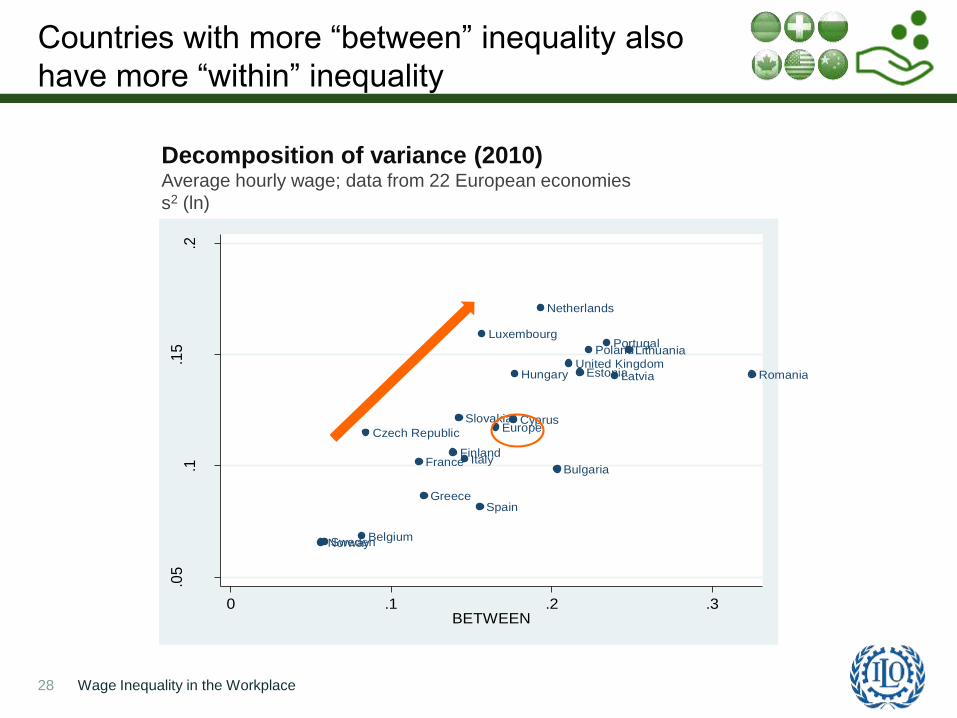
SwedenNorwayBelgium
FinlandFrance
Greece
Italy
Spain
Slovakia
Czech Republic Europe
Estonia
Netherlands
Luxembourg
Cyprus
United Kingdom
Poland
Hungary
Lithuania
Bulgaria
Latvia
Portugal
Romania
.05
.1.1
5.2
WIT
HIN
0 .1 .2 .3BETWEEN
Countries with more “between” inequality also
have more “within” inequality
Wage Inequality in the Workplace28
Decomposition of variance (2010)Average hourly wage; data from 22 European economies
s2 (ln)
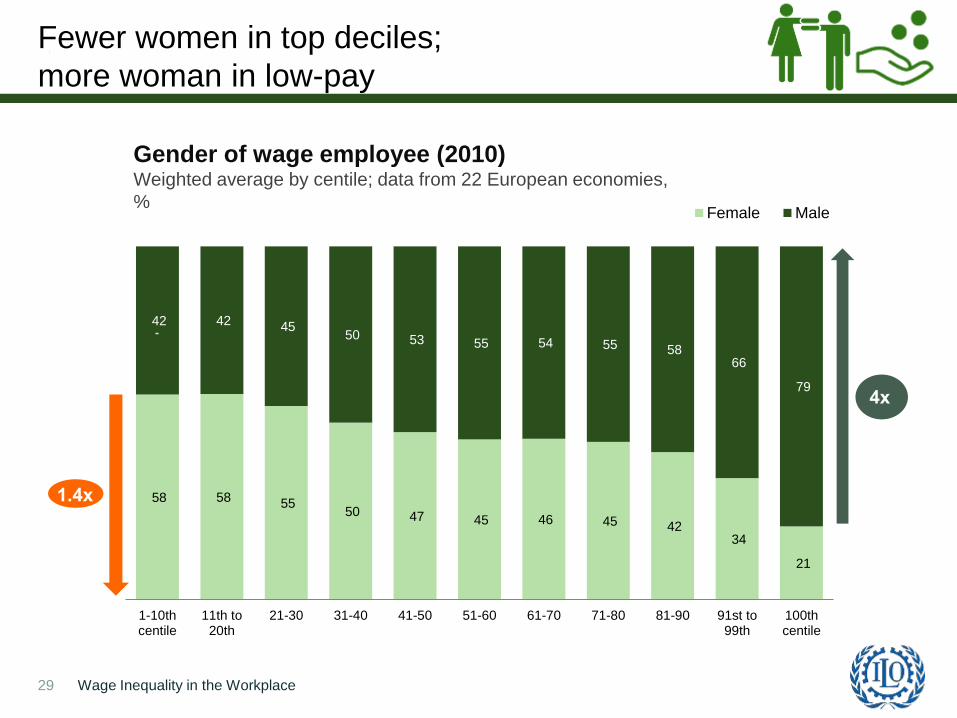
Fewer women in top deciles;
more woman in low-pay
Wage Inequality in the Workplace29
Gender of wage employee (2010)Weighted average by centile; data from 22 European economies,
%
58 58 55 50 47 45 46 45 42
34
21
42 42 45 50 53 55 54 55 58
66
79
1-10thcentile
11th to20th
21-30 31-40 41-50 51-60 61-70 71-80 81-90 91st to99th
100thcentile
Female Male
4x
1.4x
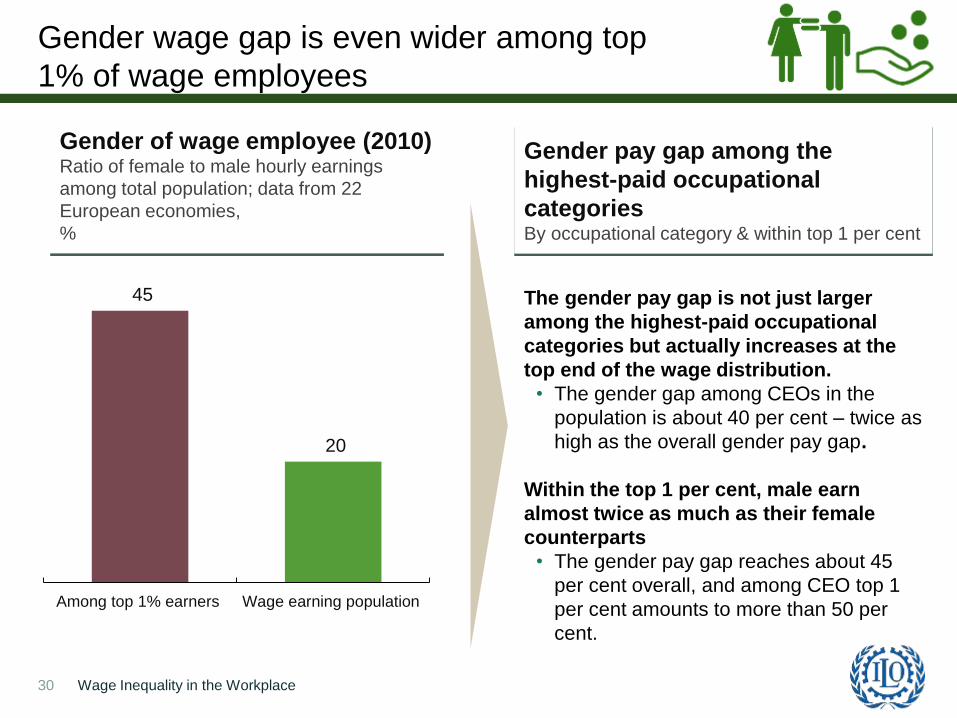
Gender of wage employee (2010)Ratio of female to male hourly earnings
among total population; data from 22
European economies,
%
Gender wage gap is even wider among top
1% of wage employees
Wage Inequality in the Workplace30
45
20
Among top 1% earners Wage earning population
Gender pay gap among the
highest-paid occupational
categoriesBy occupational category & within top 1 per cent
The gender pay gap is not just larger
among the highest-paid occupational
categories but actually increases at the
top end of the wage distribution.
• The gender gap among CEOs in the
population is about 40 per cent – twice as
high as the overall gender pay gap.
Within the top 1 per cent, male earn
almost twice as much as their female
counterparts
• The gender pay gap reaches about 45
per cent overall, and among CEO top 1
per cent amounts to more than 50 per
cent.
31 Global Wage Report 2016/17
Part I: Major Trends in Wages
• Global trends
• Wages, productivity and labour shares
Part II: Wage Inequality in the Workplace
• The extent of wage inequality
• Within & between enterprises
• Gender pay gaps
Part III: Summary & Conclusion
Outline
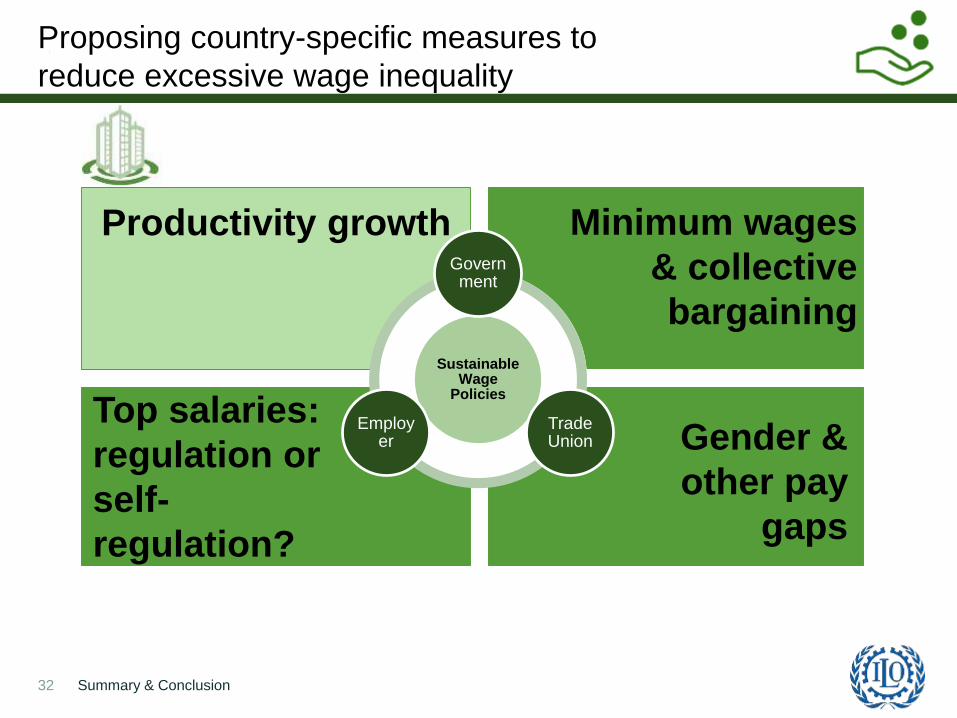
Proposing country-specific measures to
reduce excessive wage inequality
Summary & Conclusion32
1
Productivity growth Minimum wages
& collective
bargaining
Top salaries:
regulation or
self-
regulation?
Gender &
other pay
gaps
Sustainable Wage
Policies
Government
Trade Union
Employer
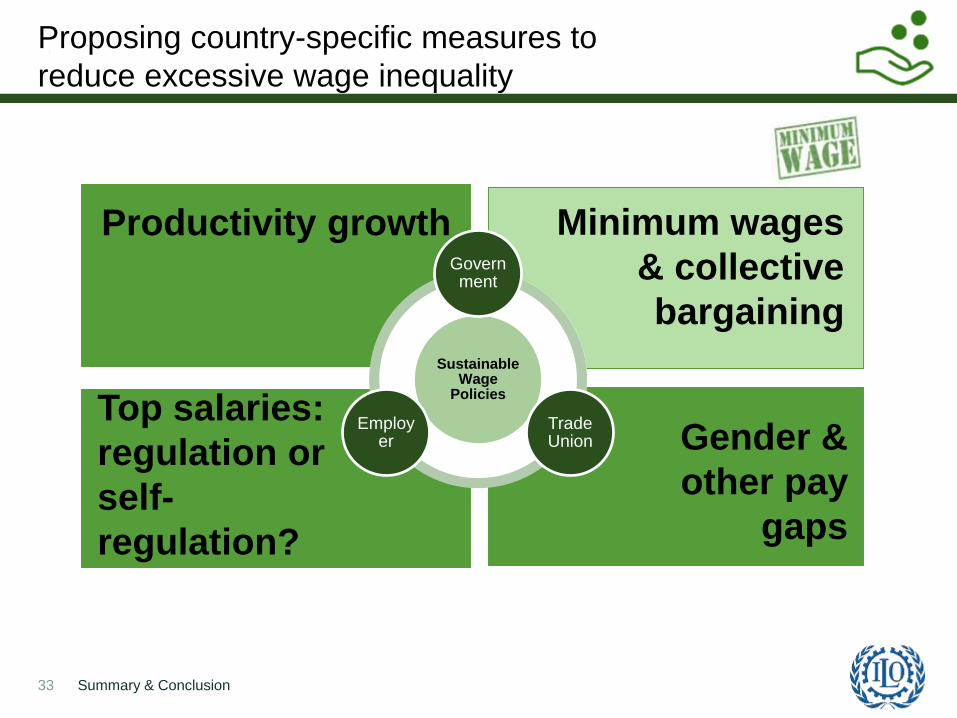
Proposing country-specific measures to
reduce excessive wage inequality
Summary & Conclusion33
1
Productivity growth Minimum wages
& collective
bargaining
Top salaries:
regulation or
self-
regulation?
Gender &
other pay
gaps
Sustainable Wage
Policies
Government
Trade Union
Employer
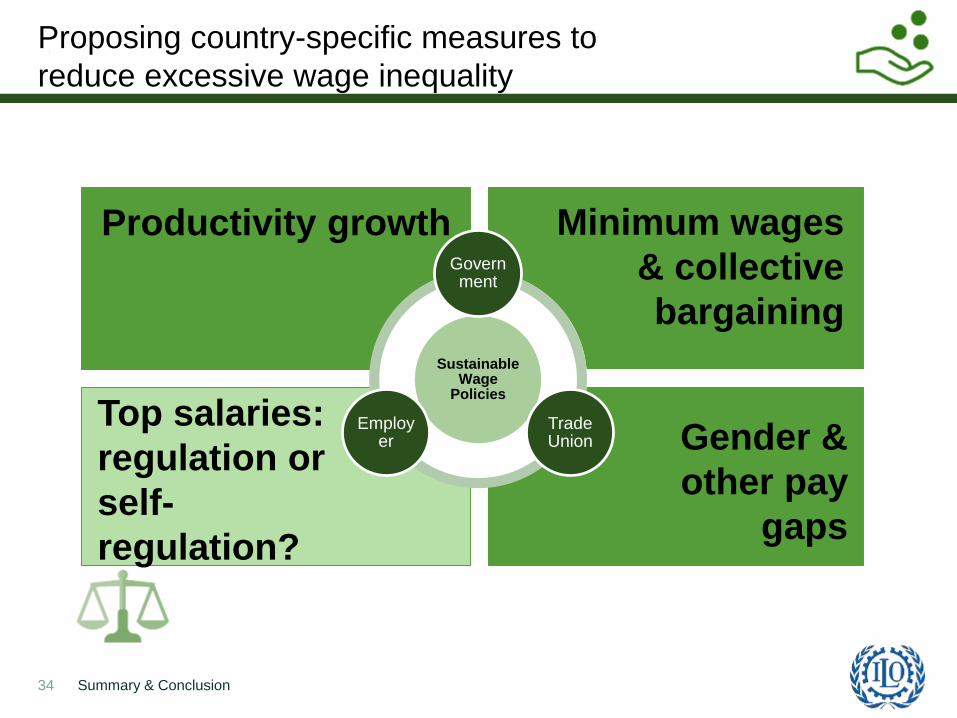
Proposing country-specific measures to
reduce excessive wage inequality
Summary & Conclusion34
1
Productivity growth Minimum wages
& collective
bargaining
Top salaries:
regulation or
self-
regulation?
Gender &
other pay
gaps
Sustainable Wage
Policies
Government
Trade Union
Employer
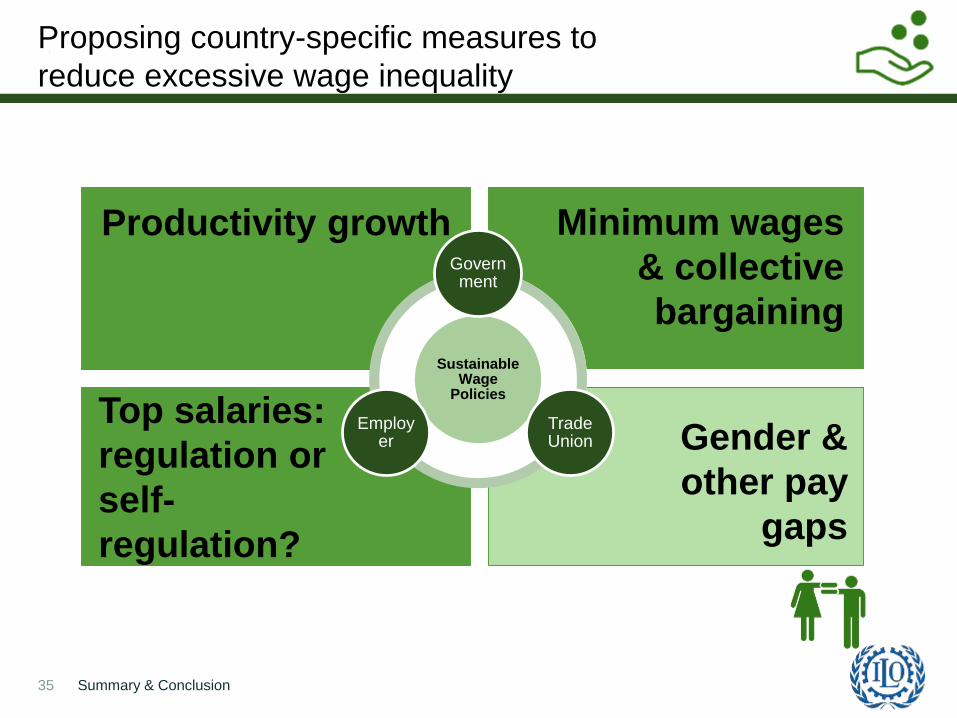
Proposing country-specific measures to
reduce excessive wage inequality
Summary & Conclusion35
1
Productivity growth Minimum wages
& collective
bargaining
Top salaries:
regulation or
self-
regulation?
Gender &
other pay
gaps
Sustainable Wage
Policies
Government
Trade Union
Employer
36 Global Wage Report 2016/17
THANK YOU FOR YOUR ATTENTION!
For further information on Global Wage Report
or research conducted by the ILO wage group,
please refer to:
Global Wage Report 2016/17
http://www.ilo.org/global/research/global-
reports/global-wage-
report/2016/WCMS_537846/lang--en/index.htm
Minimum Wage Guide & Other Publications
http://www.ilo.org/global/topics/wages/publicatio
ns/lang--en/index.htm