Embed Size (px)
Citation preview
NBER WORKING PAPER SERIES
WAGE MOBILITY AND DYNAMICS IN ITALY IN THE 90'S
Bruno ContiniRoberto Leombruni
Lia PacelliClaudia Villosio
Working Paper 13029http://www.nber.org/papers/w13029
NATIONAL BUREAU OF ECONOMIC RESEARCH1050 Massachusetts Avenue
Cambridge, MA 02138April 2007
Very valuable research assistance has been provided by Matteo Morini and Roberto Quaranta. Thanksto Jennifer Chubinski for her careful reading of the text. The views expressed herein are those of theauthor(s) and do not necessarily reflect the views of the National Bureau of Economic Research.
© 2007 by Bruno Contini, Roberto Leombruni, Lia Pacelli, and Claudia Villosio. All rights reserved.Short sections of text, not to exceed two paragraphs, may be quoted without explicit permission providedthat full credit, including © notice, is given to the source.
Wage Mobility and Dynamics in Italy in the 90'sBruno Contini, Roberto Leombruni, Lia Pacelli, and Claudia VillosioNBER Working Paper No. 13029April 2007JEL No. J21,J3,J5
ABSTRACT
Inspite of the centralized nature of wage bargaining in Italy, we find some evidence suggesting theexistence of firm-wage policies. Firstly, the ratio of the between-firm wage variability relative to totalwage variability is sizeable, and not very dissimilar from that reported for other countries. Secondly,the tide raising all boats is quite suggestive: not only do individual wages throughout the whole distributionincrease as average firm wages increases, but the spread increases too. Firm wage policy matters inshaping not only the wage level distribution but also the wage change distribution. The within-firms.d. of wage change is almost as high as that of individual wage change, and much higher than between-firmvariability of average change in wages. Worker-based statistics, on the other side, show that relativechanges in individual wages follow the business cycle, although different parts of the distribution reactin a different way to it, the upper tail having a higher responsiveness. Both facts are at odds with theoften reported rigidity of Italian wages. Indeed, the detected flexibility is mainly driven by moversand short tenure workers. The cross-country comparison suggests that the relatively high degree ofwage compression in Italy could be associated with higher entry and exit rates.
Bruno ContiniDepartment of EconomicsUniversity of TorinoandLABORatorio Riccardo RevelliVia Real Collegio 3010124 [email protected]
Roberto LeombruniLABORatorio Riccardo RevelliVia Real Collegio 3010124 [email protected]
Lia PacelliDepartment of Economics and FinanceUniversity of TorinoandLABORatorio Riccardo RevelliVia Real Collegio 3010124 [email protected]
Claudia VillosioLABORatorio Riccardo RevelliVia Real Collegio 3010124 [email protected]
2
1. Macroeconomic Conditions and long term trends in Employment, Wages and Mobility
1.1 Employment
From the end of the 70’s to the early 2000’s the employment cycle in Italy had two long periods of growth, from
1983 to 1990 and from 1994 to today, interrupted by a strong recession from 1991-1993. The first growth phase
was marked by steady GDP growth accompanied by a very modest increase in employment, with 3-4 percentage
points difference in 1984-89 (it was described as “jobless growth”; see figure 1.1). In the early 1990s Italy was hit
by the most severe recession since the second world war in terms of job losses. During the crisis of the early
1960s, which put an end to the so called “economic miracle”, total employment declined by 640,000 full-time
equivalent units; now the cumulative fall reached 1,080,000 units (Brandolini et al, 2006). The high drop in
employment was not mitigated by job creation in the public administration, nor in State owned companies.
Moreover, layoffs were easier – thanks to the 1991 reform of collective dismissals (see below, section 2) – and a
drastic restructuring process continued till 1995.
The subsequent recovery, in contrast with what observed in the first growth phase, was marked by strong trends
in employment – that took advantage of a period of salary moderation and labour market reforms – and a modest
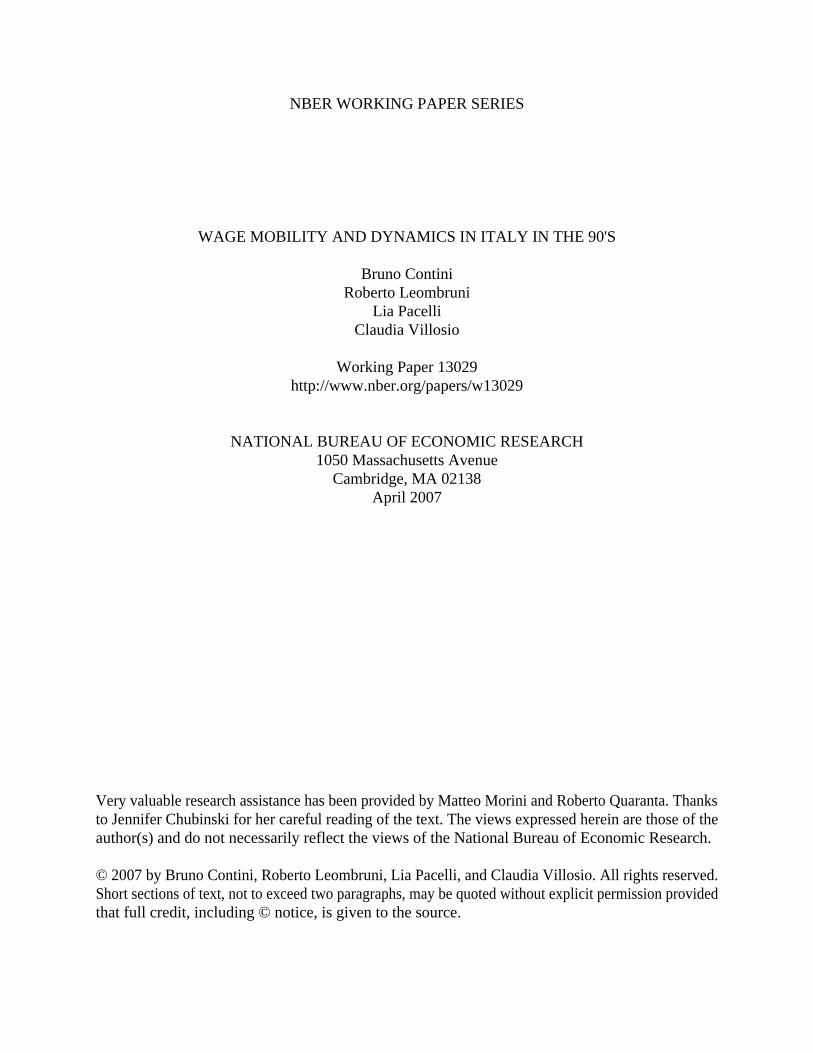
increase in GDP. Fig. 1.1 shows that from 1996 on employment started increasing again, with growth rates
similar to the GDP. Beginning in 2000 this trend inverted and the employment growth rate exceeded GDP growth
– which, while remaining positive, was clearly in decline. The elasticity of employment to GDP in the years post-
1994 was about 0.7%, almost double with respect to 0.38% that characterized the phase of “jobless growth”.
Fig. 1.1. Growth rates of GDP, employment and Bank of Italy’s coincident indicator of the Business Cycle.
-0.06
-0.04
-0.02
0
0.02
0.04
0.06
0.08
0.1
1979
1981
1983
1985
1987
1989
1991
1993
1995
1997
1999
2001
2003
Business Cycle GDP Employment
Source: Contini and Trivellato (2005)
3
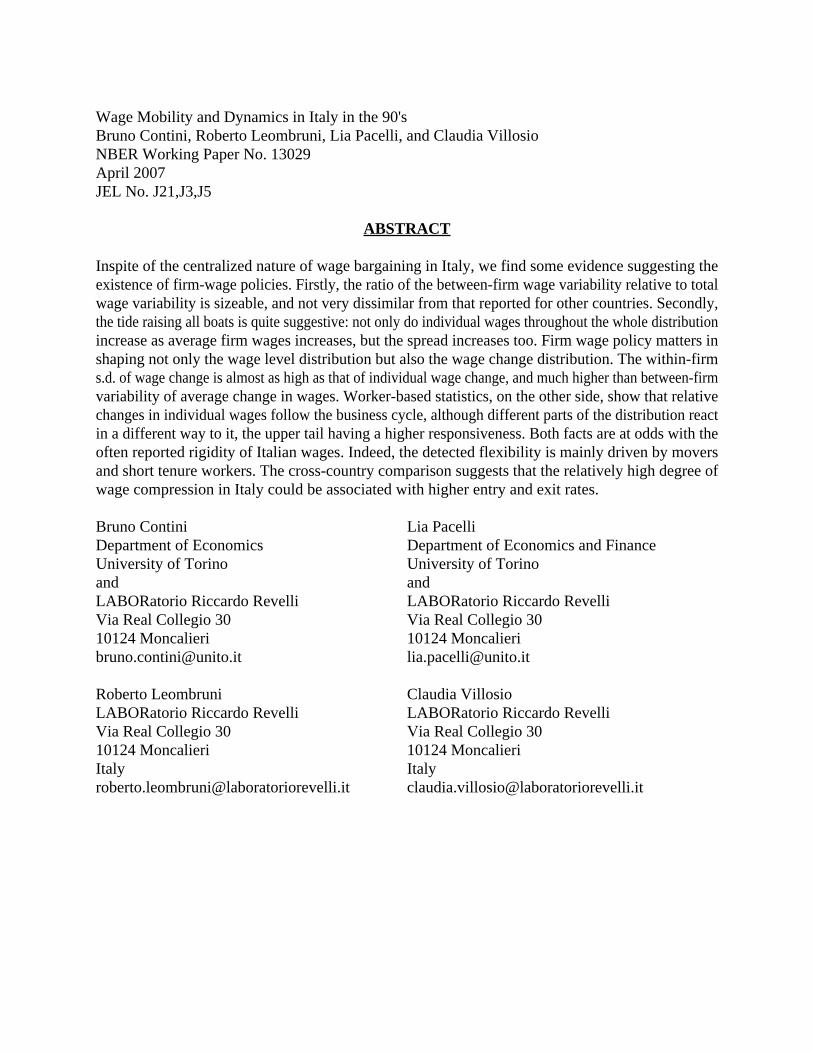
Employment growth since the Eighties is almost completely attributed to women (see fig. 1.2). Female
employment increased between 1979 and 2003 by 43%, while male employment was nearly stagnant.
The unemployment rate constantly increased till the end of the Eighties. After three years of modest decrease
between 1989 and 1991, it increased again until 1996 – when it reached, using the old definition2, a peak of nearly
16%. It then began to decrease during the years of intense employment growth, which brought it to just above
10% in 2004.
Fig. 1.2. Index numbers of employment by gender, 1979-2003 (1979=100).
80
90
100
110
120
130
140
150
1979
1981
1983
1985
1987
1989
1991
1993
1995
1997
1999
2001
2003
Men Women All
Source: Contini and Trivellato (2005)
2 In table 1.1 two unemployment rate time series are reported, before- and after the revision in the Labour Force Survey
methodology and definitions occurred in 1992. In the old definition the criteria by which an individual was classified as a job
seeker where looser, including those who compleated inactive search actions, and those who last searched more than four
weeks prior. In line with ILO definitions these individuals are currently classified as inactive, belonging to the so called
“potential labour force”. There is evidence, however, that their characteristics and behaviours are more similar to the
unemployed than to the inactive (see Brandolini, Cipollone and Viviano [2006]; Battistin, Rettore and Trivellato [2006]).
4
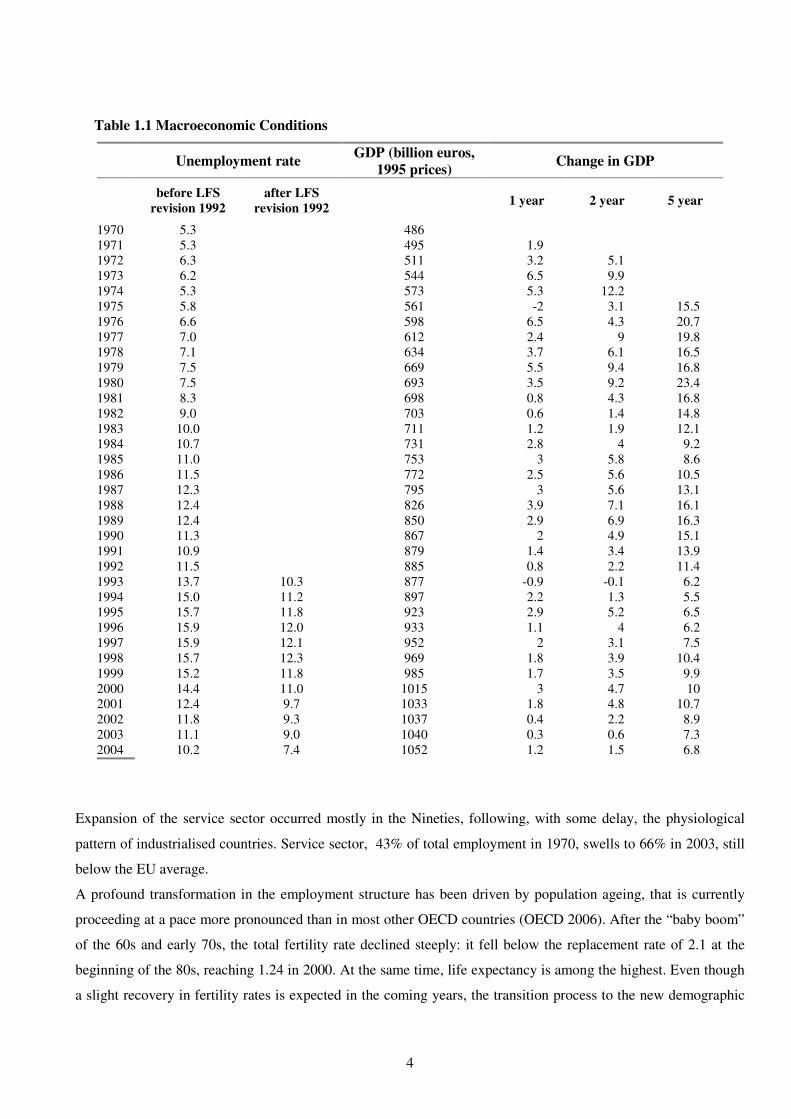
Table 1.1 Macroeconomic Conditions
Unemployment rate
GDP (billion euros,
1995 prices) Change in GDP
before LFS
revision 1992
after LFS
revision 1992 1 year 2 year 5 year
1970 5.3 486
1971 5.3 495 1.9
1972 6.3 511 3.2 5.1
1973 6.2 544 6.5 9.9
1974 5.3 573 5.3 12.2
1975 5.8 561 -2 3.1 15.5
1976 6.6 598 6.5 4.3 20.7
1977 7.0 612 2.4 9 19.8
1978 7.1 634 3.7 6.1 16.5
1979 7.5 669 5.5 9.4 16.8
1980 7.5 693 3.5 9.2 23.4
1981 8.3 698 0.8 4.3 16.8
1982 9.0 703 0.6 1.4 14.8
1983 10.0 711 1.2 1.9 12.1
1984 10.7 731 2.8 4 9.2
1985 11.0 753 3 5.8 8.6
1986 11.5 772 2.5 5.6 10.5
1987 12.3 795 3 5.6 13.1
1988 12.4 826 3.9 7.1 16.1
1989 12.4 850 2.9 6.9 16.3
1990 11.3 867 2 4.9 15.1
1991 10.9 879 1.4 3.4 13.9
1992 11.5 885 0.8 2.2 11.4
1993 13.7 10.3 877 -0.9 -0.1 6.2
1994 15.0 11.2 897 2.2 1.3 5.5
1995 15.7 11.8 923 2.9 5.2 6.5
1996 15.9 12.0 933 1.1 4 6.2
1997 15.9 12.1 952 2 3.1 7.5
1998 15.7 12.3 969 1.8 3.9 10.4
1999 15.2 11.8 985 1.7 3.5 9.9
2000 14.4 11.0 1015 3 4.7 10
2001 12.4 9.7 1033 1.8 4.8 10.7
2002 11.8 9.3 1037 0.4 2.2 8.9
2003 11.1 9.0 1040 0.3 0.6 7.3
2004 10.2 7.4 1052 1.2 1.5 6.8
Expansion of the service sector occurred mostly in the Nineties, following, with some delay, the physiological
pattern of industrialised countries. Service sector, 43% of total employment in 1970, swells to 66% in 2003, still
below the EU average.
A profound transformation in the employment structure has been driven by population ageing, that is currently
proceeding at a pace more pronounced than in most other OECD countries (OECD 2006). After the “baby boom”
of the 60s and early 70s, the total fertility rate declined steeply: it fell below the replacement rate of 2.1 at the
beginning of the 80s, reaching 1.24 in 2000. At the same time, life expectancy is among the highest. Even though
a slight recovery in fertility rates is expected in the coming years, the transition process to the new demographic
5
regime is having, and will have, a profound impact on the economy. In the next two decades, the baby boom
generations will reach retirement age, and will be replaced by new cohorts roughly half in size. By 2050, more
than one in three Italians will be over the age of 653.
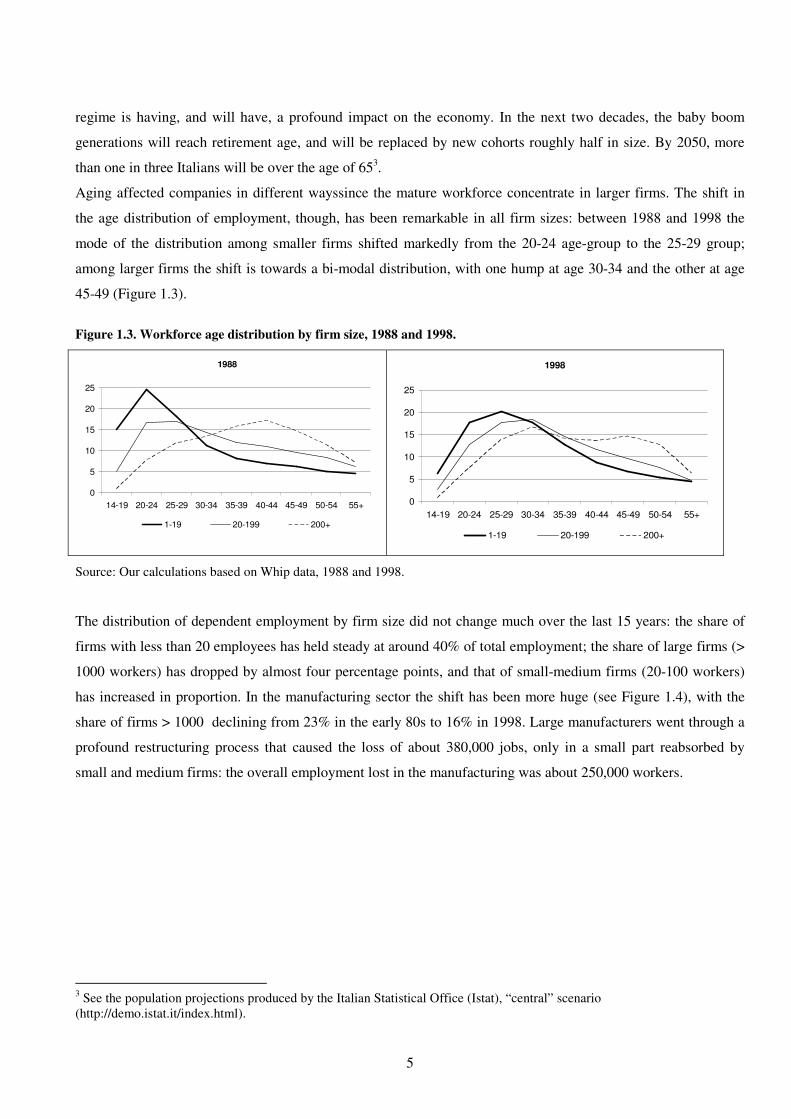
Aging affected companies in different wayssince the mature workforce concentrate in larger firms. The shift in
the age distribution of employment, though, has been remarkable in all firm sizes: between 1988 and 1998 the
mode of the distribution among smaller firms shifted markedly from the 20-24 age-group to the 25-29 group;
among larger firms the shift is towards a bi-modal distribution, with one hump at age 30-34 and the other at age
45-49 (Figure 1.3).
Figure 1.3. Workforce age distribution by firm size, 1988 and 1998.
1988
0
5
10
15
20
25
14-19 20-24 25-29 30-34 35-39 40-44 45-49 50-54 55+
1-19 20-199 200+
1998
0
5
10
15
20
25
14-19 20-24 25-29 30-34 35-39 40-44 45-49 50-54 55+
1-19 20-199 200+
Source: Our calculations based on Whip data, 1988 and 1998.
The distribution of dependent employment by firm size did not change much over the last 15 years: the share of
firms with less than 20 employees has held steady at around 40% of total employment; the share of large firms (>
1000 workers) has dropped by almost four percentage points, and that of small-medium firms (20-100 workers)
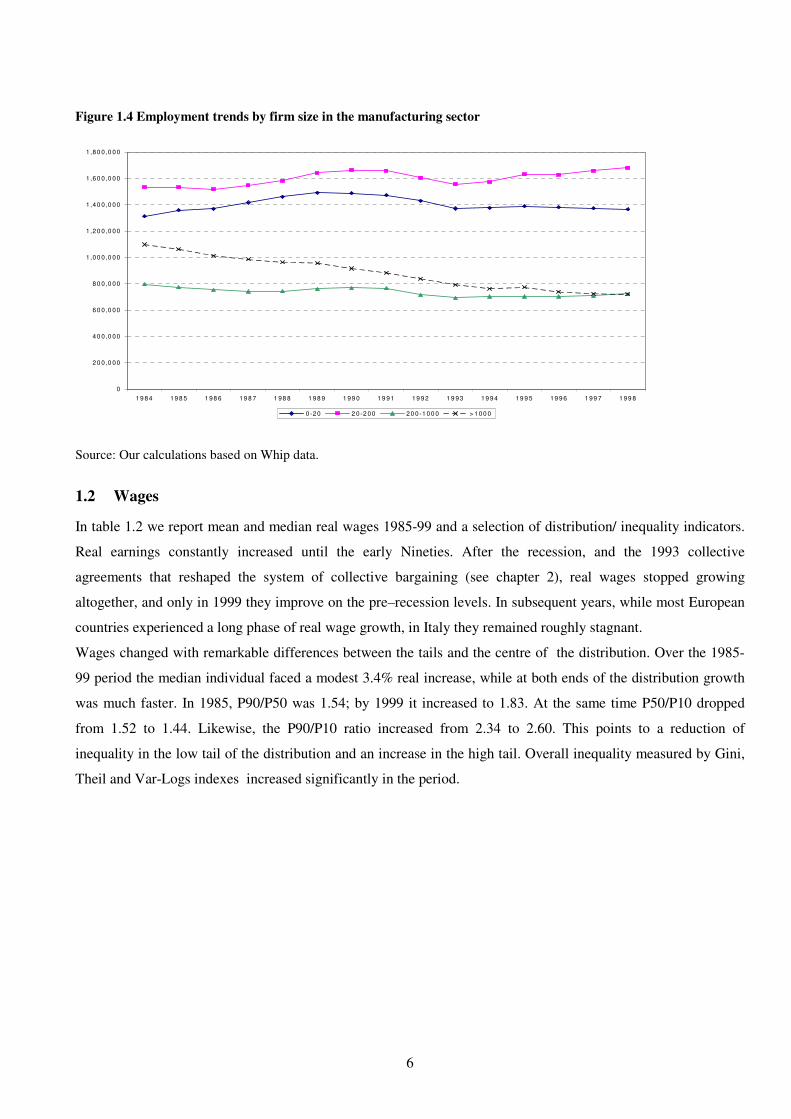
has increased in proportion. In the manufacturing sector the shift has been more huge (see Figure 1.4), with the
share of firms > 1000 declining from 23% in the early 80s to 16% in 1998. Large manufacturers went through a
profound restructuring process that caused the loss of about 380,000 jobs, only in a small part reabsorbed by
small and medium firms: the overall employment lost in the manufacturing was about 250,000 workers.
3 See the population projections produced by the Italian Statistical Office (Istat), “central” scenario
(http://demo.istat.it/index.html).
6
Figure 1.4 Employment trends by firm size in the manufacturing sector
0
20 0 ,0 00
40 0 ,0 00
60 0 ,0 00
80 0 ,0 00
1 ,00 0 ,0 00
1 ,20 0 ,0 00
1 ,40 0 ,0 00
1 ,60 0 ,0 00
1 ,80 0 ,0 00
19 84 19 8 5 1 98 6 19 8 7 1 98 8 1 98 9 1 99 0 1 9 91 19 92 1 9 93 19 94 19 9 5 19 9 6 1 99 7 1 99 8
0 -20 2 0 -2 00 20 0 -1 00 0 > 1 00 0
Source: Our calculations based on Whip data.
1.2 Wages
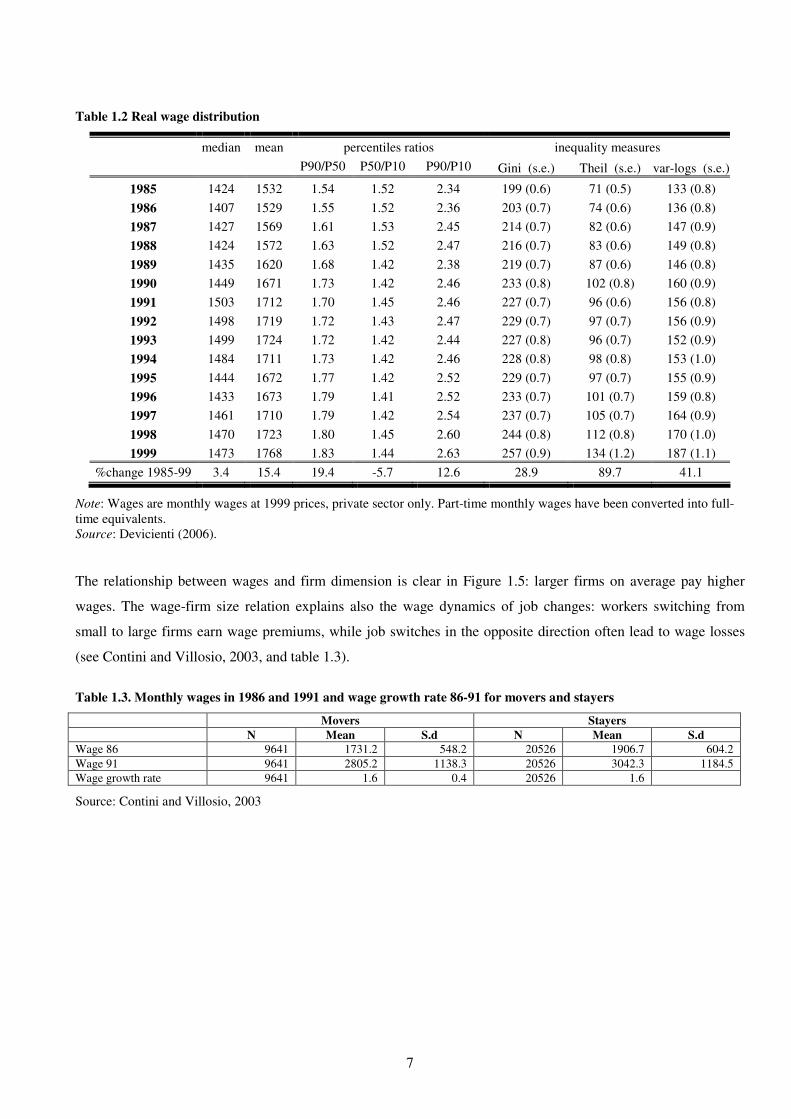
In table 1.2 we report mean and median real wages 1985-99 and a selection of distribution/ inequality indicators.
Real earnings constantly increased until the early Nineties. After the recession, and the 1993 collective
agreements that reshaped the system of collective bargaining (see chapter 2), real wages stopped growing
altogether, and only in 1999 they improve on the pre–recession levels. In subsequent years, while most European
countries experienced a long phase of real wage growth, in Italy they remained roughly stagnant.
Wages changed with remarkable differences between the tails and the centre of the distribution. Over the 1985-
99 period the median individual faced a modest 3.4% real increase, while at both ends of the distribution growth
was much faster. In 1985, P90/P50 was 1.54; by 1999 it increased to 1.83. At the same time P50/P10 dropped
from 1.52 to 1.44. Likewise, the P90/P10 ratio increased from 2.34 to 2.60. This points to a reduction of
inequality in the low tail of the distribution and an increase in the high tail. Overall inequality measured by Gini,
Theil and Var-Logs indexes increased significantly in the period.
7
Table 1.2 Real wage distribution
median mean percentiles ratios inequality measures
P90/P50 P50/P10 P90/P10 Gini (s.e.) Theil (s.e.) var-logs (s.e.)
1985 1424 1532 1.54 1.52 2.34 199 (0.6) 71 (0.5) 133 (0.8)
1986 1407 1529 1.55 1.52 2.36 203 (0.7) 74 (0.6) 136 (0.8)
1987 1427 1569 1.61 1.53 2.45 214 (0.7) 82 (0.6) 147 (0.9)
1988 1424 1572 1.63 1.52 2.47 216 (0.7) 83 (0.6) 149 (0.8)
1989 1435 1620 1.68 1.42 2.38 219 (0.7) 87 (0.6) 146 (0.8)
1990 1449 1671 1.73 1.42 2.46 233 (0.8) 102 (0.8) 160 (0.9)
1991 1503 1712 1.70 1.45 2.46 227 (0.7) 96 (0.6) 156 (0.8)
1992 1498 1719 1.72 1.43 2.47 229 (0.7) 97 (0.7) 156 (0.9)
1993 1499 1724 1.72 1.42 2.44 227 (0.8) 96 (0.7) 152 (0.9)
1994 1484 1711 1.73 1.42 2.46 228 (0.8) 98 (0.8) 153 (1.0)
1995 1444 1672 1.77 1.42 2.52 229 (0.7) 97 (0.7) 155 (0.9)
1996 1433 1673 1.79 1.41 2.52 233 (0.7) 101 (0.7) 159 (0.8)
1997 1461 1710 1.79 1.42 2.54 237 (0.7) 105 (0.7) 164 (0.9)
1998 1470 1723 1.80 1.45 2.60 244 (0.8) 112 (0.8) 170 (1.0)
1999 1473 1768 1.83 1.44 2.63 257 (0.9) 134 (1.2) 187 (1.1)
%change 1985-99 3.4 15.4 19.4 -5.7 12.6 28.9 89.7 41.1
Note: Wages are monthly wages at 1999 prices, private sector only. Part-time monthly wages have been converted into full-
time equivalents.
Source: Devicienti (2006).
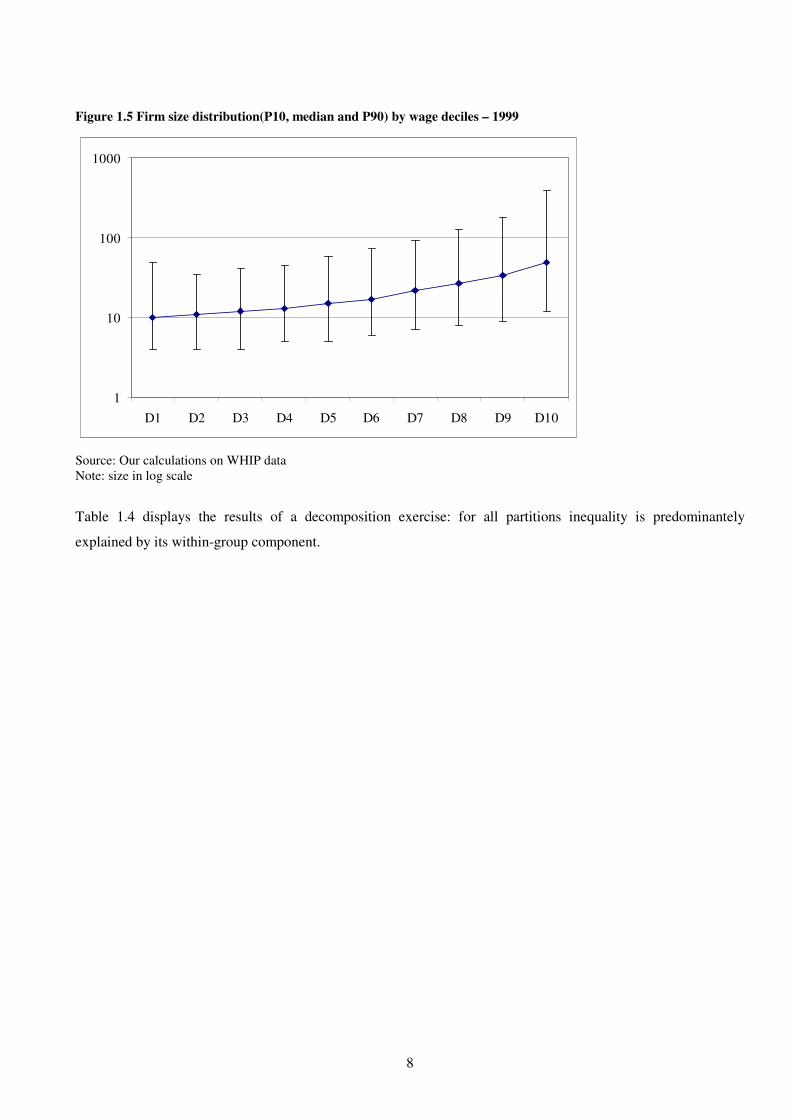
The relationship between wages and firm dimension is clear in Figure 1.5: larger firms on average pay higher
wages. The wage-firm size relation explains also the wage dynamics of job changes: workers switching from
small to large firms earn wage premiums, while job switches in the opposite direction often lead to wage losses
(see Contini and Villosio, 2003, and table 1.3).
Table 1.3. Monthly wages in 1986 and 1991 and wage growth rate 86-91 for movers and stayers
Movers Stayers
N Mean S.d N Mean S.d
Wage 86 9641 1731.2 548.2 20526 1906.7 604.2
Wage 91 9641 2805.2 1138.3 20526 3042.3 1184.5
Wage growth rate 9641 1.6 0.4 20526 1.6
Source: Contini and Villosio, 2003
8
Figure 1.5 Firm size distribution(P10, median and P90) by wage deciles – 1999
1
10
100
1000
D1 D2 D3 D4 D5 D6 D7 D8 D9 D10
Source: Our calculations on WHIP data
Note: size in log scale
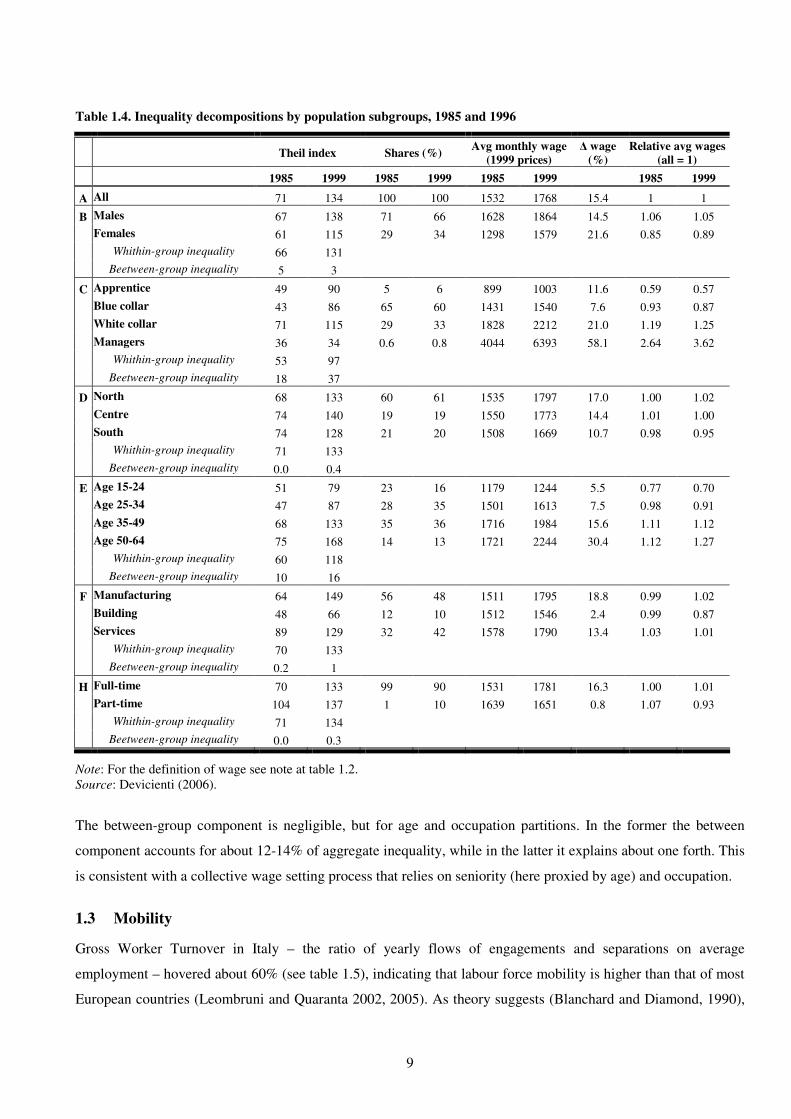
Table 1.4 displays the results of a decomposition exercise: for all partitions inequality is predominantely
explained by its within-group component.
9
Table 1.4. Inequality decompositions by population subgroups, 1985 and 1996
Theil index Shares (%)
Avg monthly wage
(1999 prices)
∆ wage
(%)
Relative avg wages
(all = 1)
1985 1999 1985 1999 1985 1999 1985 1999
A All 71 134 100 100 1532 1768 15.4 1 1
B Males 67 138 71 66 1628 1864 14.5 1.06 1.05
Females 61 115 29 34 1298 1579 21.6 0.85 0.89
Whithin-group inequality 66 131
Beetween-group inequality 5 3
C Apprentice 49 90 5 6 899 1003 11.6 0.59 0.57
Blue collar 43 86 65 60 1431 1540 7.6 0.93 0.87
White collar 71 115 29 33 1828 2212 21.0 1.19 1.25
Managers 36 34 0.6 0.8 4044 6393 58.1 2.64 3.62
Whithin-group inequality 53 97
Beetween-group inequality 18 37
D North 68 133 60 61 1535 1797 17.0 1.00 1.02
Centre 74 140 19 19 1550 1773 14.4 1.01 1.00
South 74 128 21 20 1508 1669 10.7 0.98 0.95
Whithin-group inequality 71 133
Beetween-group inequality 0.0 0.4
E Age 15-24 51 79 23 16 1179 1244 5.5 0.77 0.70
Age 25-34 47 87 28 35 1501 1613 7.5 0.98 0.91
Age 35-49 68 133 35 36 1716 1984 15.6 1.11 1.12
Age 50-64 75 168 14 13 1721 2244 30.4 1.12 1.27
Whithin-group inequality 60 118
Beetween-group inequality 10 16
F Manufacturing 64 149 56 48 1511 1795 18.8 0.99 1.02
Building 48 66 12 10 1512 1546 2.4 0.99 0.87
Services 89 129 32 42 1578 1790 13.4 1.03 1.01
Whithin-group inequality 70 133
Beetween-group inequality 0.2 1
H Full-time 70 133 99 90 1531 1781 16.3 1.00 1.01
Part-time 104 137 1 10 1639 1651 0.8 1.07 0.93
Whithin-group inequality 71 134
Beetween-group inequality 0.0 0.3
Note: For the definition of wage see note at table 1.2.
Source: Devicienti (2006).
The between-group component is negligible, but for age and occupation partitions. In the former the between
component accounts for about 12-14% of aggregate inequality, while in the latter it explains about one forth. This
is consistent with a collective wage setting process that relies on seniority (here proxied by age) and occupation.
1.3 Mobility
Gross Worker Turnover in Italy – the ratio of yearly flows of engagements and separations on average
employment – hovered about 60% (see table 1.5), indicating that labour force mobility is higher than that of most
European countries (Leombruni and Quaranta 2002, 2005). As theory suggests (Blanchard and Diamond, 1990),
10
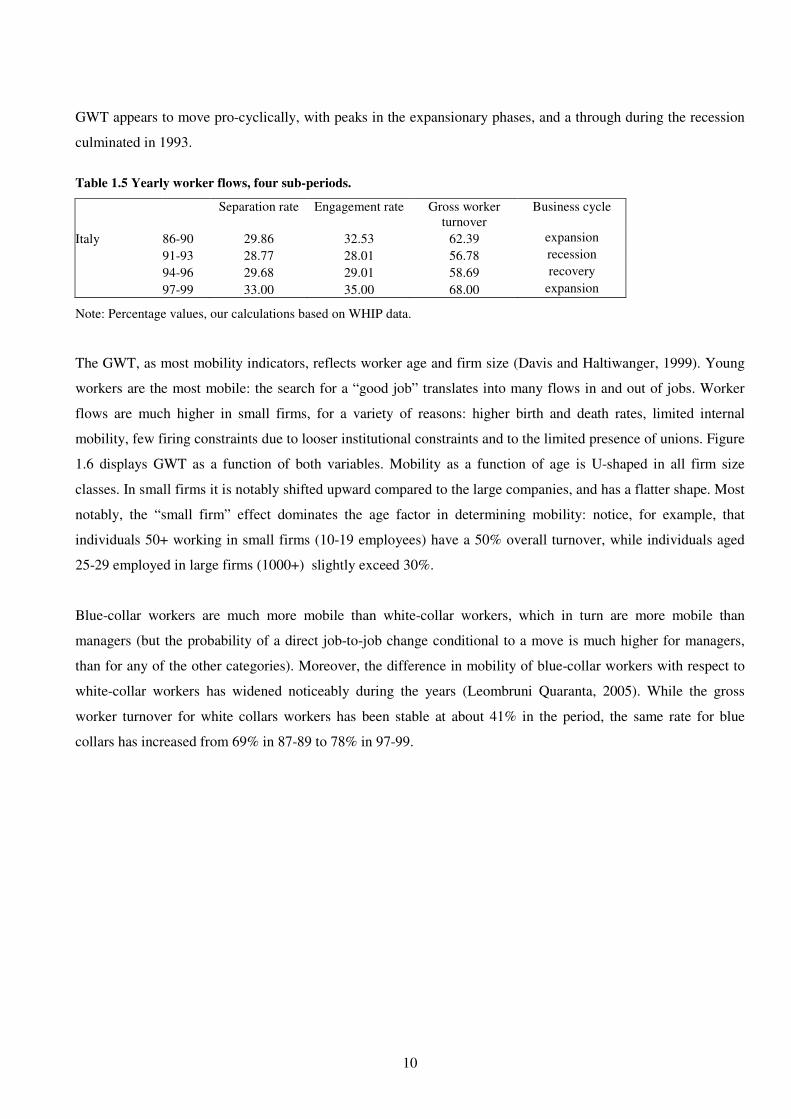
GWT appears to move pro-cyclically, with peaks in the expansionary phases, and a through during the recession
culminated in 1993.
Table 1.5 Yearly worker flows, four sub-periods.
Separation rate Engagement rate Gross worker
turnover
Business cycle
Italy 86-90 29.86 32.53 62.39 expansion
91-93 28.77 28.01 56.78 recession
94-96 29.68 29.01 58.69 recovery
97-99 33.00 35.00 68.00 expansion
Note: Percentage values, our calculations based on WHIP data.
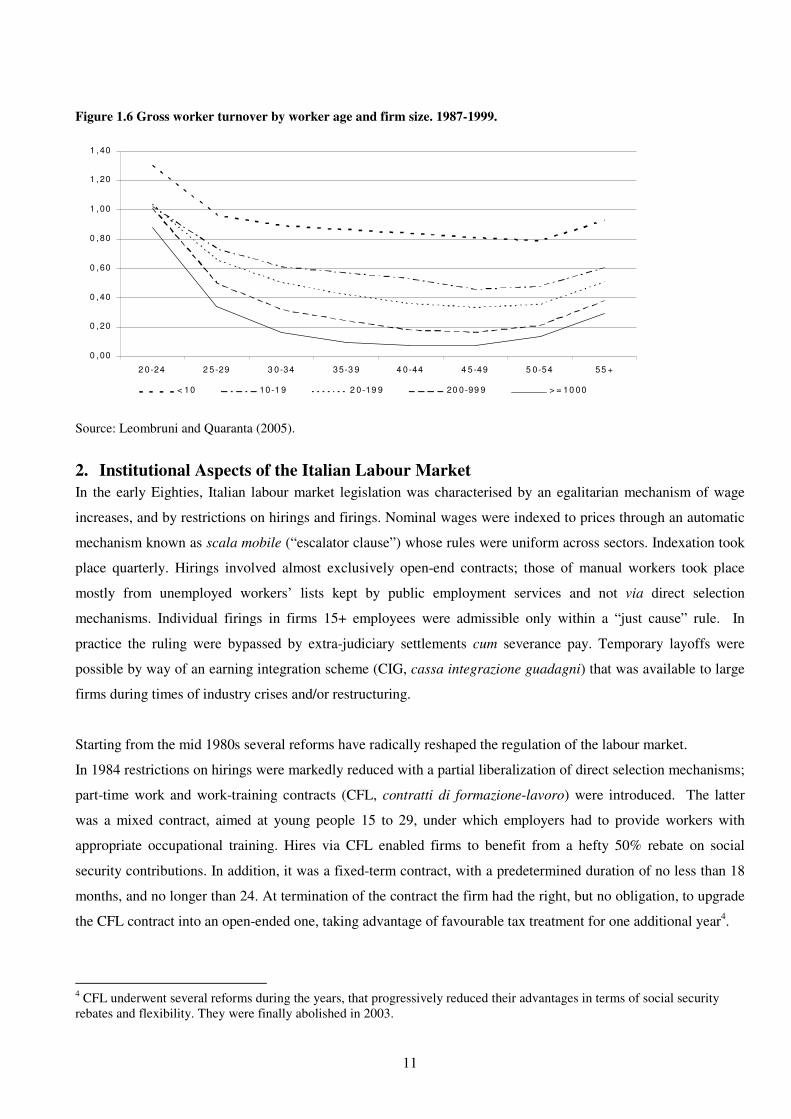
The GWT, as most mobility indicators, reflects worker age and firm size (Davis and Haltiwanger, 1999). Young
workers are the most mobile: the search for a “good job” translates into many flows in and out of jobs. Worker
flows are much higher in small firms, for a variety of reasons: higher birth and death rates, limited internal
mobility, few firing constraints due to looser institutional constraints and to the limited presence of unions. Figure
1.6 displays GWT as a function of both variables. Mobility as a function of age is U-shaped in all firm size
classes. In small firms it is notably shifted upward compared to the large companies, and has a flatter shape. Most
notably, the “small firm” effect dominates the age factor in determining mobility: notice, for example, that
individuals 50+ working in small firms (10-19 employees) have a 50% overall turnover, while individuals aged
25-29 employed in large firms (1000+) slightly exceed 30%.
Blue-collar workers are much more mobile than white-collar workers, which in turn are more mobile than
managers (but the probability of a direct job-to-job change conditional to a move is much higher for managers,
than for any of the other categories). Moreover, the difference in mobility of blue-collar workers with respect to
white-collar workers has widened noticeably during the years (Leombruni Quaranta, 2005). While the gross
worker turnover for white collars workers has been stable at about 41% in the period, the same rate for blue
collars has increased from 69% in 87-89 to 78% in 97-99.
11
Figure 1.6 Gross worker turnover by worker age and firm size. 1987-1999.
0 ,00
0 ,20
0 ,40
0 ,60
0 ,80
1 ,00
1 ,20
1 ,40
2 0-24 2 5-29 3 0-34 35-3 9 4 0-44 4 5-49 5 0-54 55 +
< 10 10-1 9 2 0-19 9 20 0-99 9 > = 10 00
Source: Leombruni and Quaranta (2005).
2. Institutional Aspects of the Italian Labour Market
In the early Eighties, Italian labour market legislation was characterised by an egalitarian mechanism of wage
increases, and by restrictions on hirings and firings. Nominal wages were indexed to prices through an automatic
mechanism known as scala mobile (“escalator clause”) whose rules were uniform across sectors. Indexation took
place quarterly. Hirings involved almost exclusively open-end contracts; those of manual workers took place
mostly from unemployed workers’ lists kept by public employment services and not via direct selection
mechanisms. Individual firings in firms 15+ employees were admissible only within a “just cause” rule. In
practice the ruling were bypassed by extra-judiciary settlements cum severance pay. Temporary layoffs were
possible by way of an earning integration scheme (CIG, cassa integrazione guadagni) that was available to large
firms during times of industry crises and/or restructuring.
Starting from the mid 1980s several reforms have radically reshaped the regulation of the labour market.
In 1984 restrictions on hirings were markedly reduced with a partial liberalization of direct selection mechanisms;
part-time work and work-training contracts (CFL, contratti di formazione-lavoro) were introduced. The latter
was a mixed contract, aimed at young people 15 to 29, under which employers had to provide workers with
appropriate occupational training. Hires via CFL enabled firms to benefit from a hefty 50% rebate on social
security contributions. In addition, it was a fixed-term contract, with a predetermined duration of no less than 18
months, and no longer than 24. At termination of the contract the firm had the right, but no obligation, to upgrade
the CFL contract into an open-ended one, taking advantage of favourable tax treatment for one additional year4.
4 CFL underwent several reforms during the years, that progressively reduced their advantages in terms of social security
rebates and flexibility. They were finally abolished in 2003.
12
In 1986 the automatic indexation of wages via scala mobile was reduced from quarterly to twice a year, and
definitely abolished in 1992.
In 1991 collective dismissals were introduced by means of “mobility lists” – which granted to laid-off workers
long term unemployment benefits, and fiscal incentives for firms re-employing them – while CIG was extended
also to small and medium firms in the manufacturing sector (CIGS, cassa integrazione guadagni straordinaria).
The latter, in principle, was still designed for temporary layoffs, but in practice it allowed mass layoffs at very
low costs, since it could be extended several times, and then converted into a mobility list provision.
In 1993, at the peak of recession, the unions, Confindustria (the Italian Manufacturers’ Association) and the
government pledged to act in concert to improve the conditions of the labour market. A new two-level bargaining
system was agreed upon, which is still in rule today. At the national level, wages are set according to the inflation
rate targeted by the Government for the following 24 months. The difference between actual and targeted
inflation is not automatically recovered, and is to be taken into account at the start of a new bargaining round. At
the regional or firm level, additional wage components are introduced and are to be geared by profit sharing
considerations. In few years, firm level bargaining spread in the majority of large firms, whilst it is still negligible
in the small firm sector.
The new catch phrase of subsequent policies was “increasing flexibility on all fronts”. As a matter of fact, most of
the action took place in the labour market, while little was achieved in terms of product market flexibility.
In 1996 the so called “pacchetto Treu” extended the range of possible work contracts, by introducing temporary
work, by extending the applicability of part time and fixed-term contracts, and by regulating “parasubordinato”
work, a form of dependent self-employment. The portfolio of available contracts, in 2003, was further extended
into 21 different typologies, including job sharing, project work and staff leasing.
As a consequence, from 1996 on the standard open end contracts lost importance in favour of “atypical” ones,
which started to represented the most widespread channel for entry into the labour market. In 2002 the share of
workers with a fixed term contract already accounted for 10% of total employment – against a EU15 average of
13% (European Commission, 2003).
3. Results
The tables presented in this paragraph have been computed using the Work Histories Italian Panel (WHIP),
which is based on administrative data from the Italian Social Security (INPS) archives.
Wages are average daily earnings paid to the worker, at 1990 prices, expressed in Italian Liras (,000), gross of
income taxes and payroll taxes paid by workers, and net of payroll taxes paid by employers5.
5 This is the so called “base wage”, on which social security and pension contributions are calculated. It includes basic wage,
cost-of-living allowance, residual fees, overtime plus back pay, bonuses, supplements holiday pay, sick pay.

13
Worker-based statistics: we selected all blue and white collar workers with a job spell active during the month of
May of the year of interest, working full-time, in firms employing at least 20 employees.
Firm-based statistics: WHIP is a 1:90 random sample of workers. Hence we do not have a representative sample
of the workforce in small and medium sized firms. This is not an issue for tables in paragraph 3.3 on mobility
indicators: the monthly employment stock and the average wage of each firm are reported in WHIP, yealding
good approximations of entry and exit rates. For tables in paragraph 3.1 and 3.2, in contrast, we pooled together
firms into cells – called “synthetic firms” – in order to have enough individual observations to compute firm wage
and wage change distributions. The 800-cells grid used is based on the following partition:
• Geography: 20 Italian regions;
• Firm size: 5 classes (20-49, 50-99, 100-199, 200-499, 500+ workers);
• Sector of activity: 44 classes (Nace-70 2-digit sectors).
More details on the data and a discussion on the syntetic firm approach can be found in the Methodological
Appendix.
3.1 Structure of wages between and within firms
Table 3.1 includes two sets of statistics: worker-based (referred to as “observation = a person”) and firm-based
(referred to as “observation = a firm”).
Worker-based statistics confirm several stylized facts well known in the literature. Average individual wage and
standard deviation increase with worker age, reflecting the wider range of career paths experienced as workers
grow older. The dispersion of individual wages in Italy is in line with the other countries included in this book. It
is not far from that of Norway and Sweden, but it is high with respect to Denmark and Finland: in Italy the
P90/P50 ratio is 1.7, and P10/P50 is 0.7 (in Denmark and Finland these statistics are much closer to 1).
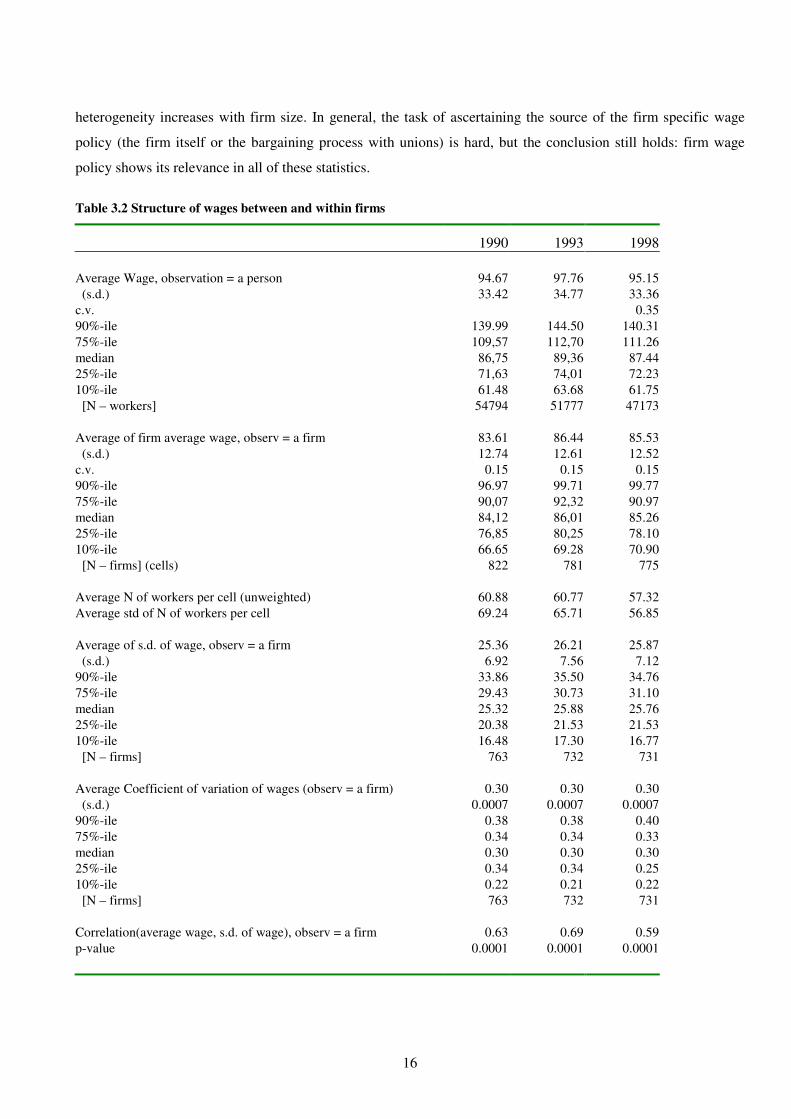
Firm-based statistics introduce new hints. Average firm wage is lower than average individual wage, reflecting
the fact that small firms pay (on average) lower wages than large ones. The ratio of between firms wage
variability relative to the country’s average wage is 13%, similar to other countries included in this book, except
Netherlands and United States (see fig. 5 in the Introduction of the book). Within-firm wage variability
represents about two thirds of total variability (25.87 against 33.36 in 1998), and is larger than between-firm
variability (12.52 in 1998)6.
The ratio of the between-firm wage variability relative to total wage variability is sizeable in all countries, and
Italy is no exception (see fig. 4 in the Introduction of the book). In Italy it is sizeable also with respect to other
decompositions (see chapter 1.2). Characteristics like gender, geographical area, industry account for a negligible
6 The true difference between the two, however, may be upward biased, since statistics on synthetic firms tend to
underestimate between-firm variability and overestimate within-firm variability, as a consequence of attributing to “within
cell” the variability “between firms belonging to the same cell” (see the methodological Appendix).
14
part of the total variance of wages. The results presented in chapter 1.2 are not directly comparable with table 3.2,
as the one displayed in the latter is not an exact decomposition7. However, this is an indication of the importance
of firm wage policies in shaping the wage distribution, a point that seems to overrule the importance of individual
observable characteristics.
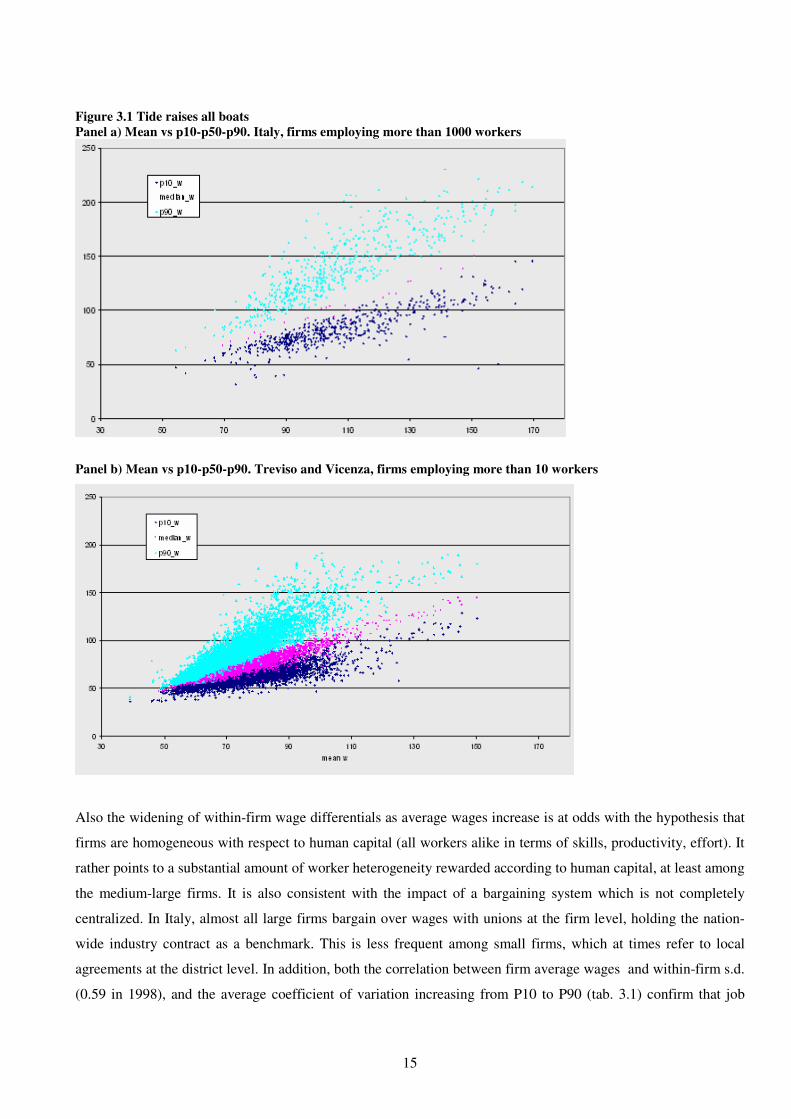
Figure 3.1 adds to the point. Panel (a) shows P10, P50, P90 of the within-firm wage distribution (based on firms
– here not synthetic firms – of which we observe at least 10 workers), ranked by firm average wage. Indeed “the
tide lifts all boats”, as all percentiles increase with average firm wage. In addition the spread becomes larger with
increasing average wage, especially in the P90 band. Workers receiving “low” wages (P10) from a high-wage
firm are paid more than many workers receiving “high” wages (P90) from a low-wage firm. This is true not only
in large firms, like those included in Panel (a), but also among small firms, as shown in Panel (b), which refers to
firms employing 10+ workers of two Veneto provinces for which we have population data (see Appendix for
details). This finding strongly suggests that firms do not follow a pay compression model in their wage policy.
7 Total variability do not decompose into the within and between components reported in table 3.2, although it is positively
correlated with both. An exact decomposition, for instance, is that reported in formula (1) in the introduction to the Book.
15
Figure 3.1 Tide raises all boats
Panel a) Mean vs p10-p50-p90. Italy, firms employing more than 1000 workers
Panel b) Mean vs p10-p50-p90. Treviso and Vicenza, firms employing more than 10 workers
Also the widening of within-firm wage differentials as average wages increase is at odds with the hypothesis that
firms are homogeneous with respect to human capital (all workers alike in terms of skills, productivity, effort). It
rather points to a substantial amount of worker heterogeneity rewarded according to human capital, at least among
the medium-large firms. It is also consistent with the impact of a bargaining system which is not completely
centralized. In Italy, almost all large firms bargain over wages with unions at the firm level, holding the nation-
wide industry contract as a benchmark. This is less frequent among small firms, which at times refer to local
agreements at the district level. In addition, both the correlation between firm average wages and within-firm s.d.
(0.59 in 1998), and the average coefficient of variation increasing from P10 to P90 (tab. 3.1) confirm that job
16
heterogeneity increases with firm size. In general, the task of ascertaining the source of the firm specific wage
policy (the firm itself or the bargaining process with unions) is hard, but the conclusion still holds: firm wage
policy shows its relevance in all of these statistics.
Table 3.2 Structure of wages between and within firms
1990 1993 1998
Average Wage, observation = a person 94.67 97.76 95.15
(s.d.) 33.42 34.77 33.36
c.v. 0.35
90%-ile 139.99 144.50 140.31
75%-ile 109,57 112,70 111.26
median 86,75 89,36 87.44
25%-ile 71,63 74,01 72.23
10%-ile 61.48 63.68 61.75
[N – workers] 54794 51777 47173
Average of firm average wage, observ = a firm 83.61 86.44 85.53
(s.d.) 12.74 12.61 12.52
c.v. 0.15 0.15 0.15
90%-ile 96.97 99.71 99.77
75%-ile 90,07 92,32 90.97
median 84,12 86,01 85.26
25%-ile 76,85 80,25 78.10
10%-ile 66.65 69.28 70.90
[N – firms] (cells) 822 781 775
Average N of workers per cell (unweighted) 60.88 60.77 57.32
Average std of N of workers per cell 69.24 65.71 56.85
Average of s.d. of wage, observ = a firm 25.36 26.21 25.87
(s.d.) 6.92 7.56 7.12
90%-ile 33.86 35.50 34.76
75%-ile 29.43 30.73 31.10
median 25.32 25.88 25.76
25%-ile 20.38 21.53 21.53
10%-ile 16.48 17.30 16.77
[N – firms] 763 732 731
Average Coefficient of variation of wages (observ = a firm) 0.30 0.30 0.30
(s.d.) 0.0007 0.0007 0.0007
90%-ile 0.38 0.38 0.40
75%-ile 0.34 0.34 0.33
median 0.30 0.30 0.30
25%-ile 0.34 0.34 0.25
10%-ile 0.22 0.21 0.22
[N – firms] 763 732 731
Correlation(average wage, s.d. of wage), observ = a firm 0.63 0.69 0.59
p-value 0.0001 0.0001 0.0001
17
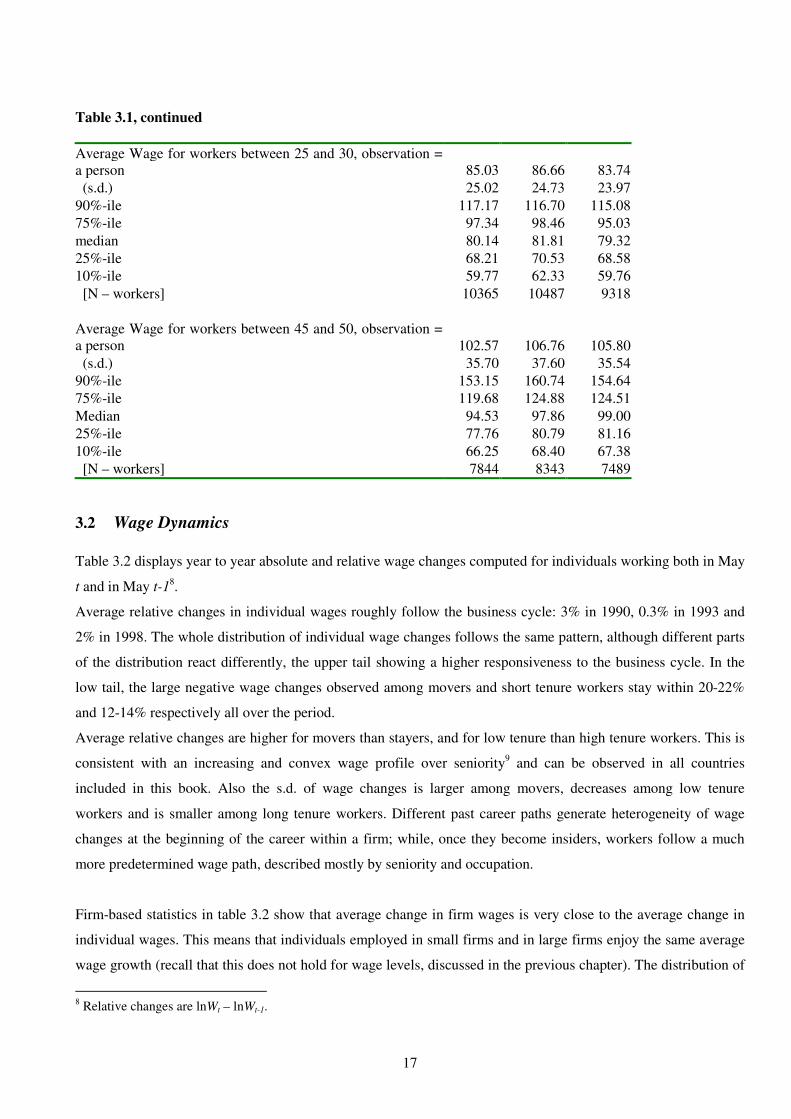
Table 3.1, continued
Average Wage for workers between 25 and 30, observation =
a person 85.03 86.66 83.74
(s.d.) 25.02 24.73 23.97
90%-ile 117.17 116.70 115.08
75%-ile 97.34 98.46 95.03
median 80.14 81.81 79.32
25%-ile 68.21 70.53 68.58
10%-ile 59.77 62.33 59.76
[N – workers] 10365 10487 9318
Average Wage for workers between 45 and 50, observation =
a person 102.57 106.76 105.80
(s.d.) 35.70 37.60 35.54
90%-ile 153.15 160.74 154.64
75%-ile 119.68 124.88 124.51
Median 94.53 97.86 99.00
25%-ile 77.76 80.79 81.16
10%-ile 66.25 68.40 67.38
[N – workers] 7844 8343 7489
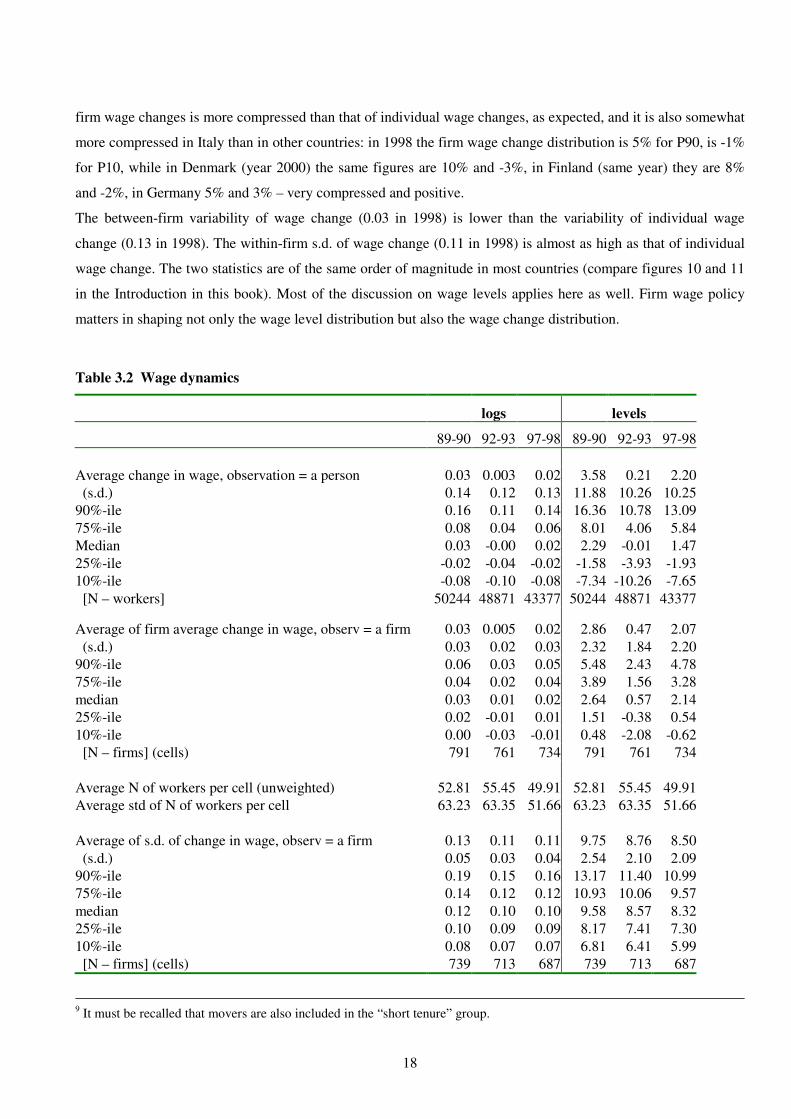
3.2 Wage Dynamics
Table 3.2 displays year to year absolute and relative wage changes computed for individuals working both in May
t and in May t-18.
Average relative changes in individual wages roughly follow the business cycle: 3% in 1990, 0.3% in 1993 and
2% in 1998. The whole distribution of individual wage changes follows the same pattern, although different parts
of the distribution react differently, the upper tail showing a higher responsiveness to the business cycle. In the
low tail, the large negative wage changes observed among movers and short tenure workers stay within 20-22%
and 12-14% respectively all over the period.
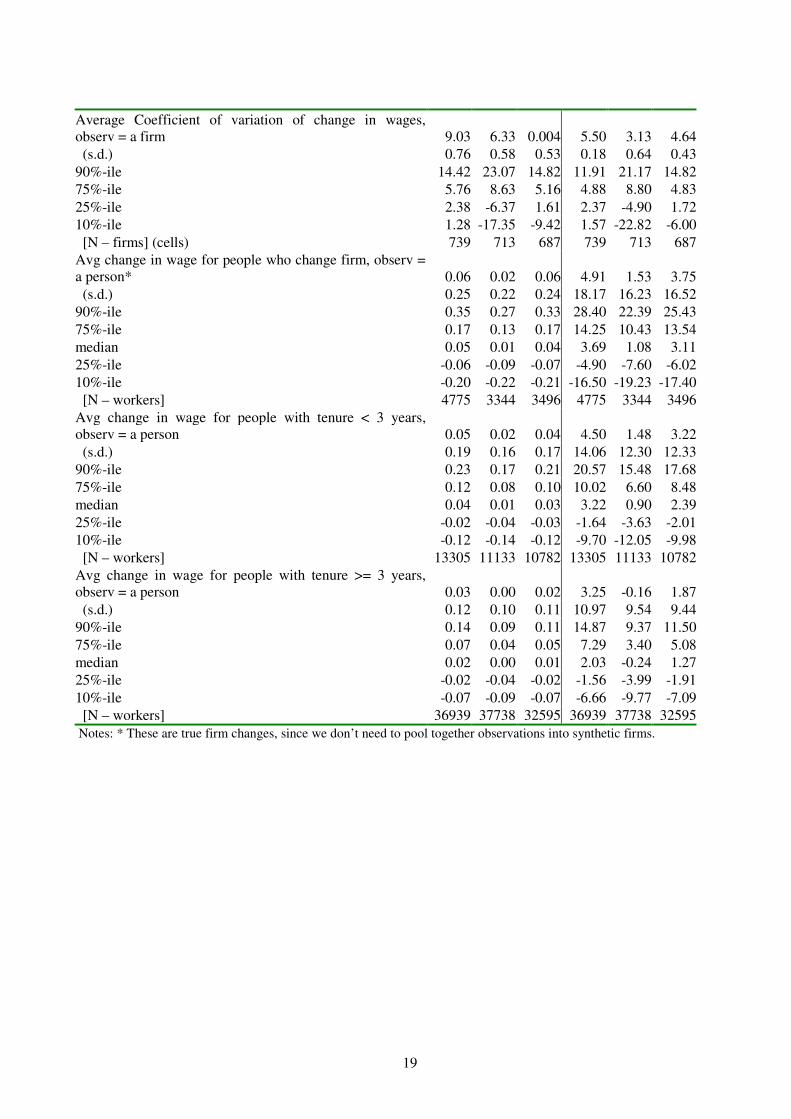
Average relative changes are higher for movers than stayers, and for low tenure than high tenure workers. This is
consistent with an increasing and convex wage profile over seniority9 and can be observed in all countries
included in this book. Also the s.d. of wage changes is larger among movers, decreases among low tenure
workers and is smaller among long tenure workers. Different past career paths generate heterogeneity of wage
changes at the beginning of the career within a firm; while, once they become insiders, workers follow a much
more predetermined wage path, described mostly by seniority and occupation.
Firm-based statistics in table 3.2 show that average change in firm wages is very close to the average change in
individual wages. This means that individuals employed in small firms and in large firms enjoy the same average
wage growth (recall that this does not hold for wage levels, discussed in the previous chapter). The distribution of
8 Relative changes are lnWt – lnWt-1.
18
firm wage changes is more compressed than that of individual wage changes, as expected, and it is also somewhat
more compressed in Italy than in other countries: in 1998 the firm wage change distribution is 5% for P90, is -1%
for P10, while in Denmark (year 2000) the same figures are 10% and -3%, in Finland (same year) they are 8%
and -2%, in Germany 5% and 3% – very compressed and positive.
The between-firm variability of wage change (0.03 in 1998) is lower than the variability of individual wage
change (0.13 in 1998). The within-firm s.d. of wage change (0.11 in 1998) is almost as high as that of individual
wage change. The two statistics are of the same order of magnitude in most countries (compare figures 10 and 11
in the Introduction in this book). Most of the discussion on wage levels applies here as well. Firm wage policy
matters in shaping not only the wage level distribution but also the wage change distribution.
Table 3.2 Wage dynamics
logs levels
89-90 92-93 97-98 89-90 92-93 97-98
Average change in wage, observation = a person 0.03 0.003 0.02 3.58 0.21 2.20
(s.d.) 0.14 0.12 0.13 11.88 10.26 10.25
90%-ile 0.16 0.11 0.14 16.36 10.78 13.09
75%-ile 0.08 0.04 0.06 8.01 4.06 5.84
Median 0.03 -0.00 0.02 2.29 -0.01 1.47
25%-ile -0.02 -0.04 -0.02 -1.58 -3.93 -1.93
10%-ile -0.08 -0.10 -0.08 -7.34 -10.26 -7.65
[N – workers] 50244 48871 43377 50244 48871 43377
Average of firm average change in wage, observ = a firm 0.03 0.005 0.02 2.86 0.47 2.07
(s.d.) 0.03 0.02 0.03 2.32 1.84 2.20
90%-ile 0.06 0.03 0.05 5.48 2.43 4.78
75%-ile 0.04 0.02 0.04 3.89 1.56 3.28
median 0.03 0.01 0.02 2.64 0.57 2.14
25%-ile 0.02 -0.01 0.01 1.51 -0.38 0.54
10%-ile 0.00 -0.03 -0.01 0.48 -2.08 -0.62
[N – firms] (cells) 791 761 734 791 761 734
Average N of workers per cell (unweighted) 52.81 55.45 49.91 52.81 55.45 49.91
Average std of N of workers per cell 63.23 63.35 51.66 63.23 63.35 51.66
Average of s.d. of change in wage, observ = a firm 0.13 0.11 0.11 9.75 8.76 8.50
(s.d.) 0.05 0.03 0.04 2.54 2.10 2.09
90%-ile 0.19 0.15 0.16 13.17 11.40 10.99
75%-ile 0.14 0.12 0.12 10.93 10.06 9.57
median 0.12 0.10 0.10 9.58 8.57 8.32
25%-ile 0.10 0.09 0.09 8.17 7.41 7.30
10%-ile 0.08 0.07 0.07 6.81 6.41 5.99
[N – firms] (cells) 739 713 687 739 713 687
9 It must be recalled that movers are also included in the “short tenure” group.
19
Average Coefficient of variation of change in wages,
observ = a firm 9.03 6.33 0.004 5.50 3.13 4.64
(s.d.) 0.76 0.58 0.53 0.18 0.64 0.43
90%-ile 14.42 23.07 14.82 11.91 21.17 14.82
75%-ile 5.76 8.63 5.16 4.88 8.80 4.83
25%-ile 2.38 -6.37 1.61 2.37 -4.90 1.72
10%-ile 1.28 -17.35 -9.42 1.57 -22.82 -6.00
[N – firms] (cells) 739 713 687 739 713 687
Avg change in wage for people who change firm, observ =
a person* 0.06 0.02 0.06 4.91 1.53 3.75
(s.d.) 0.25 0.22 0.24 18.17 16.23 16.52
90%-ile 0.35 0.27 0.33 28.40 22.39 25.43
75%-ile 0.17 0.13 0.17 14.25 10.43 13.54
median 0.05 0.01 0.04 3.69 1.08 3.11
25%-ile -0.06 -0.09 -0.07 -4.90 -7.60 -6.02
10%-ile -0.20 -0.22 -0.21 -16.50 -19.23 -17.40
[N – workers] 4775 3344 3496 4775 3344 3496
Avg change in wage for people with tenure < 3 years,
observ = a person 0.05 0.02 0.04 4.50 1.48 3.22
(s.d.) 0.19 0.16 0.17 14.06 12.30 12.33
90%-ile 0.23 0.17 0.21 20.57 15.48 17.68
75%-ile 0.12 0.08 0.10 10.02 6.60 8.48
median 0.04 0.01 0.03 3.22 0.90 2.39
25%-ile -0.02 -0.04 -0.03 -1.64 -3.63 -2.01
10%-ile -0.12 -0.14 -0.12 -9.70 -12.05 -9.98
[N – workers] 13305 11133 10782 13305 11133 10782
Avg change in wage for people with tenure >= 3 years,
observ = a person 0.03 0.00 0.02 3.25 -0.16 1.87
(s.d.) 0.12 0.10 0.11 10.97 9.54 9.44
90%-ile 0.14 0.09 0.11 14.87 9.37 11.50
75%-ile 0.07 0.04 0.05 7.29 3.40 5.08
median 0.02 0.00 0.01 2.03 -0.24 1.27
25%-ile -0.02 -0.04 -0.02 -1.56 -3.99 -1.91
10%-ile -0.07 -0.09 -0.07 -6.66 -9.77 -7.09
[N – workers] 36939 37738 32595 36939 37738 32595
Notes: * These are true firm changes, since we don’t need to pool together observations into synthetic firms.
20
3.3 Mobility
Focus: firm data, turnover and legal transformations
In WHIP firm archive the monthly employment stock and average firm wage are reported. The employment stock counts all
workers, including part time, apprentices and managers, that were excluded from the previous tables.
We use the monthly employment series to approximate worker flows: positive monthly changes in employment are entries
and negative changes are exits. The sum of monthly entries (exits) relative to the average yearly employment is the firm entry
(exit) rate.
There are two sources of measurement error. The first is that we miss across-month churning: if a worker exits during a given
month and her position is filled in the following month, we do not measure any monthly change in the employment stock,
since the latter is measured as the number of heads present in the payroll in a given month. The second one is that we cannot
easily control for legal transformations. We handle with this computing monthly changes from January to November only
and reweighting them to twelve months, since most legal transformations take place between December and January (end of
the Italian fiscal year). Furthermore, we exclude entry and exit rates above 200%. However, the exclusion of spurious
movements remains imperfect.
The firm average wage refers to white and blue collar workers only. We select firms employing at least 20 employees.
The sum of entry and exit rate measured on worker data yealds a gross turnover of about 47% in 1998. This is the
turnover rate relative to people working in firms above 20 employees10
. When computing the same statistics with
firm data we tend to overestimate all rates. The overestimate in entry and exit rates is larger during the 1993
downturn, while they are more precisely estimated in 1998 and 1990. The imperfect control of legal
transformations may explain the upward bias when many reorganizations took place (see Box).
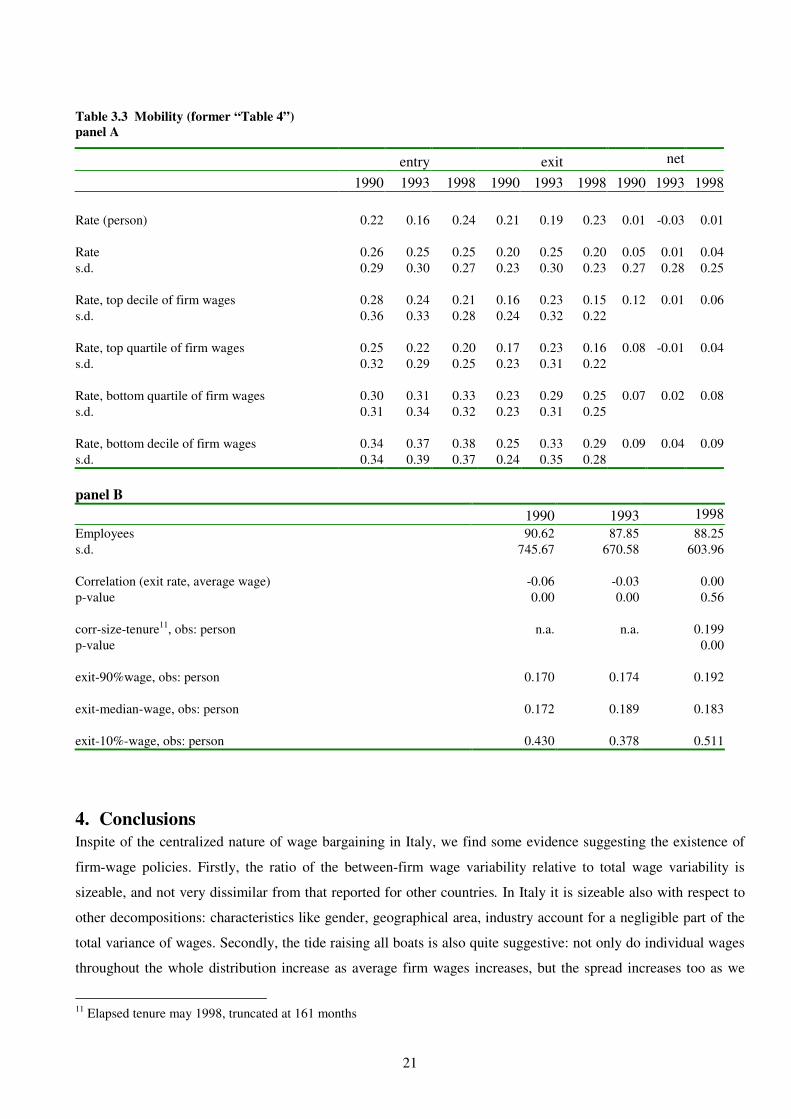
Low wage firms show almost always the highest positive net flows, which is consistent with what observed in
other countries. This is explained by the correlation between average firm size and firm wages, since in Italy most
job creation occurs in the small firm sector. Top decile firms have higher net flows then top quartile ones, due to
the better growth performance of firms with a high skilled workforce. The positive correlation between average
firm size and firm wages explains also the ranking in turnover levels, with low wage firms showing the highest
turnover.
Finally, correlation between firm size and individual seniority in the firm is positive, and exit rates decline as
wages increase. All this is consistent with the size of the internal labour market that provides opportunities for
advancement without leaving the firm, and with declining external wage offers that can dominate the current
wage as the current wage increases.
10
The same figure is about 60% considering all firms, see chapter 1.3.
21
Table 3.3 Mobility (former “Table 4”)
panel A
entry exit net
1990 1993 1998 1990 1993 1998 1990 1993 1998
Rate (person) 0.22 0.16 0.24 0.21 0.19 0.23 0.01 -0.03 0.01
Rate 0.26 0.25 0.25 0.20 0.25 0.20 0.05 0.01 0.04
s.d. 0.29 0.30 0.27 0.23 0.30 0.23 0.27 0.28 0.25
Rate, top decile of firm wages 0.28 0.24 0.21 0.16 0.23 0.15 0.12 0.01 0.06
s.d. 0.36 0.33 0.28 0.24 0.32 0.22
Rate, top quartile of firm wages 0.25 0.22 0.20 0.17 0.23 0.16 0.08 -0.01 0.04
s.d. 0.32 0.29 0.25 0.23 0.31 0.22
Rate, bottom quartile of firm wages 0.30 0.31 0.33 0.23 0.29 0.25 0.07 0.02 0.08
s.d. 0.31 0.34 0.32 0.23 0.31 0.25
Rate, bottom decile of firm wages 0.34 0.37 0.38 0.25 0.33 0.29 0.09 0.04 0.09
s.d. 0.34 0.39 0.37 0.24 0.35 0.28
panel B
1990 1993 1998
Employees 90.62 87.85 88.25
s.d. 745.67 670.58 603.96
Correlation (exit rate, average wage) -0.06 -0.03 0.00
p-value 0.00 0.00 0.56
corr-size-tenure11
, obs: person n.a. n.a. 0.199
p-value 0.00
exit-90%wage, obs: person 0.170 0.174 0.192
exit-median-wage, obs: person 0.172 0.189 0.183
exit-10%-wage, obs: person 0.430 0.378 0.511
4. Conclusions
Inspite of the centralized nature of wage bargaining in Italy, we find some evidence suggesting the existence of
firm-wage policies. Firstly, the ratio of the between-firm wage variability relative to total wage variability is
sizeable, and not very dissimilar from that reported for other countries. In Italy it is sizeable also with respect to
other decompositions: characteristics like gender, geographical area, industry account for a negligible part of the
total variance of wages. Secondly, the tide raising all boats is also quite suggestive: not only do individual wages
throughout the whole distribution increase as average firm wages increases, but the spread increases too as we
11
Elapsed tenure may 1998, truncated at 161 months
22
move from P10 to P90, indicating that the rewards of high pay individuals are highly differentiated even within
the same employer. This is coherent with the detected positive correlation between firm size and firm wages. In
Italy, almost all large firms directly bargain over wages with unions, holding the nation-wide industry contract as
a benchmark. This is less frequent among small firms, which at times refer to local agreements at the district
level.
Firm wage policy matters in shaping not only the wage level distribution but also the wage change distribution.
The within-firm s.d. of wage change is almost as high as that of individual wage change, and much higher than
between-firm variability of average change in wages. Worker-based statistics, on the other side, show that relative
changes in individual wages follow the business cycle, although different parts of the distribution react in a
different way to it, the upper tail having a higher responsiveness. Both facts are at odds with the often reported
rigidity of Italian wages. Indeed, the detected flexibility is mainly driven by movers and short tenure workers,
who show higher and more dispersed relative wage changes. Different past career paths generate heterogeneity of
wage changes at the beginning of the career within a firm; while, once they become insiders, workers follow a
much more predetermined wage path, described mostly by seniority and occupation.
The above results, and the simple comparisons between stayers and movers wage careers (see table 1.3), are in
line with well established facts: wage growth (on impact) is often higher among movers, while wage levels are
lower compared to stayers’, before and, often, also after the job switch. Along similar lines suggested by Lazear
and Shaw, we find that negative wage growth is more common among movers and short tenure workers. In
addition, worker entry and exit rates are higher at low-pay firms, and lower at high-pay firms. This stylized fact
is, however, of more difficult interpretation, as composition effects due to the high correlation between firm size
and wages may hide the conclusion. Nor do we have any direct evidence that voluntary mobility is higher where
wage compression is high. The cross-country comparison suggests that the relatively high degree of wage
compression in Italy could be associated with higher entry and exit rates, but, as Lazear and Shaw stress in the
introduction, we must be cautious in this comparison as the different data sets used in this book measure exit over
different time intervals and types of jobs.
23
5. Methodological Appendix
5.1 Data Used
In order to produce the tables presented, we used the Work Histories Italian Panel (WHIP), a database developed
at the LABORatorio R. Revelli based on administrative data from the Italian Social Security (INPS).
For the purpose of this chapter we used the WHIP section on dependent employment, which is a Linked
Employer Employee Database made up of a 1:90 sample of employees over the period from 1985 up to 2001.
Details on the database, and a public use file of it can be found at http://www.laboratoriorevelli.it/whip.
5.1.1 Treatment of legal transformations, mergers and acquisitions
The use of administrative data on firms poses the problem of the treatment of legal transformations.
Administrative archives treat events such as ownership transfers, bequests, donations, and legal transformations
as they were firms’ start ups and closures, even if these events do not produce a real interruption in the life of a
firm. These events generate “spurious” flows of firms, jobs and workers.
The WHIP data base detects and corrects legal transformations firstly through a longitudinal firm identification
algorithm, that builds directly on the firm data provided by Inps. This algorithm is particularly suited to correct
for mergers and acquisitions involving establishment or plants.
Moreover, the linkage between employees and the firms for which they are working enable to detect other legal
transformations tracking simultaneous flows of workers between two or more firms. The key is to discriminate
between “normal” movements, deriving from workers’ decisions to change jobs, and “spurious” movements. It is
intuitively unlikely that “many” workers of a company independently and simultaneously decide to move together
to another firm, whereas this event will take place if all, or part of the activities of the first firm are transferred to
the second firm, or if the second firm is just a legal transformation of the first. In order to identify spurious
components a threshold for the intensity of such movements has been established. Given WHIP sampling ratio,
the observation of two workers moving within one month from the same firm (call it A) to a same firm (call it B)
would statistically mean that on average firm A has handed over about 180 workers to firm B. Thus, if we
observe in the same month at least two workers move from firm A to firm B we call it a spurious movement.
Once we detect spurious movements in this way, we proceed by keeping connected the job spells of every worker
who has made the same movement in the months before or after.
5.1.2 The synthetic firm approach
Since WHIP is a 1:90 random sample of workers, for all small and medium sized firms we do not have a
representative sample of their employees. In the firm archive, moreover, we observe the average wage paid to
blue and white collars, but not the s.d. Only if the firm is sufficiently large, is the number of observed workers
sufficient to estimate the s.d. of wages. For 99% of firms recorded in WHIP we have less than 10 workers
belonging to the same firm; for 83% of them we have just one worker.
24
In order to compute firm-based statistics in chapter 3, then, we had to pool together firms into cells – that we
called “synthetic firms”. Using the latter instead of true firms, though, leads to an underestimation of between-
firm variability and to a parallel overestimation of within-firm variability, since we attribute to “within cell” the
variability “between firms belonging to the same cell”. To limit this bias we had to choose the finest grid, that still
granted a sufficient number of observations per cell. After several explorations we ended up with an 800-cells
grid along the following partitions:
• Geography: 20 Italian regions;
• Firm size: 5 classes (20-49, 50-99, 100-199, 200-499, 500+ workers)12
;
• Sector of activity: 44 classes (Nace-70 2-digit sectors).
Each cell has been weighted with the actual number of firms with the same characteristics in the population, as
published by “Osservatorio INPS”, the official aggregate statistics on the population produced by INPS.
The validity of the “synthetic firm” approach is tested using a dataset that covers the whole population of workers
and firms located in two provinces of Veneto, in the Italian North-East (Treviso and Vicenza). On this dataset we
mimicked the sampling procedure that generates WHIP, and then we pooled the resulting firm sample using three
different synthetic firm definitions. This way we evaluate how within and between variance estimates vary at
increasing levels of cell disaggregation, and how far we are from the statistics measured in the firm population.
Results are as follows:
1. Worker-based statistics computed in the sample are pretty close to true values (and, obviously, do not
change at different synthetic firm definitions);
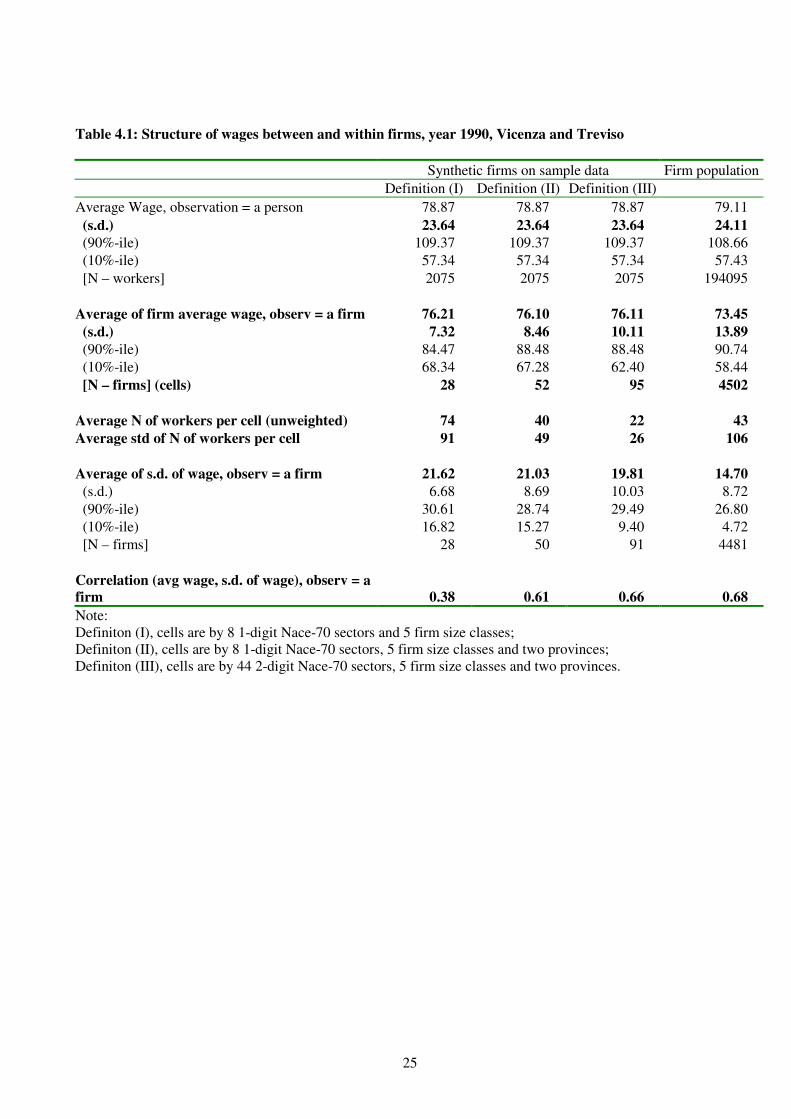
2. As expected, between firm variability is always underestimated in synthetic firms with respect to
population values, while within firm variability is overestimated. This problem should become smaller
the smaller the cells are. Comparing the three definitions we have that as cells become smaller the bias
decreases. This is particularly true for the between firm variability, that goes from 7.32 to 10.11 (the true
value being 13.89).
3. The correlation between average wage and s.d. of wage, at the highest level of disaggregation, is almost
equal to the correlation computed at the firm level.
12
Firms under 20 employees have been excluded for cross country comparability.
25
Table 4.1: Structure of wages between and within firms, year 1990, Vicenza and Treviso
Synthetic firms on sample data Firm population
Definition (I) Definition (II) Definition (III)
Average Wage, observation = a person 78.87 78.87 78.87 79.11
(s.d.) 23.64 23.64 23.64 24.11
(90%-ile) 109.37 109.37 109.37 108.66
(10%-ile) 57.34 57.34 57.34 57.43
[N – workers] 2075 2075 2075 194095
Average of firm average wage, observ = a firm 76.21 76.10 76.11 73.45
(s.d.) 7.32 8.46 10.11 13.89
(90%-ile) 84.47 88.48 88.48 90.74
(10%-ile) 68.34 67.28 62.40 58.44
[N – firms] (cells) 28 52 95 4502
Average N of workers per cell (unweighted) 74 40 22 43
Average std of N of workers per cell 91 49 26 106
Average of s.d. of wage, observ = a firm 21.62 21.03 19.81 14.70
(s.d.) 6.68 8.69 10.03 8.72
(90%-ile) 30.61 28.74 29.49 26.80
(10%-ile) 16.82 15.27 9.40 4.72
[N – firms] 28 50 91 4481
Correlation (avg wage, s.d. of wage), observ = a
firm 0.38 0.61 0.66 0.68
Note:
Definiton (I), cells are by 8 1-digit Nace-70 sectors and 5 firm size classes;
Definiton (II), cells are by 8 1-digit Nace-70 sectors, 5 firm size classes and two provinces;
Definiton (III), cells are by 44 2-digit Nace-70 sectors, 5 firm size classes and two provinces.
26
References
Battistin, E., E. Rettore & U. Trivellato (2006) “Choosing among alternative classification criteria to measure the
labour force state”, The Journal of the Royal Statistical Society, Series A, forthcoming
Blanchard, O.J. and Diamond, P. (1990), The Cyclical Behavior of Gross Flows of Workers in the United States,
in «Brookings Papers of Economic Activity», n. 2, pp. 85-155
Borgarello A., Devicienti F. (2001) “Trends in the Italian Earnings Distribution, 1985-1996”, LABORatorio R.
Revelli Working Papers, No. 2
Brandolini, A., P. Cipollone & E. Viviano (2006) “Does the ILO Definition Capture All Unemployment?,”
Journal of the European Economic Association, MIT Press, vol. 4(1), pages 153-179, March.
Brandolini, A., P. Casadio, P. Cipollone, M. Magnani, A. Rosolia e R. Torrini (2006), “Employment Growth in
Italy in the 1990s: Institutional Arrangements and Market Forces”, in N. Acocella and R. Leoni (eds.), Social
pacts, employment and growth: A Reappraisal of Ezio Tarantelli’s Thought, Physica-Verlag, Berlin, 2006.
Contini, C. and C. Villosio, (2003) “Worker Mobility, job displacement and wage dynamics in Italy”,
LABORatorio R. Revelli, W.P. No 24.
Contini, B. and U. Trivellato (eds) (2005) Eppur si Muove. Dinamiche e Persistenze nel Mercato del Lavoro
Italiano, Il Mulino, Bologna
Contini, B. (ed) (2002) Labour Mobility and Wage Dynamics in Italy, Rosemberg & Sellier, Torino.
Davis, S.J. e Haltiwanger, J. (1999), “Gross Job Flows”, in Handbook of Labor Economics, vol. 3B, (a cura di)
Ashenfelter, O.e Card, D., Amsterdam, North-Holland
Devicienti F., A. Maida and P. Sestito (2004) “Nominal and Real Wage Rigidity: An Assessment Using Italian
Microdata”. LABORatorio R. Revelli W.P. No. 33
Devicienti F. (2006) “Earnings Mobility in Italy, 1985-1999”, mimeo
ISTAT (2004) Rapporto Annuale, Rome
Leombruni, R. and R. Quaranta (2002) “Worker mobility: structural changes and cyclical behaviour” in Contini
(2002)
Leombruni, R. and R. Quaranta (2005) “Eppure si muoveva già: Una breve storia della mobilità dei lavoratori in
Italia”, in Contini and Trivellato (2005)
OECD (2004), Ageing and Employment Policies / Vieillissement et politiques de l’emploi – Italy, Paris
Ministry of Labour (2001) Rapporto di monitoraggio delle politiche del lavoro, Rome