Embed Size (px)
Citation preview

Waiting Times for Hospital Treatment
Standard Note: SN07009
Last updated: 18 March 2015
Author: Carl Baker
Section Social and General Statistics
How long do patients wait for hospital treatment after referral by a GP? Under the NHS
Constitution for England, patients have a legal right to start consultant-led treatment within a
maximum of 18 weeks from referral for non-urgent conditions. This note presents data,
charts and maps on the number of people treated, waiting times by NHS area team and NHS
provider, and data on individual treatment specialisms. An outline of data for Wales and
Scotland is also presented.
The percentage of patients waiting less than 18 weeks for treatment involving admission to
hospital fell below the 90% target for much of 2014. The 95% target for non-admitted patients
has also been breached on two occasions. In late 2014 these drops were in line with a
waiting list initiative involving a ‘managed breach’ of targets and a suspension of some
penalties for failing to meet the targets.
Performance also fell on the incomplete (waiting list) measure in 2014, though this target is
still being met as of January 2015. Waiting lists for hospital treatment reached their highest
level in six years in Jun 2014. While the waiting list has since fallen in number by around 7%,
its level remains higher than at any time between April 2008 and March 2014.
This information is provided to Members of Parliament in support of their parliamentary duties
and is not intended to address the specific circumstances of any particular individual. It should
not be relied upon as being up to date; the law or policies may have changed since it was last
updated; and it should not be relied upon as legal or professional advice or as a substitute for
it. A suitably qualified professional should be consulted if specific advice or information is
required.
This information is provided subject to our general terms and conditions which are available
online or may be provided on request in hard copy. Authors are available to discuss the
content of this briefing with Members and their staff, but not with the general public.
2
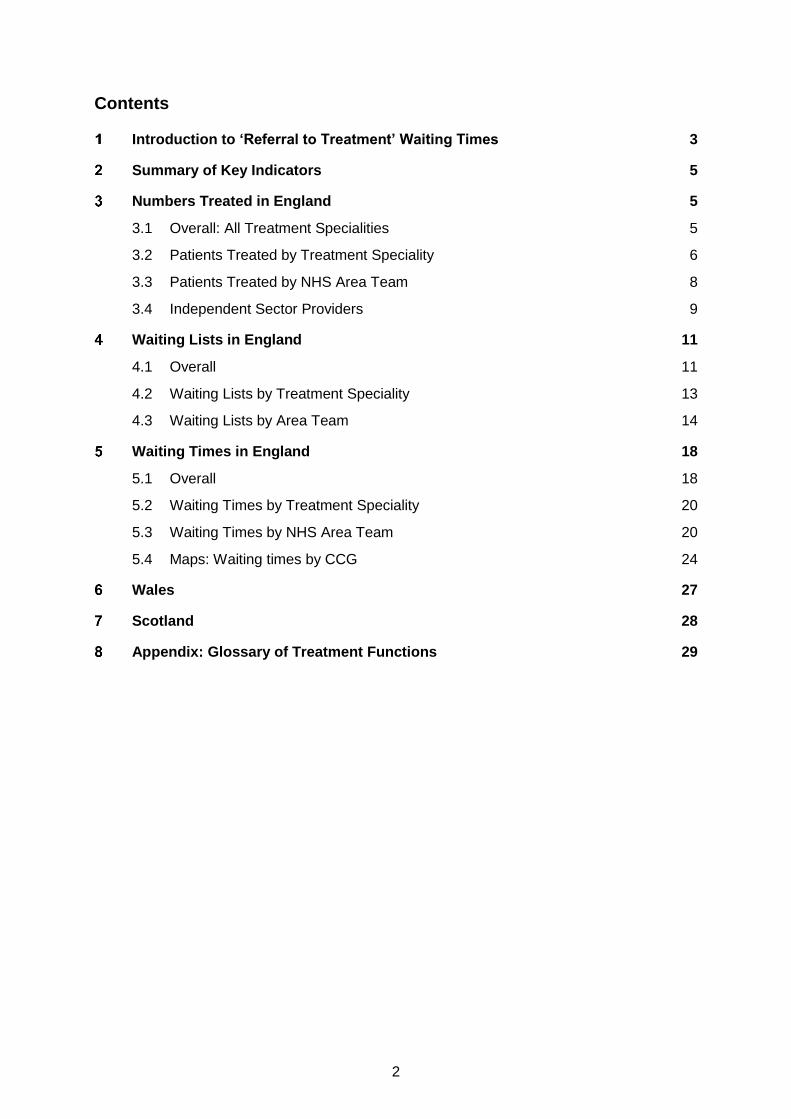
Contents
Introduction to ‘Referral to Treatment’ Waiting Times 3
Summary of Key Indicators 5
Numbers Treated in England 5
3.1 Overall: All Treatment Specialities 5
3.2 Patients Treated by Treatment Speciality 6
3.3 Patients Treated by NHS Area Team 8
3.4 Independent Sector Providers 9
Waiting Lists in England 11
4.1 Overall 11
4.2 Waiting Lists by Treatment Speciality 13
4.3 Waiting Lists by Area Team 14
Waiting Times in England 18
5.1 Overall 18
5.2 Waiting Times by Treatment Speciality 20
5.3 Waiting Times by NHS Area Team 20
5.4 Maps: Waiting times by CCG 24
Wales 27
Scotland 28
Appendix: Glossary of Treatment Functions 29

3
Introduction to ‘Referral to Treatment’ Waiting Times
Under the NHS Constitution for England, patients have a legal right to start treatment within
18 weeks after GP referral for non-urgent conditions. If this is not possible, the NHS must
take reasonable steps to offer them a range of alternative providers. The data which
measures success on this commitment, published since 2007, is known as ‘Referral to
Treatment’, or ‘RTT’.
The targets (or ‘operational standards’) for RTT waiting times are as follows:
Admitted (Adjusted), 90%: 90% of all RTT patients whose treatment pathway
involves admission to hospital should be treated within 18 weeks of referral. These
are also known as ‘inpatient’ waiting times. They are measured on an adjusted basis,
meaning that delays due to patients refusing reasonable appointment offers are
discounted from the waiting time which counts for the target.1
Non-Admitted, 95%: 95% of all RTT patients whose treatment pathway does not
involve admission to hospital should be treated within 18 weeks of referral. These are
also known as ‘outpatient’ waiting times.
Incomplete, 92%: 92% of all patients waiting to start treatment should have been
waiting for less than 18 weeks. These are also known as ‘waiting list’ waiting times.
These targets are designed to allow tolerance for situations where starting treatment within
18 weeks would be inconvenient or clinically inappropriate. These include cases where
patients choose to delay appointments, cases where patients do not attend appointments,
and cases where clinically-based exceptions are needed.
There is also a “zero tolerance” policy for any RTT waits of more than 52 weeks, with such
waits resulting in contractual penalties.
Further information about RTT waiting times, including definitions and FAQs, can be found
on NHS England’s statistical work area2. Data for each provider and commissioner in
England is published monthly, with a data lag of five weeks. Unless otherwise stated, all data
in this note is taken from NHS England’s statistical publications at the aforementioned site.
Recent Developments: ‘Managed Breach’ and Focus on Long Waits
In August 2014, the Secretary of State for Health announced that the NHS would prioritise
patients who had endured long waits for routine treatment. It was also admitted that this may
involve a ‘managed breach’ of the targets described above; a time during which the targets
may not be met due to the focus on those who have waited for excessively long periods. Mr
Hunt stated:
I want the NHS to put particular focus on anyone who has been waiting more than 18
weeks since being referred for treatment, so have asked NHS England to commission
100,000 additional treatments over the summer including 40,000 additional inpatient
1 Data is also published for admitted pathways on an unadjusted basis, but this is not subject to a waiting times
target. 2 http://www.england.nhs.uk/statistics/statistical-work-areas/rtt-waiting-times/rtt-data-2014-15/

4
admissions. This focus on long waiters may mean we undershoot the 18 week target for a
temporary period, although we will return to meeting it before the end of the year. Indeed
as the many NHS target experts will know we could ensure we met the 18 week target
every month by focusing those 100,000 additional treatments on shorter rather than
longer waiters. But that would be an indefensible betrayal of those who have been waiting
the longest and not one I would be prepared to sanction as Health Secretary. The truth is
we need to ensure both that 90% of people get their treatment within 18 weeks - the
official target - and that people who are not treated within that period are not neglected.
So I have set a timeframe of this calendar year to deliver on both of those objectives.3
This waiting list initiative, and the associated ‘managed breach’, ended in November 2014. In
February 2015, a letter to NHS trusts and CCGs from NHS England, Monitor and the Trust
Development Authority stated that “we do not expect CCGs to enact contractual sanctions for
underperformance against the 3 RTT standards” in Q4 2014/15 where this was a result of
work to reduce potential 18-week waits.
It is important to note key differences between the RTT targets. The ‘Incomplete’ target
measures the waiting list: waiting times of patients who are still waiting for treatment. The
‘Admitted (Adjusted)’ and ‘Non-Admitted’ measure activity – they measure waiting times for
those who are treated each month. Because providers have control over how to schedule
treatments, performance on the Admitted and Non-Admitted targets can be a direct result of
who the provider has chosen to treat in a given month. For instance, if a provider were to
treat only ‘long waiters’ (18+ weeks) in a particular month, it would fail the Admitted and Non-
Admitted targets, since 0% of those treated would have waited less than 18 weeks. In doing
so, however, it may have cleared its waiting list of the longest waiters. On the other hand, if a
provider chose to treat only ‘short waiters’ (those waiting less than 18 weeks) in a particular
month then it would excel on the Admitted and Non-Admitted targets, scoring 100% on both.
But in doing so, it would have allowed those who had already waited for over 18 weeks to
wait even longer before treatment. Recent guidance from the NHS Intensive Support Team
suggests that all other things being equal, patients should be offered treatment dates in
chronological order according to their length of wait.
3 Aug 4th 2014, NHS waiting times: job not done3
5
Summary of Key Indicators
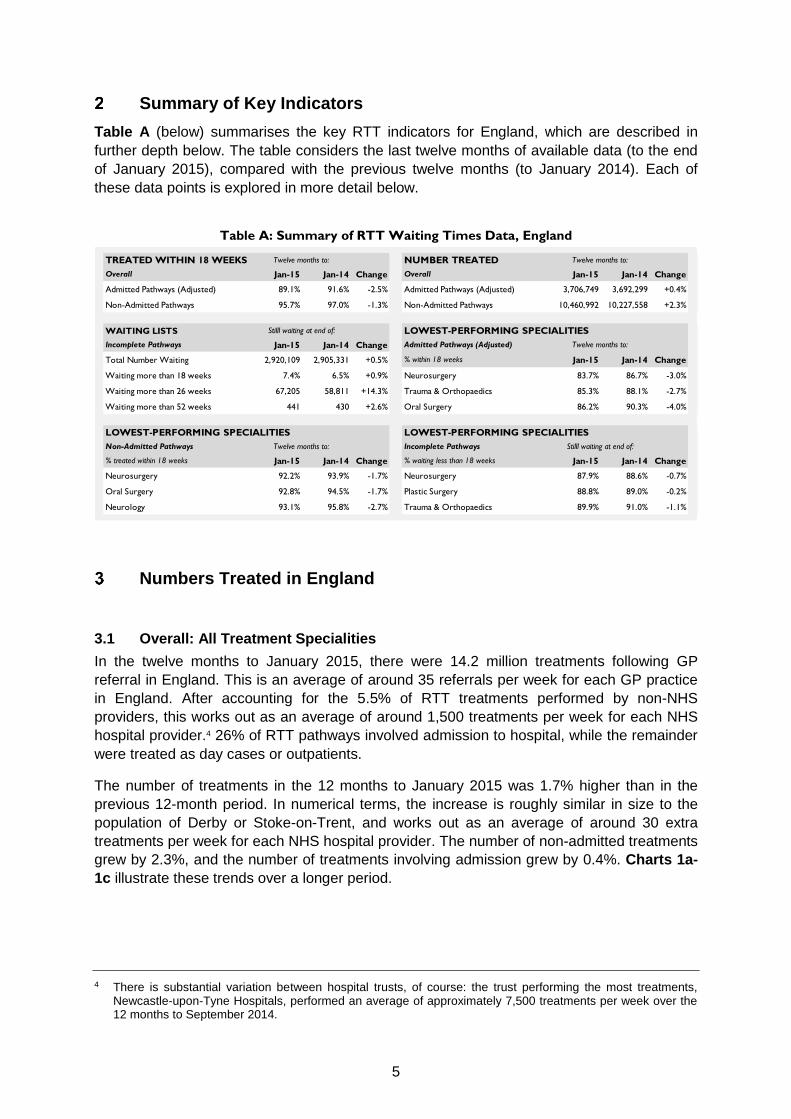
Table A (below) summarises the key RTT indicators for England, which are described in
further depth below. The table considers the last twelve months of available data (to the end
of January 2015), compared with the previous twelve months (to January 2014). Each of
these data points is explored in more detail below.
Table A: Summary of RTT Waiting Times Data, England
Numbers Treated in England
3.1 Overall: All Treatment Specialities
In the twelve months to January 2015, there were 14.2 million treatments following GP
referral in England. This is an average of around 35 referrals per week for each GP practice
in England. After accounting for the 5.5% of RTT treatments performed by non-NHS
providers, this works out as an average of around 1,500 treatments per week for each NHS
hospital provider.4 26% of RTT pathways involved admission to hospital, while the remainder
were treated as day cases or outpatients.
The number of treatments in the 12 months to January 2015 was 1.7% higher than in the
previous 12-month period. In numerical terms, the increase is roughly similar in size to the
population of Derby or Stoke-on-Trent, and works out as an average of around 30 extra
treatments per week for each NHS hospital provider. The number of non-admitted treatments
grew by 2.3%, and the number of treatments involving admission grew by 0.4%. Charts 1a-
1c illustrate these trends over a longer period.
4 There is substantial variation between hospital trusts, of course: the trust performing the most treatments,
Newcastle-upon-Tyne Hospitals, performed an average of approximately 7,500 treatments per week over the 12 months to September 2014.
TREATED WITHIN 18 WEEKS NUMBER TREATED
Overall Jan-15 Jan-14 Change Overall Jan-15 Jan-14 Change
Admitted Pathways (Adjusted) 89.1% 91.6% -2.5% Admitted Pathways (Adjusted) 3,706,749 3,692,299 +0.4%
Non-Admitted Pathways 95.7% 97.0% -1.3% Non-Admitted Pathways 10,460,992 10,227,558 +2.3%
WAITING LISTS LOWEST-PERFORMING SPECIALITIES
Incomplete Pathways Jan-15 Jan-14 Change Admitted Pathways (Adjusted)
Total Number Waiting 2,920,109 2,905,331 +0.5% % within 18 weeks Jan-15 Jan-14 Change
Waiting more than 18 weeks 7.4% 6.5% +0.9% Neurosurgery 83.7% 86.7% -3.0%
Waiting more than 26 weeks 67,205 58,811 +14.3% Trauma & Orthopaedics 85.3% 88.1% -2.7%
Waiting more than 52 weeks 441 430 +2.6% Oral Surgery 86.2% 90.3% -4.0%
LOWEST-PERFORMING SPECIALITIES LOWEST-PERFORMING SPECIALITIES
Non-Admitted Pathways Incomplete Pathways
% treated within 18 weeks Jan-15 Jan-14 Change % waiting less than 18 weeks Jan-15 Jan-14 Change
Neurosurgery 92.2% 93.9% -1.7% Neurosurgery 87.9% 88.6% -0.7%
Oral Surgery 92.8% 94.5% -1.7% Plastic Surgery 88.8% 89.0% -0.2%
Neurology 93.1% 95.8% -2.7% Trauma & Orthopaedics 89.9% 91.0% -1.1%
Twelve months to: Twelve months to:
Twelve months to:
Twelve months to: Stilll waiting at end of:
Stilll waiting at end of:

6
Charts 1a-1c: Number of patients treated on RTT pathways, England
Millions, four-month moving average Annual
3.2 Patients Treated by Treatment Speciality
RTT treatments are recorded by ‘speciality’, i.e. the type of treatment involved. The two
specialities with the largest number of treatments are trauma & orthopaedics and
ophthalmology, together comprising 23% of all treatments. Chart 2 shows treatments
performed in each speciality and a breakdown of admitted/non-admitted treatments for each
speciality. The specialities with the greatest proportion of admitted treatments are
cardiothoracic surgery and plastic surgery, while geriatric medicine and neurology have the
lowest proportion of admitted treatments. A glossary of treatment function definitions,
explaining what each of these specialities includes, can be found in the appendix to this
document.
Chart 2: Number of treatments by speciality and mode
England, 12 months to January 2015
Admitted
Non-
Admitted
Total
0.0
0.3
0.6
0.9
1.2
Aug-07 Aug-08 Aug-09 Aug-10 Aug-11 Aug-12 Aug-13 Aug-140
2
4
6
8
10
2008-09 2013-14
Admitted, millions
0
2
4
6
8
10
2008-09 2013-14
Non-Admitted, millions
Admitted Non-Admitted Total
Trauma & Orthopaedics 691,000 1,070,000 1,761,000
Ophthalmology 518,000 1,013,000 1,531,000
General Surgery 452,000 745,000 1,197,000
Gynaecology 272,000 763,000 1,036,000
ENT 194,000 779,000 973,000
Dermatology 85,000 739,000 824,000
Urology 236,000 388,000 624,000
Cardiology 117,000 477,000 595,000
Oral Surgery 197,000 373,000 571,000
Gastroenterology 171,000 338,000 509,000
Neurology 14,000 292,000 306,000
Rheumatology 24,000 262,000 285,000
Thoracic Medicine 21,000 242,000 263,000
Plastic Surgery 141,000 116,000 256,000
General Medicine 38,000 212,000 251,000
Geriatric Medicine 2,000 123,000 125,000
Neurosurgery 29,000 57,000 86,000
Cardiothoracic Surgery 24,000 13,000 36,000
Rounded to nearest thousand
Admitted Non-Admitted
0 0.5 1 1.5
Cardiothoracic Surgery
Neurosurgery
Geriatric Medicine
General Medicine
Plastic Surgery
Thoracic Medicine
Rheumatology
Neurology
Gastroenterology
Oral Surgery
Cardiology
Urology
Dermatology
ENT
Gynaecology
General Surgery
Ophthalmology
Trauma & Orthopaedics
Millions

7
There were also almost 3 million pathways (of which almost 2.5 million non-admitted) not
shown in Chart 2 whose treatment speciality was recorded as ‘Other’– i.e. a speciality which
does not fall into the eighteen categories listed above.
Following on from Chart 2, Table B shows how the number of treatments in each speciality
has changed year-on-year. Specialities are sorted by total change in the number of
treatments. Percentage changes are shown on the right, with orange shading representing a
rise and blue shading representing a fall. Gastroenterology saw the largest increase in both
numerical and percentage terms.
Table B: Year-on-Year change in treatments by speciality
12 months ending Jan 15 compared with 12 months ending Jan 14. Rounded to nearest hundred
Charts 3a-3r (overleaf) show trends in the number of patients treated in each speciality since
April 2008, along with the relative volume of admitted and non-admitted treatments in each
specialism. These charts show relative rather than absolute values: for example, there are
six times as many referrals for non-admitted gynaecology treatments as for geriatric
medicine. For absolute difference in activity between specialisms, see Chart 2 above. These
charts allow us to observe changes over time: for example, the gradual decline of non-
admitted pathways in general medicine, and the recent upturn in non-admitted pathways in
urology.
AdmittedNon-
AdmittedTOTAL Admitted
Non-
AdmittedTOTAL
Gastroenterology +15,300 +43,000 +58,300 +10% +15% +13%
Trauma & Orthopaedics +2,700 +48,300 +51,000 +0% +5% +3%
Dermatology +1,200 +38,100 +39,300 +1% +5% +5%
Urology -6,700 +30,200 +23,500 -3% +8% +4%
Rheumatology +2,400 +16,600 +19,000 +11% +7% +7%
Thoracic Medicine 0 +16,100 +16,100 +0% +7% +7%
General Surgery -21,600 +36,300 +14,700 -5% +5% +1%
Ophthalmology +18,600 -5,500 +13,100 +4% -1% +1%
Neurology +1,400 +10,100 +11,500 +11% +4% +4%
Cardiology +3,200 +5,300 +8,500 +3% +1% +1%
Plastic Surgery +1,600 +5,700 +7,300 +1% +5% +3%
Oral Surgery -2,400 +7,400 +5,000 -1% +2% +1%
Geriatric Medicine -400 +2,600 +2,200 -15% +2% +2%
Cardiothoracic Surgery +100 +1,400 +1,500 +0% +13% +4%
Neurosurgery -1,800 +2,900 +1,100 -6% +5% +1%
Other +39,900 -39,200 +700 +9% -2% +0%
Gynaecology -21,800 +18,500 -3,300 -7% +2% -0%
ENT -11,200 +4,400 -6,800 -5% +1% -1%
General Medicine -6,100 -8,800 -14,900 -14% -4% -6%
Speciality
Change % Change

8
Charts 3a-3r: Treatments by Speciality: Trends 2008-2014
3.3 Patients Treated by NHS Area Team
Chart 4 shows regional variation in the number of treatments performed relative to the size
of the population in each NHS area team. This data is based on the location of the CCG
commissioning the treatment, so it may not accurately reflect the location where the
treatment was actually carried out.
Admitted Non-Admitted
Apr-08 Apr-14
Cardiology
Apr-08 Apr-14
Ear, Nose & Throat
Apr-08 Apr-14
Cardiothoracic Surgery
Apr-08 Apr-14
Dermatology
Apr-08 Apr-14
Gastroenterology
Apr-08 Apr-14
General Medicine
Apr-08 Apr-14
General Surgery
Apr-08 Apr-14
Neurology
Apr-08 Apr-14
Geriatric Medicine
Apr-08 Apr-14
Gynaecology
Apr-08 Apr-14
Neurosurgery
Apr-08 Apr-14
Ophthalmology
Apr-08 Apr-14
Oral Surgery
Apr-08 Apr-14
Thoracic Medicine
Apr-08 Apr-14
Plastic Surgery
Apr-08 Apr-14
Rheumatology
Apr-08 Apr-14
Trauma & Orthopaedics
Apr-08 Apr-14
Urology

9
Figures given here are the number of completed pathways per 1,000 population. So a figure
of 100 represents one completed pathway for every ten residents over the course of a year.
Chart 4: Completed RTT Pathways per 1,000 Population, by NHS Area Team
12 months to January 2015
Source for population data: ONS small area population estimates mid-2013
3.4 Independent Sector Providers
In the 12 months to January 2015, over 780,000 RTT pathways involved treatment by an
independent sector provider following an NHS commission. This is 14% higher than the
number referred to independent sector organisations in the previous twelve months.
Independent sector providers accounted for around 5.5% of all RTT activity in the most
recent period. Chart 5 shows trends in these numbers.
Chart 5: Independent Sector RTT Pathways, 2013-2015
Tables C and D (below) show changes in the number of independent sector commissions by
area team and by treatment speciality. Since area teams came into existence in April 2013,
the periods used for comparison are April 2014–January 2015 and April 2013–January 2014.
Trauma & orthopaedics is the speciality with the highest independent sector activity, with four
times more pathways than any other speciality.
55
65
60
59
48
58
65
66
59
62
54
76
70
61
63
67
79
67
70
74
70
64
76
79
67
122
142
152
156
169
159
164
166
175
172
182
161
176
190
188
193
184
201
200
203
209
232
220
229
246
0 50 100 150 200 250 300
Thames Valley
Arden, Herefordshire and Worcestershire
Derbyshire and Nottinghamshire
Bath, Gloucs, Swindon and Wiltshire
London
Hertfordshire and the South Midlands
Kent and Medway
East Anglia
Leicestershire and Lincolnshire
Birmingham and the Black Country
Essex
Wessex
Bristol, N Somerset, Somerset and S Gloucs
Shropshire and Staffordshire
South Yorkshire and Bassetlaw
Surrey and Sussex
Devon, Cornwall and Isles of Scilly
Lancashire
West Yorkshire
North Yorkshire and Humber
Cheshire, Warrington and Wirral
Greater Manchester
Cumbria, Northumberland, Tyne and Wear
Durham, Darlington and Tees
Merseyside
0
10,000
20,000
30,000
40,000
Feb-13 Aug-13 Feb-14 Aug-14
Admitted Non-Admitted

10
Table C: Independent sector RTT pathways by NHS area team
Table D: Independent sector RTT pathways by treatment speciality
% of all pathways
Apr-14 to Jan-15 Apr-13 to Jan-14 % Increase Increase at IS providers
Arden, Herefordshire and Worcestershire 8,700 5,600 +54% +3,100 3%
Bath, Gloucs, Swindon and Wiltshire 31,000 28,400 +9% +2,600 12%
Birmingham and the Black Country 20,300 14,600 +39% +5,700 4%
Bristol, Somerset and South Gloucs 31,000 26,000 +19% +5,000 11%
Cheshire, Warrington and Wirral 11,700 11,100 +6% +600 4%
Cumbria, Northumberland, Tyne and Wear 10,300 8,900 +16% +1,400 2%
Derbyshire and Nottinghamshire 52,500 47,300 +11% +5,200 15%
Devon, Cornwall and Isles of Scilly 26,400 25,300 +4% +1,100 7%
Durham, Darlington and Tees 16,100 13,600 +18% +2,500 5%
East Anglia 14,800 12,900 +14% +1,900 3%
Essex 28,800 33,400 -14% -4,600 9%
Greater Manchester 84,100 78,300 +7% +5,800 13%
Hertfordshire and the South Midlands 25,900 24,700 +5% +1,200 5%
Kent and Medway 17,500 15,200 +15% +2,300 5%
Lancashire 32,500 23,800 +36% +8,700 10%
Leicestershire and Lincolnshire 8,900 8,100 +10% +800 3%
London 38,600 32,800 +18% +5,800 3%
Merseyside 13,900 14,200 -2% -300 5%
North Yorkshire and Humber 14,500 10,600 +37% +3,900 4%
Shropshire and Staffordshire 9,500 7,500 +27% +2,000 3%
South Yorkshire and Bassetlaw 5,800 2,200 +165% +3,600 2%
Surrey and Sussex 57,900 38,200 +52% +19,700 10%
Thames Valley 19,400 16,200 +20% +3,200 7%
Wessex 43,700 36,600 +19% +7,100 8%
West Yorkshire 36,400 38,600 -6% -2,200 7%
Number of pathways Change
Year to Jan-15 Year to Jan-14
Cardiology 1,766 3,123 -43%
Cardiothoracic Surgery 556 863 -36%
Dermatology 38,953 31,257 +25%
ENT 60,029 58,726 +2%
Gastroenterology 54,040 44,576 +21%
General Medicine 1,465 1,168 +25%
General Surgery 95,790 84,450 +13%
Geriatric Medicine 792 1,226 -35%
Gynaecology 52,347 49,110 +7%
Neurology 2,410 2,757 -13%
Neurosurgery 6,134 4,124 +49%
Ophthalmology 63,702 45,738 +39%
Oral Surgery 13,028 12,451 +5%
Other 58,264 54,112 +8%
Plastic Surgery 5,895 5,627 +5%
Rheumatology 6,340 6,398 -1%
Thoracic Medicine 2,096 1,825 +15%
Trauma & Orthopaedics 282,089 245,684 +15%
Urology 37,950 34,441 +10%
Change

11
Waiting Lists in England
This section documents waiting times for patients whose RTT treatment pathways are still
ongoing – that is, patients who are still waiting for treatment.
4.1 Overall
At the end of September 2014, just over 2.9 million patients were waiting to start consultant-
led treatment. This represents almost 6% of the English population, or a number larger than
the populations of either Greater Manchester or the West Midlands. Seven trusts did not
submit data on incomplete RTT pathways in January 2015; NHS England estimate that, if
these were included, the true number waiting for treatment would be just over 3.1 million.
In 2014 waiting lists reached their highest levels since early 2008, having been steadily
growing since early 2012. Chart 6 shows the RTT waiting list compared with the number of
patients treated in each month. Waiting lists follow a clear annual cycle, with numbers waiting
peaking in the summer months and typically falling in the autumn. 2013-14 was an exception
in that the autumn fall was only very slight.
Chart 6: Number waiting for treatment and number treated in each month
Four-month moving average
Chart 7 (below) shows the year-on-year change in the number of patients waiting and
treated in the past three months for each month since 2008. Given that RTT waiting lists and
waiting times exhibit an annual cycle of growth and decline, as discussed above, this year-
on-year comparison allows us to observe trends more clearly. The chart shows that the rate
of increase in the size of the RTT waiting list peaked in early 2014. Since then the waiting list
has been growing, but at decreasing rate. The chart also shows that the large waiting list
increase in 2013 and 2014 came at a time when the number of treatments performed was
experiencing a year-on-year fall.
0
1
2
3
4
Aug-07 Aug-08 Aug-09 Aug-10 Aug-11 Aug-12 Aug-13 Aug-14
Mill
ions

12
Chart 7: Year-on-Year change in patients treated (three-month average) and patients waiting
Despite the increase in the size of the RTT waiting list, NHS England as a whole continues to
meet its target for incomplete RTT pathways. As noted earlier, the target is that 92% of
patients waiting for treatment should have been waiting for less than 18 weeks. As Chart 8
shows, the percentage waiting over 18 weeks remains below the 8% level required to breach
this target. There has been a slight decline in performance on this measure since early 2013
– but performance is still better on this measure now than at any time before 2012. Chart 9
compares waiting lists at the end of January in 2012, 2013, 2014 and 2015.
Chart 8: RTT Waiting List: Patients waiting for over 18 weeks
Chart 9: Waiting times of patients still waiting for treatment
Comparison 2012-2015
% of patients waiting less than stated number of weeks
-40%
-30%
-20%
-10%
0%
10%
20%
Aug-08 Aug-09 Aug-10 Aug-11 Aug-12 Aug-13 Aug-14
Patients waiting
Patients treated
0%
8%
16%
24%
Apr-08 Apr-09 Apr-10 Apr-11 Apr-12 Apr-13 Apr-14
41% 62% 79% 97%41% 62% 80% 98%39% 60% 79% 98%37% 58% 77% 98%0%
20%
40%
60%
80%
100%
Less than 4 weeks Less than 8 weeks Less than 12 weeks Less than 26 weeks
Jan-12
Jan-13
Jan-14
Jan-15

13
One year waits
In August 2007, over half a million people on the RTT waiting list had been waiting for over a
year. This was 13.8% of the total waiting list at the time. This number has fallen dramatically:
the number fell to 32,000 in April 2009, 11,000 in October 2011, and 1,100 in December
2012. Since 2013 the number has stayed between 200 and 600. Note that current figures are
likely to underestimate the total number of one year waiters because of the seven providers
not currently reporting their data on incomplete pathways.
While there has been a large reduction in the number of one-year waiters since 2007, it has
not so far proved possible to eradicate one-year waits entirely.
4.2 Waiting Lists by Treatment Speciality
One way to gauge the size of waiting lists in individual treatment specialities is to compare
the number of patients waiting with the number of patients who have been treated recently.
Chart 10 does this, showing the ratio of patients waiting at the end of January 2015 to the
total number of patients treated in the three months to January 2015. A value above 1 – as
recorded by three specialisms – indicates that the number of patients on the waiting list is
greater than the total treated in the past three months. That is to say that even if no new
patients were referred in these specialisms, it would still take over three months to clear the
waiting list at current rates.
Chart 10: Ratio of patients still waiting to patients treated in last three months, by speciality
As of January 2015
Meanwhile, Chart 11 shows the change in waiting list for each treatment speciality over the
past twelve months. Overall, almost 15,000 more people were on the RTT waiting list at the
end of January 2015 than a year earlier.
0 0.2 0.4 0.6 0.8 1 1.2
Geriatric Medicine
Gynaecology
Dermatology
Plastic Surgery
Rheumatology
General Medicine
Other
Cardiothoracic Surgery
Ophthalmology
ENT
Thoracic Medicine
Trauma & Orthopaedics
General Surgery
Cardiology
Oral Surgery
Urology
Gastroenterology
Neurology
Neurosurgery
ALL SPECIALITIES

14
The biggest percentage increase was in gastroenterology, where the waiting list at the end of
January 2015 was nearly 12% higher than a year earlier. Excluding gastroenterology, there
was almost no net increase in the total waiting list. Waiting lists fell in over half of specialities.
Chart 11: Year-on-year change in waiting list size by speciality, Jan 14 to Jan 15
4.3 Waiting Lists by NHS Area Team
Of the 25 NHS area teams in England, 19 were meeting the waiting list target (92% of
patients waiting for less than eighteen weeks) at the end of January 2015. One year earlier,
at the end of January 2014, all but one area team was meeting the target.
Table D (below) details waiting list waiting times by area team. For January 2015, the
percentage of patients waiting for less than 4, 8, 12, 18 and 26 weeks are all shown. A
comparison to the key 18-week target measure for January 2014 is also given. Shading
shows performance relative to the England-wide average: so green shading represents
performance above the English average on the measure in question, while orange shading
represents below-average performance.
As with all data presented in this document, the Library can provide information for local NHS
providers and commissioners to Members and their staff on request.
Specialism Change %
TOTAL +14,778 +0.5%
Gastroenterology +13,902 +11.6%
Other +9,214 +1.7%
General Surgery +5,929 +2.3%
Thoracic Medicine +2,631 +4.8%
Dermatology +1,596 +1.1%
Neurosurgery +1,038 +4.1%
Rheumatology +813 +1.6%
Neurology +694 +0.8%
Cardiothoracic Surgery -321 -4.3%
ENT -361 -0.2%
Gynaecology -703 -0.4%
Ophthalmology -731 -0.2%
Geriatric Medicine -1,427 -7.7%
Oral Surgery -1,757 -1.3%
Plastic Surgery -1,929 -4.0%
Cardiology -2,400 -1.8%
Urology -2,609 -1.7%
General Medicine -2,902 -5.8%
Trauma & Orthopaedics -5,899 -1.5%

15
Table E: Waiting list waiting times by NHS Area Team
Patients waiting at end of January 2015
Waiting less than 4 weeks 8 weeks 12 weeks 18 weeks 26 weeks 18 weeks Change
Merseyside 44.1% 64.6% 82.1% 95.3% 99.0% 95.7% -0.4%
Lancashire 39.3% 62.5% 81.5% 94.7% 98.5% 94.4% +0.4%
Durham, Darlington and Tees 41.5% 62.9% 81.1% 94.7% 98.7% 94.9% -0.2%
Wessex 38.4% 60.0% 79.5% 94.4% 98.9% 94.7% -0.3%
Birmingham and the Black Country 37.3% 59.1% 78.4% 94.2% 98.3% 93.8% +0.4%
Shropshire and Staffordshire 40.3% 61.9% 80.1% 93.9% 98.5% 93.1% +0.8%
West Yorkshire 36.9% 57.9% 77.3% 93.8% 98.8% 94.7% -0.9%
Greater Manchester 40.6% 61.9% 79.9% 93.7% 98.2% 94.1% -0.3%
Cheshire, Warrington and Wirral 38.3% 59.2% 77.6% 93.6% 98.5% 94.2% -0.6%
Derbyshire and Nottinghamshire 37.8% 59.5% 78.3% 93.4% 98.3% 94.7% -1.2%
South Yorkshire and Bassetlaw 40.6% 61.4% 79.3% 93.3% 98.3% 93.6% -0.3%
Cumbria, Northumberland, Tyne and Wear 38.1% 58.5% 77.1% 93.1% 98.1% 93.7% -0.7%
Essex 36.8% 57.6% 77.1% 93.0% 98.1% 94.5% -1.5%
Kent and Medway 38.1% 59.5% 78.7% 92.6% 97.8% 94.0% -1.4%
Devon, Cornwall and Isles of Scilly 39.2% 60.5% 78.1% 92.4% 97.9% 92.5% -0.1%
North Yorkshire and Humber 37.3% 58.5% 77.3% 92.2% 98.0% 92.8% -0.5%
Bath, Gloucs, Swindon and Wiltshire 34.6% 53.6% 72.9% 92.1% 97.8% 93.1% -1.0%
Thames Valley 36.3% 57.1% 77.0% 92.1% 97.7% 89.8% +2.3%
London 37.1% 58.5% 77.4% 92.0% 97.7% 92.3% -0.2%
Leicestershire and Lincolnshire 36.0% 57.1% 77.2% 91.8% 97.4% 93.4% -1.6%
Hertfordshire and the South Midlands 36.5% 58.3% 77.2% 91.6% 97.7% 93.7% -2.1%
Surrey and Sussex 32.8% 53.8% 73.7% 91.1% 97.6% 93.2% -2.1%
East Anglia 35.4% 55.5% 74.3% 90.8% 98.4% 95.8% -5.0%
Arden, Herefordshire and Worcestershire 36.2% 56.4% 74.2% 90.4% 97.4% 94.3% -3.9%
Bristol, Somerset and South Gloucs 34.7% 53.8% 72.4% 89.8% 96.3% 92.1% -2.3%
ENGLAND 37.1% 58.2% 77.2% 92.6% 97.7% 93.5% -0.7%
Jan-15 Jan-14
KEY Above English average Below English Average

16
Chart 11 (below) reproduces the effect of Chart 9 (above) for area teams rather than
treatment specialities, showing the ratio of patients waiting at the end of January 2015 to the
total number of patients treated in the three months ending January 2015. A value above 1 –
as recorded by two area teams – indicates that the number of patients on the waiting list is
greater than the total treated in the past three months.
Chart 12: Ratio of patients still waiting to patients treated within prior three months,
by NHS Area Team, as of January 2015
Table F (overleaf) shows waiting list performance for each area team by treatment speciality.
Green squares represent a speciality for which the area team in question is meeting the
incomplete RTT target. Orange shading represents a breach of the target, with darker orange
shading showing cases where performance on the measure is below 85%.
The only speciality for which all area teams met the target at the end of January was
gynaecology. Almost half of area teams breached the target for urology, trauma &
orthopaedics and neurosurgery in January 2015.
Values are only shown where 100 people or more are waiting for a particular speciality in the
area team. Blank squares show where this is not the case. Oral surgery is excluded here
since over 95% of treatments are referred by NHS England rather than a local area team.
0 0.25 0.5 0.75 1 1.25
Durham, Darlington and Tees
Merseyside
Birmingham and the Black Country
Kent and Medway
Shropshire and Staffordshire
Lancashire
Devon, Cornwall and Isles of Scilly
Wessex
Greater Manchester
Cheshire, Warrington and Wirral
Essex
North Yorkshire and Humber
South Yorkshire and Bassetlaw
Hertfordshire and the South Midlands
Cumbria, Northumberland, Tyne and Wear
Leicestershire and Lincolnshire
West Yorkshire
Derbyshire and Nottinghamshire
Surrey and Sussex
London
Arden, Herefordshire and Worcestershire
Bristol, Somerset and South Gloucs
East Anglia
Bath, Gloucs, Swindon and Wiltshire
Thames Valley

17
Table F: Patients waiting for treatment at end of January 2015, % waiting less than 18 weeks
by area team and treatment speciality
Car
diol
ogy
Der
mat
ology
Ear
, Nos
e an
d Thr
oat
Gas
troen
tero
logy
Gen
eral
Med
icin
e
Gen
eral
Sur
gery
Ger
iatric
Med
icin
e
Gyn
aeco
logy
Neu
rolo
gy
Neu
rosu
rger
y
Opht
halm
olog
y
Oth
er
Pla
stic
Sur
gery
Rhe
umat
ology
Thor
acic
Med
icin
e
Trau
ma
& O
rtho
pae
dics
Uro
logy
Arden, Herefordshire and Worcestershire 94% 91% 88% 93% 96% 86% 96% 94% 96% 90% 94% 92% 82% 96% 81% 88% 87%
Bath, Gloucestershire, Swindon and Wiltshire 92% 92% 95% 91% 95% 88% 98% 94% 91% 77% 97% 93% 91% 94% 96% 90% 90%
Birmingham and the Black Country 95% 93% 94% 97% 98% 90% 98% 96% 96% 86% 95% 95% 94% 94% 95% 94% 92%
Bristol, Somerset and South Gloucs 91% 92% 94% 94% 98% 89% 99% 96% 88% 82% 91% 89% 88% 97% 93% 84% 87%
Cheshire, Warrington and Wirral 93% 96% 95% 94% 94% 90% 100% 95% 97% 95% 94% 94% 94% 94% 95% 92% 94%
Cumbria, Northumberland, Tyne and Wear 94% 96% 94% 93% 96% 92% 98% 96% 98% 93% 94% 95% 92% 96% 96% 87% 92%
Derbyshire and Nottinghamshire 94% 95% 95% 96% 94% 87% 97% 96% 96% 98% 92% 95% 94% 97% 94% 91% 93%
Devon, Cornwall and Isles of Scilly 94% 93% 93% 96% 98% 90% 97% 93% 92% 75% 93% 96% 84% 99% 94% 90% 92%
Durham, Darlington and Tees 98% 98% 95% 96% 96% 93% 96% 95% 95% 94% 95% 96% 93% 96% 96% 93% 93%
East Anglia 93% 88% 90% 95% 95% 89% 96% 92% 94% 77% 95% 88% 89% 92% 95% 90% 93%
Essex 94% 87% 92% 96% 97% 91% 98% 94% 96% 88% 93% 95% 93% 94% 96% 91% 94%
Greater Manchester 95% 96% 93% 95% 91% 91% 99% 94% 98% 91% 96% 94% 95% 96% 97% 92% 95%
Hertfordshire and the South Midlands 96% 91% 90% 94% 99% 90% 97% 94% 90% 82% 94% 93% 90% 93% 89% 87% 89%
Kent and Medway 96% 86% 95% 97% 98% 93% 98% 94% 96% 71% 92% 95% 94% 97% 99% 88% 95%
Lancashire 94% 97% 96% 95% 95% 92% 99% 97% 96% 99% 97% 95% 84% 97% 98% 93% 95%
Leicestershire and Lincolnshire 96% 94% 90% 95% 97% 90% 88% 93% 91% 91% 94% 89% 93% 95% 94% 90% 90%
London 90% 96% 91% 93% 95% 90% 94% 95% 95% 88% 94% 92% 83% 97% 96% 87% 90%
Merseyside 96% 96% 97% 96% 98% 93% 99% 95% 96% 96% 96% 99% 97% 93% 96%
North Yorkshire and Humber 93% 93% 94% 89% 98% 90% 99% 94% 93% 95% 93% 95% 82% 90% 87% 92% 92%
Shropshire and Staffordshire 96% 98% 96% 98% 99% 91% 97% 93% 98% 91% 94% 95% 93% 97% 95% 90% 94%
South Yorkshire and Bassetlaw 86% 97% 96% 96% 96% 90% 94% 93% 98% 98% 94% 94% 87% 96% 98% 91% 92%
Surrey and Sussex 94% 96% 94% 86% 96% 89% 97% 94% 87% 82% 90% 94% 92% 90% 94% 89% 91% KEY
Thames Valley 93% 94% 95% 96% 94% 90% 99% 96% 95% 93% 85% 93% 84% 98% 95% 92% 94% 92%+ Meeting target
Wessex 97% 93% 94% 95% 95% 93% 99% 95% 93% 89% 94% 97% 92% 98% 98% 93% 92% 85% - 92%
West Yorkshire 98% 95% 94% 95% 99% 92% 99% 95% 97% 95% 94% 94% 90% 98% 96% 90% 91% Below 85%Breaching target}

18
Waiting Times in England
This section examines waiting times for patients treated – that is, how long patients wait for
hospital treatment after GP referral. This differs from the topic of the last section – incomplete
pathways measure those who are still waiting for treatment, whereas the admitted and non-
admitted measures discussed in this section measure waiting times for those whose RTT
pathways are complete.
As mentioned at the outset of this document, the RTT activity targets are that 90% of
completed pathways involving admission to hospital should be completed within 18 weeks,
and 95% of completed pathways not involving admission to hospital should be completed
within 18 weeks.
5.1 Overall
18-Week Measure
The 90% target for admitted pathways (on an adjusted basis) has been breached for ten of
the last twelve months. In late 2014 this was in line with the ‘amnesty’ on the admitted and
non-admitted targets. Prior to 2014, the target had not been breached since March 2011.
The 95% target for non-admitted patients was met every month from 2008 until November
2014. Chart 13 shows the percentage of patients waiting for over 18 weeks in each month
since 2008. The sharp changes in recent months are likely to reflect changes in management
decision as a result of the waiting times initiative (and associated ‘managed breach’ of the
targets).
Chart 13: Patients waiting for over 18 weeks: Completed RTT pathways
Median and 95th Percentile Waiting Times
While the 18-week measure is the officially monitored waiting times target, it does not tell the
full story about RTT waiting times. Simply knowing that someone waited less than 18 weeks
for treatment does not tell us how long they waited – and given that nine-tenths of patients
wait for less than 18 weeks, it is natural to wonder precisely how long the typical patient waits
for treatment. The RTT data gives us a breakdown of how many patients for each number of
weeks before treatment (i.e. how many waited 1-2 weeks, how many waited 2-3 weeks, etc)
along with data on the median and 95th percentile waiting times. The median waiting time is
Admitted (adjusted)
Non-admitted
0%
5%
10%
15%
Apr-08 Apr-09 Apr-10 Apr-11 Apr-12 Apr-13 Apr-14

19
the middle value of all waiting times – so if the median time is 6 weeks then we know that
half of patients waited for more than 6 weeks and half waited for less than 6 weeks. The 95th
percentile measures the waiting times for those who waited longest – so if the 95th percentile
waiting time is 18 weeks, this means that 5% of patients waited for more than 18 weeks.
Charts 14a and 14b illustrate the median and 95th percentile RTT waiting times.
Charts 14a and 14b: RTT Waiting Times in England, Median and 95th Percentile
Number of weeks waited
Chart 14a shows the median waiting time for treatment on a four-month moving average
basis. For admitted patients, this has risen slowly from eight weeks in 2008 to just over nine
weeks at present. For non-admitted patients the median wait stayed at just over four weeks
(save for seasonal variation) between 2009 and 2013, but rose sharply in mid-to-late 2013. It
is has now stabilised at just over 5 weeks.
Chart 14b shows the 95th percentile RTT waiting time. Notably, the 95th percentile waiting
time for admitted patients is only 39% higher than for non-admitted patients – a substantially
smaller gap than for the median, where the value for admitted patients is 63% higher than for
non-admitted patients and has historically been closer to 100% higher. Both admitted
pathways and non-admitted pathways have seen a slow rise in the 95th percentile waiting
time since early 2013. Currently, 5% of admitted patients wait for 24½ weeks or more, and
5% of non-admitted patients wait for 18 weeks or more.
MEDIAN
4-month moving ave.
Admitted
Non-Admitted
95TH PERCENTILE
0
2
4
6
8
10
Apr-08 Apr-09 Apr-10 Apr-11 Apr-12 Apr-13 Apr-14
0
5
10
15
20
25
30
Apr-08 Apr-09 Apr-10 Apr-11 Apr-12 Apr-13 Apr-14

20
5.2 Waiting Times by Treatment Speciality
Table G shows RTT waiting times performance by treatment speciality in the 12-month
periods ending January 2014 and January 2015. Green shading denotes that the relevant
waiting time target has been met, while orange shading indicates that the target was
breached.
Most specialities saw a decline in performance between 2014 and 2015 for both Admitted
(Adjusted) and Non-Admitted pathways.
Table G: RTT 18-Week Waiting Times by Treatment Speciality
5.3 Waiting Times by NHS Area Team
Table H shows RTT waiting times by NHS area team for the 12 months ending January
2015. 10 of 25 area teams met the 90% target for admitted (adjusted) pathways. All but five
areas met the 95% target for non-admitted pathways.
This chart includes a comparison with the twelve months to January 2014. While NHS area
teams came into existence only in April 2013 – i.e. during this twelve month period – it is
nevertheless possible to perform a notional comparison by mapping the commissioners
which existed before this time (Primary Care Trusts) with current area teams. This allows us
to see how performance has changed in different areas of England. The contrast is most
stark for admitted (adjusted) pathways, where the number of area teams breaching the target
Meeting target Breaching target
Year to Jan 15 Year to Jan 14 Year to Jan 15 Year to Jan 14 End of Jan 15 End of Jan 14
Cardiology 92.0% 94.2% 96.1% 97.3% 93.6% 94.3%
Cardiothoracic Surgery 86.7% 87.4% 96.7% 98.0% 90.0% 90.2%
Dermatology 92.6% 95.6% 95.9% 97.6% 93.9% 95.7%
Ear, Nose & Throat 86.4% 89.6% 95.7% 97.0% 93.2% 93.6%
Gastroenterology 97.9% 98.8% 93.4% 96.1% 93.8% 94.5%
General Medicine 98.2% 98.5% 97.5% 98.2% 95.3% 96.2%
General Surgery 87.9% 90.5% 95.6% 96.5% 90.4% 91.6%
Geriatric Medicine 98.7% 99.2% 98.7% 99.1% 97.0% 97.1%
Gynaecology 91.9% 93.9% 97.8% 98.3% 94.6% 95.7%
Neurology 95.1% 98.5% 93.1% 95.8% 94.0% 93.6%
Neurosurgery 83.7% 86.7% 92.2% 93.9% 87.9% 88.6%
Ophthalmology 89.2% 92.4% 95.9% 97.4% 93.6% 94.2%
Oral Surgery 86.2% 90.3% 92.8% 94.5% 92.4% 92.8%
Other 90.4% 92.6% 96.1% 97.4% 93.0% 94.2%
Plastic Surgery 89.7% 91.4% 96.0% 96.7% 88.8% 89.0%
Rheumatology 98.2% 98.8% 96.6% 97.9% 95.4% 96.4%
Thoracic Medicine 98.8% 98.4% 95.9% 97.2% 94.5% 95.5%
Trauma & Orthopaedics 85.3% 88.1% 94.9% 96.1% 89.9% 91.0%
Urology 89.3% 91.9% 95.0% 96.3% 91.8% 92.5%
Total 89.1% 91.6% 95.7% 97.0% 92.6% 93.5%
Admitted (Adjusted) Non-Admitted Incomplete

21
rose from 2 to 15. Note again that the ‘year to January 2015’ period partly covers a time
when the admitted and non-admitted targets were not enforced in the usual way.
Table H: RTT Waiting Times Performance by NHS Area Team
Tables I and J (overleaf) show detailed waiting time performance for each area team by
treatment speciality. Table I covers admitted (adjusted) pathways while Table J covers non-
admitted pathways, both for the 18-week target. Only specialities with 100 or more
completed pathways are shown; otherwise the cell is left blank. As with Table F, a green cell
denotes the relevant target being met, and an orange cell denotes the target being breached.
Values are rounded, so a displayed figure of (e.g.) 90% for admitted pathways may still
represent a breach of the target since the actual value may be as low as 89.5%.
Following these tables, three maps show performance on the admitted (adjusted), non-
admitted, and incomplete measures for CCGs. These maps cover the twelve month period
ending January 2015.
Meeting target Breaching target
Year to Jan 15 Year to Jan 14 Year to Jan 15 Year to Jan 14 End of Jan 15 End of Jan 14
Arden, Herefordshire and Worcestershire 87.6% 91.2% 96.6% 97.8% 90.4% 94.3%
Bath, Gloucs, Swindon and Wiltshire 91.5% 93.7% 96.2% 97.1% 92.1% 93.1%
Birmingham and the Black Country 89.0% 92.2% 95.9% 97.7% 94.2% 93.8%
Bristol, Somerset and South Gloucs 86.5% 92.3% 94.4% 96.2% 89.8% 92.1%
Cheshire, Warrington and Wirral 92.9% 93.2% 97.0% 97.6% 93.6% 94.2%
Cumbria, Northumberland, Tyne and Wear 88.4% 91.6% 97.0% 97.5% 93.1% 93.7%
Derbyshire and Nottinghamshire 90.8% 92.3% 96.1% 97.2% 93.4% 94.7%
Devon, Cornwall and Isles of Scilly 88.8% 92.3% 96.2% 97.2% 92.4% 92.5%
Durham, Darlington and Tees 92.6% 92.2% 98.4% 98.7% 94.7% 94.9%
East Anglia 89.9% 92.1% 96.5% 97.8% 90.8% 95.8%
Essex 88.1% 91.7% 95.0% 97.4% 93.0% 94.5%
Greater Manchester 91.5% 93.3% 96.4% 97.1% 93.7% 94.1%
Hertfordshire and the South Midlands 89.6% 91.9% 95.2% 97.2% 91.6% 93.7%
Kent and Medway 89.4% 91.9% 96.9% 97.3% 92.6% 94.0%
Lancashire 91.1% 91.0% 97.2% 97.4% 94.7% 94.4%
Leicestershire and Lincolnshire 85.4% 90.0% 94.4% 95.7% 91.8% 93.4%
London 86.9% 90.6% 95.6% 97.1% 92.0% 92.3%
Merseyside 93.3% 93.2% 97.8% 98.0% 95.3% 95.7%
North Yorkshire and Humber 88.4% 92.2% 94.6% 96.5% 92.2% 92.8%
Shropshire and Staffordshire 90.1% 88.5% 97.1% 97.0% 93.9% 93.1%
South Yorkshire and Bassetlaw 89.7% 91.4% 96.2% 96.8% 93.3% 93.6%
Surrey and Sussex 88.6% 91.7% 93.4% 96.9% 91.1% 93.2%
Thames Valley 88.4% 91.3% 96.2% 97.7% 92.1% 89.8%
Wessex 91.1% 92.5% 96.6% 97.4% 94.4% 94.7%
West Yorkshire 90.3% 91.0% 95.5% 96.4% 93.8% 94.7%
ENGLAND 89.1% 91.6% 95.7% 97.0% 92.6% 93.5%
Admitted (Adjusted) Non-Admitted Incomplete

22
Table I: Patients treated within 18 weeks, Admitted (adjusted) pathways, by NHS area team and treatment speciality
12 month period ending January 2015
Car
diol
ogy
Car
diot
hora
cic
Sur
gery
Der
mat
ology
Ear
, Nos
e an
d Thr
oat
Gas
troen
tero
logy
Gen
eral
Med
icin
e
Gen
eral
Sur
gery
Ger
iatric
Med
icin
e
Gyn
aeco
logy
Neu
rolo
gy
Neu
rosu
rger
y
Opht
halm
olog
y
Oth
er
Pla
stic
Sur
gery
Rhe
umat
ology
Thor
acic
Med
icin
e
Trau
ma
& O
rtho
pae
dics
Uro
logy
Arden, Herefordshire and Worcestershire 97% 95% 95% 75% 99% 98% 84% 91% 90% 89% 89% 92% 89% 100% 99% 82% 87%
Bath, Gloucestershire, Swindon and Wiltshire 87% 85% 92% 93% 99% 99% 92% 91% 95% 79% 91% 92% 90% 100% 99% 89% 87%
Birmingham and the Black Country 95% 96% 92% 84% 98% 98% 83% 92% 97% 80% 89% 93% 92% 99% 99% 83% 87%
Bristol, Somerset and South Gloucs 87% 87% 90% 84% 99% 95% 84% 92% 97% 77% 81% 87% 89% 100% 99% 82% 86%
Cheshire, Warrington and Wirral 97% 95% 93% 94% 98% 98% 90% 95% 94% 89% 96% 98% 99% 91% 94%
Cumbria, Northumberland, Tyne and Wear 94% 83% 87% 89% 97% 98% 89% 100% 91% 92% 85% 91% 92% 98% 100% 85% 86%
Derbyshire and Nottinghamshire 95% 95% 96% 90% 96% 99% 86% 96% 90% 96% 88% 93% 93% 95% 97% 87% 94%
Devon, Cornwall and Isles of Scilly 86% 90% 95% 83% 99% 100% 87% 100% 93% 97% 67% 86% 96% 88% 99% 99% 86% 85%
Durham, Darlington and Tees 97% 94% 95% 100% 99% 90% 96% 93% 96% 92% 100% 89% 89%
East Anglia 95% 95% 80% 98% 99% 85% 91% 95% 88% 95% 94% 89% 99% 98% 83% 92%
Essex 89% 83% 59% 86% 98% 100% 87% 100% 93% 94% 83% 86% 91% 92% 98% 96% 85% 87%
Greater Manchester 90% 92% 91% 96% 98% 90% 93% 97% 94% 89% 94% 99% 98% 90% 92%
Hertfordshire and the South Midlands 96% 80% 89% 89% 99% 100% 89% 97% 92% 93% 80% 91% 92% 90% 99% 98% 82% 86%
Kent and Medway 95% 48% 85% 90% 98% 98% 91% 99% 91% 92% 52% 92% 93% 86% 96% 99% 83% 92%
Lancashire 92% 89% 98% 91% 98% 98% 91% 94% 83% 91% 92% 88% 97% 99% 90% 90%
Leicestershire and Lincolnshire 97% 92% 89% 75% 96% 98% 81% 89% 89% 85% 84% 84% 93% 97% 99% 80% 91%
London 89% 83% 96% 80% 97% 96% 84% 100% 90% 93% 74% 88% 87% 86% 98% 99% 83% 86%
Merseyside 96% 96% 93% 99% 97% 92% 96% 94% 88% 96% 98% 92% 94%
North Yorkshire and Humber 90% 81% 94% 78% 95% 99% 90% 94% 86% 92% 86% 98% 98% 86% 88%
Shropshire and Staffordshire 97% 97% 93% 89% 98% 97% 89% 92% 95% 86% 91% 89% 94% 98% 97% 85% 94%
South Yorkshire and Bassetlaw 78% 82% 90% 92% 99% 97% 89% 91% 92% 92% 88% 98% 99% 84% 91%
Surrey and Sussex 92% 91% 90% 89% 98% 99% 87% 89% 96% 84% 89% 91% 89% 98% 98% 84% 89% KEY
Thames Valley 94% 60% 95% 88% 99% 97% 91% 91% 97% 81% 78% 90% 85% 97% 99% 83% 90% 90%+ Meeting target
Wessex 95% 94% 86% 99% 99% 91% 91% 91% 89% 92% 94% 97% 100% 87% 91% 80% - 90%
West Yorkshire 98% 97% 84% 88% 97% 100% 90% 95% 91% 97% 86% 92% 89% 88% 99% 99% 87% 92% Below 90%} Breaching target

23
Table J: Patients treated within 18 weeks, Non-admitted pathways, by NHS area team and treatment speciality
12 month period ending January 2015
Car
diol
ogy
Car
diot
hora
cic
Sur
gery
Der
mat
ology
Ear
, Nos
e an
d Thr
oat
Gas
troen
tero
logy
Gen
eral
Med
icin
e
Gen
eral
Sur
gery
Ger
iatric
Med
icin
e
Gyn
aeco
logy
Neu
rolo
gy
Neu
rosu
rger
y
Opht
halm
olog
y
Oth
er
Pla
stic
Sur
gery
Rhe
umat
ology
Thor
acic
Med
icin
e
Trau
ma
& O
rtho
pae
dics
Uro
logy
Arden, Herefordshire and Worcestershire 99% 98% 96% 96% 95% 98% 95% 98% 98% 98% 93% 97% 98% 96% 97% 95% 94% 95%
Bath, Gloucestershire, Swindon and Wiltshire 94% 95% 97% 91% 97% 97% 99% 98% 88% 90% 97% 97% 98% 94% 96% 96% 96%
Birmingham and the Black Country 94% 98% 96% 96% 94% 98% 96% 95% 98% 96% 91% 97% 96% 96% 98% 90% 95% 94%
Bristol, Somerset and South Gloucs 93% 93% 91% 92% 98% 94% 98% 98% 80% 89% 96% 95% 99% 96% 96% 93% 96%
Cheshire, Warrington and Wirral 96% 96% 97% 97% 95% 97% 95% 99% 99% 100% 97% 96% 98% 99% 98% 97% 96% 96%
Cumbria, Northumberland, Tyne and Wear 97% 97% 98% 97% 94% 98% 97% 99% 98% 94% 95% 97% 98% 97% 97% 97% 95% 96%
Derbyshire and Nottinghamshire 96% 100% 98% 97% 94% 97% 94% 99% 98% 97% 97% 95% 97% 97% 97% 96% 94% 94%
Devon, Cornwall and Isles of Scilly 94% 96% 97% 95% 96% 98% 96% 99% 99% 94% 87% 97% 97% 95% 99% 93% 93% 95%
Durham, Darlington and Tees 99% 99% 98% 99% 98% 99% 98% 99% 99% 97% 99% 98% 98% 99% 97% 98% 98% 96%
East Anglia 97% 99% 96% 95% 96% 99% 96% 99% 98% 95% 96% 95% 97% 94% 98% 99% 96% 97%
Essex 96% 96% 90% 94% 96% 97% 93% 99% 97% 95% 90% 96% 96% 97% 96% 95% 94% 93%
Greater Manchester 97% 97% 95% 96% 92% 96% 97% 99% 98% 99% 94% 97% 96% 97% 97% 97% 96% 96%
Hertfordshire and the South Midlands 95% 98% 93% 94% 94% 99% 95% 99% 97% 93% 92% 96% 97% 96% 96% 93% 94% 92%
Kent and Medway 97% 98% 97% 96% 98% 97% 98% 98% 96% 85% 96% 97% 94% 98% 97% 96% 97%
Lancashire 97% 96% 98% 98% 96% 97% 96% 99% 99% 94% 95% 98% 96% 95% 98% 98% 97% 96%
Leicestershire and Lincolnshire 96% 96% 96% 93% 90% 98% 95% 98% 97% 91% 96% 94% 94% 96% 96% 97% 92% 95%
London 96% 96% 96% 95% 93% 97% 95% 99% 98% 94% 85% 96% 96% 96% 97% 97% 94% 93%
Merseyside 98% 99% 98% 97% 98% 99% 98% 99% 97% 100% 97% 98% 97% 99% 97% 97% 98%
North Yorkshire and Humber 91% 94% 93% 95% 87% 98% 93% 99% 98% 94% 93% 97% 97% 94% 91% 88% 95% 92%
Shropshire and Staffordshire 97% 99% 97% 98% 97% 99% 98% 97% 99% 98% 92% 95% 99% 98% 97% 95% 94% 98%
South Yorkshire and Bassetlaw 93% 100% 97% 97% 97% 95% 93% 98% 97% 84% 94% 98% 97% 95% 98% 98% 94% 94%
Surrey and Sussex 95% 98% 97% 95% 85% 97% 93% 97% 97% 86% 82% 88% 94% 95% 87% 93% 94% 94% KEY
Thames Valley 97% 98% 93% 97% 98% 96% 99% 98% 95% 95% 94% 98% 96% 98% 98% 93% 95% 95%+ Meeting target
Wessex 97% 95% 96% 95% 97% 96% 98% 97% 91% 92% 97% 98% 99% 98% 97% 96% 96% 90% - 95%
West Yorkshire 97% 98% 94% 96% 85% 99% 97% 99% 97% 97% 97% 97% 95% 90% 98% 95% 95% 96% Below 90%} Breaching target

24
5.4 Maps: Waiting times by CCG
ADMITTED (ADJUSTED) PATHWAYS: RTT Waiting Times Performance By CCG, 12 month period ending Jan 2015
Below 85%
85% - 90%
90% - 92.5%
Above 92.5%
Waiting less than 18 weeks
} Breaching target
} Meeting target

25
NON-ADMITTED PATHWAYS: RTT Waiting Times Performance By CCG, 12 month period ending Jan 2015
Below 92.5%
92.5% - 95%
95% - 97.5%
Above 97.5%
Waiting less than 18 weeks
} Breaching target
} Meeting target

26
INCOMPLETE PATHWAYS: RTT Waiting Lists Performance By CCG, Patients still waiting at the end of Jan 2015
Below 88%
88% - 92%
92% - 96%
Above 96%
} Breaching target
} Meeting target
Waiting less than 18 weeks

27
Wales
Welsh data on referral to treatment waiting times is published on StatsWales5. Datasets for
Consultant-led Referral to Treatment (RTT) for England and Wales are not directly
comparable, since the targets with respect to which data is collected are not the same in the
two countries. In England, the key target is that 90% of admitted and 95% of admitted
patients should be treated within 18 weeks of referral. In Wales the targets are that 95% of
patients waiting to start treatment must have waited less than 26 weeks from referral to
treatment, and 100 per cent of patients not treated within 26 weeks must be treated within 36
weeks.
Charts 15a and 15b show Welsh trends in RTT waiting times on these target measures
since 2009. In January 2015, 84.3% of patients waiting for treatment had been waiting for
less than 26 weeks. Performance on this measure has gradually fallen since 2009. Also
displayed are shows trends on the second Welsh RTT target – the percentage of patients
who waited over 26 weeks that were treated within 36 weeks. In June 2014 this figure was
59.6%. This is below the target that all patients who are not treated within 26 weeks should
be treated within 36 weeks. Again, performance on this target has gradually declined since
2009.
Charts 15a and 15b: Wales RTT waiting times summary charts:
Performance on target measures
Target: 95% Target: 100%
Chart 16 (below) shows changes in the number of patients waiting to start treatment since
2009, compared with the number treated in each month.
Note that the ratio of patients waiting for treatment to patients treated in the last month has
recently risen above 4:1 in Wales. In England, this ratio remains below 3:1. The 414,000
people waiting to start treatment represents 13% of the Welsh population – more than double
the proportion of the English population who are on the RTT waiting list.
5 https://statswales.wales.gov.uk/Catalogue/Health-and-Social-Care/NHS-Hospital-Waiting-Times/Referral-to-
Treatment
% of patients waiting who have waited under 26 weeks Of patients treated who waited over 26 weeks, % treated within 36 weeks
50%
60%
70%
80%
90%
100%
Oct-09 Oct-10 Oct-11 Oct-12 Oct-13 Oct-14
50%
60%
70%
80%
90%
100%
Oct-09 Oct-10 Oct-11 Oct-12 Oct-13 Oct-14

28
Chart 16: RTT waiting times: Numbers treated and still waiting to start treatment, monthly data
The Department of Health warns that caution should be taken when comparing English and
Welsh RTT data, since differences exist in the measurement rules.
Scotland
Scottish data on referral to treatment waiting times is published by ISD Scotland6. In
Scotland, the RTT target is that 90% of patients should complete their RTT pathways within
18 weeks. This target came into force in December 2011.7 While this target has been met in
most months since 2011, the recent trend has been for lower performance on this measure,
as Chart 17 shows. The target was breached in the last three months of 2014.
Chart 17: Scotland RTT Waiting Times: % of patient journeys under18 weeks
6 http://www.isdscotland.org/Health-Topics/Waiting-Times/Publications/data-tables.asp?id=1294#1294 7 http://www.18weeks.scot.nhs.uk/
Waiting to start
treatment
Treated
0
1
2
3
4
Oct-09 Oct-10 Oct-11 Oct-12 Oct-13 Oct-14
Hundre
d t
housa
nds
80
85
90
95
100
Oct 11 Apr 12 Oct 12 Apr 13 Oct 13 Apr 14 Oct 14

29
Table K compares performance for individual Scottish NHS Health Boards for the month of
December in the past three years. Shading demonstrates whether the 90% target was met in
the month in question.
Table K: RTT 18-week performance, individual Scottish Health Boards
Appendix: Glossary of Treatment Functions
Cardiology
Services treating diseases and abnormalities of the heart
Cardiothoracic surgery
Used only where there are no separate services for cardiac surgery and thoracic surgery
Dermatology
Services for the treatment of diseases of the skin
Gastroenterology
The treatment of diseases of the digestive system
General medicine
Includes medical sub-categories not elsewhere listed, e.g. metabolic medicine
General surgery
Includes surgical sub-categories not elsewhere listed, e.g. endocrine surgery
Geriatric medicine
Services to treat diseases and disabilities in older adults
Gynaecology
Disorders of the female reproductive system. Includes planned terminations
Neurology
Services to diagnose and treat conditions and diseases of the central nervous system
Meeting target Breaching target
Dec-14 Dec-13 Dec-12
Ayrshire and Arran 82.8 92.9 91.8
Borders 90.8 92.0 93.1
Dumfries and Galloway 90.9 93.0 94.2
Fife 86.7 92.2 91.9
Forth Valley 89.7 81.0 83.3
Grampian 84.9 89.7 90.6
Greater Glasgow & Clyde 91.5 91.1 91.6
Lanarkshire 92.6 93.7 94.3
Lothian 86.3 87.2 87.6
Orkney 97.8 98.0 99.0
Shetland 93.3 97.1 97.4
Tayside 90.3 93.8 90.5
Western Isles 94.0 93.4 95.1

30
Neurosurgery
The prevention, diagnosis, treatment, and rehabilitation of disorders which affect any portion of the nervous
system including the brain, spinal cord, peripheral nerves, and extra-cranial cerebrovascular system
Ophthalmology
The surgical treatment of disorders and diseases of the eye
Oral surgery
The diagnosis and surgical treatment of diseases, injuries and defects involving both the functional and aesthetic
aspects of the hard and soft tissues of the head, mouth, teeth, gums, jaws and neck
Plastic surgery
Services to correct or restore form and function. In addition to cosmetic or aesthetic surgery, plastic surgery
includes many types of reconstructive surgery, and the treatment of burns
Rheumatology
Services to treat rheumatism, arthritis, and other disorders of the joints, muscles and ligaments
Thoracic medicine
Treatment of diseases affecting organs inside the thorax (the chest). Generally treatment of conditions of the
lungs, chest wall, and diaphragm
Trauma & orthopaedics
Surgery to treat injuries, congenital and acquired disorders of the bones, joints, and their associated soft tissues,
including ligaments, nerves and muscles
Urology
Surgical treatment of disorders of the urinary system and male reproductive system