Embed Size (px)
Citation preview

Wake model benchmarkingusing LiDAR wake measurements of multi MW turbinesStefan Kern, Clarissa Belloni, Christian
Aalburg
GE Global Research, Munich
GE Power & Water

2 /GE EWEC 2010 /
04/18/23
Motivation• Today’s wake models developed in the
80’s
• Environment changed significantly– Increased turbine size
– Very large plants on- & offshore
• Continuous calibration/improvement of models
• Lack of data for velocity deficit and turbulence intensity in wake of today’s wind turbines
ENDOW project Vindeby wind farm, Bonus 450kW (stall regulated)
38m
35m
100m
100m
GE 2.5xl, 2.5MW
3 /GE EWEC 2010 /
04/18/23
Outline
• Measurement setup
• Challenges of wake measurements with a LiDAR
• Measurements of turbulence intensity with LiDAR
• Velocity deficit models used in benchmarking study
• Benchmarking results for velocity deficit of a single turbine
• Summary & conclusions

4 /GE EWEC 2010 /
04/18/23
Measurement setup
WindCube LiDAR
with 15° prism
Upstream metmast H=100m, cup/sonic
anemometers GE2.5xl, 2.5MW
D=100m HH=100M
downstream
distance 2–8 D
200 hours of data obtained over period of 3 months

5 /GE EWEC 2010 /
04/18/23
Measuring wakes with LiDARChallenges• 4 measurements with temporal and spatial
offset combined • assumption of homogeneous flow
Opening angle of scanning cone• WindCube offers 30° & 15°• 15° preferred for horizontal shear expected
in present measurements
LiDAR orientation• Alignment with wake direction minimizes
systematic errors
α
15° 30°
87m40m
100 m

6 /GE EWEC 2010 /
04/18/23
Measuring turbulence intensity with LiDAR Free stream conditions• LiDAR with 30° prism placed next to met-mast• Acceptable correlation of TI
Waked conditions • LiDAR with 15° prism placed next to met-mast• Upstream distance to turbine 2.5D• LiDAR measurements show largely increased TI• Large scatter Li
DA
R T
urb
ule
nce
[%
]Met mast Turbulence [%]
LiD
AR
Turb
ule
nce
[%
]
Met mast Turbulence [%]0 105 15 20 250
5
10
15
20
25

7 /GE EWEC 2010 /
04/18/23
What scales of wind speed fluctuations can LiDAR capture?Statistics of free stream wind speed fluctuations wind speed
increments
Current system not suitable to measure wake turbulence
Height
Probability density of ∆u for different τ and measurement heights
45m
85m
108m
τ=1.5s τ=12s τ=96sLiDAR LiDAR LiDARMet mast Met mastMet mast

8 /GE EWEC 2010 /
04/18/23
Benchmarked wake modelsJensen model (aka Park model)•Linear wake expansion•Uniform velocity in wake
Ainslie eddy viscosity model•Axisymm. shearlayer approximation of NS
eq.•Eddy viscosity closure

9 /GE EWEC 2010 /
04/18/23
Vertical velocity profilesWind speed ~10m/s, medium ambient TI
2D downstream, wake center ±5°
Free stream (MM)Wake (LIDAR & uncertainty)AinslieJensen
8D downstream , wake center ±3°
Free stream (MM)Wake (LIDAR) AinslieJensen
Jensen model to be used with care for close turbine spacing

10 /GE EWEC 2010 /
04/18/23
Lateral velocity profiles at hub height
Small wind speedLarge thrust coefficient
Medium wind speedMedium thrust coefficient
Large wind speedSmall thrust coefficient
Sector averaged wake velocities 6D downstream, medium ambient TI
Wake (LIDAR) AinslieJensen
Wake (LIDAR) AinslieJensen
Models differ mainly at wake center, improvements needed for large wind speeds
Wake (LIDAR) AinslieJensen
11 /GE EWEC 2010 /
04/18/23
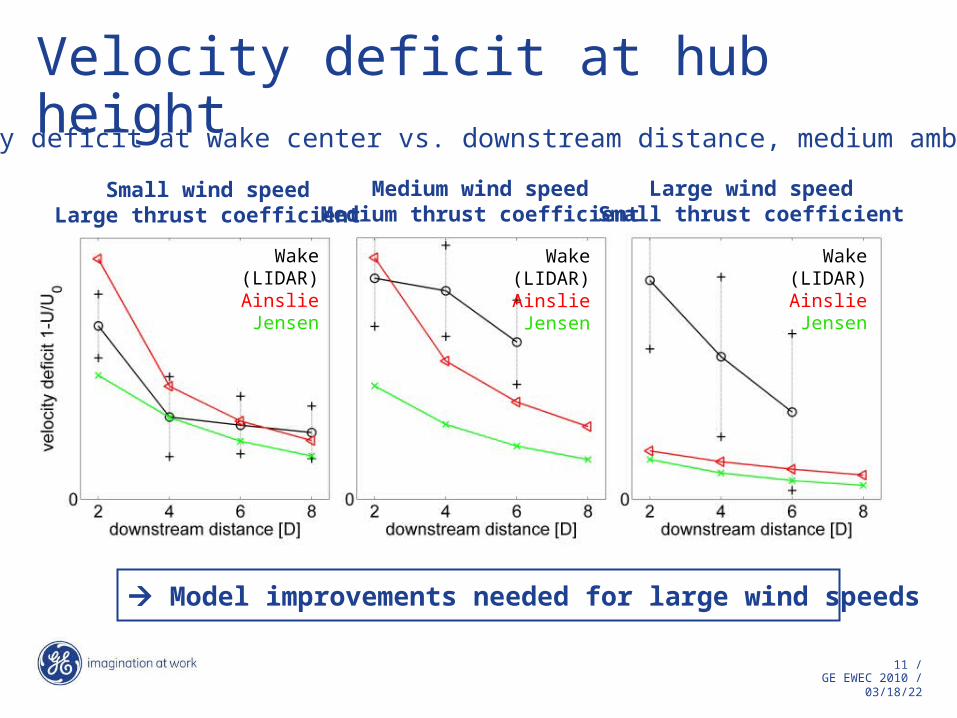
Velocity deficit at hub height
Small wind speedLarge thrust coefficient
Medium wind speedMedium thrust coefficient
Large wind speedSmall thrust coefficient
Velocity deficit at wake center vs. downstream distance, medium ambient TI
Wake (LIDAR) AinslieJensen
Wake (LIDAR) AinslieJensen
Wake (LIDAR) AinslieJensen
Model improvements needed for large wind speeds

12 /GE EWEC 2010 /
04/18/23
Results summary
•High quality data aquired for wide range of wind conditions
•Overall, Ainslie outperforms Jensen model (in-line with results from others)
•Model accuracy varies with wind conditions
•Relatively small differences between the models for partial wakes/rotor averaged wake velocities
•Average error of wake affected velocity ~7% at 6D downstream (waked 100% of the time, which is typically not the case)

13 /GE EWEC 2010 /
04/18/23
Conclusions•LiDAR measurements provide high quality velocity deficit data
for calibration of wake velocity deficit models
•Current LiDAR technology captures only large scale wind speed fluctuations correctly turbulence intensity measurements not recommended
•Present benchmarking results enable
−Systematic improvement of velocity deficit models
−Appropriate choice of model for specific application/wind conditions