Embed Size (px)
Citation preview

Walgreens Portfolio of 3 | North Carolina 1
Confidential
Walgreens Portfolio of 3North Carolina
Subject Properties
Absolute NNN Lease | Zero Landlord Responsibilities | Rent Escalations | Cash-on-Cash Returns | Investment Credit Tenant
Offering Memorandum
Confidential Disclaimer
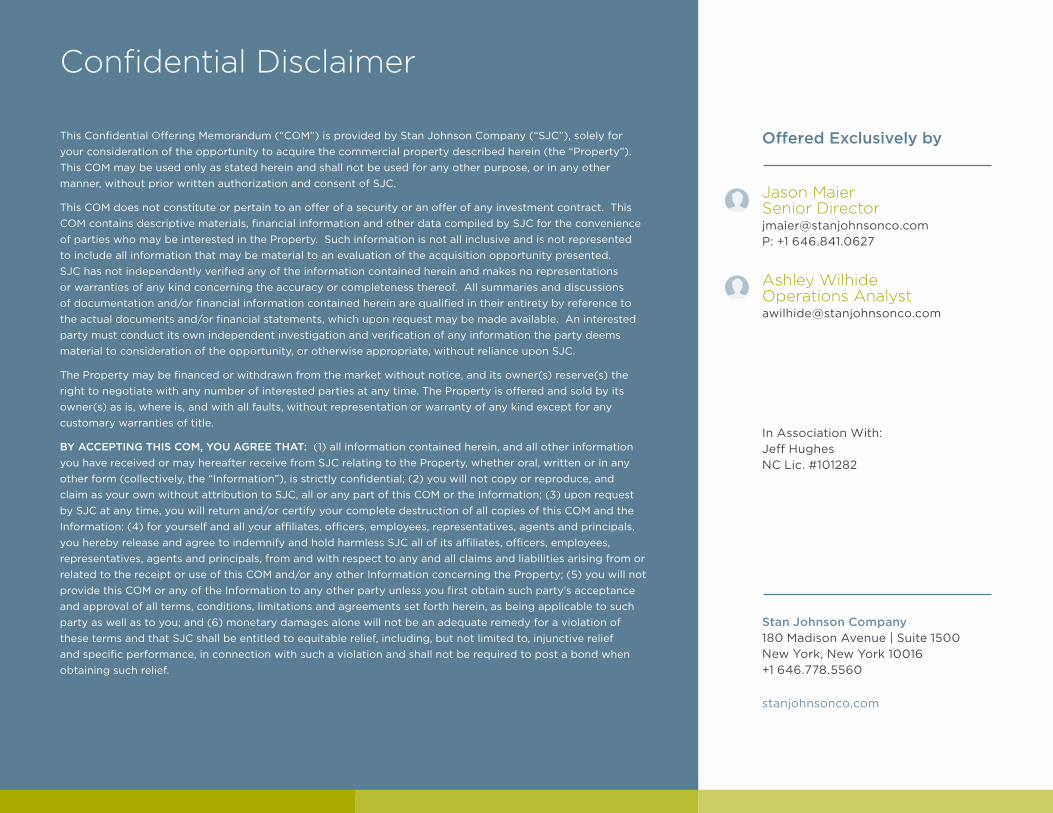
This Confidential Offering Memorandum (“COM”) is provided by Stan Johnson Company (“SJC”), solely for your consideration of the opportunity to acquire the commercial property described herein (the “Property”). This COM may be used only as stated herein and shall not be used for any other purpose, or in any other manner, without prior written authorization and consent of SJC.
This COM does not constitute or pertain to an offer of a security or an offer of any investment contract. This COM contains descriptive materials, financial information and other data compiled by SJC for the convenience of parties who may be interested in the Property. Such information is not all inclusive and is not represented to include all information that may be material to an evaluation of the acquisition opportunity presented. SJC has not independently verified any of the information contained herein and makes no representations or warranties of any kind concerning the accuracy or completeness thereof. All summaries and discussions of documentation and/or financial information contained herein are qualified in their entirety by reference to the actual documents and/or financial statements, which upon request may be made available. An interested party must conduct its own independent investigation and verification of any information the party deems material to consideration of the opportunity, or otherwise appropriate, without reliance upon SJC.
The Property may be financed or withdrawn from the market without notice, and its owner(s) reserve(s) the right to negotiate with any number of interested parties at any time. The Property is offered and sold by its owner(s) as is, where is, and with all faults, without representation or warranty of any kind except for any customary warranties of title.
BY ACCEPTING THIS COM, YOU AGREE THAT: (1) all information contained herein, and all other information you have received or may hereafter receive from SJC relating to the Property, whether oral, written or in any other form (collectively, the “Information”), is strictly confidential; (2) you will not copy or reproduce, and claim as your own without attribution to SJC, all or any part of this COM or the Information; (3) upon request by SJC at any time, you will return and/or certify your complete destruction of all copies of this COM and the Information; (4) for yourself and all your affiliates, officers, employees, representatives, agents and principals, you hereby release and agree to indemnify and hold harmless SJC all of its affiliates, officers, employees, representatives, agents and principals, from and with respect to any and all claims and liabilities arising from or related to the receipt or use of this COM and/or any other Information concerning the Property; (5) you will not provide this COM or any of the Information to any other party unless you first obtain such party’s acceptance and approval of all terms, conditions, limitations and agreements set forth herein, as being applicable to such party as well as to you; and (6) monetary damages alone will not be an adequate remedy for a violation of these terms and that SJC shall be entitled to equitable relief, including, but not limited to, injunctive relief and specific performance, in connection with such a violation and shall not be required to post a bond when obtaining such relief.
Jason Maier Senior Director [email protected] P: +1 646.841.0627
Ashley Wilhide Operations Analyst [email protected]
In Association With: Jeff Hughes NC Lic. #101282
Offered Exclusively by
Stan Johnson Company180 Madison Avenue | Suite 1500 New York, New York 10016 +1 646.778.5560
stanjohnsonco.com

Portfolio Overview .............................................................................................................................................................................................................................................................................................................................................4
The Offering & Investment Highlights ...................................................................................................................................................................................................................................................................................................5
Portfolio Details ...................................................................................................................................................................................................................................................................................................................................................6
Portfolio Cash Flow ...........................................................................................................................................................................................................................................................................................................................................7
Property & Market Overview - Carthage .......................................................................................................................................................................................................................................................................................8-12
Property & Market Overview - Franklinton .................................................................................................................................................................................................................................................................................. 13-17
Property & Market Overview - Raleigh ........................................................................................................................................................................................................................................................................................18-22
Tenant Overview ...............................................................................................................................................................................................................................................................................................................................................23
Table of Contents

Walgreens Portfolio of 3 | North Carolina 4
N
Portfolio Overview
Property Location
1 1006 Monroe Street Carthage, NC
2 3422 US Highway 1 Franklinton, NC
3 2901 Wakefield Pines Drive Raleigh, NC
1
2
3
Walgreens Portfolio of 3 | North Carolina 5
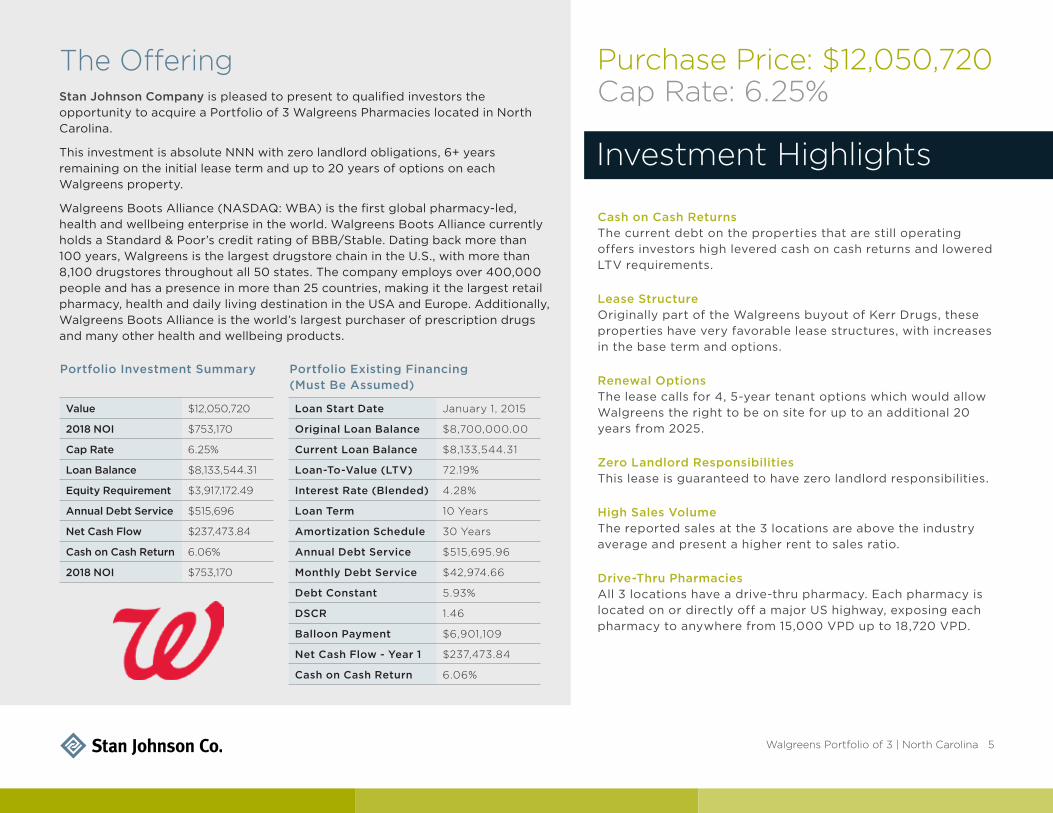
Cash on Cash Returns The current debt on the properties that are still operating offers investors high levered cash on cash returns and lowered LTV requirements.
Lease Structure Originally part of the Walgreens buyout of Kerr Drugs, these properties have very favorable lease structures, with increases in the base term and options.
Renewal Options The lease calls for 4, 5-year tenant options which would allow Walgreens the right to be on site for up to an additional 20 years from 2025.
Zero Landlord Responsibilities This lease is guaranteed to have zero landlord responsibilities.
High Sales Volume The reported sales at the 3 locations are above the industry average and present a higher rent to sales ratio.
Drive-Thru Pharmacies All 3 locations have a drive-thru pharmacy. Each pharmacy is located on or directly off a major US highway, exposing each pharmacy to anywhere from 15,000 VPD up to 18,720 VPD.
The OfferingStan Johnson Company is pleased to present to qualified investors the opportunity to acquire a Portfolio of 3 Walgreens Pharmacies located in North Carolina.
This investment is absolute NNN with zero landlord obligations, 6+ years remaining on the initial lease term and up to 20 years of options on each Walgreens property.
Walgreens Boots Alliance (NASDAQ: WBA) is the first global pharmacy-led, health and wellbeing enterprise in the world. Walgreens Boots Alliance currently holds a Standard & Poor’s credit rating of BBB/Stable. Dating back more than 100 years, Walgreens is the largest drugstore chain in the U.S., with more than 8,100 drugstores throughout all 50 states. The company employs over 400,000 people and has a presence in more than 25 countries, making it the largest retail pharmacy, health and daily living destination in the USA and Europe. Additionally, Walgreens Boots Alliance is the world’s largest purchaser of prescription drugs and many other health and wellbeing products.
Investment Highlights
Purchase Price: $12,050,720Cap Rate: 6.25%
Value $12,050,720
2018 NOI $753,170
Cap Rate 6.25%
Loan Balance $8,133,544.31
Equity Requirement $3,917,172.49
Annual Debt Service $515,696
Net Cash Flow $237,473.84
Cash on Cash Return 6.06%
2018 NOI $753,170
Loan Start Date January 1, 2015
Original Loan Balance $8,700,000.00
Current Loan Balance $8,133,544.31
Loan-To-Value (LTV) 72.19%
Interest Rate (Blended) 4.28%
Loan Term 10 Years
Amortization Schedule 30 Years
Annual Debt Service $515,695.96
Monthly Debt Service $42,974.66
Debt Constant 5.93%
DSCR 1.46
Balloon Payment $6,901,109
Net Cash Flow - Year 1 $237,473.84
Cash on Cash Return 6.06%
Portfolio Existing Financing (Must Be Assumed)
Portfolio Investment Summary
Walgreens Portfolio of 3 | North Carolina 6
N
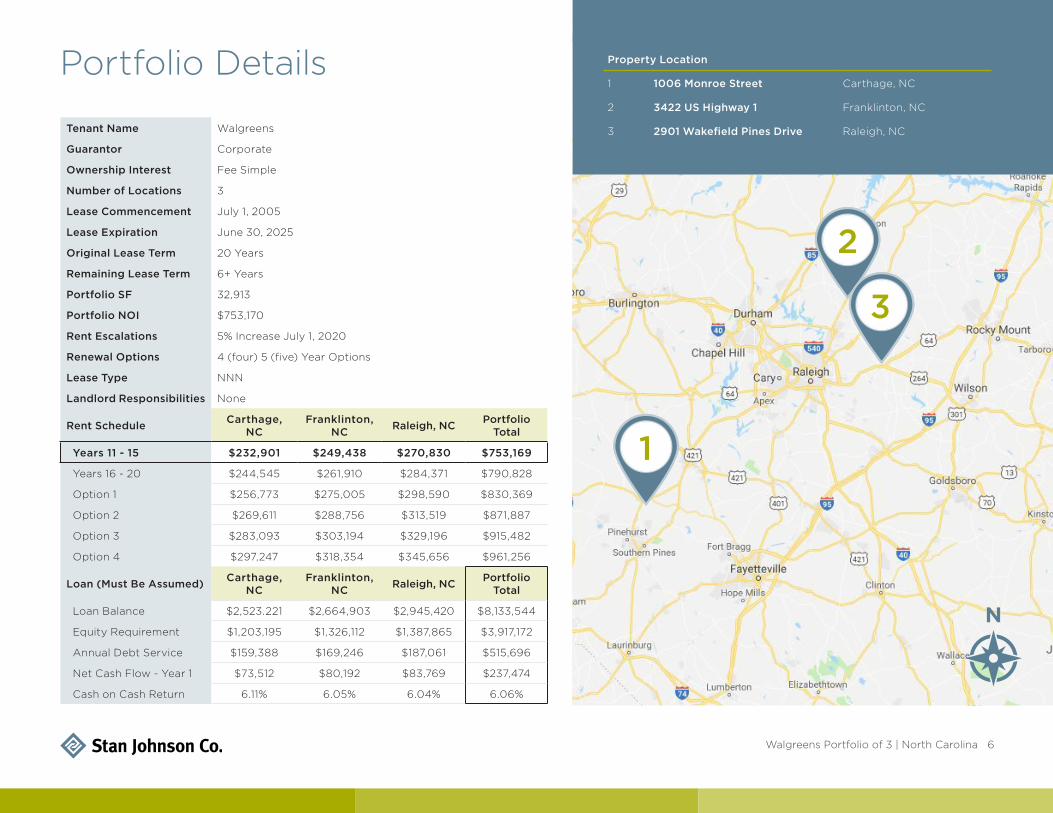
Portfolio Details
1
2
3
Property Location
1 1006 Monroe Street Carthage, NC
2 3422 US Highway 1 Franklinton, NC
3 2901 Wakefield Pines Drive Raleigh, NCTenant Name Walgreens
Guarantor Corporate
Ownership Interest Fee Simple
Number of Locations 3
Lease Commencement July 1, 2005
Lease Expiration June 30, 2025
Original Lease Term 20 Years
Remaining Lease Term 6+ Years
Portfolio SF 32,913
Portfolio NOI $753,170
Rent Escalations 5% Increase July 1, 2020
Renewal Options 4 (four) 5 (five) Year Options
Lease Type NNN
Landlord Responsibilities None
Rent Schedule Carthage, NC
Franklinton, NC Raleigh, NC Portfolio
Total
Years 11 - 15 $232,901 $249,438 $270,830 $753,169
Years 16 - 20 $244,545 $261,910 $284,371 $790,828
Option 1 $256,773 $275,005 $298,590 $830,369
Option 2 $269,611 $288,756 $313,519 $871,887
Option 3 $283,093 $303,194 $329,196 $915,482
Option 4 $297,247 $318,354 $345,656 $961,256
Loan (Must Be Assumed) Carthage, NC
Franklinton, NC Raleigh, NC Portfolio
Total
Loan Balance $2,523.221 $2,664,903 $2,945,420 $8,133,544
Equity Requirement $1,203,195 $1,326,112 $1,387,865 $3,917,172
Annual Debt Service $159,388 $169,246 $187,061 $515,696
Net Cash Flow - Year 1 $73,512 $80,192 $83,769 $237,474
Cash on Cash Return 6.11% 6.05% 6.04% 6.06%
Walgreens Portfolio of 3 | North Carolina 7
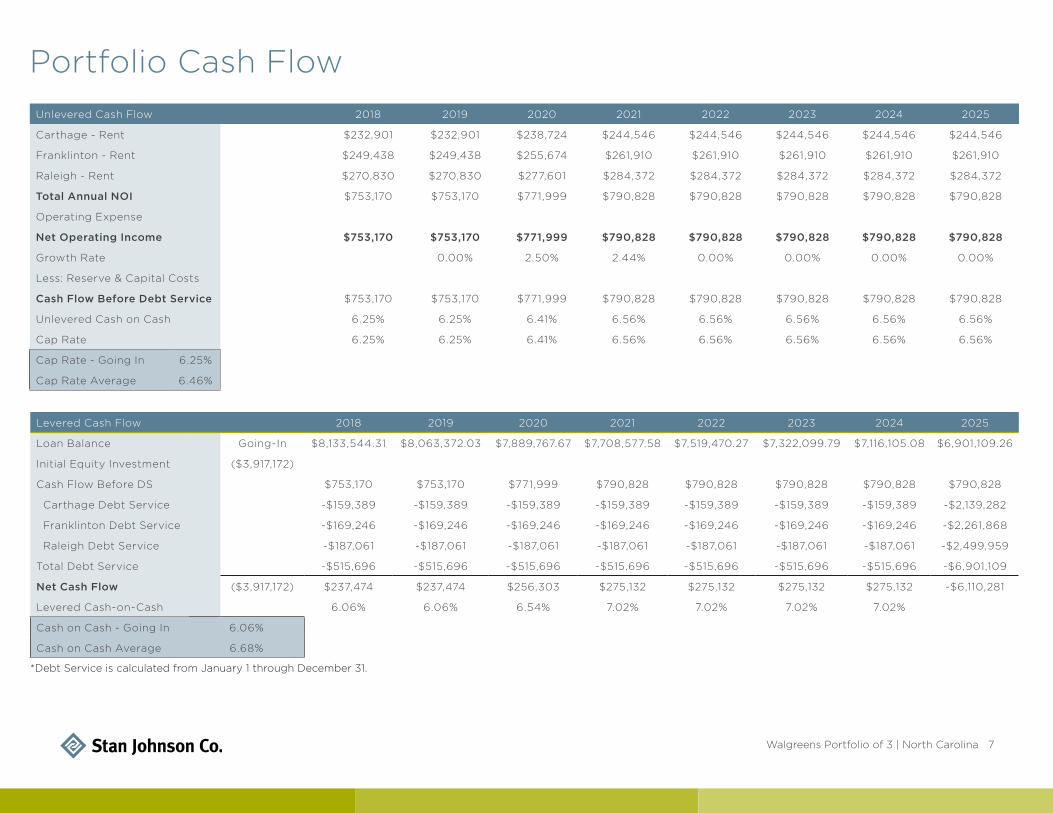
Portfolio Cash FlowUnlevered Cash Flow 2018 2019 2020 2021 2022 2023 2024 2025
Carthage - Rent $232,901 $232,901 $238,724 $244,546 $244,546 $244,546 $244,546 $244,546
Franklinton - Rent $249,438 $249,438 $255,674 $261,910 $261,910 $261,910 $261,910 $261,910
Raleigh - Rent $270,830 $270,830 $277,601 $284,372 $284,372 $284,372 $284,372 $284,372
Total Annual NOI $753,170 $753,170 $771,999 $790,828 $790,828 $790,828 $790,828 $790,828
Operating Expense
Net Operating Income $753,170 $753,170 $771,999 $790,828 $790,828 $790,828 $790,828 $790,828
Growth Rate 0.00% 2.50% 2.44% 0.00% 0.00% 0.00% 0.00%
Less: Reserve & Capital Costs
Cash Flow Before Debt Service $753,170 $753,170 $771,999 $790,828 $790,828 $790,828 $790,828 $790,828
Unlevered Cash on Cash 6.25% 6.25% 6.41% 6.56% 6.56% 6.56% 6.56% 6.56%
Cap Rate 6.25% 6.25% 6.41% 6.56% 6.56% 6.56% 6.56% 6.56%
Cap Rate - Going In 6.25%
Cap Rate Average 6.46%
Levered Cash Flow 2018 2019 2020 2021 2022 2023 2024 2025
Loan Balance Going-In $8,133,544.31 $8,063,372.03 $7,889,767.67 $7,708,577.58 $7,519,470.27 $7,322,099.79 $7,116,105.08 $6,901,109.26
Initial Equity Investment ($3,917,172)
Cash Flow Before DS $753,170 $753,170 $771,999 $790,828 $790,828 $790,828 $790,828 $790,828
Carthage Debt Service -$159,389 -$159,389 -$159,389 -$159,389 -$159,389 -$159,389 -$159,389 -$2,139,282
Franklinton Debt Service -$169,246 -$169,246 -$169,246 -$169,246 -$169,246 -$169,246 -$169,246 -$2,261,868
Raleigh Debt Service -$187,061 -$187,061 -$187,061 -$187,061 -$187,061 -$187,061 -$187,061 -$2,499,959
Total Debt Service -$515,696 -$515,696 -$515,696 -$515,696 -$515,696 -$515,696 -$515,696 -$6,901,109
Net Cash Flow ($3,917,172) $237,474 $237,474 $256,303 $275,132 $275,132 $275,132 $275,132 -$6,110,281
Levered Cash-on-Cash 6.06% 6.06% 6.54% 7.02% 7.02% 7.02% 7.02%
Cash on Cash - Going In 6.06%
Cash on Cash Average 6.68%
*Debt Service is calculated from January 1 through December 31.
Walgreens Portfolio of 3 | North Carolina 8
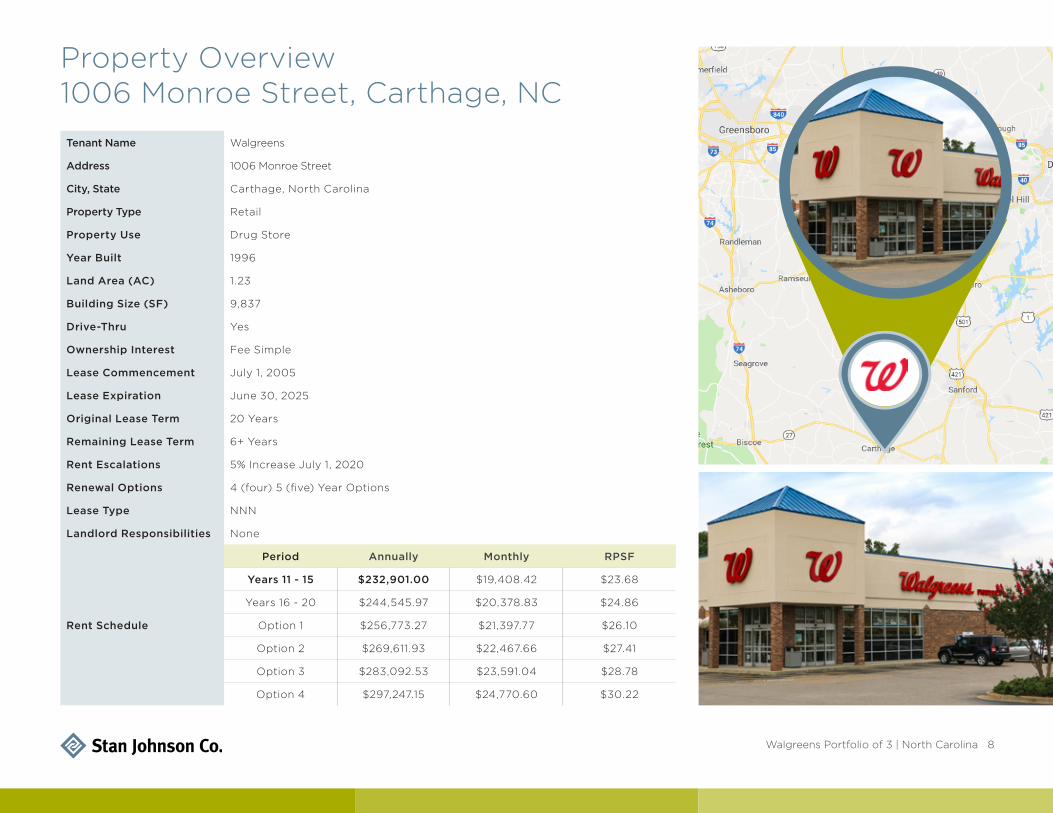
Property Overview 1006 Monroe Street, Carthage, NCTenant Name Walgreens
Address 1006 Monroe Street
City, State Carthage, North Carolina
Property Type Retail
Property Use Drug Store
Year Built 1996
Land Area (AC) 1.23
Building Size (SF) 9,837
Drive-Thru Yes
Ownership Interest Fee Simple
Lease Commencement July 1, 2005
Lease Expiration June 30, 2025
Original Lease Term 20 Years
Remaining Lease Term 6+ Years
Rent Escalations 5% Increase July 1, 2020
Renewal Options 4 (four) 5 (five) Year Options
Lease Type NNN
Landlord Responsibilities None
Rent Schedule
Period Annually Monthly RPSF
Years 11 - 15 $232,901.00 $19,408.42 $23.68
Years 16 - 20 $244,545.97 $20,378.83 $24.86
Option 1 $256,773.27 $21,397.77 $26.10
Option 2 $269,611.93 $22,467.66 $27.41
Option 3 $283,092.53 $23,591.04 $28.78
Option 4 $297,247.15 $24,770.60 $30.22
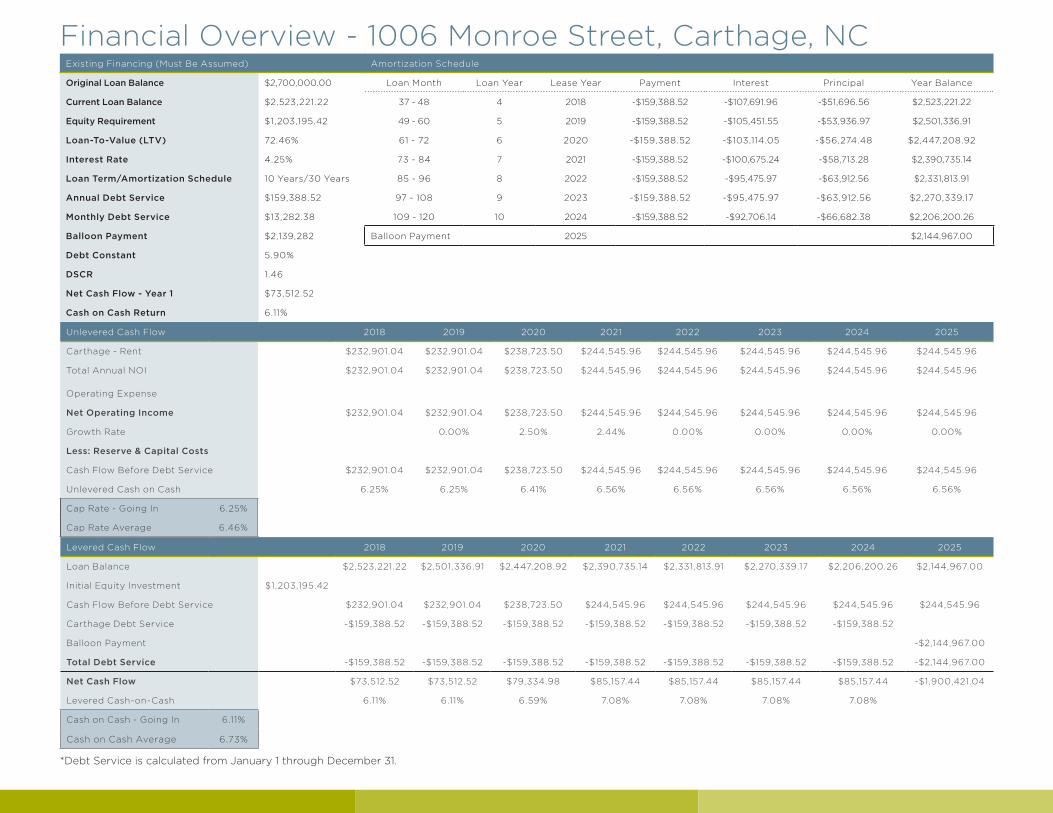
Financial Overview - 1006 Monroe Street, Carthage, NC
Unlevered Cash Flow 2018 2019 2020 2021 2022 2023 2024 2025
Carthage - Rent $232,901.04 $232,901.04 $238,723.50 $244,545.96 $244,545.96 $244,545.96 $244,545.96 $244,545.96
Total Annual NOI $232,901.04 $232,901.04 $238,723.50 $244,545.96 $244,545.96 $244,545.96 $244,545.96 $244,545.96
Operating Expense
Net Operating Income $232,901.04 $232,901.04 $238,723.50 $244,545.96 $244,545.96 $244,545.96 $244,545.96 $244,545.96
Growth Rate 0.00% 2.50% 2.44% 0.00% 0.00% 0.00% 0.00%
Less: Reserve & Capital Costs
Cash Flow Before Debt Service $232,901.04 $232,901.04 $238,723.50 $244,545.96 $244,545.96 $244,545.96 $244,545.96 $244,545.96
Unlevered Cash on Cash 6.25% 6.25% 6.41% 6.56% 6.56% 6.56% 6.56% 6.56%
Cap Rate - Going In 6.25%
Cap Rate Average 6.46%
Levered Cash Flow 2018 2019 2020 2021 2022 2023 2024 2025
Loan Balance $2,523,221.22 $2,501,336.91 $2,447,208.92 $2,390,735.14 $2,331,813.91 $2,270,339.17 $2,206,200.26 $2,144,967.00
Initial Equity Investment $1,203,195.42
Cash Flow Before Debt Service $232,901.04 $232,901.04 $238,723.50 $244,545.96 $244,545.96 $244,545.96 $244,545.96 $244,545.96
Carthage Debt Service -$159,388.52 -$159,388.52 -$159,388.52 -$159,388.52 -$159,388.52 -$159,388.52 -$159,388.52
Balloon Payment -$2,144,967.00
Total Debt Service -$159,388.52 -$159,388.52 -$159,388.52 -$159,388.52 -$159,388.52 -$159,388.52 -$159,388.52 -$2,144,967.00
Net Cash Flow $73,512.52 $73,512.52 $79,334.98 $85,157.44 $85,157.44 $85,157.44 $85,157.44 -$1,900,421.04
Levered Cash-on-Cash 6.11% 6.11% 6.59% 7.08% 7.08% 7.08% 7.08%
Cash on Cash - Going In 6.11%
Cash on Cash Average 6.73%
Existing Financing (Must Be Assumed)
Original Loan Balance $2,700,000.00
Current Loan Balance $2,523,221.22
Equity Requirement $1,203,195.42
Loan-To-Value (LTV) 72.46%
Interest Rate 4.25%
Loan Term/Amortization Schedule 10 Years/30 Years
Annual Debt Service $159,388.52
Monthly Debt Service $13,282.38
Balloon Payment $2,139,282
Debt Constant 5.90%
DSCR 1.46
Net Cash Flow - Year 1 $73,512.52
Cash on Cash Return 6.11%
Amortization Schedule
Loan Month Loan Year Lease Year Payment Interest Principal Year Balance
37 - 48 4 2018 -$159,388.52 -$107,691.96 -$51,696.56 $2,523,221.22
49 - 60 5 2019 -$159,388.52 -$105,451.55 -$53,936.97 $2,501,336.91
61 - 72 6 2020 -$159,388.52 -$103,114.05 -$56,274.48 $2,447,208.92
73 - 84 7 2021 -$159,388.52 -$100,675.24 -$58,713.28 $2,390,735.14
85 - 96 8 2022 -$159,388.52 -$95,475.97 -$63,912.56 $2,331,813.91
97 - 108 9 2023 -$159,388.52 -$95,475.97 -$63,912.56 $2,270,339.17
109 - 120 10 2024 -$159,388.52 -$92,706.14 -$66,682.38 $2,206,200.26
Balloon Payment 2025 $2,144,967.00
*Debt Service is calculated from January 1 through December 31.
Walgreens Portfolio of 3 | North Carolina 10
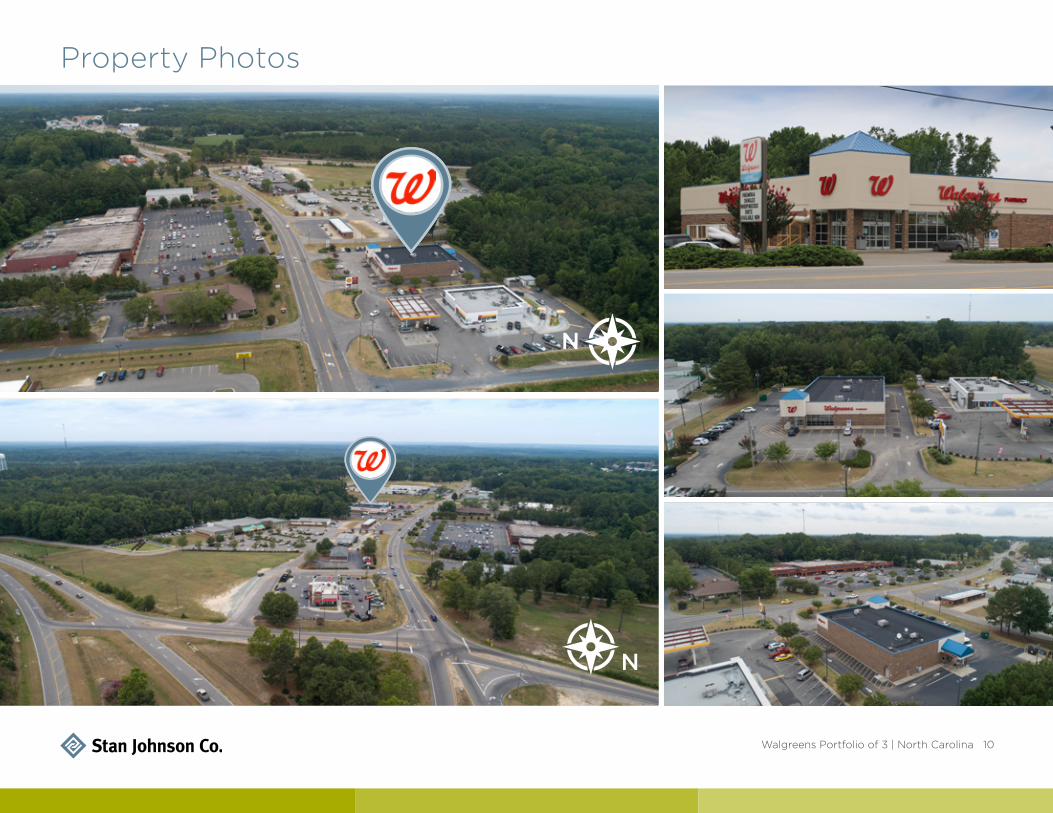
Property Photos
N
N
Walgreens Portfolio of 3 | North Carolina 11
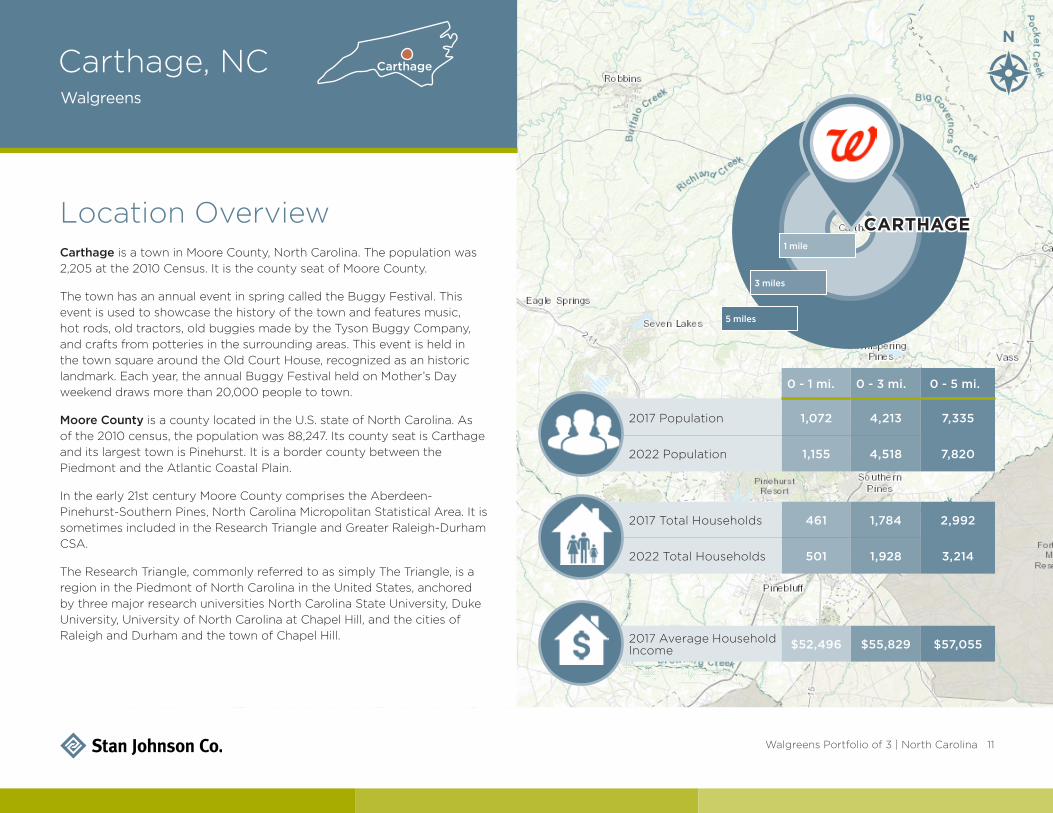
0 - 1 mi. 0 - 3 mi. 0 - 5 mi.
2017 Population 1,072 4,213 7,335
2022 Population 1,155 4,518 7,820
2017 Total Households 461 1,784 2,992
2022 Total Households 501 1,928 3,214
2017 Average Household Income $52,496 $55,829 $57,055
Carthage, NCWalgreens
1 mile
3 miles
5 miles
N
Carthage
Location OverviewCarthage is a town in Moore County, North Carolina. The population was 2,205 at the 2010 Census. It is the county seat of Moore County.
The town has an annual event in spring called the Buggy Festival. This event is used to showcase the history of the town and features music, hot rods, old tractors, old buggies made by the Tyson Buggy Company, and crafts from potteries in the surrounding areas. This event is held in the town square around the Old Court House, recognized as an historic landmark. Each year, the annual Buggy Festival held on Mother’s Day weekend draws more than 20,000 people to town.
Moore County is a county located in the U.S. state of North Carolina. As of the 2010 census, the population was 88,247. Its county seat is Carthage and its largest town is Pinehurst. It is a border county between the Piedmont and the Atlantic Coastal Plain.
In the early 21st century Moore County comprises the Aberdeen-Pinehurst-Southern Pines, North Carolina Micropolitan Statistical Area. It is sometimes included in the Research Triangle and Greater Raleigh-Durham CSA.
The Research Triangle, commonly referred to as simply The Triangle, is a region in the Piedmont of North Carolina in the United States, anchored by three major research universities North Carolina State University, Duke University, University of North Carolina at Chapel Hill, and the cities of Raleigh and Durham and the town of Chapel Hill.
CARTHAGE
Walgreens Portfolio of 3 | North Carolina 12
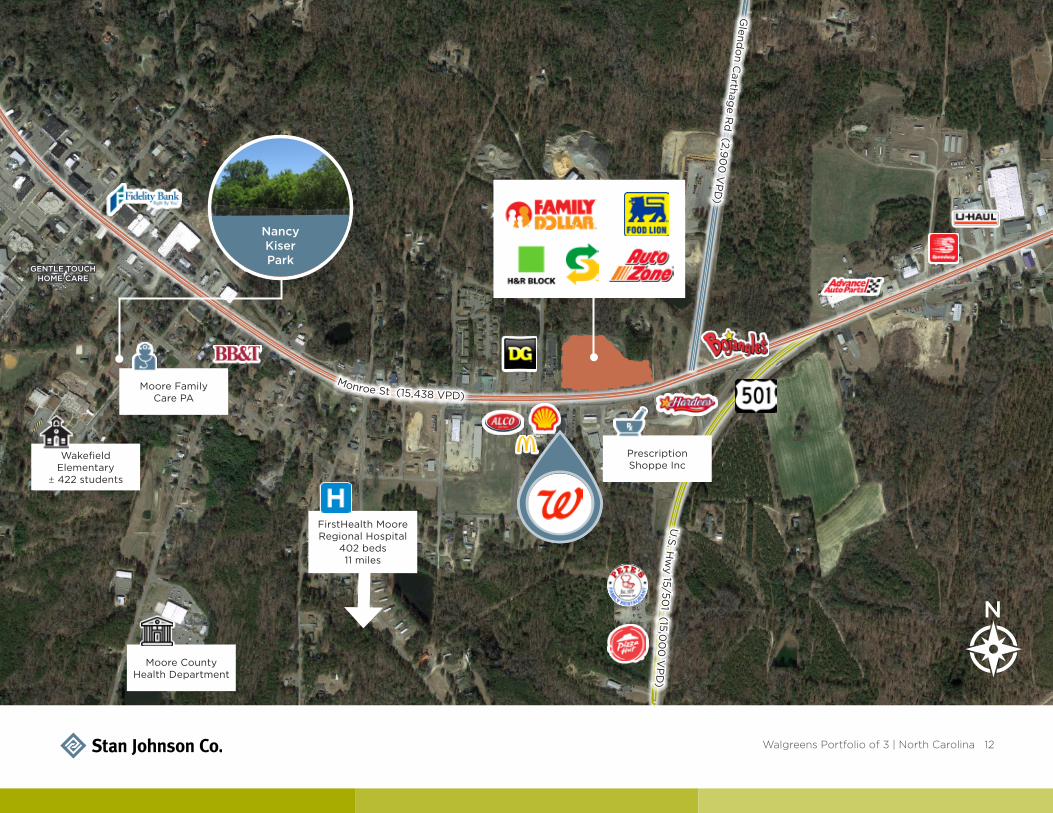
U.S
. Hw
y 15/501 (15,0
00
VP
D)
Monroe St (15,438 VPD)
Wakefield Elementary
± 422 students
Moore County Health Department
FirstHealth Moore Regional Hospital
402 beds11 miles
Prescription Shoppe Inc
Moore Family Care PA
N
Nancy KiserPark
GENTLE TOUCH HOME CARE
Glend
on C
arthage R
d (2,9
00
VP
D)

Walgreens Portfolio of 3 | North Carolina 13
Property Overview 3422 US Highway 1, Franklinton, NCTenant Name Walgreens
Address 3422 US Highway 1
City, State Franklinton, NC
Property Type Retail
Property Use Drug Store
Year Built 1999
Land Area (AC) 1.5
Building Size (SF) 11,004
Drive-Thru Yes
Ownership Interest Fee Simple
Lease Commencement July 1, 2005
Lease Expiration June 30, 2025
Original Lease Term 20 Years
Remaining Lease Term 6+ Years
Rent Escalations 5% Increase July 1, 2020
Renewal Options 4 (four) 5 (five) Year Options
Lease Type NNN
Landlord Responsibilities None
Rent Schedule
Period Annually Monthly RPSF
Years 11 - 15 $249,438.42 $20,786.54 $22.67
Years 16 - 20 $261,910.34 $21,825.86 $23.80
Option 1 $275,005.85 $22,917.15 $24.99
Option 2 $288,756.14 $24,063.01 $26.24
Option 3 $303,193.95 $25,266.16 $27.55
Option 4 $318,353.65 $26,529.47 $28.93
Loan Balance $2,710,450
Equity Requirement $952,267
Equity Requirement % 26%
Annual Debt Service $169,246
Net Cash Flow (ADS) $80,192
Cash on Cash Return $9,190

Walgreens Portfolio of 3 | North Carolina 14
Financial Overview - 3422 US Highway 1, Franklinton, NC
Unlevered Cash Flow 2018 2019 2020 2021 2022 2023 2024 2025
Franklinton - Rent $249,438.48 $249,438.48 $255,674.40 $261,910.32 $261,910.32 $261,910.32 $261,910.32 $261,910.32
Total Annual NOI $249,438.48 $249,438.48 $255,674.40 $261,910.32 $261,910.32 $261,910.32 $261,910.32 $261,910.32
Operating Expense
Net Operating Income $249,438.48 $249,438.48 $255,674.40 $261,910.32 $261,910.32 $261,910.32 $261,910.32 $261,910.32
Growth Rate 0.00% 2.50% 2.44% 0.00% 0.00% 0.00% 0.00%
Less: Reserve & Capital Costs
Cash Flow Before Debt Service $249,438.48 $249,438.48 $255,674.40 $261,910.32 $261,910.32 $261,910.32 $261,910.32 $261,910.32
Unlevered Cash on Cash 6.25% 6.25% 6.41% 6.56% 6.56% 6.56% 6.56% 6.56%
Cap Rate - Going In 6.25%
Cap Rate Average 6.46%
Levered Cash Flow 2018 2019 2020 2021 2022 2023 2024 2025
Loan Balance $2,664,903.46 $2,641,966.68 $2,585,215.41 $2,525,975.16 $2,464,136.77 $2,399,586.30 $2,332,204.79 $2,267,845.47
Initial Equity Investment $1,326,112.22
Cash Flow Before Debt Service $249,438.48 $249,438.48 $255,674.40 $261,910.32 $261,910.32 $261,910.32 $261,910.32 $261,910.32
Carthage Debt Service -$169,246.03 -$169,246.03 -$169,246.03 -$169,246.03 -$169,246.03 -$169,246.03 -$169,246.03
Balloon Payment -$2,267,845.47
Total Debt Service -$169,246.03 -$169,246.03 -$169,246.03 -$169,246.03 -$169,246.03 -$169,246.03 -$169,246.03 -$2,267,845.47
Net Cash Flow $80,192.45 $80,192.45 $86,428.37 $92,664.29 $92,664.29 $92,664.29 $92,664.29 -$2,005,935.15
Levered Cash-on-Cash 6.05% 6.05% 6.52% 6.99% 6.99% 6.99% 6.99%
Cash on Cash - Going In 6.05%
Cash on Cash Average 6.65%
Existing Financing (Must Be Assumed)
Original Loan Balance $2,850,000.00
Current Loan Balance $2,664,903.46
Equity Requirement $1,326,112.22
Loan-To-Value (LTV) 71.41%
Interest Rate 4.30%
Loan Term/Amortization Schedule 10 Years/30 Years
Annual Debt Service $169,246.03
Monthly Debt Service $14,103.84
Balloon Payment $2,261,868
Debt Constant 5.94%
DSCR 1.47
Net Cash Flow - Year 1 $80,192.45
Cash on Cash Return 6.05%
Amortization Schedule
Loan Month Loan Year Lease Year Payment Interest Principal Year Balance
37 - 48 4 2018 -$169,246.03 -$115,073.28 -$54,172.75 $2,664,903.46
49 - 60 5 2019 -$169,246.03 -$112,697.39 -$56,548.64 $2,641,966.68
61 - 72 6 2020 -$169,246.03 -$110,217.30 -$59,028.73 $2,585,215.41
73 - 84 7 2021 -$169,246.03 -$107,628.44 -$61,617.59 $2,525,975.16
85 - 96 8 2022 -$169,246.03 -$102,105.11 -$67,140.92 $2,464,136.77
97 - 108 9 2023 -$169,246.03 -$102,105.11 -$67,140.92 $2,399,586.30
109 - 120 10 2024 -$169,246.03 -$99,160.47 -$70,085.56 $2,332,204.79
Balloon Payment 2025 $2,267,845.47
*Debt Service is calculated from January 1 through December 31.
Walgreens Portfolio of 3 | North Carolina 15
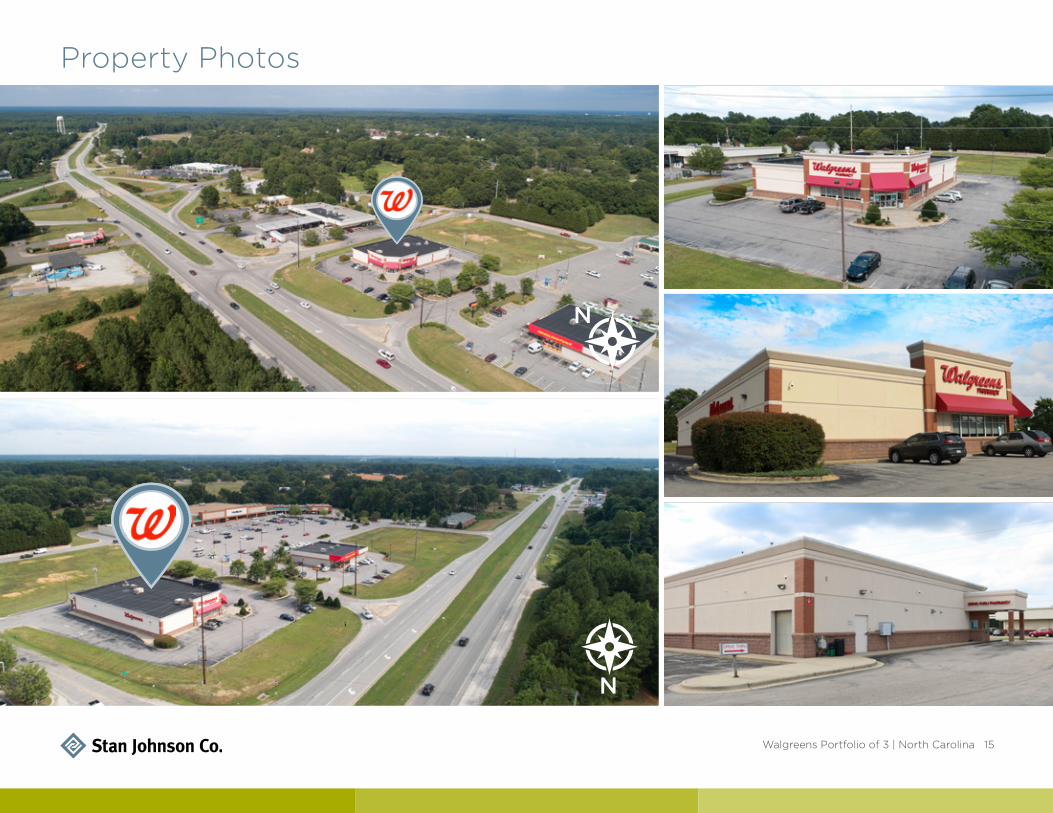
Property Photos
N
N

Walgreens Portfolio of 3 | North Carolina 16
0 - 1 mi. 0 - 3 mi. 0 - 5 mi.
2017 Population 1,589 6,224 15,852
2022 Population 1,642 6,750 17,803
2017 Total Households 684 2,461 6,159
2022 Total Households 704 2,642 6,873
2017 Average Household Income $47,196 $54,965 $61,728
Franklinton, NCWalgreens
1 mile
3 miles
5 miles
N
FRANKLINTON
Franklinton
Location OverviewFranklinton is a town in Franklin County, North Carolina. The population was 2,023 at the 2010 census. It is home to a plant operated by Novozymes. Novozymes North America Inc. employs approximately 480 people and is the largest multi-purpose enzyme manufacturing plant in the United States.
Franklinton has 876 households, and 551 families residing in the town as of the 2010 census. The population density was 1,264 people per square mile.
Franklinton ranks in the upper quartile for Population Density and Diversity Index when compared to the other cities, towns and Census Designated Places (CDPs) in North Carolina
In the town, the population was spread out with 25.7% under the age of 20, 8.3% from 20 to 24, 24.9% from 25 to 44, 21.4% from 45 to 64, and 19.8% who were 65 years of age or older as of the 2010 census. The median age was 41.4 years. For every 100 females, there were 84.4 males. For every 100 females age 18 and over, there were 80.2 males.
The town has a total area of 1.6 square miles. The center of town is at Main Street (U.S. Highway 1A) and Mason Street. Green Street (N.C. Highway 56) passes just south of that point and U.S. Highway 1 bypasses Franklinton to the west. The town is located about 30 miles northeast of Raleigh, North Carolina and 4 miles south of the Tar River. A railway operated by CSX Transportation also passes through Franklinton.
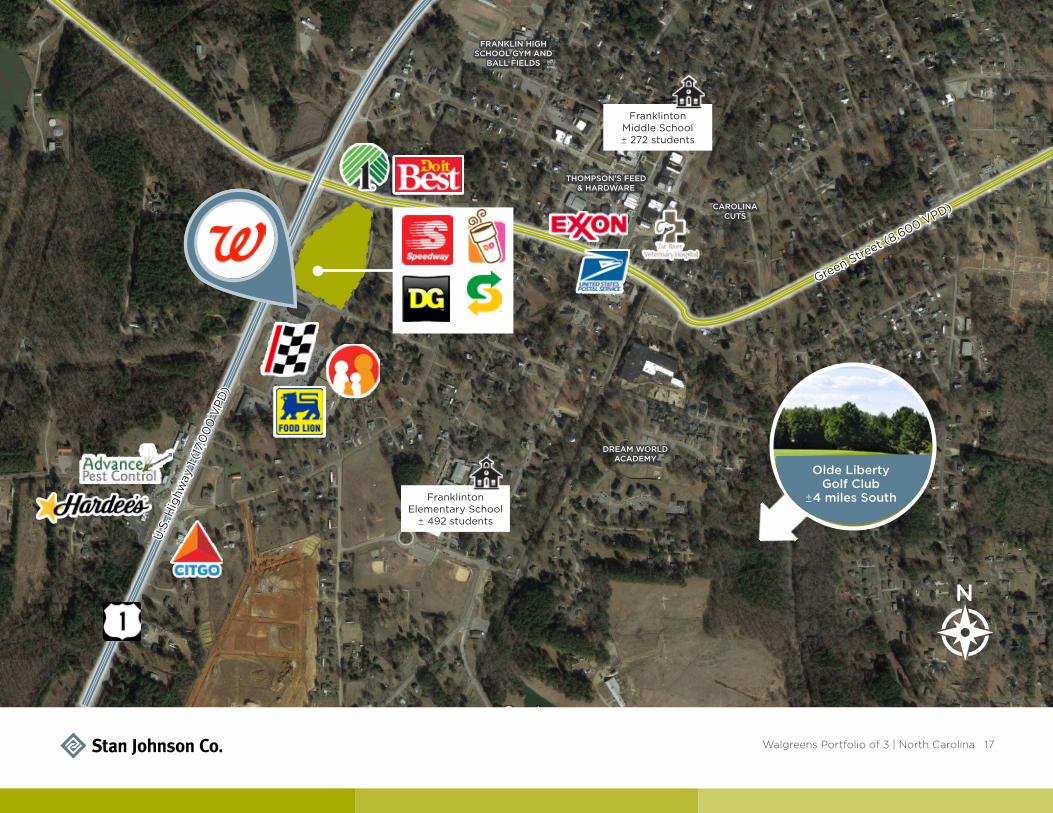
Walgreens Portfolio of 3 | North Carolina 17
N
Franklinton Elementary School
± 492 students
Franklinton Middle School ± 272 students
DREAM WORLD ACADEMY
CAROLINA CUTS
THOMPSON'S FEED & HARDWARE
FRANKLIN HIGH SCHOOL GYM AND
BALL FIELDS
Green Street (8
,600 VPD)
U.S
. Hig
hway
1 (1
7,0
00
VPD
)
Olde Liberty Golf Club
±4 miles South
Walgreens Portfolio of 3 | North Carolina 18
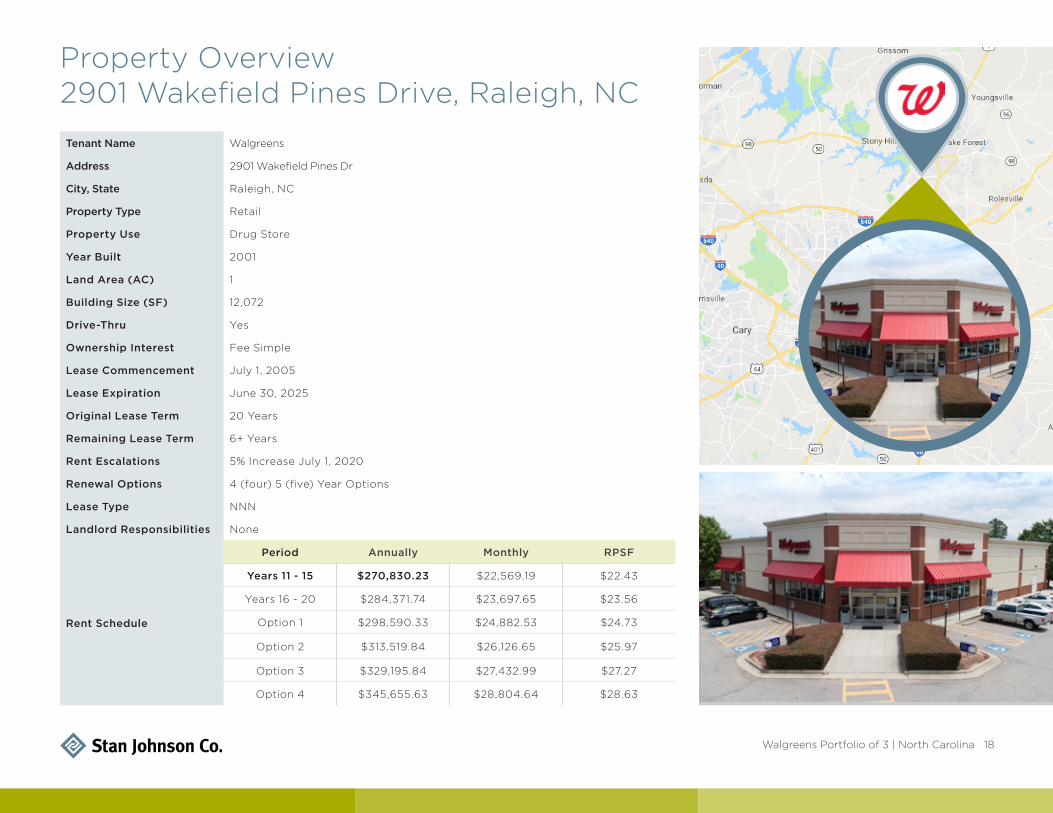
Tenant Name Walgreens
Address 2901 Wakefield Pines Dr
City, State Raleigh, NC
Property Type Retail
Property Use Drug Store
Year Built 2001
Land Area (AC) 1
Building Size (SF) 12,072
Drive-Thru Yes
Ownership Interest Fee Simple
Lease Commencement July 1, 2005
Lease Expiration June 30, 2025
Original Lease Term 20 Years
Remaining Lease Term 6+ Years
Rent Escalations 5% Increase July 1, 2020
Renewal Options 4 (four) 5 (five) Year Options
Lease Type NNN
Landlord Responsibilities None
Rent Schedule
Period Annually Monthly RPSF
Years 11 - 15 $270,830.23 $22,569.19 $22.43
Years 16 - 20 $284,371.74 $23,697.65 $23.56
Option 1 $298,590.33 $24,882.53 $24.73
Option 2 $313,519.84 $26,126.65 $25.97
Option 3 $329,195.84 $27,432.99 $27.27
Option 4 $345,655.63 $28,804.64 $28.63
Property Overview 2901 Wakefield Pines Drive, Raleigh, NC

Walgreens Portfolio of 3 | North Carolina 19
Financial Overview - 2901 Wakefield Pines Dr, Raleigh, NCExisting Financing (Must Be Assumed)
Original Loan Balance 6.05%
Current Loan Balance 6.65%
Equity Requirement $1,183,284.48
Loan-To-Value (LTV) 72.69%
Interest Rate 4.30%
Loan Term/Amortization Schedule 10 Years/30 Years
Annual Debt Service $187,061.41
Monthly Debt Service $15,588.45
Balloon Payment $2,499,959
Debt Constant 5.94%
DSCR 1.45
Net Cash Flow - Year 1 $83,768.87
Cash on Cash Return 6.04%
Unlevered Cash Flow 2018 2019 2020 2021 2022 2023 2024 2025
Franklinton - Rent $270,830.28 $270,830.28 $277,601.04 $284,371.80 $284,371.80 $284,371.80 $284,371.80 $284,371.80
Total Annual NOI $270,830.28 $270,830.28 $277,601.04 $284,371.80 $284,371.80 $284,371.80 $284,371.80 $284,371.80
Operating Expense
Net Operating Income $270,830.28 $270,830.28 $277,601.04 $284,371.80 $284,371.80 $284,371.80 $284,371.80 $284,371.80
Growth Rate 0.00% 2.50% 2.44% 0.00% 0.00% 0.00% 0.00%
Less: Reserve & Capital Costs
Cash Flow Before Debt Service $270,830.28 $270,830.28 $277,601.04 $284,371.80 $284,371.80 $284,371.80 $284,371.80 $284,371.80
Unlevered Cash on Cash 7.27% 7.27% 7.45% 7.63% 7.63% 7.63% 7.63% 7.63%
Cap Rate - Going In 6.25%
Cap Rate Average 7.52%
Levered Cash Flow 2018 2019 2020 2021 2022 2023 2024 2025
Loan Balance $2,945,419.62 $2,920,068.43 $2,857,343.35 $2,791,867.28 $2,723,519.59 $2,652,174.33 $2,577,700.03 $2,506,566.05
Initial Equity Investment $1,387,864.86
Cash Flow Before Debt Service $270,830.28 $270,830.28 $277,601.04 $284,371.80 $284,371.80 $284,371.80 $284,371.80 $284,371.80
Carthage Debt Service -$187,061.41 -$187,061.41 -$187,061.41 -$187,061.41 -$187,061.41 -$187,061.41 -$187,061.41
Balloon Payment -$2,506,566.05
Total Debt Service -$187,061.41 -$187,061.41 -$187,061.41 -$187,061.41 -$187,061.41 -$187,061.41 -$187,061.41 -$2,506,566.05
Net Cash Flow $83,768.87 $83,768.87 $90,539.63 $97,310.39 $97,310.39 $97,310.39 $97,310.39 -$2,222,194.25
Levered Cash-on-Cash 6.04% 6.04% 6.52% 7.01% 7.01% 7.01% 7.01%
Cash on Cash - Going In 6.04%
Cash on Cash Average 6.66%
Amortization Schedule
Loan Month Loan Year Lease Year Payment Interest Principal Year Balance
37- 48 4 2018 -$187,061.41 -$127,186.26 -$59,875.14 $2,945,419.62
49 - 60 5 2019 -$187,061.41 -$124,560.28 -$62,501.13 $2,920,068.43
61 - 72 6 2020 -$187,061.41 -$121,819.13 -$65,242.28 $2,857,343.35
73 - 84 7 2021 -$187,061.41 -$118,957.75 -$68,103.65 $2,791,867.28
85 - 96 8 2022 -$187,061.41 -$112,853.02 -$74,208.39 $2,723,519.59
97 - 108 9 2023 -$187,061.41 -$112,853.02 -$74,208.39 $2,652,174.33
109 - 120 10 2024 -$187,061.41 -$109,598.41 -$77,462.99 $2,577,700.03
Balloon Payment 2025 $2,506,566.05
*Debt Service is calculated from January 1 through December 31.
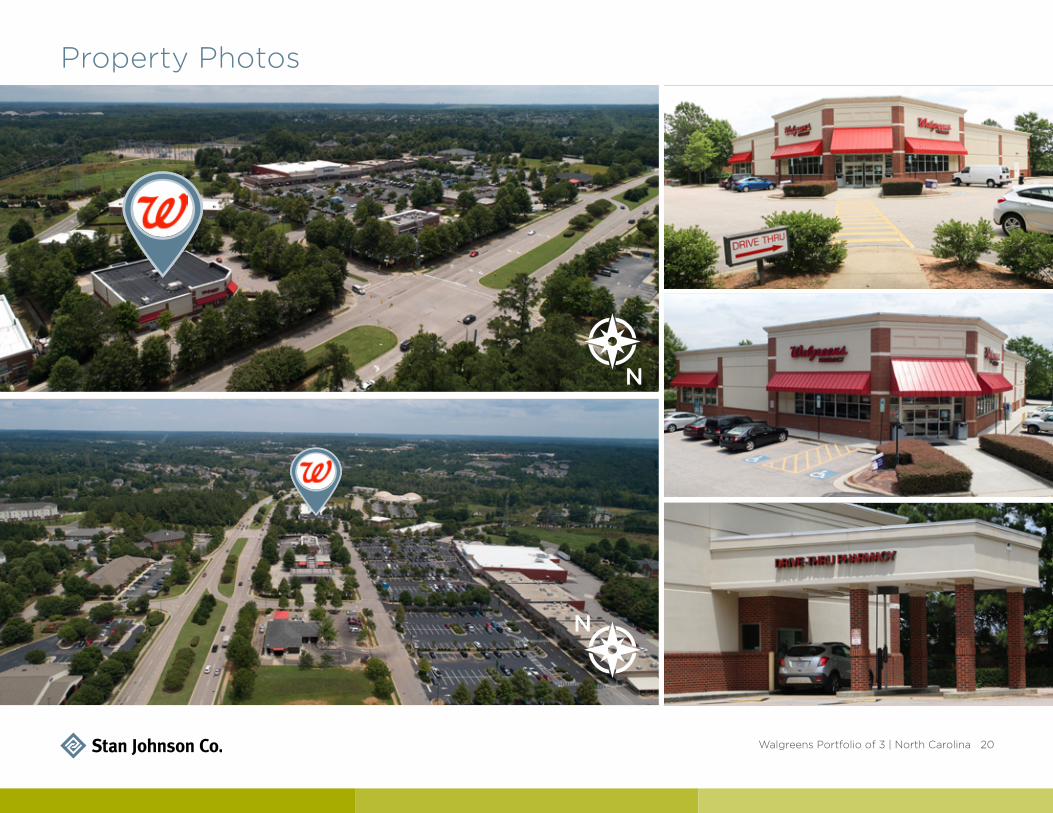
Walgreens Portfolio of 3 | North Carolina 20
Property Photos
N
N
Walgreens Portfolio of 3 | North Carolina 21
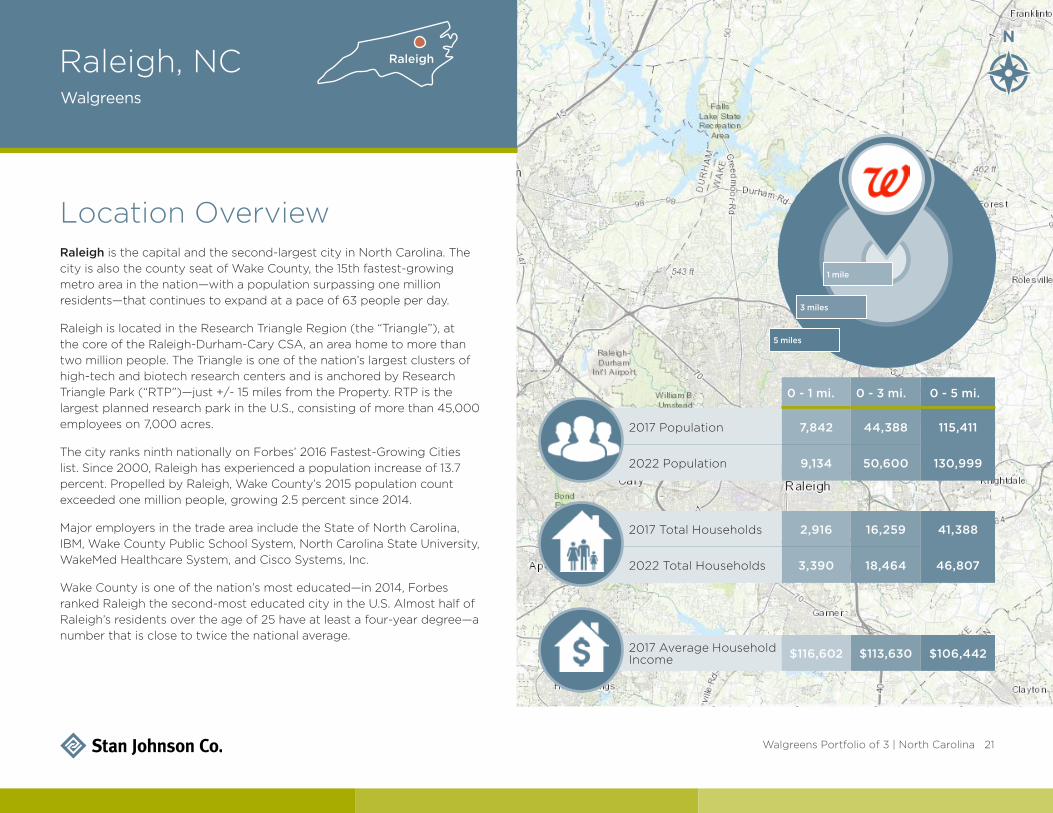
0 - 1 mi. 0 - 3 mi. 0 - 5 mi.
2017 Population 7,842 44,388 115,411
2022 Population 9,134 50,600 130,999
2017 Total Households 2,916 16,259 41,388
2022 Total Households 3,390 18,464 46,807
2017 Average Household Income $116,602 $113,630 $106,442
Raleigh, NCWalgreens
1 mile
3 miles
5 miles
NRaleigh
Location OverviewRaleigh is the capital and the second-largest city in North Carolina. The city is also the county seat of Wake County, the 15th fastest-growing metro area in the nation—with a population surpassing one million residents—that continues to expand at a pace of 63 people per day.
Raleigh is located in the Research Triangle Region (the “Triangle”), at the core of the Raleigh-Durham-Cary CSA, an area home to more than two million people. The Triangle is one of the nation’s largest clusters of high-tech and biotech research centers and is anchored by Research Triangle Park (“RTP”)—just +/- 15 miles from the Property. RTP is the largest planned research park in the U.S., consisting of more than 45,000 employees on 7,000 acres.
The city ranks ninth nationally on Forbes’ 2016 Fastest-Growing Cities list. Since 2000, Raleigh has experienced a population increase of 13.7 percent. Propelled by Raleigh, Wake County’s 2015 population count exceeded one million people, growing 2.5 percent since 2014.
Major employers in the trade area include the State of North Carolina, IBM, Wake County Public School System, North Carolina State University, WakeMed Healthcare System, and Cisco Systems, Inc.
Wake County is one of the nation’s most educated—in 2014, Forbes ranked Raleigh the second-most educated city in the U.S. Almost half of Raleigh’s residents over the age of 25 have at least a four-year degree—a number that is close to twice the national average.

Walgreens Portfolio of 3 | North Carolina 22
N
U
.S. H
ighw
ay 1
(55
,920
VP
D)
Highway 98 (24,000 VPD)
Falls
of Neuse Road (18
,720 V
PD)
Wakefield High School
± 1,962 students
Wakefield Middle School
± 1,057 students
Wakefield Elementary
± 714 students
N. Carolina Heart & Vascular Hospital
Forest Pines Elementary
± 639 students
Wake Forest Middle School ± 1,119 students
JEFFERS MANN & ARTMAN PEDIATRIC
ARDMORE HERITAGE Thales Academy
Wake Forest Preschool
Heritage Middle School
± 1,260 students
Saint Catherine Of Siena
PreSchool
TPC Wakefield Plantation
Country Club
Walgreens Portfolio of 3 | North Carolina 23
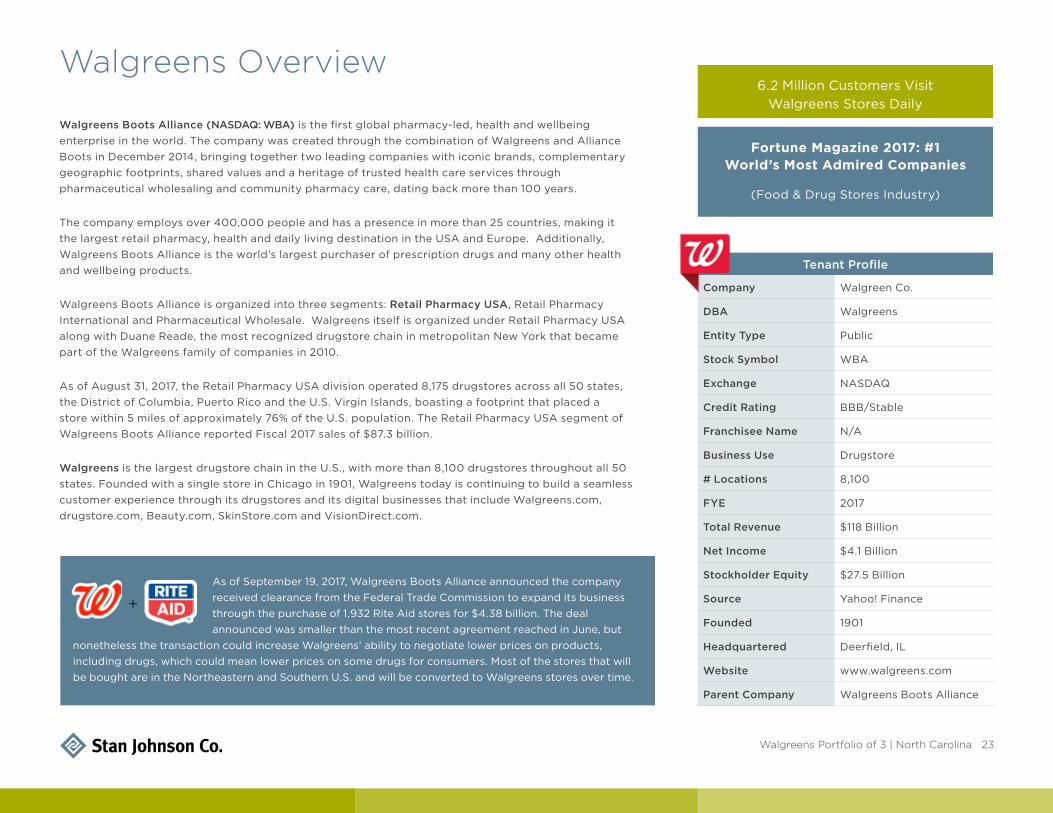
Walgreens Boots Alliance (NASDAQ: WBA) is the first global pharmacy-led, health and wellbeing enterprise in the world. The company was created through the combination of Walgreens and Alliance Boots in December 2014, bringing together two leading companies with iconic brands, complementary geographic footprints, shared values and a heritage of trusted health care services through pharmaceutical wholesaling and community pharmacy care, dating back more than 100 years.
The company employs over 400,000 people and has a presence in more than 25 countries, making it the largest retail pharmacy, health and daily living destination in the USA and Europe. Additionally, Walgreens Boots Alliance is the world’s largest purchaser of prescription drugs and many other health and wellbeing products.
Walgreens Boots Alliance is organized into three segments: Retail Pharmacy USA, Retail Pharmacy International and Pharmaceutical Wholesale. Walgreens itself is organized under Retail Pharmacy USA along with Duane Reade, the most recognized drugstore chain in metropolitan New York that became part of the Walgreens family of companies in 2010.
As of August 31, 2017, the Retail Pharmacy USA division operated 8,175 drugstores across all 50 states, the District of Columbia, Puerto Rico and the U.S. Virgin Islands, boasting a footprint that placed a store within 5 miles of approximately 76% of the U.S. population. The Retail Pharmacy USA segment of Walgreens Boots Alliance reported Fiscal 2017 sales of $87.3 billion.
Walgreens is the largest drugstore chain in the U.S., with more than 8,100 drugstores throughout all 50 states. Founded with a single store in Chicago in 1901, Walgreens today is continuing to build a seamless customer experience through its drugstores and its digital businesses that include Walgreens.com, drugstore.com, Beauty.com, SkinStore.com and VisionDirect.com.
Walgreens Overview
Tenant Profile
Company Walgreen Co.
DBA Walgreens
Entity Type Public
Stock Symbol WBA
Exchange NASDAQ
Credit Rating BBB/Stable
Franchisee Name N/A
Business Use Drugstore
# Locations 8,100
FYE 2017
Total Revenue $118 Billion
Net Income $4.1 Billion
Stockholder Equity $27.5 Billion
Source Yahoo! Finance
Founded 1901
Headquartered Deerfield, IL
Website www.walgreens.com
Parent Company Walgreens Boots Alliance
6.2 Million Customers Visit Walgreens Stores Daily
Fortune Magazine 2017: #1 World’s Most Admired Companies
(Food & Drug Stores Industry)
+As of September 19, 2017, Walgreens Boots Alliance announced the company received clearance from the Federal Trade Commission to expand its business through the purchase of 1,932 Rite Aid stores for $4.38 billion. The deal announced was smaller than the most recent agreement reached in June, but
nonetheless the transaction could increase Walgreens’ ability to negotiate lower prices on products, including drugs, which could mean lower prices on some drugs for consumers. Most of the stores that will be bought are in the Northeastern and Southern U.S. and will be converted to Walgreens stores over time.

Walgreens Portfolio of 3 | North Carolina 24
going beyond
The information contained herein was obtained from sources believed reliable, however, Stan Johnson Company makes no guaranties, warranties or representations as to the completeness thereof. The presentation of this property for sale, rent or exchange is submitted subject to errors, omissions, change of price or conditions, or withdrawal without notices.
Stan Johnson Company180 Madison Avenue | Suite 1500New York, New York 10016+1 646.778.5560
stanjohnsonco.com
Jason Maier Senior Director [email protected] P: +1 646.841.0627
Ashley Wilhide Operations Analyst [email protected]
In Association With:Jeff Hughes NC Lic. #101282