Embed Size (px)
Citation preview

Walk in the ParkIntroductionWe can find green parks in almost every city. Going to the park is a lot of fun, but is this the only reason why we should create parks? Cities are crowded with people but also with cars and industrial plants. All these elements increase air pollution in the city and can even change the city’s weather conditions.
Parks are called green lungs. Their main role is to consume air pollution, mainly carbon dioxide (CO₂) and produce oxygen! This is done by the parks’ trees and other vegetation through a process called photosynthesis. In addition, parks reduce the heat created by cars, and industrial plants.
Measurements to be takenIn this investigation, students will measure ambient temperature and humidity to see how the presence of “green space” affects these parameters. Measurements should be taken on a walk in an area where the surroundings change from urban/developed with little or no plantings to natural/park-like with grass and gardens.
Materials needed: Mini Microclimates video (http://www.globisens.net/resources/experiment-videos)
Mini Set UpFor this experiment you will setup the Mini from the GlobiLab software menu. Use the directions in Getting to Know the Mini if you need assistance in setting up the Mini through the GlobiLab software. Sensor Selection - select the GPS, Ambient Temperature & Humidity Sampling Rate – 1/second Number of Samples - select 3000When you hit the Run button, the green LED lights will circle, and then a light will show for about 3 seconds at the temperature and humidity sensor icons indicating that these sensors are “live.”
1

Experiment Set Up
Show the Microclimes video, stopping it just before the data download (2:43). Ask students what they think happened with the temperature and humidity recordings. Then send them out to run the experiment for themselves in the area surrounding the school. You may wish to start in the school’s parking lot or other hard surfaced area.
Experiment Procedure 1. Select an area with lots of grass and vegetation and located within walking distance from the school. This might be a
garden area at the school or a nearby park.
2. Start the Mini from the computer/tablet software and begin walking slowly from the school’s parking lot to the destination area.
3. Wait at this area for 4-5 minutes and walk slowly back to the classroom. Use a slightly different route to return to the classroom.
4. Make sure your computer is connected to the Internet and open the GlobiLab software. Connect the Mini to the computer through the wireless Bluetooth channel.
5. Click on the download icon to transfer the data from the Mini to the GlobiLab software. The software will automatically display the data as a line graph. Right click twice on each of the GPS sensor headings to hide those graph lines. Your graph will look like the one in step 6 below.
2

6. Use the software markers to find the minimum and maximum temperatures reached during your data collection. In the example below, the maximum measured temperature was 30.5 °C and the minimum measured temperature was 28.3 °C.
7. Press the right triangle on the Display Option icon and select the Map icon. The software will open the Google Map application and display a satellite picture of the area where you conducted your recording. It will also plot the temperatures recorded during the experiment as a layer of color-coded data over the map. You will need to be connected to the Internet for this to work properly.
8. The colors on the map represent the different temperatures measured along your walk. Hover the mouse over any point to get a numeric value of the temperature at that point. Since the temperature may change by only a few
3
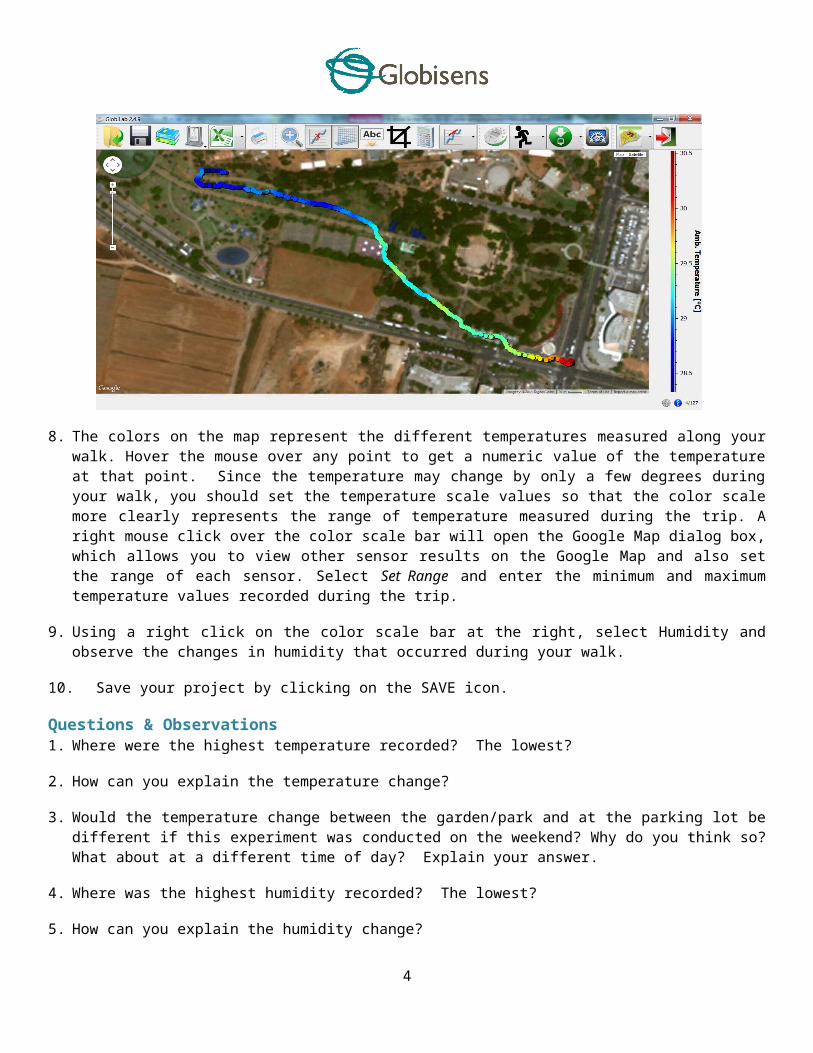
degrees during your walk, you should set the temperature scale values so that the color scale more clearly represents the range of temperature measured during the trip. A right mouse click over the color scale bar will open the Google Map dialog box, which allows you to view other sensor results on the Google Map and also set the range of each sensor. Select Set Range and enter the minimum and maximum temperature values recorded during the trip.
9. Using a right click on the color scale bar at the right, select Humidity and observe the changes in humidity that occurred during your walk.
10. Save your project by clicking on the SAVE icon.
Questions & Observations1. Where were the highest temperature recorded? The lowest?
2. How can you explain the temperature change?
3. Would the temperature change between the garden/park and at the parking lot be different if this experiment was conducted on the weekend? Why do you think so? What about at a different time of day? Explain your answer.
4. Where was the highest humidity recorded? The lowest?
5. How can you explain the humidity change?
6. Would the humidity change between the garden/park and at the parking lot be different if this experiment was conducted at the weekend? Why do you think so? What about at a different time of day? Explain your answer.
7. What are the benefits of green spaces? Describe and explain.
8. How could you improve the humidity and temperature conditions in your classroom? Explain.
9. Suggest ways that you could increase the amount of green space at your school.
Extension Activity1. While in Map View, right click with your mouse to the left of the color scale and choose GPS speed. What was your
walking speed along the trip?
2. Repeat the activity during different times/seasons of the year.
4

Next Generation Science Standards
Performance ExpectationsMake a claim about the merit of a solution to a problem caused when the environment changes and the types of plants and animals that live there may change. 3-LS4-4
Science & Engineering PracticesMake a claim about the merit of a solution to a problem by citing relevant evidence about how it meets the criteria and constraints of the problem.
Disciplinary Core IdeasWhen the environment changes in ways that affect a place’s physical characteristics, temperature, or availability of resources, some organisms survive and reproduce, others move to new locations, yet others move into the transformed environment, and some die.
Populations live in a variety of habitats, and change in those habitats affects the organisms living there.
Crosscutting ConceptsA system can be described in terms of its components and their interactions.
Knowledge of relevant scientific concepts and research findings is important in engineering.
Common Core State Standards Connections
ELA/Literacy RI.3.1 - Ask and answer questions to demonstrate understanding of a text, referring explicitly to the text as the basis
for the answers. RI.3.2 - Determine the main idea of a text; recount the key details and explain how they support the main idea. RI.3.3 - Describe the relationship between a series of historical events, scientific ideas or concepts, or steps in
technical procedures in a text, using language that pertains to time, sequence, and cause/effect. SL.3.4 - Report on a topic or text, tell a story, or recount an experience with appropriate facts and relevant,
descriptive details, speaking clearly at an understandable pace. W.3.1 - Write opinion pieces on topics or texts, supporting a point of view with reasons. W.3.2 - Write informative/explanatory texts to examine a topic and convey ideas and information clearly.
Mathematics MP.2 - Reason abstractly and quantitatively. MP.4 - Model with mathematics.
5