Embed Size (px)
Citation preview
Walking + Cycling
in Vancouver
2016 Report Card
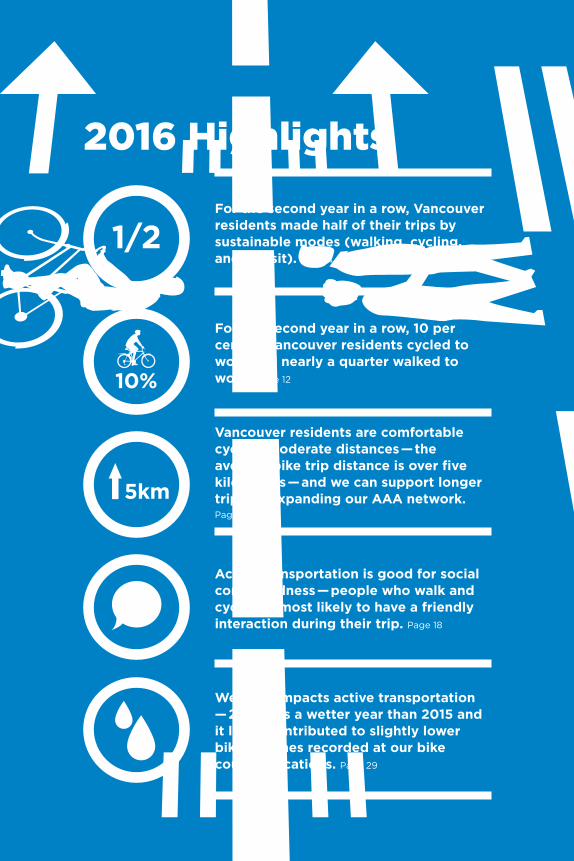
2016 Highlights
5km
1/2For the second year in a row, Vancouver residents made half of their trips by sustainable modes (walking, cycling, and transit). Page 4
Vancouver residents are comfortable cycling moderate distances — the average bike trip distance is over five kilometers — and we can support longer trips by expanding our AAA network. Page 14
For the second year in a row, 10 per cent of Vancouver residents cycled to work and nearly a quarter walked to work. Page 12
Active transportation is good for social connectedness — people who walk and cycle are most likely to have a friendly interaction during their trip. Page 18
Weather impacts active transportation — 2016 was a wetter year than 2015 and it likely contributed to slightly lower bike volumes recorded at our bike counter locations. Page 29
10%

Policy Overview 2
How Vancouver Residents are Getting Around 8
Walkability + Bikeability 16
Addressing Barriers 28
Photo Credits 39
Glossary 40
Contents
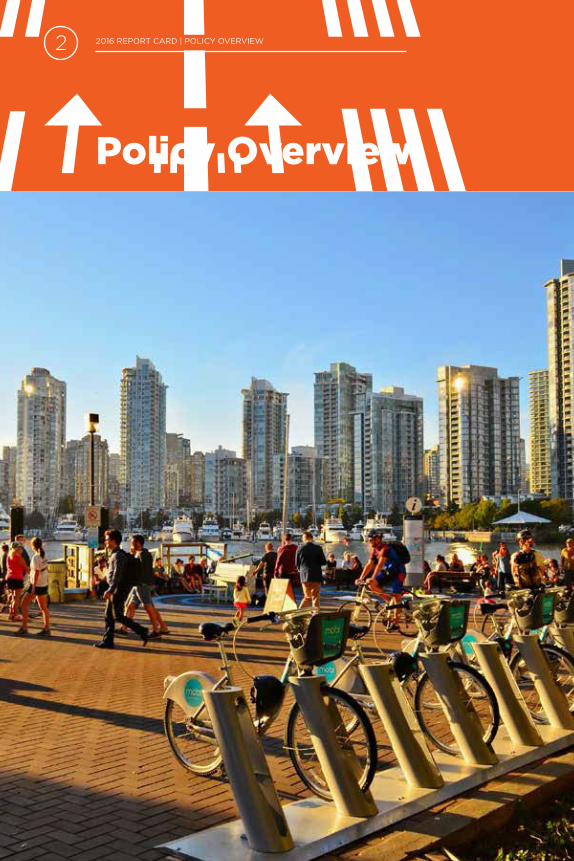
Policy Overview
PoliCy oVerVieW | 2016 rePorT CArD2016 rePorT CArD | PoliCy oVerVieW2

Vancouver’s Transportation 2040 plan has a vision of “a city with a smart and efficient transportation system.”The plan supports “a thriving economy while
increasing affordability; healthy citizens who are
mobile in a safe, accessible, and vibrant city; and
an enhanced natural environment that ensures a
healthy future for people and the planet.”
Active modes of transportation – that is, walking,
cycling and rolling – are central to that vision for
Vancouver. Public transit, private vehicles, and
goods movement also have important roles to
play, but this vision cannot be achieved without
land use mix and density, infrastructure, and a
culture that supports and encourages Vancouver
residents to choose walking and cycling for more
of their trips.
Read more at: vancouver.ca/transportation2040
T2040
3PoliCy oVerVieW | 2016 rePorT CArD2016 rePorT CArD | PoliCy oVerVieW
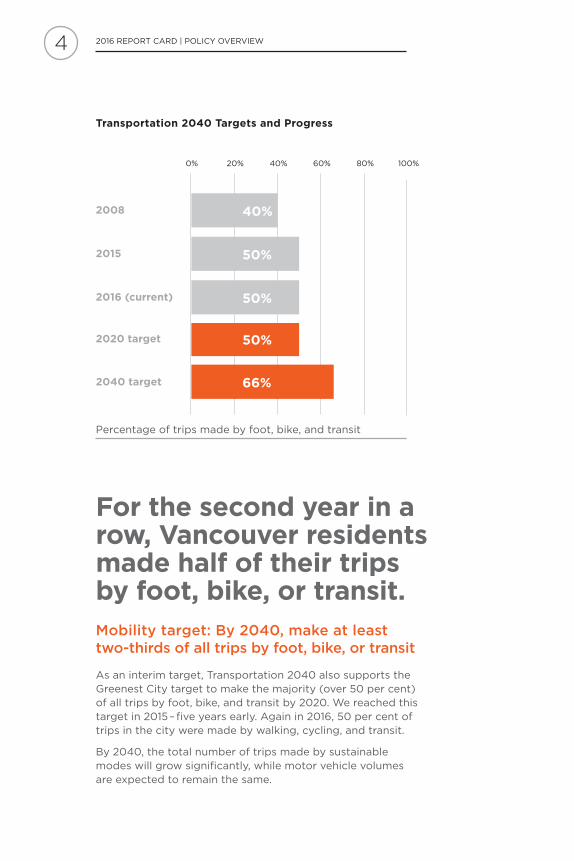
For the second year in a row, Vancouver residents made half of their trips by foot, bike, or transit.Mobility target: By 2040, make at least two-thirds of all trips by foot, bike, or transit
As an interim target, Transportation 2040 also supports the Greenest City target to make the majority (over 50 per cent) of all trips by foot, bike, and transit by 2020. We reached this target in 2015 – five years early. Again in 2016, 50 per cent of trips in the city were made by walking, cycling, and transit.
By 2040, the total number of trips made by sustainable modes will grow significantly, while motor vehicle volumes are expected to remain the same.
Transportation 2040 Targets and Progress
Percentage of trips made by foot, bike, and transit
0% 20% 40% 60% 80% 100%
40%2008
2016 (current) 50%
2020 target 50%
2040 target 66%
2015 50%
4 2016 rePorT CArD | PoliCy oVerVieW PoliCy oVerVieW | 2016 rePorT CArD
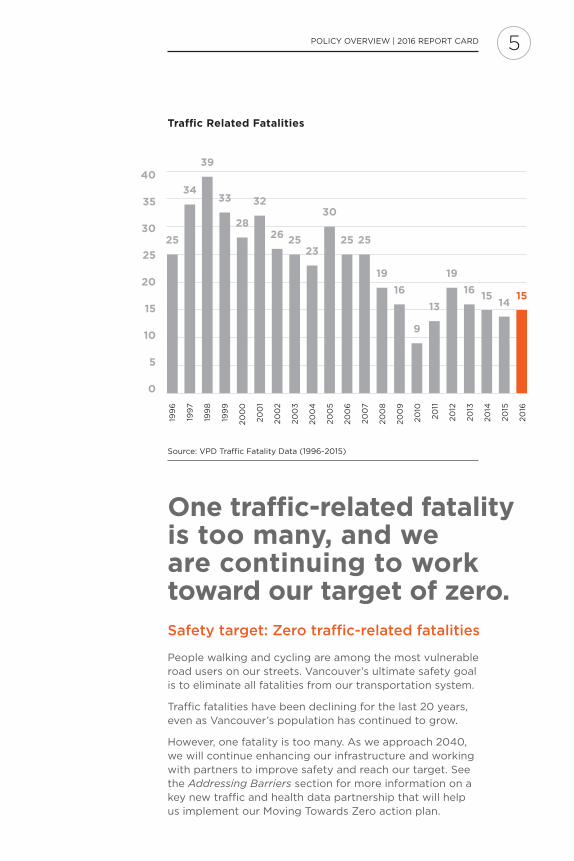
One traffic-related fatality is too many, and we are continuing to work toward our target of zero.Safety target: Zero traffic-related fatalities
People walking and cycling are among the most vulnerable road users on our streets. Vancouver’s ultimate safety goal is to eliminate all fatalities from our transportation system.
Traffic fatalities have been declining for the last 20 years, even as Vancouver’s population has continued to grow.
However, one fatality is too many. As we approach 2040, we will continue enhancing our infrastructure and working with partners to improve safety and reach our target. See the Addressing Barriers section for more information on a key new traffic and health data partnership that will help us implement our Moving Towards Zero action plan.
Traffic Related Fatalities
Source: VPD Traffic Fatality Data (1996-2015)
40
35
30
25
20
15
10
5
0
199
6
199
7
199
8
199
9
20
00
20
01
20
02
20
03
20
04
20
05
20
06
20
07
20
08
20
09
20
10
20
11
20
12
20
13
20
14
20
15
20
16
25
34
39
33
26 25 25 25
19 19
9
16 1615 15
14
28
13
23
3032
52016 rePorT CArD | PoliCy oVerVieW PoliCy oVerVieW | 2016 rePorT CArD
TitleBuilding a walkable and bikeable city through increased density, mixed land use, traffic-calming, interesting streetscapes...
Vancouver is a world leader in the development of complete, compact, and livable communities that allow most people to meet their daily needs...
Many health benefits are associated with sustainable transportation, including reduced rates of obesity, diabetes, heart disease and cancers...
PoliCy oVerVieW | 2016 rePorT CArD2016 rePorT CArD | PoliCy oVerVieW6
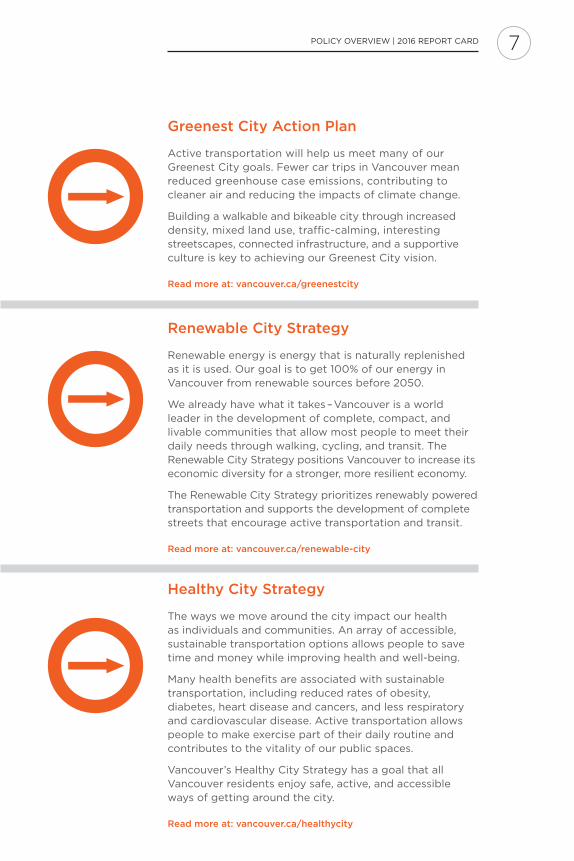
Greenest City Action Plan
Active transportation will help us meet many of our Greenest City goals. Fewer car trips in Vancouver mean reduced greenhouse case emissions, contributing to cleaner air and reducing the impacts of climate change.
Building a walkable and bikeable city through increased density, mixed land use, traffic-calming, interesting streetscapes, connected infrastructure, and a supportive culture is key to achieving our Greenest City vision.
Read more at: vancouver.ca/greenestcity
Renewable City Strategy
renewable energy is energy that is naturally replenished as it is used. our goal is to get 100% of our energy in Vancouver from renewable sources before 2050.
We already have what it takes – Vancouver is a world leader in the development of complete, compact, and livable communities that allow most people to meet their daily needs through walking, cycling, and transit. The renewable City Strategy positions Vancouver to increase its economic diversity for a stronger, more resilient economy.
The renewable City Strategy prioritizes renewably powered transportation and supports the development of complete streets that encourage active transportation and transit.
Read more at: vancouver.ca/renewable-city
Healthy City Strategy
The ways we move around the city impact our health as individuals and communities. An array of accessible, sustainable transportation options allows people to save time and money while improving health and well-being.
Many health benefits are associated with sustainable transportation, including reduced rates of obesity, diabetes, heart disease and cancers, and less respiratory and cardiovascular disease. Active transportation allows people to make exercise part of their daily routine and contributes to the vitality of our public spaces.
Vancouver’s Healthy City Strategy has a goal that all Vancouver residents enjoy safe, active, and accessible ways of getting around the city.
Read more at: vancouver.ca/healthycity
7PoliCy oVerVieW | 2016 rePorT CArD2016 rePorT CArD | PoliCy oVerVieW
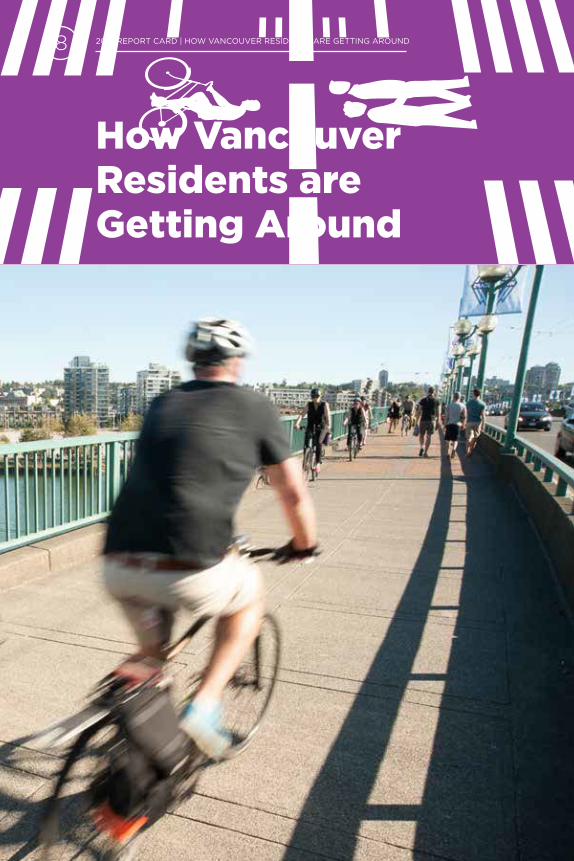
How Vancouver Residents are Getting Around
HoW VAnCouVer reSiDenTS Are GeTTinG ArounD | 2016 rePorT CArD2016 rePorT CArD | HoW VAnCouVer reSiDenTS Are GeTTinG ArounD8

Since 2013, Vancouver residents continue to make more of their trips on foot and by bike every year. Cycling has long been the fastest growing
mode share. Since 2013, cycling trips have
increased from four to seven per cent of
all trips made. Walking trips have also
increased, while car and transit trips have
decreased slightly.
Mode Share for All Trips
Source: 2016 Transportation Panel Survey
0% 20% 40% 60% 80% 100%
2013
2014
53% 18% 26% 4%
51% 18% 26% 5%
50%
50%
16%
16%
27%
27%
7%
7%
Auto Transit Walk Cycle
2015
2016
9HoW VAnCouVer reSiDenTS Are GeTTinG ArounD | 2016 rePorT CArD2016 rePorT CArD | HoW VAnCouVer reSiDenTS Are GeTTinG ArounD

Age
Vancouver residents of all ages walk and cycle to get around. Mode shares by age group in 2016 were similar to 2015. Transit is the most commonly used mode among 18-24 year olds, many of whom are likely to be students with transit passes, while driving is more common in older age groups. Walking is most common in the 25-44 age group and least common for those 18-24. Cycling is most common for the 18-24 and 45-64 groups and less common for those over 65.
Mode Share by Age Group
Source: 2016 Transportation Panel Survey
0% 20% 40% 60% 80% 100%
18–24 9%32% 45% 14%
25–44 6%
45–64 8%
65+ 4%
Who is Walking and Cycling in Vancouver?
44% 18% 33%
57% 11% 28%
56% 12% 23%
Auto Transit Walk Cycle
10 2016 rePorT CArD | HoW VAnCouVer reSiDenTS Are GeTTinG ArounD HoW VAnCouVer reSiDenTS Are GeTTinG ArounD | 2016 rePorT CArD

Source: 2016 Transportation Panel Survey
48%45% 29%
17%
13%18%
18%
31% 30%
Walking Mode Share by Home Area
3% 13%
8%
5%
3%
11% 7%
5%
8%
Cycling Mode Share by Home Area
Geography
Though people walk and cycle in all of Vancouver’s neighbourhoods, there are clear geographical differences in the ways we get around. Walking is most common in the West end (48 per cent) and downtown (45 per cent). Cycling is once again most common in the Vancouver Port area, made up of the Downtown eastside, Strathcona, and Grandview-Woodland neighbourhoods (13 per cent), and in Kitsilano (11 per cent).
Geographical patterns in 2016 were similar to 2015. over the next few years, we will track how infrastructure improvements and public bike share availability impact mode share in different areas of the city.
112016 rePorT CArD | HoW VAnCouVer reSiDenTS Are GeTTinG ArounD HoW VAnCouVer reSiDenTS Are GeTTinG ArounD | 2016 rePorT CArD

Trips Made by Foot and Bike
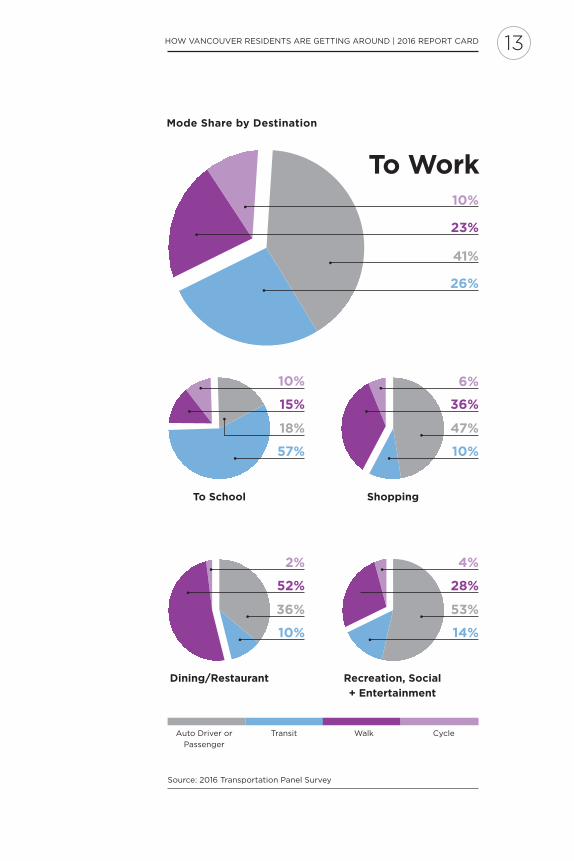
For the second year in a row, 10 per cent of Vancouver residents cycled to work and nearly a quarter walked to work.Destinations
Vancouver residents choose different ways of getting around for different kinds of trips. Active modes are most often chosen for trips to shopping and dining destinations.
12 2016 rePorT CArD | HoW VAnCouVer reSiDenTS Are GeTTinG ArounD HoW VAnCouVer reSiDenTS Are GeTTinG ArounD | 2016 rePorT CArD
Source: 2016 Transportation Panel Survey
To Work10%
41%
23%
26%
Shopping
6%
47%
36%
10%
Dining/Restaurant
2%
36%
52%
10%
Recreation, Social
+ Entertainment
4%
53%
28%
14%
To School
10%
18%
15%
57%
Auto Driver or
Passenger
Transit Walk Cycle
Mode Share by Destination
132016 rePorT CArD | HoW VAnCouVer reSiDenTS Are GeTTinG ArounD HoW VAnCouVer reSiDenTS Are GeTTinG ArounD | 2016 rePorT CArD
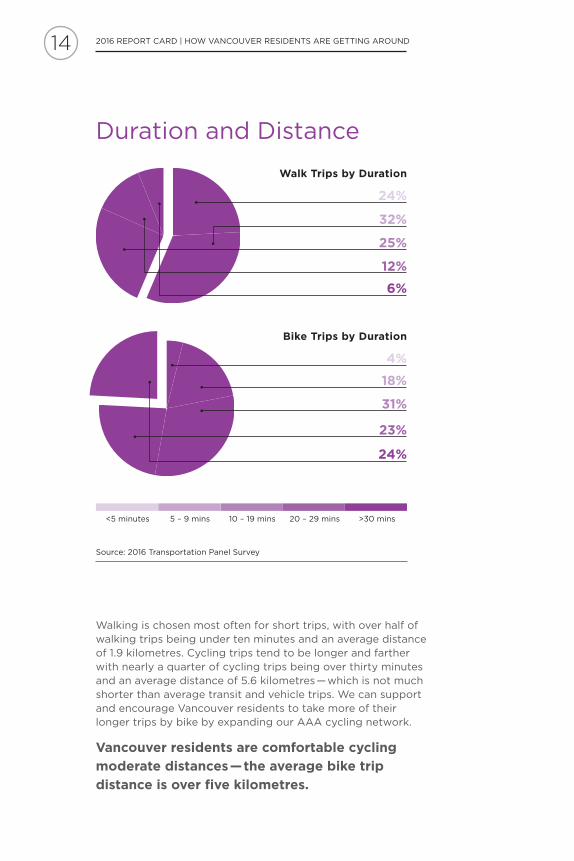
Duration and Distance
Walking is chosen most often for short trips, with over half of walking trips being under ten minutes and an average distance of 1.9 kilometres. Cycling trips tend to be longer and farther with nearly a quarter of cycling trips being over thirty minutes and an average distance of 5.6 kilometres — which is not much shorter than average transit and vehicle trips. We can support and encourage Vancouver residents to take more of their longer trips by bike by expanding our AAA cycling network.
Vancouver residents are comfortable cycling
moderate distances — the average bike trip
distance is over five kilometres.
Source: 2016 Transportation Panel Survey
<5 minutes 5 – 9 mins 10 – 19 mins 20 – 29 mins >30 mins
Bike Trips by Duration
4%
18%
24%
23%
Walk Trips by Duration
24%
6%
25%
32%
12%
31%
14 2016 rePorT CArD | HoW VAnCouVer reSiDenTS Are GeTTinG ArounD HoW VAnCouVer reSiDenTS Are GeTTinG ArounD | 2016 rePorT CArD
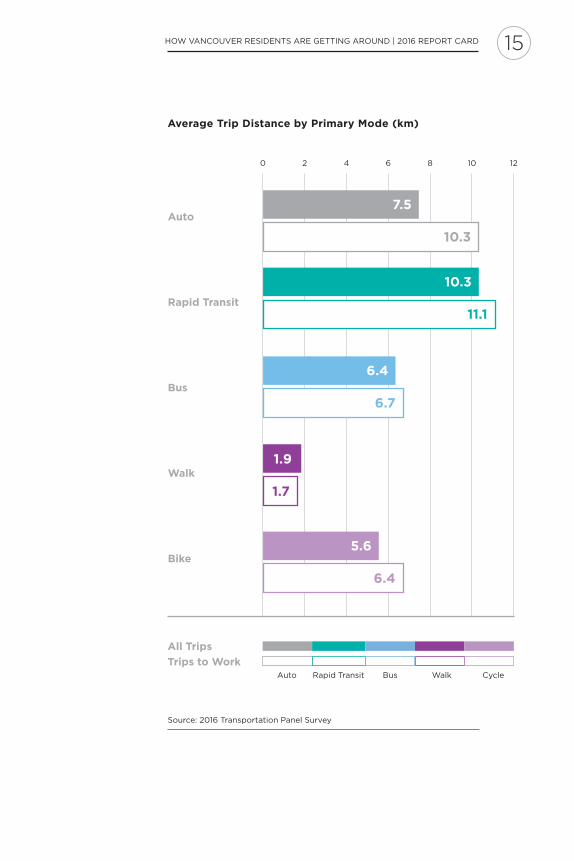
Auto
Rapid Transit
Bus
Walk
Bike
Average Trip Distance by Primary Mode (km)
7.5
10.3
6.4
5.6
10.3
11.1
6.4
1.9
1.7
6.7
0 2 4 6 8 10 12
All Trips
Source: 2016 Transportation Panel Survey
Auto rapid Transit Bus Walk Cycle
Trips to Work
152016 rePorT CArD | HoW VAnCouVer reSiDenTS Are GeTTinG ArounD HoW VAnCouVer reSiDenTS Are GeTTinG ArounD | 2016 rePorT CArD

Walkability + Bikeability
WAlKABiliTy + BiKeABiliTy | 2016 rePorT CArD2016 rePorT CArD | WAlKABiliTy + BiKeABiliTy16

80%Agree
Source: My Health My Community, 2013 – 14
Healthy City for All
Environments to Thrive In
Vancouver’s Healthy City Strategy
recognizes that healthy urban environments
are characterized by complete, compact,
and connected communities that are easy
to get around on foot and by bike.
Good infrastructure and an array of amenities are key elements of communities that promote active transportation.
Vancouver Coastal Health’s “My Health My Community” survey found that eight in ten Vancouver respondents agreed their neighbourhoods had well maintained sidewalks, and eight in ten also agreed that they had amenities within walking or cycling distance of their homes.
81%Agree
My neighbourhood
has well maintained
sidewalks
76% Metro Vancouver
There are amenities
within walking or cycling
distance of my home
70% Metro Vancouver
17WAlKABiliTy + BiKeABiliTy | 2016 rePorT CArD2016 rePorT CArD | WAlKABiliTy + BiKeABiliTy

Cultivating Connections
The Healthy City Strategy has a goal that Vancouver residents are connected and engaged in the places and spaces that matter to us.
Active transportation supports connected communities. People travelling on foot and bike are more likely to engage in a friendly interaction during their trip than people travelling by transit or vehicle.
Likelihood of a Friendly Social Interaction
During Trip by Mode
Active
Transit
Auto
24%
35%
16%Source: 2016 Transportation Panel Survey
18 WAlKABiliTy + BiKeABiliTy | 2016 rePorT CArD2016 rePorT CArD | WAlKABiliTy + BiKeABiliTy

Source: 2016 Transportation Panel Survey
improved GiS calculation methods were used in 2016
Cycling Network
View and download our most up-to-date cycling map at: vancouver.ca/bikevancouver
311km
25%
28km
51%
Vancouver’s total bike network
of the network is designed for all ages and abilities
would like to travel by bicycle more often
Seaside Greenway is Vancouver’s longest route, going from the Vancouver Convention Centre to Spanish Banks
19WAlKABiliTy + BiKeABiliTy | 2016 rePorT CArD2016 rePorT CArD | WAlKABiliTy + BiKeABiliTy
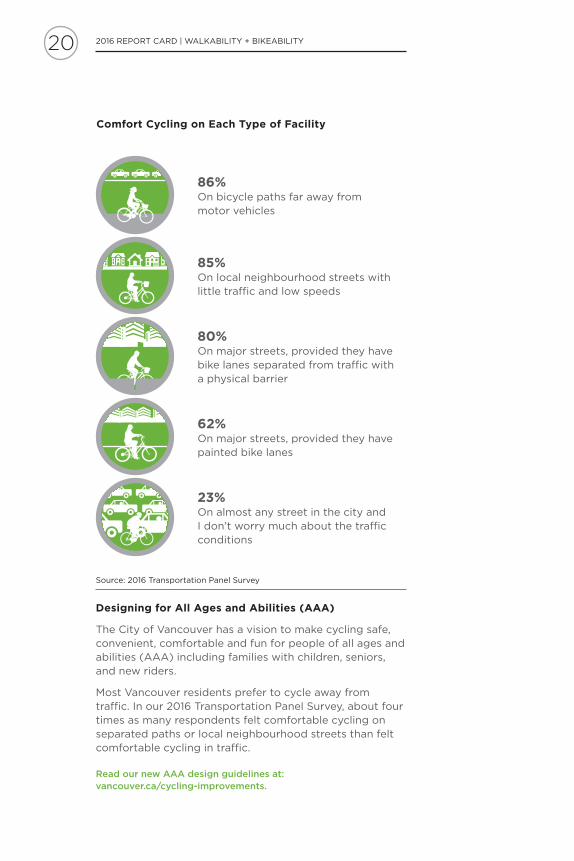
Designing for All Ages and Abilities (AAA)
The City of Vancouver has a vision to make cycling safe, convenient, comfortable and fun for people of all ages and abilities (AAA) including families with children, seniors, and new riders.
Most Vancouver residents prefer to cycle away from traffic. in our 2016 Transportation Panel Survey, about four times as many respondents felt comfortable cycling on separated paths or local neighbourhood streets than felt comfortable cycling in traffic.
Read our new AAA design guidelines at: vancouver.ca/cycling-improvements.
Comfort Cycling on Each Type of Facility
86%on bicycle paths far away from motor vehicles
85%on local neighbourhood streets with little traffic and low speeds
80%on major streets, provided they have bike lanes separated from traffic with a physical barrier
62%on major streets, provided they have painted bike lanes
23%on almost any street in the city and i don’t worry much about the traffic conditions
Source: 2016 Transportation Panel Survey
20 2016 rePorT CArD | WAlKABiliTy + BiKeABiliTy WAlKABiliTy + BiKeABiliTy | 2016 rePorT CArD
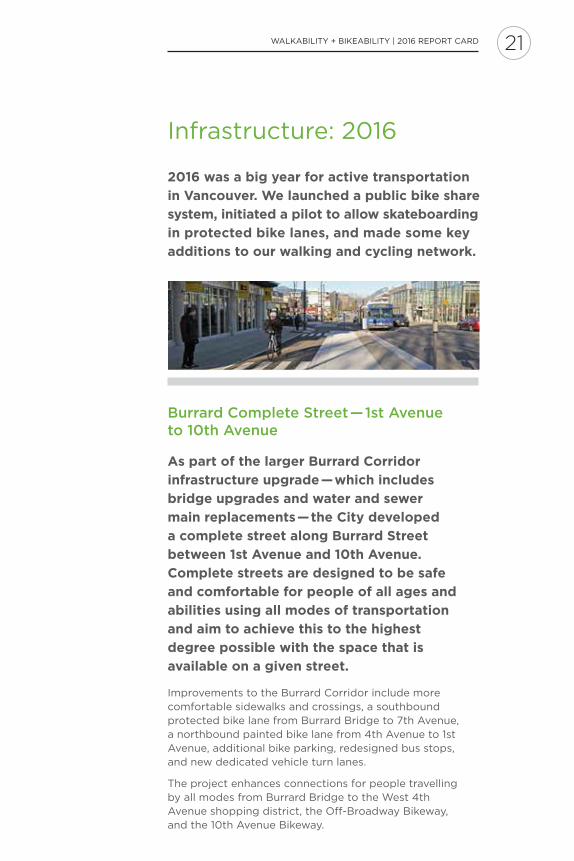
infrastructure: 2016
2016 was a big year for active transportation
in Vancouver. We launched a public bike share
system, initiated a pilot to allow skateboarding
in protected bike lanes, and made some key
additions to our walking and cycling network.
Burrard Complete Street — 1st Avenue to 10th Avenue
As part of the larger Burrard Corridor
infrastructure upgrade — which includes
bridge upgrades and water and sewer
main replacements — the City developed
a complete street along Burrard Street
between 1st Avenue and 10th Avenue.
Complete streets are designed to be safe
and comfortable for people of all ages and
abilities using all modes of transportation
and aim to achieve this to the highest
degree possible with the space that is
available on a given street.
improvements to the Burrard Corridor include more comfortable sidewalks and crossings, a southbound protected bike lane from Burrard Bridge to 7th Avenue, a northbound painted bike lane from 4th Avenue to 1st Avenue, additional bike parking, redesigned bus stops, and new dedicated vehicle turn lanes.
The project enhances connections for people travelling by all modes from Burrard Bridge to the West 4th Avenue shopping district, the off-Broadway Bikeway, and the 10th Avenue Bikeway.
212016 rePorT CArD | WAlKABiliTy + BiKeABiliTy WAlKABiliTy + BiKeABiliTy | 2016 rePorT CArD
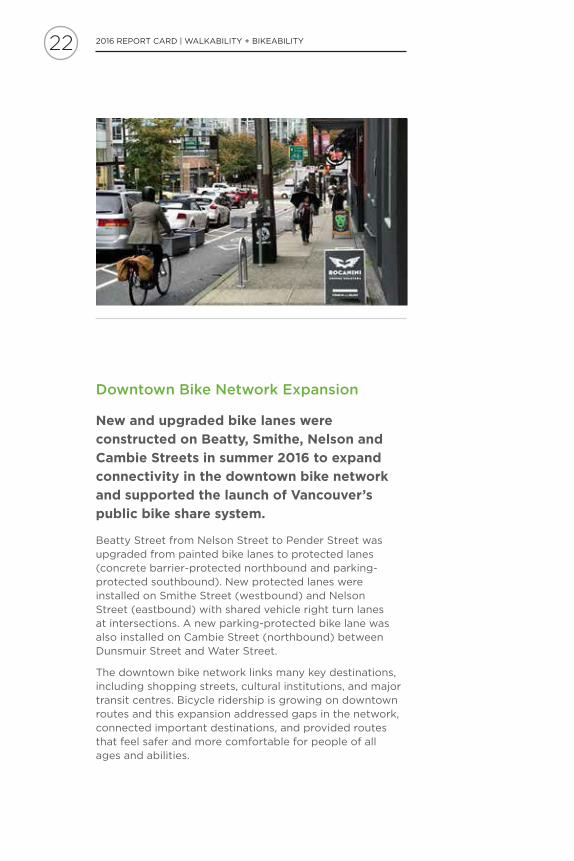
Downtown Bike Network Expansion
New and upgraded bike lanes were
constructed on Beatty, Smithe, Nelson and
Cambie Streets in summer 2016 to expand
connectivity in the downtown bike network
and supported the launch of Vancouver’s
public bike share system.
Beatty Street from nelson Street to Pender Street was upgraded from painted bike lanes to protected lanes (concrete barrier-protected northbound and parking-protected southbound). new protected lanes were installed on Smithe Street (westbound) and nelson Street (eastbound) with shared vehicle right turn lanes at intersections. A new parking-protected bike lane was also installed on Cambie Street (northbound) between Dunsmuir Street and Water Street.
The downtown bike network links many key destinations, including shopping streets, cultural institutions, and major transit centres. Bicycle ridership is growing on downtown routes and this expansion addressed gaps in the network, connected important destinations, and provided routes that feel safer and more comfortable for people of all ages and abilities.
22 2016 rePorT CArD | WAlKABiliTy + BiKeABiliTy WAlKABiliTy + BiKeABiliTy | 2016 rePorT CArD

1
2
3
4
existing route existing
Protected route
new route upgrade
Cambie Street1 Smithe Street2 nelson Street3 Beatty Street4
n
232016 rePorT CArD | WAlKABiliTy + BiKeABiliTy WAlKABiliTy + BiKeABiliTy | 2016 rePorT CArD

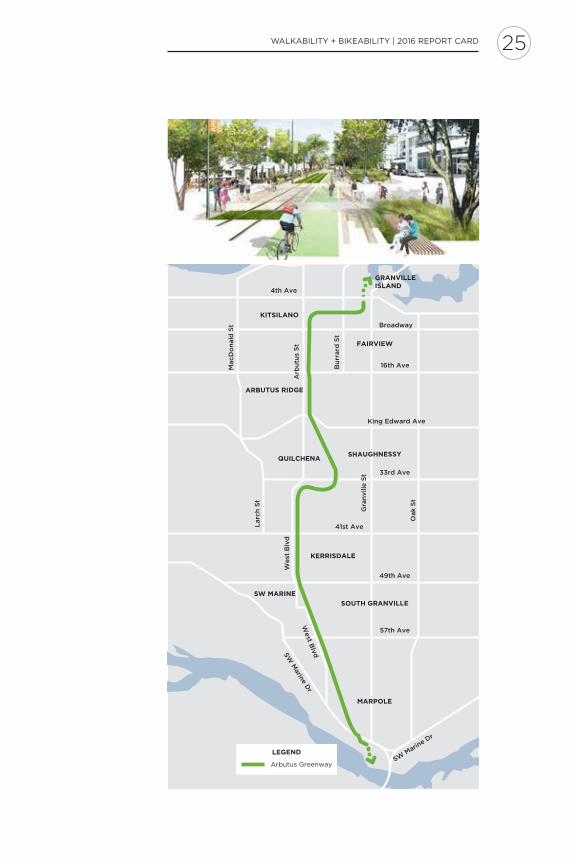
Arbutus Greenway – Purchase and Temporary Pathway
In March 2016, the City purchased the Arbutus
Greenway (42 acres of land) from Canadian
Pacific Railway for the purpose of creating
a high-quality transportation corridor that
accommodates public space, walking, cycling,
and a future streetcar. The Arbutus Greenway
runs north-south through Vancouver, linking
False Creek to the Fraser River. It connects
people, parks and places through the Kitsilano,
Arbutus-Ridge, Kerrisdale, and Marpole
neighbourhoods.
Construction began on a temporary path in fall 2016 so that everyone can explore and enjoy the corridor while the future Arbutus Greenway is being planned and designed.
Follow the process at vancouver.ca/arbutusgreenway for opportunities to get involved.
24 2016 rePorT CArD | WAlKABiliTy + BiKeABiliTy WAlKABiliTy + BiKeABiliTy | 2016 rePorT CArD
KITSILANO
FAIRVIEW
GRANVILLEISLAND
SHAUGHNESSY
SOUTH GRANVILLE
KERRISDALE
SW MARINE
57th Ave
SW M
arine Dr
SW M
arine D
r
49th Ave
41st Ave
33rd Ave
King Edward Ave
Bu
rrard
St
tS
elliv
nar
G
tS
ka
O
tS
dla
no
Dc
aM
tS s
utu
brA
dvl
B tse
W
West B
lvd
tS
hcr
aL
16th Ave
4th Ave
Broadway
QUILCHENA
MARPOLE
ARBUTUS RIDGE
LEGEND
Arbutus Greenway
252016 rePorT CArD | WAlKABiliTy + BiKeABiliTy WAlKABiliTy + BiKeABiliTy | 2016 rePorT CArD
CHILCO ST
CARR
AL
ST
CARDERO ST
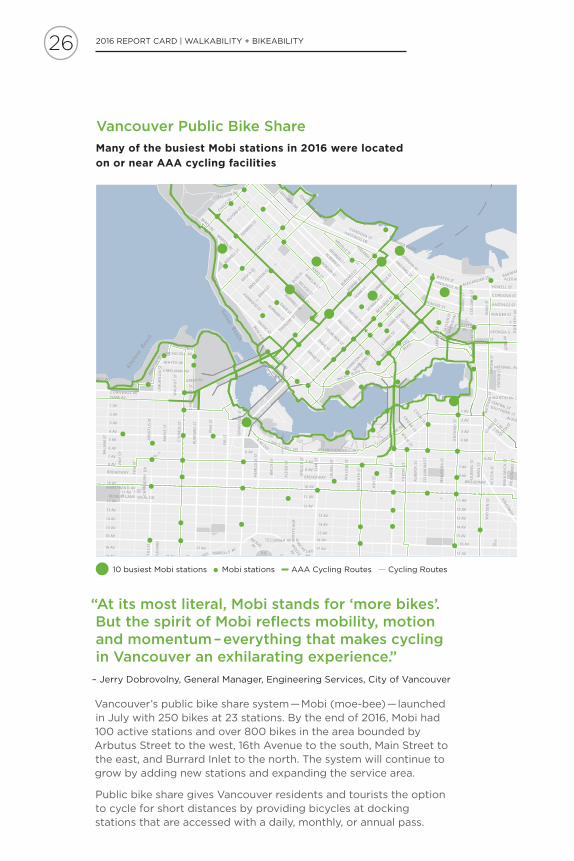
Vancouver’s public bike share system — Mobi (moe-bee) — launched in July with 250 bikes at 23 stations. By the end of 2016, Mobi had 100 active stations and over 800 bikes in the area bounded by Arbutus Street to the west, 16th Avenue to the south, Main Street to the east, and Burrard inlet to the north. The system will continue to grow by adding new stations and expanding the service area.
Public bike share gives Vancouver residents and tourists the option to cycle for short distances by providing bicycles at docking stations that are accessed with a daily, monthly, or annual pass.
Vancouver Public Bike Share
“At its most literal, Mobi stands for ‘more bikes’. But the spirit of Mobi reflects mobility, motion and momentum – everything that makes cycling in Vancouver an exhilarating experience.”
– Jerry Dobrovolny, General Manager, engineering Services, City of Vancouver
Many of the busiest Mobi stations in 2016 were located
on or near AAA cycling facilities
10 busiest Mobi stations Mobi stations Cycling routesAAA Cycling routes
26 2016 rePorT CArD | WAlKABiliTy + BiKeABiliTy WAlKABiliTy + BiKeABiliTy | 2016 rePorT CArD

Total distance travelled equal to the distance from Earth to the moon
Source: Mobi user Survey
Source: Mobi user data
100stations 800
bikes
use Mobi to ride one-
way or for just a part
of their trip
owns one or more
private bikes
Minute average
trip length
rides on the busiest
day of 2016
63%
Trips in 2016 covering
407,818 kilometers141,103
18 2,502
79%
At the end of 2016:
+
272016 rePorT CArD | WAlKABiliTy + BiKeABiliTy WAlKABiliTy + BiKeABiliTy | 2016 rePorT CArD
Addressing Barriers
ADDreSSinG BArrierS | 2016 rePorT CArD28 2016 rePorT CArD | ADDreSSinG BArrierS

66 per cent of Vancouver
residents find riding in dark
or wet conditions a barrier
to cycling
Source: Active Transportation Survey, 2015
9 out of 12 months had higher
rain volumes in Vancouver in
2016 than in 2015
Source: environment Canada
20162015
Our 2015 Report Card shared the results of survey research into common perceptions and attitudes about walking and cycling in Vancouver, as well as motivations and barriers that influence decisions to travel using active modes.This section takes a closer look at some of
the work underway to address barriers and to
promote, celebrate, and educate about active
transportation.
29ADDreSSinG BArrierS | 2016 rePorT CArD2016 rePorT CArD | ADDreSSinG BArrierS
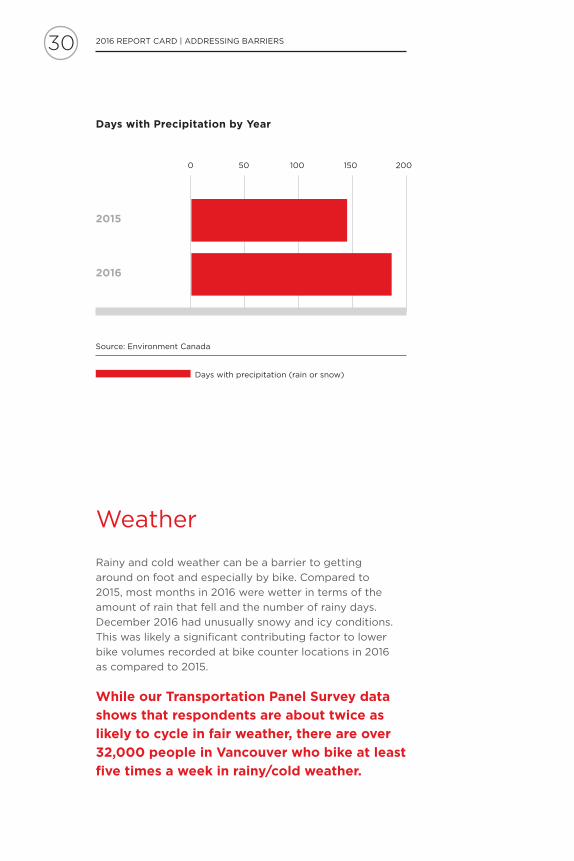
Weather
rainy and cold weather can be a barrier to getting
around on foot and especially by bike. Compared to
2015, most months in 2016 were wetter in terms of the
amount of rain that fell and the number of rainy days.
December 2016 had unusually snowy and icy conditions.
This was likely a significant contributing factor to lower
bike volumes recorded at bike counter locations in 2016
as compared to 2015.
While our Transportation Panel Survey data
shows that respondents are about twice as
likely to cycle in fair weather, there are over
32,000 people in Vancouver who bike at least
five times a week in rainy/cold weather.
Days with Precipitation by Year
Days with precipitation (rain or snow)
Source: environment Canada
0 50 100 150 200
2015
2016
30 2016 rePorT CArD | ADDreSSinG BArrierS ADDreSSinG BArrierS | 2016 rePorT CArD
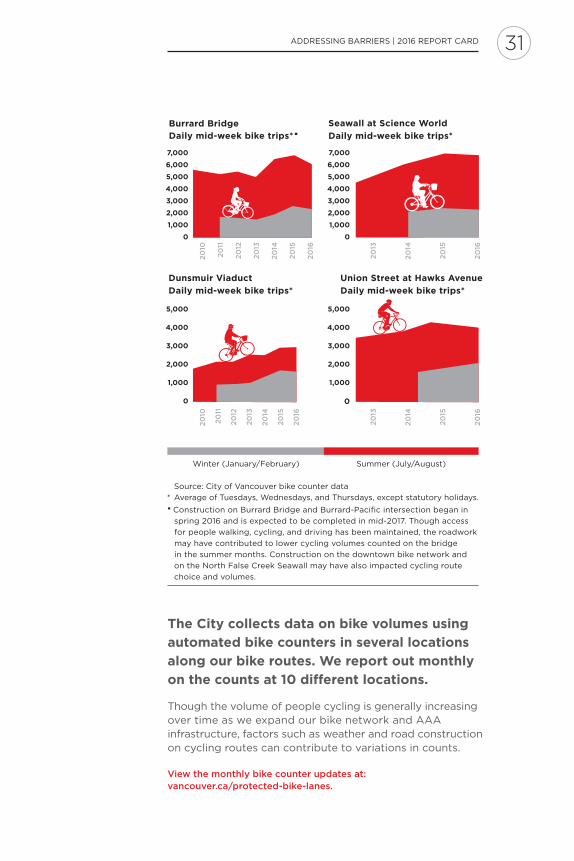
The City collects data on bike volumes using
automated bike counters in several locations
along our bike routes. We report out monthly
on the counts at 10 different locations.
Though the volume of people cycling is generally increasing over time as we expand our bike network and AAA infrastructure, factors such as weather and road construction on cycling routes can contribute to variations in counts.
View the monthly bike counter updates at: vancouver.ca/protected-bike-lanes.
Source: City of Vancouver bike counter data
* Average of Tuesdays, Wednesdays, and Thursdays, except statutory holidays.
˙Construction on Burrard Bridge and Burrard-Pacific intersection began in
spring 2016 and is expected to be completed in mid-2017. Though access
for people walking, cycling, and driving has been maintained, the roadwork
may have contributed to lower cycling volumes counted on the bridge
in the summer months. Construction on the downtown bike network and
on the north False Creek Seawall may have also impacted cycling route
choice and volumes.
Summer (July/August)Winter (January/February)
Burrard Bridge Daily mid-week bike trips*˙
Seawall at Science World
Daily mid-week bike trips*
7,000
6,000
5,000
4,000
3,000
2,000
1,000
0
7,000
6,000
5,000
4,000
3,000
2,000
1,000
0
20
10
20
11
20
12
20
13
20
14
20
15
20
16
20
10
20
11
20
12
20
13
20
14
20
15
20
16
20
13
20
14
20
15
20
16
20
13
20
14
20
15
20
16
Union Street at Hawks Avenue
Daily mid-week bike trips*
Dunsmuir Viaduct
Daily mid-week bike trips*
5,000
4,000
3,000
2,000
1,000
0
5,000
4,000
3,000
2,000
1,000
0
312016 rePorT CArD | ADDreSSinG BArrierS ADDreSSinG BArrierS | 2016 rePorT CArD

Weather
Factors including weather and road construction on cycling routes can contribute to fluctuations in the number of people cycling. For example, roadwork on Burrard Bridge and the Burrard-Pacific intersection through most of 2016 may have contributed to lower cycling volumes counted on the bridge in the summer months.
Wetter than usual weather also influenced travel behaviour in 2016, but bike volumes cannot be directly correlated to rain volumes as rainy weather can often affect transportation choices in less direct ways. The expectation of heavy rain later in the day can influence the transportation mode a person selects in the morning, regardless of whether the rain actually occurs. Moreover, transportation habits are formed over time. After a period of rainy days during which a person decides to take transit or drive for their commute rather than walk or cycle, it may take longer than a single dry day for them to return to a habit of commuting by active modes.
Aside from not wanting to get wet while riding, safety is also a concern in dark or rainy conditions as visibility can be compromised for people cycling, walking and driving. roads and pathways can also become slippery. These are issues that we can mitigate by building and maintaining high-quality AAA cycling infrastructure.
in our 2015 Active Transportation Survey, 66 per cent of respondents said that riding in dark or wet conditions was a significant concern or barrier for them. in future surveys, we plan to ask more specific questions to better understand why this is a barrier and what we can do to address it.
32 2016 rePorT CArD | ADDreSSinG BArrierS ADDreSSinG BArrierS | 2016 rePorT CArD
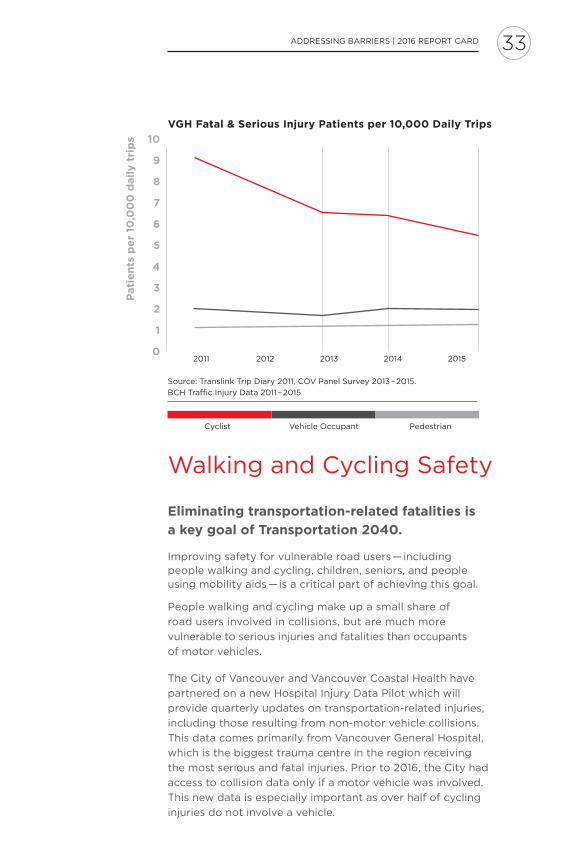
Walking and Cycling Safety
Eliminating transportation-related fatalities is
a key goal of Transportation 2040.
improving safety for vulnerable road users — including people walking and cycling, children, seniors, and people using mobility aids — is a critical part of achieving this goal.
People walking and cycling make up a small share of
road users involved in collisions, but are much more
vulnerable to serious injuries and fatalities than occupants
of motor vehicles.
The City of Vancouver and Vancouver Coastal Health have
partnered on a new Hospital injury Data Pilot which will
provide quarterly updates on transportation-related injuries,
including those resulting from non-motor vehicle collisions.
This data comes primarily from Vancouver General Hospital,
which is the biggest trauma centre in the region receiving
the most serious and fatal injuries. Prior to 2016, the City had
access to collision data only if a motor vehicle was involved.
This new data is especially important as over half of cycling
injuries do not involve a vehicle.
VGH Fatal & Serious Injury Patients per 10,000 Daily Trips
Source: Translink Trip Diary 2011, CoV Panel Survey 2013 – 2015.
BCH Traffic injury Data 2011 – 2015
Cyclist Vehicle occupant Pedestrian
2011 2012 2013 2014 2015
10
9
8
7
6
5
4
3
2
1
0
Pati
en
ts p
er
10,0
00
dail
y t
rip
s
332016 rePorT CArD | ADDreSSinG BArrierS ADDreSSinG BArrierS | 2016 rePorT CArD

Cycling fatalities and serious injuries occur at
a higher rate than for other modes, but they
are decreasing over time as we improve our
infrastructure and as cycling volumes grow.
under the Moving Towards Zero Safety Action Plan,
the City has identified priority intersections and
corridors — including those that are high risk for seniors
and children — to conduct detailed safety studies and select
the most effective strategies to reduce serious injuries and
fatalities at each location.
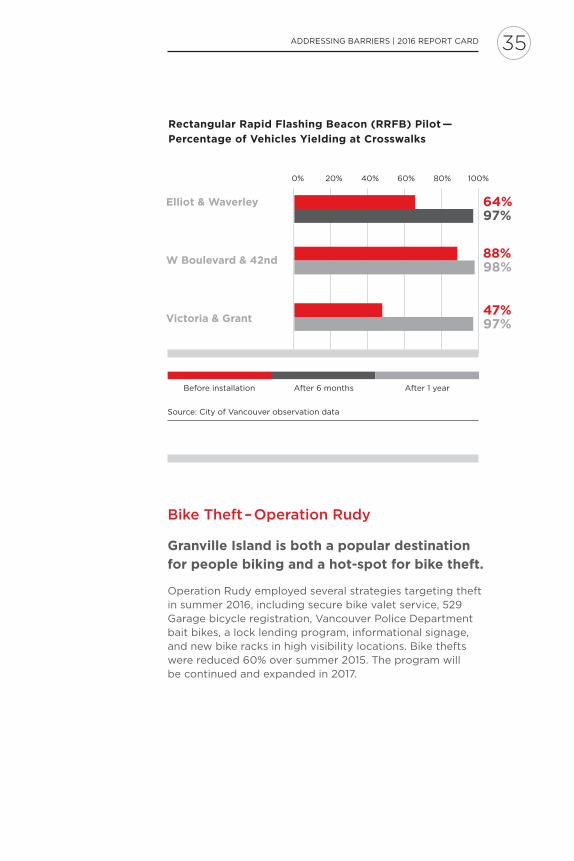
The City is piloting and evaluating new solutions. one
promising example is the rectangular rapid Flashing
Beacon (rrFB) introduced in three locations in the city.
When a person crosses at these locations on foot, they press
a button to turn on high-intensity lights that signal to people
driving and cycling that they are crossing. So far, rrFBs
have been successful in increasing the percentage of people
in vehicles who yield to people crossing the street.
Working with partners, such as the Vancouver Police Department and iCBC, to enforce and educate will also be critical in moving towards zero fatalities.
More information about the Moving Towards Zero Safety Action Plan can be found here: http://council.vancouver.ca/20161214/documents/cfsc3presentation.pdf.
Photo: rectangular rapid Flashing Beacon (rrFB) at Victoria Drive and
Grant Street
34 2016 rePorT CArD | ADDreSSinG BArrierS ADDreSSinG BArrierS | 2016 rePorT CArD
Bike Theft – Operation Rudy
Granville Island is both a popular destination
for people biking and a hot-spot for bike theft.
operation rudy employed several strategies targeting theft in summer 2016, including secure bike valet service, 529 Garage bicycle registration, Vancouver Police Department bait bikes, a lock lending program, informational signage, and new bike racks in high visibility locations. Bike thefts were reduced 60% over summer 2015. The program will be continued and expanded in 2017.
Source: City of Vancouver observation data
Before installation After 6 months After 1 year
Rectangular Rapid Flashing Beacon (RRFB) Pilot —
Percentage of Vehicles Yielding at Crosswalks
0% 20% 40% 60% 80% 100%
Elliot & Waverley
W Boulevard & 42nd
Victoria & Grant
64%
88%
47%
97%
98%
97%
352016 rePorT CArD | ADDreSSinG BArrierS ADDreSSinG BArrierS | 2016 rePorT CArD
Education and Promotion
Educating, promoting, and celebrating are important to build a culture in Vancouver that supports and encourages active transportation.
Read more about the City’s promotion and education initiatives at: vancouver.ca/atpep
Our aim is for Vancouver residents to see walking and cycling as convenient, fun, and normal ways to get around every day.
36 2016 rePorT CArD | ADDreSSinG BArrierS ADDreSSinG BArrierS | 2016 rePorT CArD
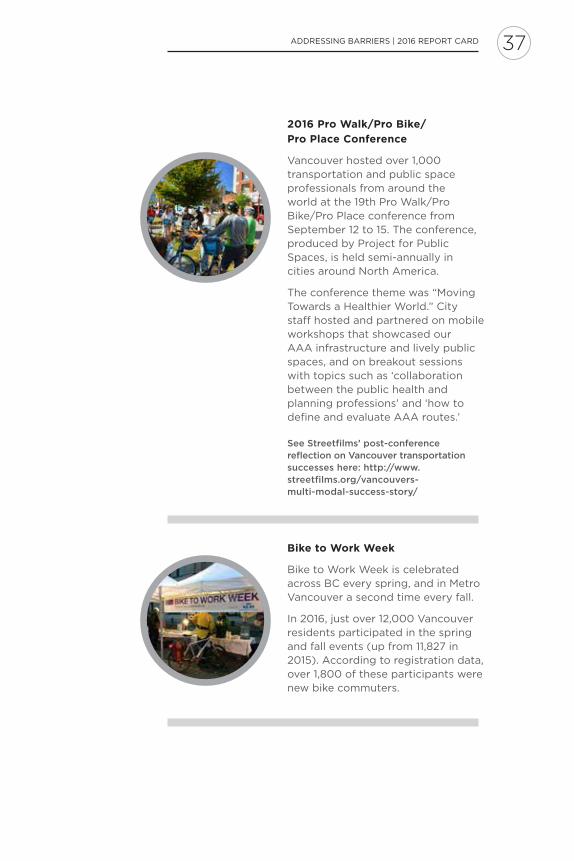
2016 Pro Walk/Pro Bike/
Pro Place Conference
Vancouver hosted over 1,000 transportation and public space professionals from around the world at the 19th Pro Walk/Pro Bike/Pro Place conference from September 12 to 15. The conference, produced by Project for Public Spaces, is held semi-annually in cities around north America.
The conference theme was “Moving Towards a Healthier World.” City staff hosted and partnered on mobile workshops that showcased our AAA infrastructure and lively public spaces, and on breakout sessions with topics such as ‘collaboration between the public health and planning professions’ and ‘how to define and evaluate AAA routes.’
See Streetfilms’ post-conference reflection on Vancouver transportation successes here: http://www.streetfilms.org/vancouvers-multi-modal-success-story/
Bike to Work Week
Bike to Work Week is celebrated across BC every spring, and in Metro Vancouver a second time every fall.
in 2016, just over 12,000 Vancouver residents participated in the spring and fall events (up from 11,827 in 2015). According to registration data, over 1,800 of these participants were new bike commuters.
372016 rePorT CArD | ADDreSSinG BArrierS ADDreSSinG BArrierS | 2016 rePorT CArD
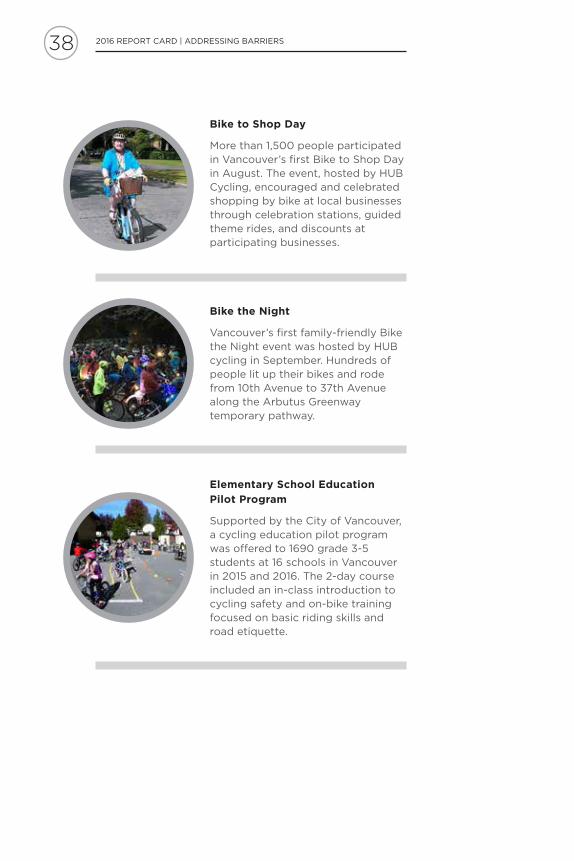
Bike to Shop Day
More than 1,500 people participated in Vancouver’s first Bike to Shop Day in August. The event, hosted by HuB Cycling, encouraged and celebrated shopping by bike at local businesses through celebration stations, guided theme rides, and discounts at participating businesses.
Bike the Night
Vancouver’s first family-friendly Bike the night event was hosted by HuB cycling in September. Hundreds of people lit up their bikes and rode from 10th Avenue to 37th Avenue along the Arbutus Greenway temporary pathway.
Elementary School Education
Pilot Program
Supported by the City of Vancouver, a cycling education pilot program was offered to 1690 grade 3-5 students at 16 schools in Vancouver in 2015 and 2016. The 2-day course included an in-class introduction to cycling safety and on-bike training focused on basic riding skills and road etiquette.
38 2016 rePorT CArD | ADDreSSinG BArrierS PHoTo CreDiTS | 2016 rePorT CArD

Photo CreditsCover ImageSteve Chou
Page 2Steve Chou
Page 8rod Preston
Page 12rod Preston
Page 16Paul Krueger
Page 21Grace Chiang
Page 22Paul Krueger
Page 24Mike Zipf
Page 28Paul Krueger
Page 37Steve ChouDale Bracewell
Page 38Participant at HuB’s Bike to Shop Day 2016lynn GuilbaultHuB Cycling
2016 rePorT CArD | ADDreSSinG BArrierS PHoTo CreDiTS | 2016 rePorT CArD 39
GlossaryAAA (all-ages-and-abilities) cycling routes: A route designed to feel safe and comfortable for everyone, including seniors, families with young children, and new riders.
Active transportation: Travelling by walking, cycling, rolling, or any other method of movement by human power.
Infrastructure: The “hardware” that makes active transportation possible, including sidewalks, bike lanes, streets, and pathways.
Mode share: The proportion of trips taken using a particular method — or mode — of travel (e.g. walking, cycling, transit, auto).
Right-of-way: The legal right to proceed before others in a particular situation or place (e.g. at an intersection).
40 2016 rePorT CArD | GloSSAry


For More information:
Phone: 3–1–1
TTy: 7–1–1
outside Vancouver:
604 – 873 – 7000
vancouver.ca
H i chi tiêt
obtenga información