Embed Size (px)
Citation preview

This article was downloaded by: [University of Calgary]On: 22 May 2012, At: 07:35Publisher: Taylor & FrancisInforma Ltd Registered in England and Wales Registered Number: 1072954 Registered office: Mortimer House,37-41 Mortimer Street, London W1T 3JH, UK
Footwear SciencePublication details, including instructions for authors and subscription information:http://www.tandfonline.com/loi/tfws20
Walking in an unstable Masai Barefoot Technology(MBT) shoe introduces kinematic and kinetic changesat the hip, knee and ankle before and after a 6-weekaccommodation period: a comprehensive analysisusing principal component analysis (PCA)Scott C. Landry a , Benno M. Nigg b & Karelia E. Tecante ba School of Recreation Management and Kinesiology, Acadia University, Wolfville, NovaScotia, Canadab Faculty of Kinesiology, University of Calgary, Calgary, Alberta, Canada
Available online: 17 May 2012
To cite this article: Scott C. Landry, Benno M. Nigg & Karelia E. Tecante (2012): Walking in an unstable Masai BarefootTechnology (MBT) shoe introduces kinematic and kinetic changes at the hip, knee and ankle before and after a 6-weekaccommodation period: a comprehensive analysis using principal component analysis (PCA), Footwear Science, 4:2, 101-114
To link to this article: http://dx.doi.org/10.1080/19424280.2012.684448
PLEASE SCROLL DOWN FOR ARTICLE
Full terms and conditions of use: http://www.tandfonline.com/page/terms-and-conditions
This article may be used for research, teaching, and private study purposes. Any substantial or systematicreproduction, redistribution, reselling, loan, sub-licensing, systematic supply, or distribution in any form toanyone is expressly forbidden.
The publisher does not give any warranty express or implied or make any representation that the contentswill be complete or accurate or up to date. The accuracy of any instructions, formulae, and drug doses shouldbe independently verified with primary sources. The publisher shall not be liable for any loss, actions, claims,proceedings, demand, or costs or damages whatsoever or howsoever caused arising directly or indirectly inconnection with or arising out of the use of this material.
Footwear ScienceVol. 4, No. 2, June 2012, 101–114
Walking in an unstable Masai Barefoot Technology (MBT) shoe introduces kinematic andkinetic changes at the hip, knee and ankle before and after a 6-week accommodation period: a
comprehensive analysis using principal component analysis (PCA)
Scott C. Landrya*, Benno M. Niggb and Karelia E. Tecanteb
aSchool of Recreation Management and Kinesiology, Acadia University, Wolfville, Nova Scotia, Canada;bFaculty of Kinesiology, University of Calgary, Calgary, Alberta, Canada
(Received 17 October 2011; final version received 5 April 2012)
Background: Scientific and anecdotal evidence suggests that some individuals who wear the unstable MasaiBarefoot Technology (MBT) shoe experience a reduction in back and joint pain. A more comprehensivebiomechanical gait analysis is needed to better understand the mechanisms for symptom relief and what the long-term implications of wearing these shoes might be on the body.Objective: The aim of this study was to determine the gait changes introduced at the hip, knee and ankle beforeand after wearing an unstable MBT shoe for a 6-week accommodation period.Methods: Three-dimensional joint angles and moments were measured for 23 healthy individuals while walking inan unstable MBT shoe and a stable control shoe, both before and after a 6-week accommodation period ofwearing the unstable shoe at their workplace. Principal component analysis (PCA) was used on the stance phasewaveforms to identify differences between the two shoes and two testing sessions.Results: Joint angle and moment differences between the two shoe conditions were identified both before andafter wearing the unstable shoe for the accommodation period. Notable kinematic changes included reduced hipflexion–extension and ankle adduction–abduction range of motion, increased early stance dorsiflexion andincreased knee internal rotation for unstable shoe walking. Ankle moments tended to be greater for the unstableshoe and at the hip and knee, both increases and decreases in moments were observed.Conclusions: While many of the identified changes agree with previous research, this is the first study to reportincreases in some joint moments for the unstable MBT shoe. These increases along with other notable changesdo, however, require further investigation to better understand the long-term implications of the unstable MBTshoe.
Keywords: Joint angles; joint moments; unstable MBT shoe; principal component analysis (PCA); lowerextremity; musculoskeletal loading; walking
1. Introduction
Minimalist shoes and other shoes that have beendesigned to mimic a specific aspect of barefoot walkinghave become increasingly popular, particularly overthe past 5 years. Originating in Switzerland in 1996, theunstable Masai Barefoot Technology (MBT) shoe canbe considered the original ‘barefoot’ functional shoe,and of these functional shoes, the MBT has been themost extensively studied shoe in the peer-reviewedliterature (Romkes et al. 2006, Nigg et al. 2006a, 2009,2010, Stewart et al. 2007, Ramstrand et al. 2008, Boyerand Andriacchi 2009, Landry et al. 2010, Ramstrandet al. 2010, Stoggl et al. 2010, Buchecker et al. 2010).Scientific and anecdotal evidence, as well as personaltestimonials, exist to support the notion that theunstable MBT shoe is effective at relieving joint pain
and helping to reduce and/or manage lower limb orback injuries (Nigg et al. 2006b, 2009).
Four peer-reviewed studies have specificallyaddressed the kinematic and kinetic changes intro-duced by the unstable MBT shoe in comparison to astable control shoe for walking (Romkes et al. 2006,Nigg et al. 2006a, Stoggl et al. 2010, Buchecker et al.2010), with only one study making similar comparisonsfor running (Boyer and Andriacchi 2009). The walkingcomparative studies have all used relatively smallsample sizes (8–12 subjects) and only two of thesestudies have addressed joint kinetic or moment differ-ences (Nigg et al. 2006a, Buchecker et al. 2010). Nigget al. (2006a) found no statistically significant differ-ences in joint moment impulses for the hip, knee andankle; however, trends related to a slight reduction in
*Corresponding author. Email: [email protected]
ISSN 1942–4280 print/ISSN 1942–4299 online
! 2012 Taylor & Francishttp://dx.doi.org/10.1080/19424280.2012.684448http://www.tandfonline.com
Dow
nloa
ded
by [U
nive
rsity
of C
alga
ry] a
t 07:
35 2
2 M
ay 2
012
hip and knee moments were reported. It was also notedthat the MBT shoe showed a trend towards a moreinverted ankle moment compared to the stable controlshoe. Buchecker et al. (2010) compared lower extremityjoint loadings in overweight males using MBT shoesand a stable control shoe and concluded that walkingin the unstable MBT shoe reduced the first peak in theknee adduction moment. It was also reported thatthere were no statistical differences at the hip and anklefor other kinetic variables analysed.
Addressing the influence on joint kinematics, theunstable MBT shoe has its greatest effect at the anklejoint, with both Nigg et al. (2006a) and Romkes et al.(2006) reporting an increased dorsiflexion angle duringthe first half of stance. Nigg et al. (2006a) had theirsubjects walk at a preselected speed (5.0! 0.5 km/h)for both footwear conditions and found no othersignificant differences in lower extremity joint kine-matics. Romkes et al. (2006), however, identifieddifferences at the hip and knee, with walking in theunstable MBT shoe leading to smaller ranges ofmotion in the sagittal plane and smaller peak flexionangles at both the hip and knee, along with smallerpeak hip extension angles in comparison to walking inthe stable control shoe. A plausible explanation for thedifferent findings at the hip and knee between the twostudies could be because Romkes et al. (2006) had theirsubjects walk in the unstable MBT shoe and stablecontrol shoe at self-selected speeds, leading to signif-icantly reduced speeds for the unstable MBT shoe.
To better understand the long-term implicationsthat unstable MBT footwear can have on the body andhow these shoes may or may not help to alleviatedifferent ailments, more comprehensive biomechanicalanalyses are required. The multivariate analysis tech-nique of principal component analysis (PCA) has beenused effectively to compare gait waveforms, particu-larly over the past decade (Deluzio et al. 1997, Landryet al. 2007a, b, McKean et al. 2007, Rutherford et al.2008). The PCA technique was shown to haveincreased sensitivity over the more traditional para-meter-based analysis method of capturing differencesin biomechanical data (Wrigley et al. 2005). It isexpected that the application of this highly sensitivePCA technique to a relatively large group of individ-uals walking in the unstable MBT shoe could lead tothe identification of kinematic and kinetic featuresunique to the unstable shoe that may not have beenpreviously reported in other studies using smallersample sizes (Nigg et al. 2006a, Romkes et al. 2006,Stoggl et al. 2010, Buchecker et al. 2010).
The purpose of this study was to have a largersample size of individuals (compared to the previousstudies mentioned above) wear the unstable MBT shoe
at their workplace for a 6-week accommodation periodand determine whether immediate and more long-termdifferences in lower extremity joint angles (kinematics)and moments (kinetics) could be identified between theunstable MBT shoe and a more conventional stablecontrol shoe. The following hypotheses were tested:
H1: The most pronounced kinematic and kineticchanges introduced by walking in the unstable MBTshoe will be at the ankle joint, with magnitudes beingboth reduced and increased for the unstable MBT shoedepending on the phase of stance and anatomicalplane.
H2: Walking in the unstable MBT shoe will introduceless pronounced kinematic and kinetic changes at thehip and knee, with magnitudes being primarily reducedfor the unstable MBT shoe.
H3: For the majority of the kinematic and kinetic gaitmeasures, the immediate changes introduced by theunstable MBT shoe at the pre-accommodation testingsession will continue to exist after the 6-week accom-modation period.
2. Method
2.1. Subjects
Twenty-three subjects (16 females and seven males)participated in this study, with the mean age, heightand mass being 52.4! 7.8 (SD) years, 165.2! 7.2 cmand 80.0! 15.4 kg, respectively. The study wasapproved by the University of Calgary’s Office ofMedical Bioethics and all subjects provided informedconsent. Each of the 23 subjects had to meet thefollowing inclusion criteria: (i) no previous experiencewearing unstable shoes, (ii) able to wear the unstableshoe for a minimum of 30 h/week at their workplace,which involved mostly walking or standing, (iii)between 40 and 70 years of age, (iv) no lower extremityinjury or major pain in the previous 6 months, (v) noprevious major surgery to lower extremity or back, (vi)no evidence of arthritis, diabetes or neuromuscularcondition, and (vii) no regular exercise routine for thelower legs.
2.2. Testing protocol and analysis
A comprehensive three-dimensional gait analysis wasperformed on all subjects, for two footwear conditionsand for two visits spaced 6 weeks apart, at the HumanPerformance Laboratory (HPL) in the Faculty ofKinesiology at the University of Calgary (Calgary,Canada). For both testing visits, subjects had their gaitmeasured while walking in an unstable MBT shoe andin a more conventional stable control shoe. The stablecontrol shoe was considered to be the shoe that the
102 S.C. Landry et al.
Dow
nloa
ded
by [U
nive
rsity
of C
alga
ry] a
t 07:
35 2
2 M
ay 2
012

subject normally wore at work prior to the study andthe unstable MBT shoe (M. Walk model, MasaiBarefoot Technologies, Switzerland) had a roundedsole in the anterior–posterior direction that createdanterior–posterior instabilities and a soft cushioningheel pad that provided a degree of medial–lateralinstability. During the initial visit to the laboratory andbefore making any measurements, subjects wereinstructed on how to properly stand and walk in theunstable MBT shoe and were then given approximately10min to get accustomed to the unstable nature of theshoe. After gait measurements were made for the firstvisit (pre-accommodation testing), subjects were askedto wear the unstable shoe for 1 h on the first day andgradually increase usage to 8 h/day by the end of thefirst week. After wearing the unstable MBT shoe for a6-week accommodation period, which included stand-ing/walking at their workplace for a minimum of 30 h/week (verified by a daily journal completed by thesubjects), subjects returned for a second visit (post-accommodation testing) to have their gait measured inboth footwear conditions.
The gait testing protocol was similar to thatperformed by Nigg et al. (2006a) on a smaller groupof individuals (n¼ 8) wearing the unstable MBT shoe.The pelvis and lower limb segments on the left side ofthe body were tracked by placing 13 reflective markerson the pelvis, thigh, shank and foot. A standing neutraltrial was collected with five additional reflectivemarkers placed on the medial and lateral malleoli,medial and lateral epicondyles and greater trochanterto establish anatomical segment coordinate systemsalong with hip, knee and ankle joint centres.
Subjects performed five walking trials in theunstable MBT shoe and five trials in the stable controlshoe, with the order being randomized between the twofootwear conditions for both visits. Kinetic data werecollected at 2400Hz with a Kistler force platform(Kistler Instrumente AG, Winterthur, Switzerland)and kinematic data were collected at 240Hz with aneight-camera motion capture system (Motion AnalysisCorporation, Santa Rosa, CA, USA). Infrared timinggates were used to guide the subjects to walk at1.5! 0.5m/s and only the stance phase for a singlestride for each trial was used for the analyses. Thecollected data were exported into Kintrak software(HPL, Calgary, Canada), with the kinematic andkinetic data being filtered using a zero-lag fourth-order low-pass Butterworth filter with cut-off frequen-cies of 12 and 50Hz, respectively (Nigg et al. 2006a,2010). For the hip, knee and ankle, three-dimensionaljoint angles were calculated using the joint coordinatesystem convention described by Grood and Suntay(1983) and internal joint moments, normalized to body
mass, were calculated with inverse dynamics using theanthropometric, ground reaction force and motiondata. Joint angle and moment waveforms were timenormalized to percentage stance and the subject’s fivetrials for each footwear condition were then ensembleaveraged to obtain a representative waveform for eachmeasure and for both visits.
PCA was applied to the ensemble average jointangle and moment waveform data. For each of thespecific waveform measures (e.g. knee abductionangle), a separate PCA was performed by first arrang-ing all the ensemble average waveforms for thatparticular gait measure [e.g. knee abduction anglewaveforms from all subjects for both shoe conditions(stable and unstable MBT shoe) and both visits (pre-and post-accommodation testing)] into a data matrix(n waveforms# 101 waveform data points representingeach percentage of stance). Described in detail byDeluzio et al. (1997), PCA takes the ensemble averagewaveforms for the specific analysis and subtractsthe mean value at every instant of time for each ofthe included waveforms. The covariance matrix of themean removed data set is calculated and an eignvectordecomposition of the covariance matrix identifiesprincipal patterns of variation that can be interpretedbiomechanically. These patterns of variation or bio-mechanical waveform features generally include over-all magnitudes, local magnitudes, phase shifts,amplitudes and other shape features. The biomechan-ical features are represented by the eigenvectors or PCsof the analysis and then each individual waveformreceives a PC score based on how similar the individualwaveforms are to the specific PC. The PC scores foreach individual group (control shoe pre-testing, unsta-ble MBT shoe pre-testing, control shoe post-testingand unstable MBT shoe post-testing) for a specificjoint measure were compared statistically in SPSSversion 18.0 (SPSS Inc., Chicago IL, USA) using a2# 2 two-way repeated-measures ANOVA to identifya shoe (stable control shoe versus unstable MBT shoe),visit (pre- versus post-accommodation testing) orinteraction effect. An ! level of p5 0.05 indicated astatistically significant difference and when an interac-tion effect was identified, Bonferroni-corrected pair-wise post-hoc comparisons were made between the twofootwear conditions and two visits.
3. Results
For the stance phase of the gait cycle, joint angle andnet internal joint moment group mean ensembleaverage waveforms are shown for the hip (Figure 1),knee (Figure 2) and ankle (Figure 3) for both footwear
Footwear Science 103
Dow
nloa
ded
by [U
nive
rsity
of C
alga
ry] a
t 07:
35 2
2 M
ay 2
012
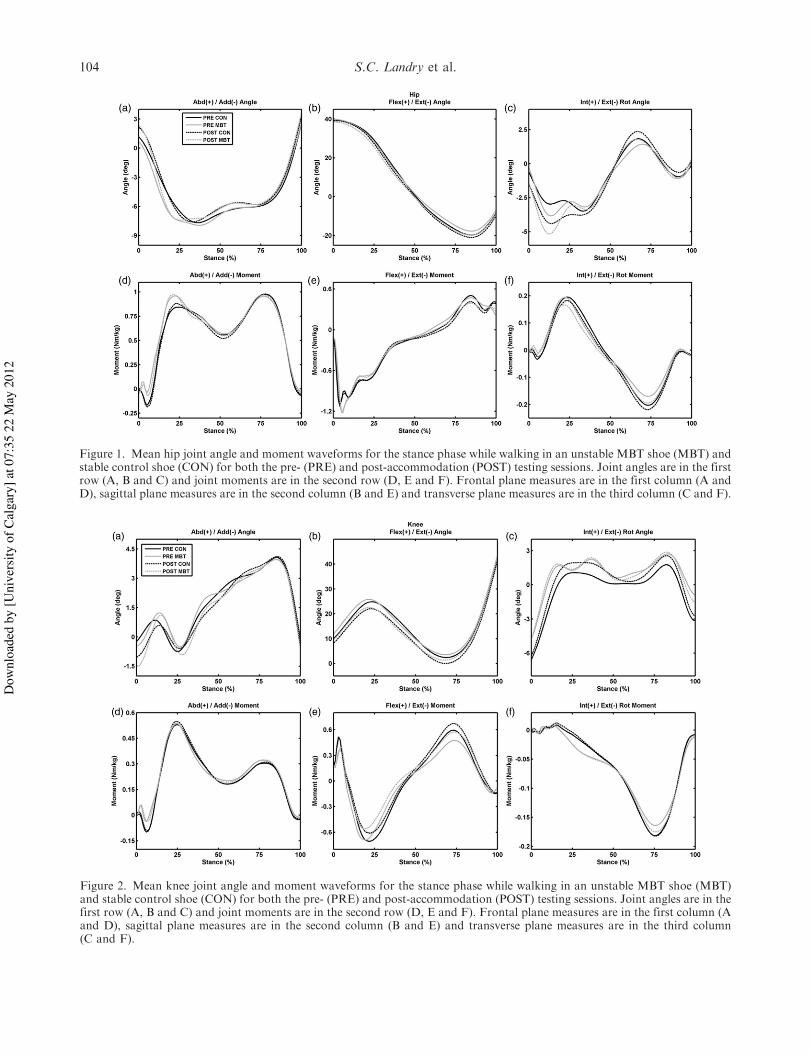
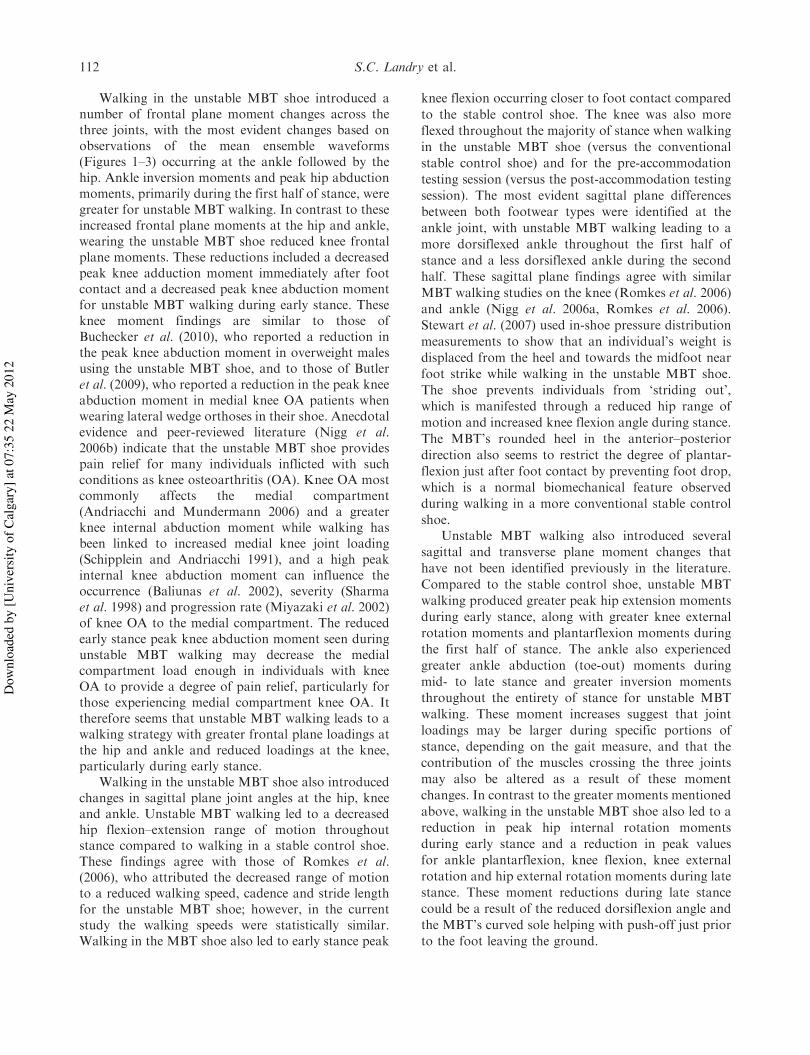
Figure 2. Mean knee joint angle and moment waveforms for the stance phase while walking in an unstable MBT shoe (MBT)and stable control shoe (CON) for both the pre- (PRE) and post-accommodation (POST) testing sessions. Joint angles are in thefirst row (A, B and C) and joint moments are in the second row (D, E and F). Frontal plane measures are in the first column (Aand D), sagittal plane measures are in the second column (B and E) and transverse plane measures are in the third column(C and F).
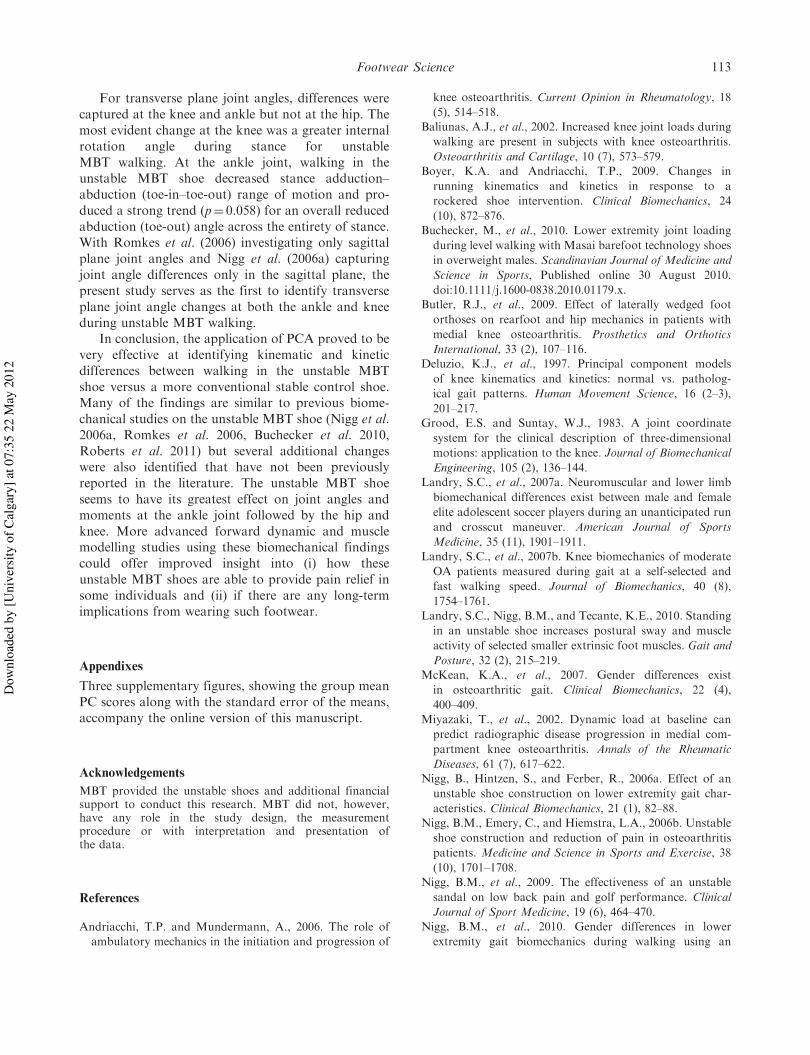
Figure 1. Mean hip joint angle and moment waveforms for the stance phase while walking in an unstable MBT shoe (MBT) andstable control shoe (CON) for both the pre- (PRE) and post-accommodation (POST) testing sessions. Joint angles are in the firstrow (A, B and C) and joint moments are in the second row (D, E and F). Frontal plane measures are in the first column (A andD), sagittal plane measures are in the second column (B and E) and transverse plane measures are in the third column (C and F).
104 S.C. Landry et al.
Dow
nloa
ded
by [U
nive
rsity
of C
alga
ry] a
t 07:
35 2
2 M
ay 2
012
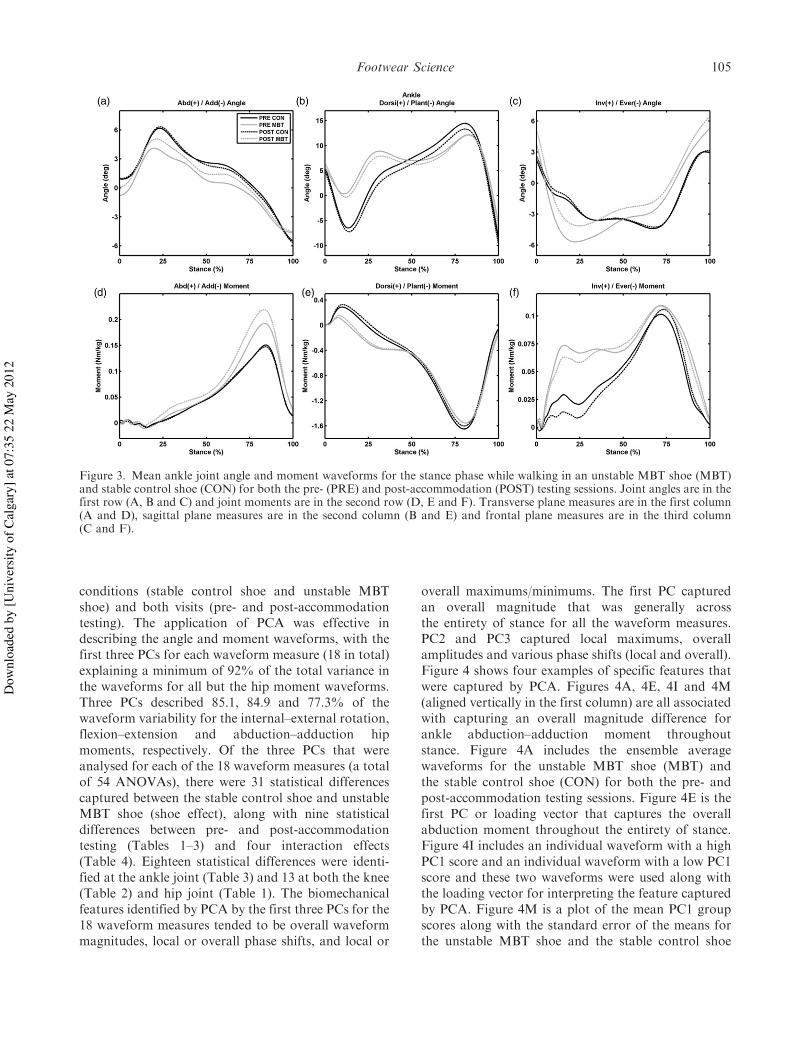
conditions (stable control shoe and unstable MBTshoe) and both visits (pre- and post-accommodationtesting). The application of PCA was effective indescribing the angle and moment waveforms, with thefirst three PCs for each waveform measure (18 in total)explaining a minimum of 92% of the total variance inthe waveforms for all but the hip moment waveforms.Three PCs described 85.1, 84.9 and 77.3% of thewaveform variability for the internal–external rotation,flexion–extension and abduction–adduction hipmoments, respectively. Of the three PCs that wereanalysed for each of the 18 waveform measures (a totalof 54 ANOVAs), there were 31 statistical differencescaptured between the stable control shoe and unstableMBT shoe (shoe effect), along with nine statisticaldifferences between pre- and post-accommodationtesting (Tables 1–3) and four interaction effects(Table 4). Eighteen statistical differences were identi-fied at the ankle joint (Table 3) and 13 at both the knee(Table 2) and hip joint (Table 1). The biomechanicalfeatures identified by PCA by the first three PCs for the18 waveform measures tended to be overall waveformmagnitudes, local or overall phase shifts, and local or
overall maximums/minimums. The first PC capturedan overall magnitude that was generally acrossthe entirety of stance for all the waveform measures.PC2 and PC3 captured local maximums, overallamplitudes and various phase shifts (local and overall).Figure 4 shows four examples of specific features thatwere captured by PCA. Figures 4A, 4E, 4I and 4M(aligned vertically in the first column) are all associatedwith capturing an overall magnitude difference forankle abduction–adduction moment throughoutstance. Figure 4A includes the ensemble averagewaveforms for the unstable MBT shoe (MBT) andthe stable control shoe (CON) for both the pre- andpost-accommodation testing sessions. Figure 4E is thefirst PC or loading vector that captures the overallabduction moment throughout the entirety of stance.Figure 4I includes an individual waveform with a highPC1 score and an individual waveform with a low PC1score and these two waveforms were used along withthe loading vector for interpreting the feature capturedby PCA. Figure 4M is a plot of the mean PC1 groupscores along with the standard error of the means forthe unstable MBT shoe and the stable control shoe
Figure 3. Mean ankle joint angle and moment waveforms for the stance phase while walking in an unstable MBT shoe (MBT)and stable control shoe (CON) for both the pre- (PRE) and post-accommodation (POST) testing sessions. Joint angles are in thefirst row (A, B and C) and joint moments are in the second row (D, E and F). Transverse plane measures are in the first column(A and D), sagittal plane measures are in the second column (B and E) and frontal plane measures are in the third column(C and F).
Footwear Science 105
Dow
nloa
ded
by [U
nive
rsity
of C
alga
ry] a
t 07:
35 2
2 M
ay 2
012
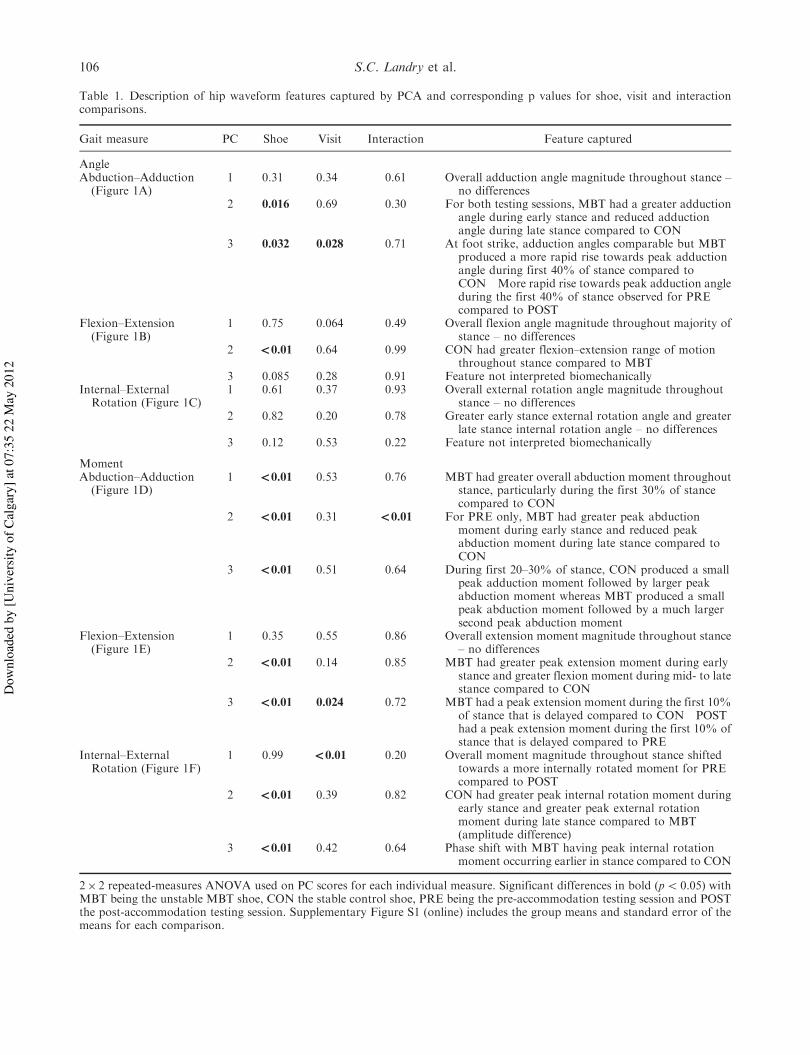
Table 1. Description of hip waveform features captured by PCA and corresponding p values for shoe, visit and interactioncomparisons.
Gait measure PC Shoe Visit Interaction Feature captured
AngleAbduction–Adduction(Figure 1A)
1 0.31 0.34 0.61 Overall adduction angle magnitude throughout stance –no differences
2 0.016 0.69 0.30 For both testing sessions, MBT had a greater adductionangle during early stance and reduced adductionangle during late stance compared to CON
3 0.032 0.028 0.71 At foot strike, adduction angles comparable but MBTproduced a more rapid rise towards peak adductionangle during first 40% of stance compared toCON More rapid rise towards peak adduction angleduring the first 40% of stance observed for PREcompared to POST
Flexion–Extension(Figure 1B)
1 0.75 0.064 0.49 Overall flexion angle magnitude throughout majority ofstance – no differences
2 _0.01 0.64 0.99 CON had greater flexion–extension range of motionthroughout stance compared to MBT
3 0.085 0.28 0.91 Feature not interpreted biomechanicallyInternal–ExternalRotation (Figure 1C)
1 0.61 0.37 0.93 Overall external rotation angle magnitude throughoutstance – no differences
2 0.82 0.20 0.78 Greater early stance external rotation angle and greaterlate stance internal rotation angle – no differences
3 0.12 0.53 0.22 Feature not interpreted biomechanically
MomentAbduction–Adduction(Figure 1D)
1 _0.01 0.53 0.76 MBT had greater overall abduction moment throughoutstance, particularly during the first 30% of stancecompared to CON
2 _0.01 0.31 _0.01 For PRE only, MBT had greater peak abductionmoment during early stance and reduced peakabduction moment during late stance compared toCON
3 _0.01 0.51 0.64 During first 20–30% of stance, CON produced a smallpeak adduction moment followed by larger peakabduction moment whereas MBT produced a smallpeak abduction moment followed by a much largersecond peak abduction moment
Flexion–Extension(Figure 1E)
1 0.35 0.55 0.86 Overall extension moment magnitude throughout stance– no differences
2 _0.01 0.14 0.85 MBT had greater peak extension moment during earlystance and greater flexion moment during mid- to latestance compared to CON
3 _0.01 0.024 0.72 MBT had a peak extension moment during the first 10%of stance that is delayed compared to CON POSThad a peak extension moment during the first 10% ofstance that is delayed compared to PRE
Internal–ExternalRotation (Figure 1F)
1 0.99 _0.01 0.20 Overall moment magnitude throughout stance shiftedtowards a more internally rotated moment for PREcompared to POST
2 _0.01 0.39 0.82 CON had greater peak internal rotation moment duringearly stance and greater peak external rotationmoment during late stance compared to MBT(amplitude difference)
3 _0.01 0.42 0.64 Phase shift with MBT having peak internal rotationmoment occurring earlier in stance compared to CON
2# 2 repeated-measures ANOVA used on PC scores for each individual measure. Significant differences in bold (p5 0.05) withMBT being the unstable MBT shoe, CON the stable control shoe, PRE being the pre-accommodation testing session and POSTthe post-accommodation testing session. Supplementary Figure S1 (online) includes the group means and standard error of themeans for each comparison.
106 S.C. Landry et al.
Dow
nloa
ded
by [U
nive
rsity
of C
alga
ry] a
t 07:
35 2
2 M
ay 2
012

groups for both the pre- and post-accommodationtesting sessions. The second column of Figure 4describes a feature captured by PC2 for knee inter-nal–external rotation moment, with the MBT shoehaving a greater external rotation moment during earlystance and a reduced external rotation moment duringlate stance compared to the stable control shoe. The
third column of Figure 4 describes a difference in therange of motion between the two types of footwearcaptured by PC2 for hip flexion–extension anglethroughout stance. Finally, the fourth column ofFigure 4 describes a phase shift between the unstableMBT shoe and the stable control shoe captured by PC3for hip internal–external rotation moment, with the
Table 2. Description of knee waveform features captured by PCA and corresponding p values for shoe, visit and interactioncomparisons.
Gait measure PC Shoe Visit Interaction Feature captured
AngleAbduction–Adduction(Figure 2A)
1 1.00 0.63 0.61 Overall abduction angle magnitude throughout stance –no differences
2 0.73 0.25 0.12 Feature not interpreted biomechanically3 0.32 0.70 0.17 Feature not interpreted biomechanically
Flexion–Extension(Figure 2B)
1 0.024 _0.01 0.89 MBT had greater overall flexion angle throughoutmajority of stance compared to CON PRE hadgreater overall flexion angle throughout majority ofstance compared to POST
2 _0.01 0.93 0.16 Captured phase shift with PC3MBT had greater flexion angle compared to CON,
particularly during mid-stance3 _0.01 0.71 0.055 MBT had greater flexion angle during early stance and
reduced flexion angle during mid-stance compared toCON
Internal–ExternalRotation (Figure 2C)
1 0.025 0.45 0.30 MBT had greater overall internal rotation anglethroughout stance compared to CON
2 0.084 0.87 0.10 Feature not interpreted biomechanically3 0.014 0.72 0.65 MBT had bimodal internal rotation angle peaks
between 10% and 35% of stance whereas CON has asingle peak during the same period
MomentAbduction–Adduction(Figure 2D)
1 0.37 0.79 0.47 Overall abduction moment magnitude throughoutstance – no differences
2 0.030 0.72 0.62 CON had greater adduction moment during the first10% of stance, greater abduction moment duringearly stance and reduced abduction moment duringlate stance compared to MBT
3 _0.01 0.94 0.81 CON had greater adduction moment during early stancefollowed by greater abduction moment from early tomid-stance compared to MBT
Flexion–Extension(Figure 2E)
1 0.34 _0.01 0.21 PRE had overall moment magnitude shifted towardsextension compared to POST for duration of stance
2 _0.01 _0.01 0.98 CON had greater flexion moment during last half ofstance compared to MBT POST had greater flexionmoment during last half of stance compared to PRE
3 _0.01 0.42 0.49 MBT had peak extension moment occurring sooner inearly stance compared to CON
Internal–ExternalRotation (Figure 2F)
1 0.17 0.37 0.07 Overall external rotation moment magnitude through-out stance – no differences
2 _0.01 0.28 0.56 MBT had greater external rotation moment during firsthalf of stance and reduced peak external rotationmoment during late stance compared to CON
3 0.16 0.61 0.84 Feature not interpreted biomechanically
2# 2 repeated-measures ANOVA used on PC scores for each individual measure. Significant differences in bold (p5 0.05) withMBT being the unstable MBT shoe, CON the stable control shoe, PRE being the pre-accommodation testing session and POSTthe post-accommodation testing session. Supplementary Figure S2 (online) includes the group means and standard error of themeans for each comparison.
Footwear Science 107
Dow
nloa
ded
by [U
nive
rsity
of C
alga
ry] a
t 07:
35 2
2 M
ay 2
012
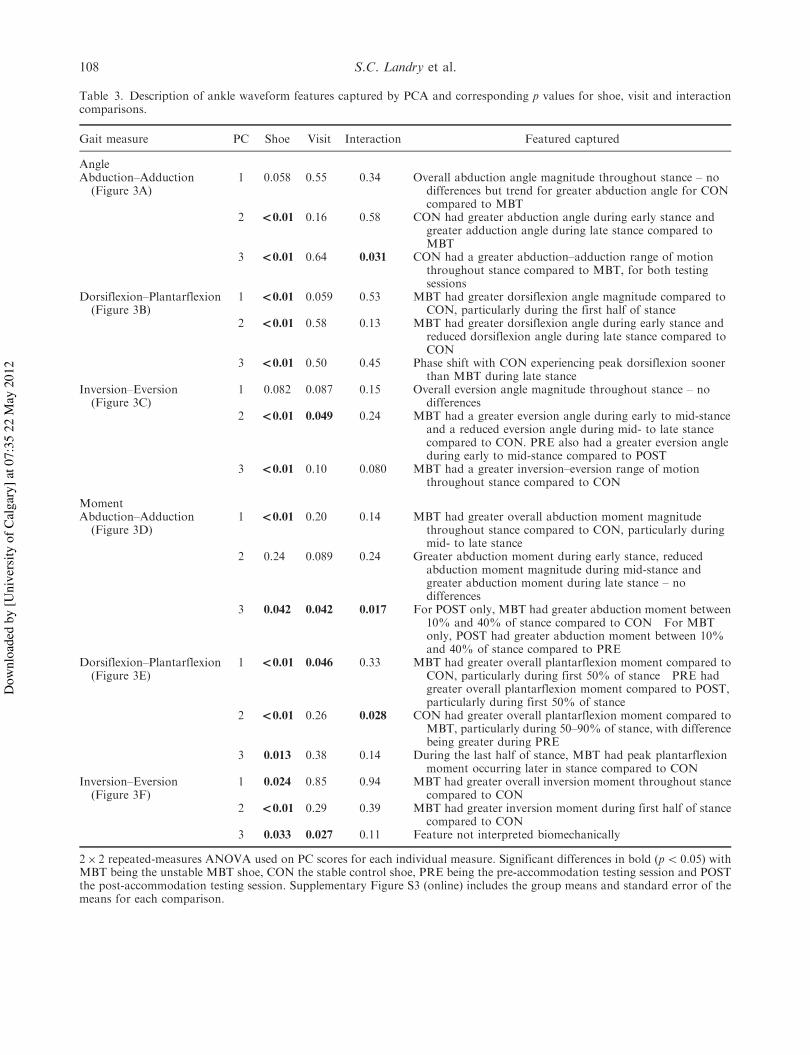
Table 3. Description of ankle waveform features captured by PCA and corresponding p values for shoe, visit and interactioncomparisons.
Gait measure PC Shoe Visit Interaction Featured captured
AngleAbduction–Adduction(Figure 3A)
1 0.058 0.55 0.34 Overall abduction angle magnitude throughout stance – nodifferences but trend for greater abduction angle for CONcompared to MBT
2 _0.01 0.16 0.58 CON had greater abduction angle during early stance andgreater adduction angle during late stance compared toMBT
3 _0.01 0.64 0.031 CON had a greater abduction–adduction range of motionthroughout stance compared to MBT, for both testingsessions
Dorsiflexion–Plantarflexion(Figure 3B)
1 _0.01 0.059 0.53 MBT had greater dorsiflexion angle magnitude compared toCON, particularly during the first half of stance
2 _0.01 0.58 0.13 MBT had greater dorsiflexion angle during early stance andreduced dorsiflexion angle during late stance compared toCON
3 _0.01 0.50 0.45 Phase shift with CON experiencing peak dorsiflexion soonerthan MBT during late stance
Inversion–Eversion(Figure 3C)
1 0.082 0.087 0.15 Overall eversion angle magnitude throughout stance – nodifferences
2 _0.01 0.049 0.24 MBT had a greater eversion angle during early to mid-stanceand a reduced eversion angle during mid- to late stancecompared to CON. PRE also had a greater eversion angleduring early to mid-stance compared to POST
3 _0.01 0.10 0.080 MBT had a greater inversion–eversion range of motionthroughout stance compared to CON
MomentAbduction–Adduction(Figure 3D)
1 _0.01 0.20 0.14 MBT had greater overall abduction moment magnitudethroughout stance compared to CON, particularly duringmid- to late stance
2 0.24 0.089 0.24 Greater abduction moment during early stance, reducedabduction moment magnitude during mid-stance andgreater abduction moment during late stance – nodifferences
3 0.042 0.042 0.017 For POST only, MBT had greater abduction moment between10% and 40% of stance compared to CON For MBTonly, POST had greater abduction moment between 10%and 40% of stance compared to PRE
Dorsiflexion–Plantarflexion(Figure 3E)
1 _0.01 0.046 0.33 MBT had greater overall plantarflexion moment compared toCON, particularly during first 50% of stance PRE hadgreater overall plantarflexion moment compared to POST,particularly during first 50% of stance
2 _0.01 0.26 0.028 CON had greater overall plantarflexion moment compared toMBT, particularly during 50–90% of stance, with differencebeing greater during PRE
3 0.013 0.38 0.14 During the last half of stance, MBT had peak plantarflexionmoment occurring later in stance compared to CON
Inversion–Eversion(Figure 3F)
1 0.024 0.85 0.94 MBT had greater overall inversion moment throughout stancecompared to CON
2 _0.01 0.29 0.39 MBT had greater inversion moment during first half of stancecompared to CON
3 0.033 0.027 0.11 Feature not interpreted biomechanically
2# 2 repeated-measures ANOVA used on PC scores for each individual measure. Significant differences in bold (p5 0.05) withMBT being the unstable MBT shoe, CON the stable control shoe, PRE being the pre-accommodation testing session and POSTthe post-accommodation testing session. Supplementary Figure S3 (online) includes the group means and standard error of themeans for each comparison.
108 S.C. Landry et al.
Dow
nloa
ded
by [U
nive
rsity
of C
alga
ry] a
t 07:
35 2
2 M
ay 2
012
internal rotation moment peaking earlier in stance forthe unstable MBT shoe. The angle and moment groupmean PC scores and corresponding standard error ofthe means (interaction plots) for all comparisons inTables 1–3 are presented in three supplementaryfigures (Figures S1–S3) accompanying the onlineversion of this manuscript.
3.1. Hip angles and moments
For all three hip joint angle measures, there were nooverall magnitude differences spanning the entirety ofstance (PC1 for all three angles) detected between thestable control shoe and the unstable MBT shoe, forboth the pre- and post-accommodation testing sessions(Table 1). Differences in hip adduction angle duringearly stance (shoe effect for PC2 and PC3, Figure 1Aand Table 1) and hip flexion–extension range ofmotion (shoe effect for PC2, Figure 1B and Table 1)were identified between the two shoes for both visits.Figures 4C, 4G, 4K and 4O more clearly demonstratethe reduced hip flexion–extension amplitude or rangeof motion while walking in the unstable MBT shoecompared to the stable control shoe for both testingsessions.
Both large and more subtle moment differenceswere also captured at the hip joint. The abduction–adduction moment was the only moment at the hipthat demonstrated a difference between the two shoes(shoe effect for PC1) throughout the majority ofstance, with this difference being most evident duringthe first 30% of stance (Figure 1D and Table 1). Moresubtle differences (local differences or phase shifts)between the unstable MBT shoe and the stable controlshoe were also captured by PC2 and PC3 for each ofthe three hip moments. These differences are clearlydescribed in Table 1 and can be seen in Figures 1D, 1Eand 1F. The only interaction effect at the hip was forthe hip abduction–adduction moment, with Bonferronicorrected pairwise comparisons demonstrating that the
unstable MBT shoe had a greater peak abductionmoment during early stance and reduced peak abduc-tion moment during late stance compared to the stablecontrol shoe for the pre-accommodation testing sessiononly (PC2, Figure 1D and Tables 1 and 4). Differencesbetween the pre- and post-accommodation testingsessions were also identified for the hip flexion–extension moment (visit effect for PC3, Figure 1Eand Table 1) and hip internal–external rotationmoment (visit effect for PC1, Figure 1F and Table 1).
3.2. Knee angles and moments
No differences between footwear conditions or visitswere identified for the knee abduction–adduction angle(Figure 2A and Table 2). Differences in knee flexion–extension (shoe effect for PC1, PC2 and PC3) andinternal–external rotation angles (shoe effect for PC1and PC3) were captured between the unstable MBTshoe and the stable control shoe for both visits (Figures2B and 2C and Table 2). The only knee angledifference when comparing testing sessions was agreater overall knee flexion angle throughout themajority of stance for the pre- versus the post-accommodation testing session (visit effect for PC1,Figure 2B and Table 2).
PC1 captured an overall moment magnitudethroughout the entirety of stance for each of thethree knee moments; however, differences related tothis feature were not identified between the twofootwear conditions (no shoe effect, Figures 2D, 2E,2F and Table 2). Related to PC1 or the overall momentmagnitude feature, the only knee moment differencewas between testing sessions with the knee momentbeing shifted more towards extension throughout theentirety of stance for the pre- versus post-accommoda-tion testing session (visit effect for PC1, Figure 2E andTable 2). This was also seen as a reduced knee flexionmoment during the last half of stance for the pre-accommodation testing session (visit effect for PC2,
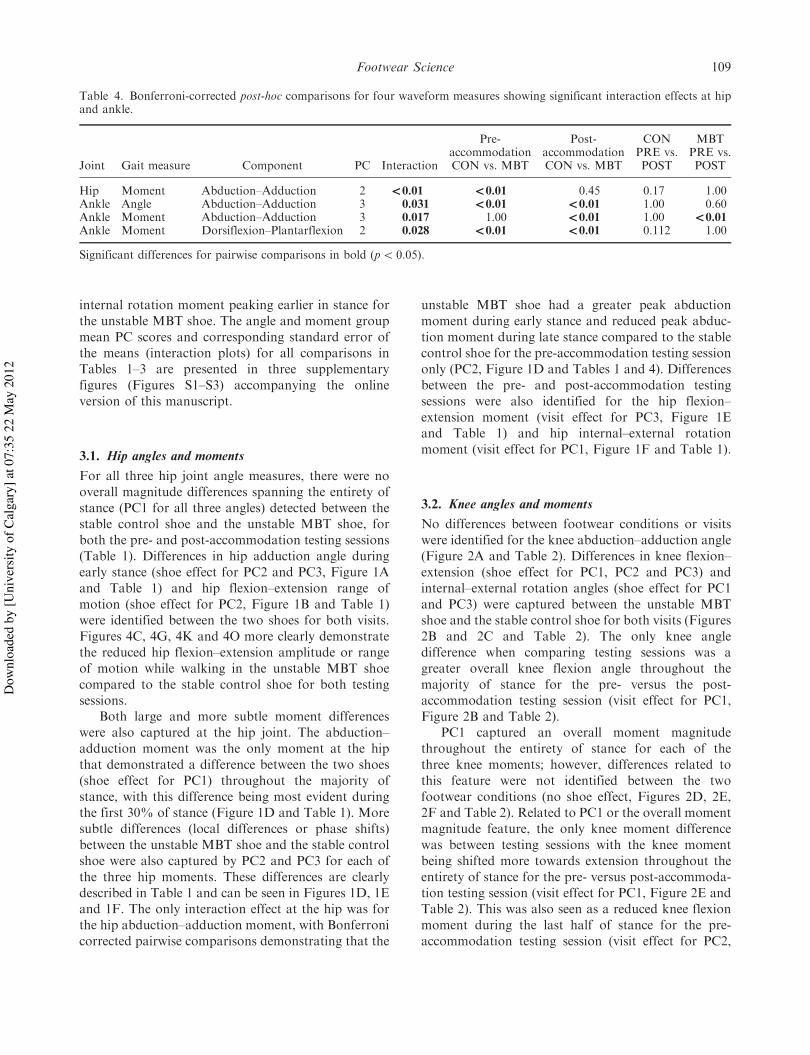
Table 4. Bonferroni-corrected post-hoc comparisons for four waveform measures showing significant interaction effects at hipand ankle.
Joint Gait measure Component PC Interaction
Pre-accommodationCON vs. MBT
Post-accommodationCON vs. MBT
CONPRE vs.POST
MBTPRE vs.POST
Hip Moment Abduction–Adduction 2 _0.01 _0.01 0.45 0.17 1.00Ankle Angle Abduction–Adduction 3 0.031 _0.01 _0.01 1.00 0.60Ankle Moment Abduction–Adduction 3 0.017 1.00 _0.01 1.00 _0.01Ankle Moment Dorsiflexion–Plantarflexion 2 0.028 _0.01 _0.01 0.112 1.00
Significant differences for pairwise comparisons in bold (p5 0.05).
Footwear Science 109
Dow
nloa
ded
by [U
nive
rsity
of C
alga
ry] a
t 07:
35 2
2 M
ay 2
012

Figure
4.Meanwav
eform
sforthestan
cephaseofwalking(first
row:A,B,C
andD),PC
orload
ingvectorwav
eform
s(secondrow:E,F,G
andH),highan
dlow
PC
score
wav
eform
s(thirdrow:I,J,K
andL)an
dPCscore
meanswithstan
darderrorofthemeans(fourthrow:M,N,O
andP)forfourrepresentative
exam
ples.Thefirst
columnrepresentswav
eform
san
dan
alysed
dataforan
kleab
duction–a
dductionan
gles,thesecondcolumnrepresentsknee
internal–external
rotationmoments,thethird
columnrepresents
hip
flexion–extensionan
gles
andthefourthcolumnrepresents
hip
internal–external
rotationmoments.
110 S.C. Landry et al.
Dow
nloa
ded
by [U
nive
rsity
of C
alga
ry] a
t 07:
35 2
2 M
ay 2
012
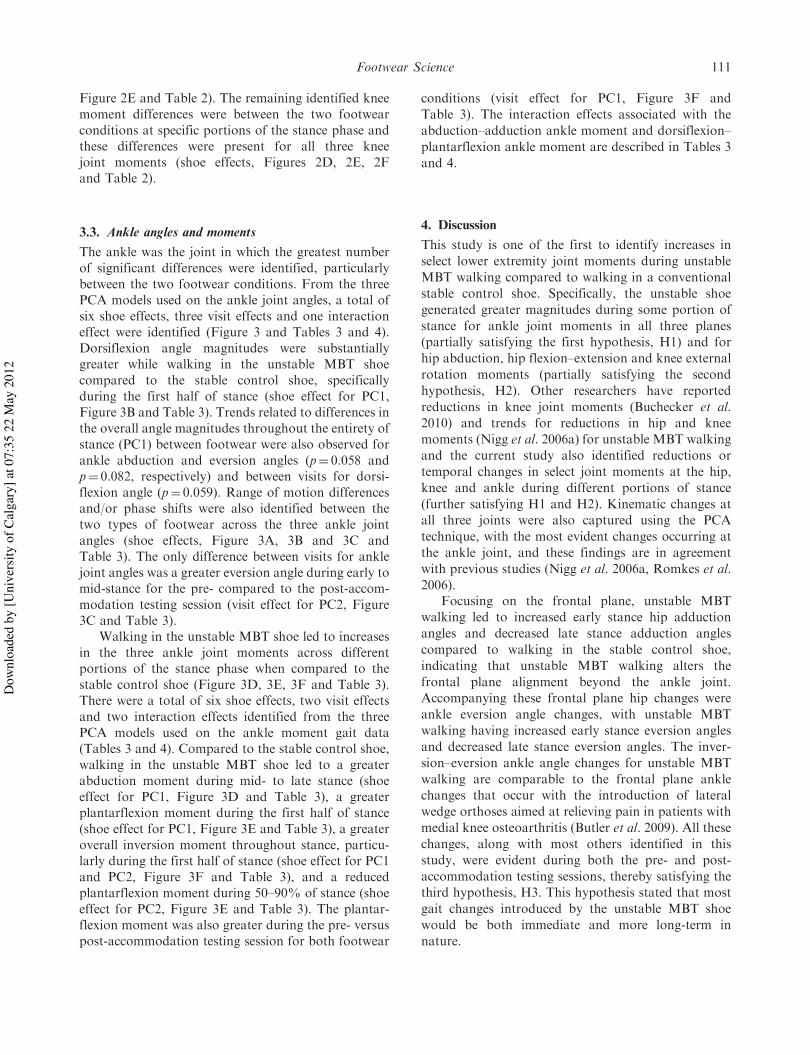
Figure 2E and Table 2). The remaining identified kneemoment differences were between the two footwearconditions at specific portions of the stance phase andthese differences were present for all three kneejoint moments (shoe effects, Figures 2D, 2E, 2Fand Table 2).
3.3. Ankle angles and moments
The ankle was the joint in which the greatest numberof significant differences were identified, particularlybetween the two footwear conditions. From the threePCA models used on the ankle joint angles, a total ofsix shoe effects, three visit effects and one interactioneffect were identified (Figure 3 and Tables 3 and 4).Dorsiflexion angle magnitudes were substantiallygreater while walking in the unstable MBT shoecompared to the stable control shoe, specificallyduring the first half of stance (shoe effect for PC1,Figure 3B and Table 3). Trends related to differences inthe overall angle magnitudes throughout the entirety ofstance (PC1) between footwear were also observed forankle abduction and eversion angles (p¼ 0.058 andp¼ 0.082, respectively) and between visits for dorsi-flexion angle (p¼ 0.059). Range of motion differencesand/or phase shifts were also identified between thetwo types of footwear across the three ankle jointangles (shoe effects, Figure 3A, 3B and 3C andTable 3). The only difference between visits for anklejoint angles was a greater eversion angle during early tomid-stance for the pre- compared to the post-accom-modation testing session (visit effect for PC2, Figure3C and Table 3).
Walking in the unstable MBT shoe led to increasesin the three ankle joint moments across differentportions of the stance phase when compared to thestable control shoe (Figure 3D, 3E, 3F and Table 3).There were a total of six shoe effects, two visit effectsand two interaction effects identified from the threePCA models used on the ankle moment gait data(Tables 3 and 4). Compared to the stable control shoe,walking in the unstable MBT shoe led to a greaterabduction moment during mid- to late stance (shoeeffect for PC1, Figure 3D and Table 3), a greaterplantarflexion moment during the first half of stance(shoe effect for PC1, Figure 3E and Table 3), a greateroverall inversion moment throughout stance, particu-larly during the first half of stance (shoe effect for PC1and PC2, Figure 3F and Table 3), and a reducedplantarflexion moment during 50–90% of stance (shoeeffect for PC2, Figure 3E and Table 3). The plantar-flexion moment was also greater during the pre- versuspost-accommodation testing session for both footwear
conditions (visit effect for PC1, Figure 3F andTable 3). The interaction effects associated with theabduction–adduction ankle moment and dorsiflexion–plantarflexion ankle moment are described in Tables 3and 4.
4. Discussion
This study is one of the first to identify increases inselect lower extremity joint moments during unstableMBT walking compared to walking in a conventionalstable control shoe. Specifically, the unstable shoegenerated greater magnitudes during some portion ofstance for ankle joint moments in all three planes(partially satisfying the first hypothesis, H1) and forhip abduction, hip flexion–extension and knee externalrotation moments (partially satisfying the secondhypothesis, H2). Other researchers have reportedreductions in knee joint moments (Buchecker et al.2010) and trends for reductions in hip and kneemoments (Nigg et al. 2006a) for unstable MBT walkingand the current study also identified reductions ortemporal changes in select joint moments at the hip,knee and ankle during different portions of stance(further satisfying H1 and H2). Kinematic changes atall three joints were also captured using the PCAtechnique, with the most evident changes occurring atthe ankle joint, and these findings are in agreementwith previous studies (Nigg et al. 2006a, Romkes et al.2006).
Focusing on the frontal plane, unstable MBTwalking led to increased early stance hip adductionangles and decreased late stance adduction anglescompared to walking in the stable control shoe,indicating that unstable MBT walking alters thefrontal plane alignment beyond the ankle joint.Accompanying these frontal plane hip changes wereankle eversion angle changes, with unstable MBTwalking having increased early stance eversion anglesand decreased late stance eversion angles. The inver-sion–eversion ankle angle changes for unstable MBTwalking are comparable to the frontal plane anklechanges that occur with the introduction of lateralwedge orthoses aimed at relieving pain in patients withmedial knee osteoarthritis (Butler et al. 2009). All thesechanges, along with most others identified in thisstudy, were evident during both the pre- and post-accommodation testing sessions, thereby satisfying thethird hypothesis, H3. This hypothesis stated that mostgait changes introduced by the unstable MBT shoewould be both immediate and more long-term innature.
Footwear Science 111
Dow
nloa
ded
by [U
nive
rsity
of C
alga
ry] a
t 07:
35 2
2 M
ay 2
012
Walking in the unstable MBT shoe introduced anumber of frontal plane moment changes across thethree joints, with the most evident changes based onobservations of the mean ensemble waveforms(Figures 1–3) occurring at the ankle followed by thehip. Ankle inversion moments and peak hip abductionmoments, primarily during the first half of stance, weregreater for unstable MBT walking. In contrast to theseincreased frontal plane moments at the hip and ankle,wearing the unstable MBT shoe reduced knee frontalplane moments. These reductions included a decreasedpeak knee adduction moment immediately after footcontact and a decreased peak knee abduction momentfor unstable MBT walking during early stance. Theseknee moment findings are similar to those ofBuchecker et al. (2010), who reported a reduction inthe peak knee abduction moment in overweight malesusing the unstable MBT shoe, and to those of Butleret al. (2009), who reported a reduction in the peak kneeabduction moment in medial knee OA patients whenwearing lateral wedge orthoses in their shoe. Anecdotalevidence and peer-reviewed literature (Nigg et al.2006b) indicate that the unstable MBT shoe providespain relief for many individuals inflicted with suchconditions as knee osteoarthritis (OA). Knee OA mostcommonly affects the medial compartment(Andriacchi and Mundermann 2006) and a greaterknee internal abduction moment while walking hasbeen linked to increased medial knee joint loading(Schipplein and Andriacchi 1991), and a high peakinternal knee abduction moment can influence theoccurrence (Baliunas et al. 2002), severity (Sharmaet al. 1998) and progression rate (Miyazaki et al. 2002)of knee OA to the medial compartment. The reducedearly stance peak knee abduction moment seen duringunstable MBT walking may decrease the medialcompartment load enough in individuals with kneeOA to provide a degree of pain relief, particularly forthose experiencing medial compartment knee OA. Ittherefore seems that unstable MBT walking leads to awalking strategy with greater frontal plane loadings atthe hip and ankle and reduced loadings at the knee,particularly during early stance.
Walking in the unstable MBT shoe also introducedchanges in sagittal plane joint angles at the hip, kneeand ankle. Unstable MBT walking led to a decreasedhip flexion–extension range of motion throughoutstance compared to walking in a stable control shoe.These findings agree with those of Romkes et al.(2006), who attributed the decreased range of motionto a reduced walking speed, cadence and stride lengthfor the unstable MBT shoe; however, in the currentstudy the walking speeds were statistically similar.Walking in the MBT shoe also led to early stance peak
knee flexion occurring closer to foot contact comparedto the stable control shoe. The knee was also moreflexed throughout the majority of stance when walkingin the unstable MBT shoe (versus the conventionalstable control shoe) and for the pre-accommodationtesting session (versus the post-accommodation testingsession). The most evident sagittal plane differencesbetween both footwear types were identified at theankle joint, with unstable MBT walking leading to amore dorsiflexed ankle throughout the first half ofstance and a less dorsiflexed ankle during the secondhalf. These sagittal plane findings agree with similarMBT walking studies on the knee (Romkes et al. 2006)and ankle (Nigg et al. 2006a, Romkes et al. 2006).Stewart et al. (2007) used in-shoe pressure distributionmeasurements to show that an individual’s weight isdisplaced from the heel and towards the midfoot nearfoot strike while walking in the unstable MBT shoe.The shoe prevents individuals from ‘striding out’,which is manifested through a reduced hip range ofmotion and increased knee flexion angle during stance.The MBT’s rounded heel in the anterior–posteriordirection also seems to restrict the degree of plantar-flexion just after foot contact by preventing foot drop,which is a normal biomechanical feature observedduring walking in a more conventional stable controlshoe.
Unstable MBT walking also introduced severalsagittal and transverse plane moment changes thathave not been identified previously in the literature.Compared to the stable control shoe, unstable MBTwalking produced greater peak hip extension momentsduring early stance, along with greater knee externalrotation moments and plantarflexion moments duringthe first half of stance. The ankle also experiencedgreater ankle abduction (toe-out) moments duringmid- to late stance and greater inversion momentsthroughout the entirety of stance for unstable MBTwalking. These moment increases suggest that jointloadings may be larger during specific portions ofstance, depending on the gait measure, and that thecontribution of the muscles crossing the three jointsmay also be altered as a result of these momentchanges. In contrast to the greater moments mentionedabove, walking in the unstable MBT shoe also led to areduction in peak hip internal rotation momentsduring early stance and a reduction in peak valuesfor ankle plantarflexion, knee flexion, knee externalrotation and hip external rotation moments during latestance. These moment reductions during late stancecould be a result of the reduced dorsiflexion angle andthe MBT’s curved sole helping with push-off just priorto the foot leaving the ground.
112 S.C. Landry et al.
Dow
nloa
ded
by [U
nive
rsity
of C
alga
ry] a
t 07:
35 2
2 M
ay 2
012
For transverse plane joint angles, differences werecaptured at the knee and ankle but not at the hip. Themost evident change at the knee was a greater internalrotation angle during stance for unstableMBT walking. At the ankle joint, walking in theunstable MBT shoe decreased stance adduction–abduction (toe-in–toe-out) range of motion and pro-duced a strong trend (p¼ 0.058) for an overall reducedabduction (toe-out) angle across the entirety of stance.With Romkes et al. (2006) investigating only sagittalplane joint angles and Nigg et al. (2006a) capturingjoint angle differences only in the sagittal plane, thepresent study serves as the first to identify transverseplane joint angle changes at both the ankle and kneeduring unstable MBT walking.
In conclusion, the application of PCA proved to bevery effective at identifying kinematic and kineticdifferences between walking in the unstable MBTshoe versus a more conventional stable control shoe.Many of the findings are similar to previous biome-chanical studies on the unstable MBT shoe (Nigg et al.2006a, Romkes et al. 2006, Buchecker et al. 2010,Roberts et al. 2011) but several additional changeswere also identified that have not been previouslyreported in the literature. The unstable MBT shoeseems to have its greatest effect on joint angles andmoments at the ankle joint followed by the hip andknee. More advanced forward dynamic and musclemodelling studies using these biomechanical findingscould offer improved insight into (i) how theseunstable MBT shoes are able to provide pain relief insome individuals and (ii) if there are any long-termimplications from wearing such footwear.
Appendixes
Three supplementary figures, showing the group meanPC scores along with the standard error of the means,accompany the online version of this manuscript.
Acknowledgements
MBT provided the unstable shoes and additional financialsupport to conduct this research. MBT did not, however,have any role in the study design, the measurementprocedure or with interpretation and presentation ofthe data.
References
Andriacchi, T.P. and Mundermann, A., 2006. The role ofambulatory mechanics in the initiation and progression of
knee osteoarthritis. Current Opinion in Rheumatology, 18(5), 514–518.
Baliunas, A.J., et al., 2002. Increased knee joint loads duringwalking are present in subjects with knee osteoarthritis.Osteoarthritis and Cartilage, 10 (7), 573–579.
Boyer, K.A. and Andriacchi, T.P., 2009. Changes inrunning kinematics and kinetics in response to arockered shoe intervention. Clinical Biomechanics, 24(10), 872–876.
Buchecker, M., et al., 2010. Lower extremity joint loadingduring level walking with Masai barefoot technology shoesin overweight males. Scandinavian Journal of Medicine andScience in Sports, Published online 30 August 2010.doi:10.1111/j.1600-0838.2010.01179.x.
Butler, R.J., et al., 2009. Effect of laterally wedged footorthoses on rearfoot and hip mechanics in patients withmedial knee osteoarthritis. Prosthetics and OrthoticsInternational, 33 (2), 107–116.
Deluzio, K.J., et al., 1997. Principal component modelsof knee kinematics and kinetics: normal vs. patholog-ical gait patterns. Human Movement Science, 16 (2–3),201–217.
Grood, E.S. and Suntay, W.J., 1983. A joint coordinatesystem for the clinical description of three-dimensionalmotions: application to the knee. Journal of BiomechanicalEngineering, 105 (2), 136–144.
Landry, S.C., et al., 2007a. Neuromuscular and lower limbbiomechanical differences exist between male and femaleelite adolescent soccer players during an unanticipated runand crosscut maneuver. American Journal of SportsMedicine, 35 (11), 1901–1911.
Landry, S.C., et al., 2007b. Knee biomechanics of moderateOA patients measured during gait at a self-selected andfast walking speed. Journal of Biomechanics, 40 (8),1754–1761.
Landry, S.C., Nigg, B.M., and Tecante, K.E., 2010. Standingin an unstable shoe increases postural sway and muscleactivity of selected smaller extrinsic foot muscles. Gait andPosture, 32 (2), 215–219.
McKean, K.A., et al., 2007. Gender differences existin osteoarthritic gait. Clinical Biomechanics, 22 (4),400–409.
Miyazaki, T., et al., 2002. Dynamic load at baseline canpredict radiographic disease progression in medial com-partment knee osteoarthritis. Annals of the RheumaticDiseases, 61 (7), 617–622.
Nigg, B., Hintzen, S., and Ferber, R., 2006a. Effect of anunstable shoe construction on lower extremity gait char-acteristics. Clinical Biomechanics, 21 (1), 82–88.
Nigg, B.M., Emery, C., and Hiemstra, L.A., 2006b. Unstableshoe construction and reduction of pain in osteoarthritispatients. Medicine and Science in Sports and Exercise, 38(10), 1701–1708.
Nigg, B.M., et al., 2009. The effectiveness of an unstablesandal on low back pain and golf performance. ClinicalJournal of Sport Medicine, 19 (6), 464–470.
Nigg, B.M., et al., 2010. Gender differences in lowerextremity gait biomechanics during walking using an
Footwear Science 113
Dow
nloa
ded
by [U
nive
rsity
of C
alga
ry] a
t 07:
35 2
2 M
ay 2
012

unstable shoe. Clinical Biomechanics, 25 (10),1047–1052.
Ramstrand, N., Andersson, C.B., and Rusaw, D., 2008.Effects of an unstable shoe construction on standingbalance in children with developmental disabilities: a pilotstudy. Prosthetics and Orthotics International, 32 (4),422–433.
Ramstrand, N., et al., 2010. Effects of an unstable shoeconstruction on balance in women aged over 50 years.Clinical Biomechanics, 25 (5), 455–460.
Roberts, S., Birch, I., and Otter, S., 2011. Comparison ofankle and subtalar joint complex range of motion duringbarefoot walking and walking in Masai BarefootTechnology sandals. Journal of Foot and Ankle Research,4 (1), 1–4.
Romkes, J., Rudmann, C., and Brunner, R., 2006. Changesin gait and EMG when walking with the Masai BarefootTechnique. Clinical Biomechanics, 21 (1), 75–81.
Rutherford, D.J., et al., 2008. Foot progression angle and theknee adduction moment: a cross-sectional investigation in
knee osteoarthritis. Osteoarthritis and Cartilage, 16 (8),883–889.
Schipplein, O.D. and Andriacchi, T.P., 1991. Interactionbetween active and passive knee stabilizers during levelwalking. Journal of Orthopaedic Research, 9 (1),113–119.
Sharma, L., et al., 1998. Knee adduction moment, serumhyaluronan level, and disease severity in medial tibiofe-moral osteoarthritis. Arthritis and Rheumatism, 41 (7),1233–1240.
Stewart, L., Gibson, J.N., and Thomson, C.E., 2007. In-shoepressure distribution in ‘unstable’ (MBT) shoes and flat-bottomed training shoes: a comparative study. Gait andPosture, 25 (4), 648–651.
Stoggl, T., et al., 2010. Short and long term adaptation ofvariability during walking using unstable (MBT) shoes.Clinical Biomechanics, 25 (8), 816–822.
Wrigley, A.T., et al., 2005. Differentiating lifting techniquebetween those who develop low back pain and those whodo not. Clinical Biomechanics, 20 (3), 254–263.
114 S.C. Landry et al.
Dow
nloa
ded
by [U
nive
rsity
of C
alga
ry] a
t 07:
35 2
2 M
ay 2
012