Embed Size (px)
Citation preview
8/20/2019 Walnuts v 2012
http://slidepdf.com/reader/full/walnuts-v-2012 1/20
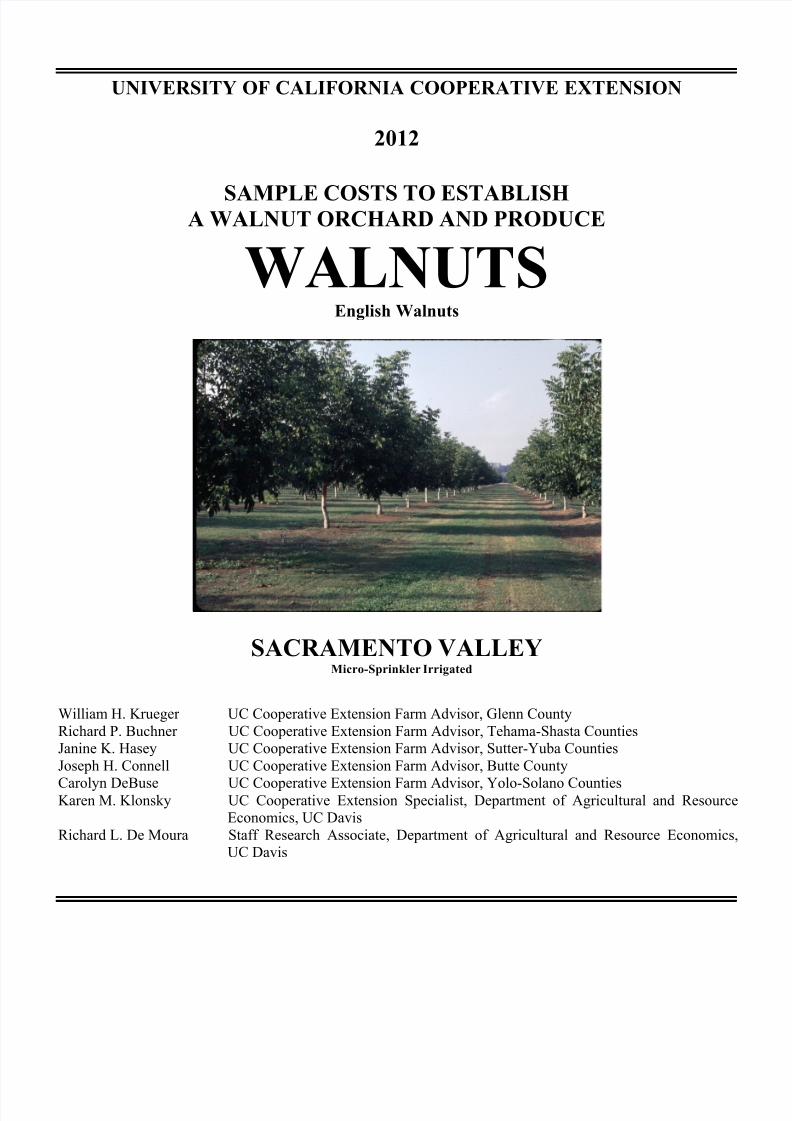
UNIVERSITY OF CALIFORNIA COOPERATIVE EXTENSION
2012
SAMPLE COSTS TO ESTABLISH
A WALNUT ORCHARD AND PRODUCE
WALNUTS
English Walnuts
8/20/2019 Walnuts v 2012
http://slidepdf.com/reader/full/walnuts-v-2012 2/20
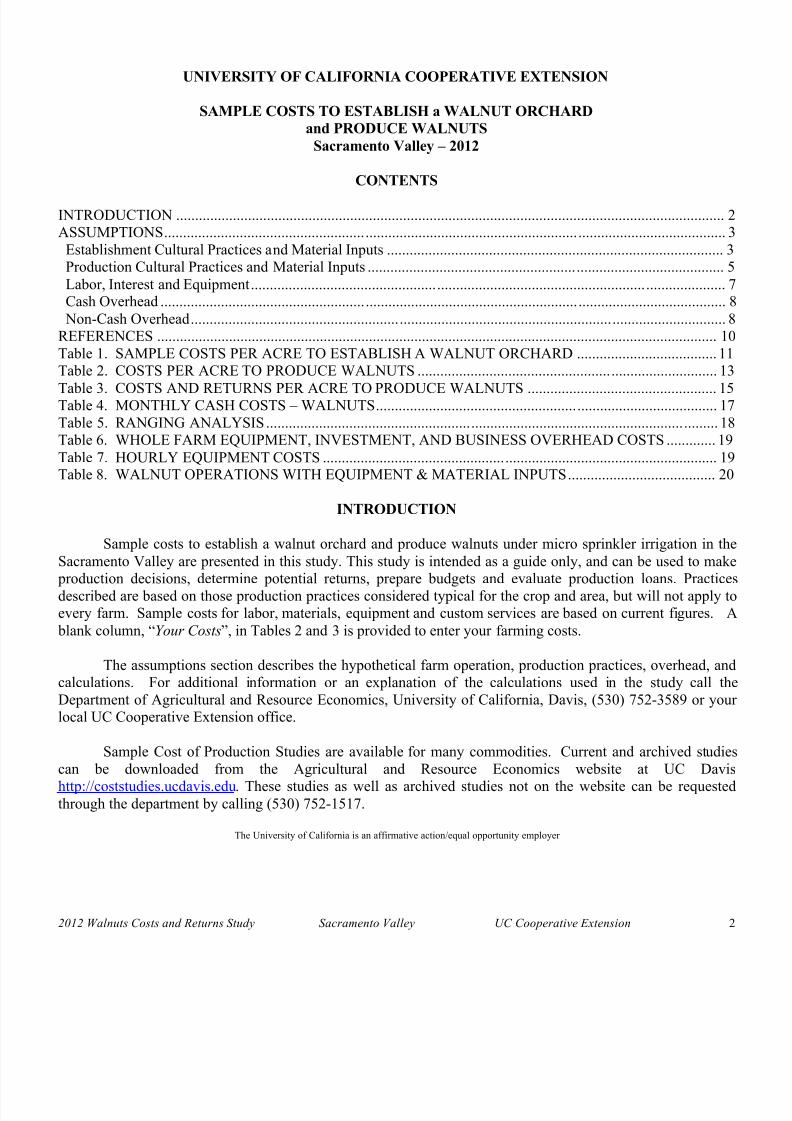
UNIVERSITY OF CALIFORNIA COOPERATIVE EXTENSION
SAMPLE COSTS TO ESTABLISH a WALNUT ORCHARD
and PRODUCE WALNUTSSacramento Valley – 2012
CONTENTS
INTRODUCTION ................................................................................................................................................. 2ASSUMPTIONS .................................................................................................................................................... 3Establishment Cultural Practices and Material Inputs ......................................................................................... 3
Production Cultural Practices and Material Inputs .............................................................................................. 5Labor, Interest and Equipment ............................................................................................................................. 7Cash Overhead ..................................................................................................................................................... 8 Non-Cash Overhead ............................................................................................................................................. 8REFERENCES .................................................................................................................................................... 10Table 1. SAMPLE COSTS PER ACRE TO ESTABLISH A WALNUT ORCHARD ..................................... 11Table 2. COSTS PER ACRE TO PRODUCE WALNUTS ............................................................................... 13Table 3. COSTS AND RETURNS PER ACRE TO PRODUCE WALNUTS .................................................. 15
Table 4. MONTHLY CASH COSTS – WALNUTS .......................................................................................... 17Table 5. RANGING ANALYSIS ....................................................................................................................... 18Table 6. WHOLE FARM EQUIPMENT, INVESTMENT, AND BUSINESS OVERHEAD COSTS ............. 19Table 7. HOURLY EQUIPMENT COSTS ........................................................................................................ 19Table 8. WALNUT OPERATIONS WITH EQUIPMENT & MATERIAL INPUTS ....................................... 20
INTRODUCTION
Sample costs to establish a walnut orchard and produce walnuts under micro sprinkler irrigation in theSacramento Valley are presented in this study. This study is intended as a guide only, and can be used to make production decisions, determine potential returns, prepare budgets and evaluate production loans. Practicesdescribed are based on those prod ction practices considered t pical for the crop and area b t ill not appl to
8/20/2019 Walnuts v 2012
http://slidepdf.com/reader/full/walnuts-v-2012 3/20
ASSUMPTIONS
The assumptions refer to Tables 1 through 8 and pertain to sample costs to establish an orchard and
produce walnuts under micro sprinkler or low volume irrigation in the Sacramento Valley. The cultural practices described represent production operations and materials considered typical for a well managed farm inthe Sacramento Valley. Costs, materials, and practices in this study will not apply to all farms. Timing of andtypes of cultural practices will vary by location and by season depending upon weather, soil, insect and disease pressure. The study is intended as a guide only. The use of trade names and cultural practices does not
constitute an endorsement or recommendation by the University of California nor is any criticism
implied by omission of other similar products or cultural practices.
Farm. The hypothetical farm consists of 105 contiguous acres farmed by the owner. Smaller non-contiguous parcels may have additional costs for travel time and equipment re-calibration. Walnuts areestablished on 100 acres; roads, irrigation systems and farmstead occupy five acres.
Establishment Cultural Practices and Material Inputs
(Table 1)
Site Preparation. This orchard is established on ground previously planted to another tree crop. The
soil is ripped 3-feet deep in two directions to break up underlying hardpan and pull up old roots. The orchardsite is disced twice to break up clods, then floated twice to level and smooth the surface. The area is fumigated,untarped, solid with Telone C35. Berms in the tree row are formed with the grower’s tractor and ridger. Aherbicide is then applied prior to planting. Contract or custom operators do both ripping and fumigation. Alloperations that prepare the orchard for planting are done in the year prior to planting, but costs are shown in thefirst year.
Trees. No specific variety of English walnut is planted in this study. Cultivars typically planted in the
Sacramento Valley include Chandler, Howard and Tulare. Many orchards include a small percentage of asecond variety for pollination. Paradox is the typical rootstock in the Sacramento Valley. Many variablesdetermine spacing including soil, rootstock and variety planted. In this study, 3/4 inch caliber nursery graftedtrees costing $16 35 per tree are planted at 24 X 28 foot spacing res lting in 65 trees per acre The economic
8/20/2019 Walnuts v 2012
http://slidepdf.com/reader/full/walnuts-v-2012 4/20
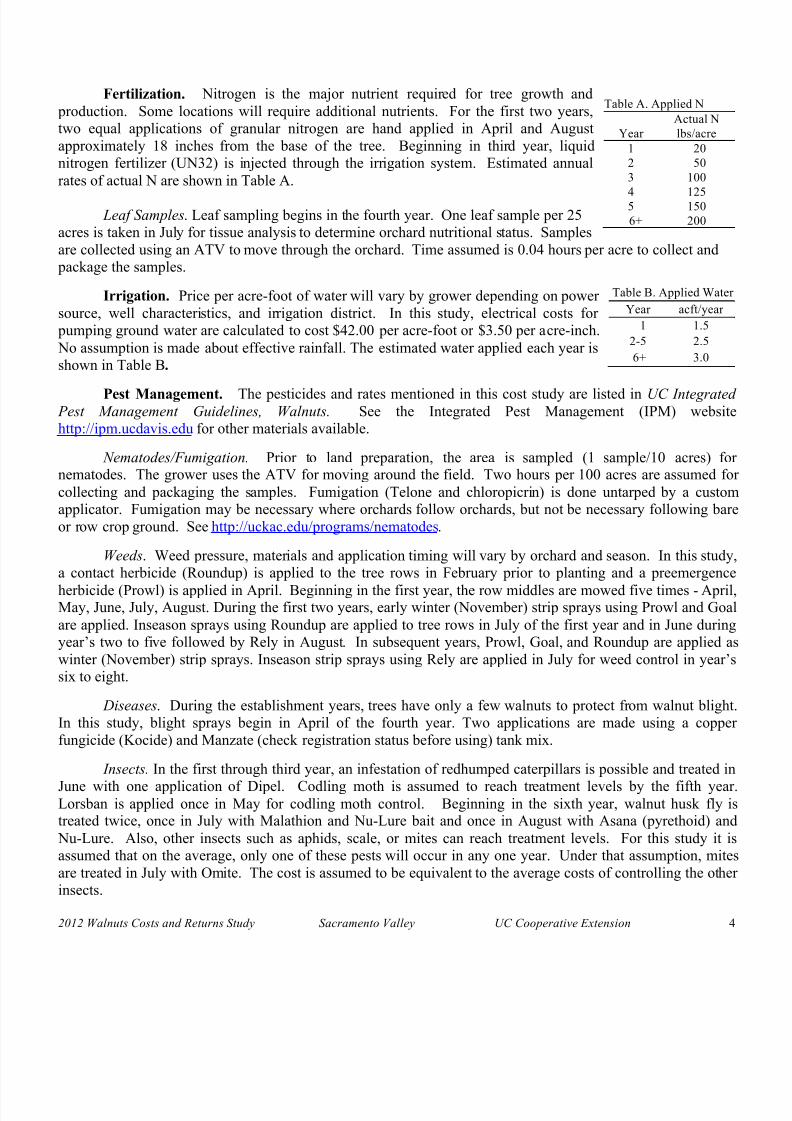
Fertilization. Nitrogen is the major nutrient required for tree growth and production. Some locations will require additional nutrients. For the first two years,
two equal applications of granular nitrogen are hand applied in April and Augustapproximately 18 inches from the base of the tree. Beginning in third year, liquidnitrogen fertilizer (UN32) is injected through the irrigation system. Estimated annualrates of actual N are shown in Table A.
Leaf Samples. Leaf sampling begins in the fourth year. One leaf sample per 25acres is taken in July for tissue analysis to determine orchard nutritional status. Samplesare collected using an ATV to move through the orchard. Time assumed is 0.04 hours per acre to collect and
package the samples.
Irrigation. Price per acre-foot of water will vary by grower depending on powersource, well characteristics, and irrigation district. In this study, electrical costs for pumping ground water are calculated to cost $42.00 per acre-foot or $3.50 per acre-inch. No assumption is made about effective rainfall. The estimated water applied each year isshown in Table B.
Pest Management. The pesticides and rates mentioned in this cost study are listed in UC Integrated
Pest Management Guidelines, Walnuts. See the Integrated Pest Management (IPM) websitehttp://ipm.ucdavis.edu for other materials available.
Nematodes/Fumigation. Prior to land preparation, the area is sampled (1 sample/10 acres) fornematodes. The grower uses the ATV for moving around the field. Two hours per 100 acres are assumed forcollecting and packaging the samples. Fumigation (Telone and chloropicrin) is done untarped by a customapplicator. Fumigation may be necessary where orchards follow orchards, but not be necessary following bareor row crop ground. See http://uckac.edu/programs/nematodes.
Weeds. Weed pressure, materials and application timing will vary by orchard and season. In this study,a contact herbicide (Roundup) is applied to the tree rows in February prior to planting and a preemergenceherbicide (Prowl) is applied in April. Beginning in the first year, the row middles are mowed five times - April,
Table A. Applied N
Actual N
Year lbs/acre1 20
2 50
3 100
4 125
5 150
6+ 200
Table B. Applied Water
Year acft/year
1 1.5
2-5 2.5
6+ 3.0

8/20/2019 Walnuts v 2012
http://slidepdf.com/reader/full/walnuts-v-2012 5/20
Vertebrate Pests. Beginning in the first year, gophers are managed in the spring (March) using poison bait placed underground by a mechanical bait applicator. It is assumed that gophers are under control by the
end of the third year and in subsequent years only spot treatments are necessary. Squirrels are managed usinganti-coagulant bait stations on the field perimeter beginning in the fifth year and are maintained during May,June, September and October. See http://ucanr.org/sites/Ground_Squirrel_BMP/.
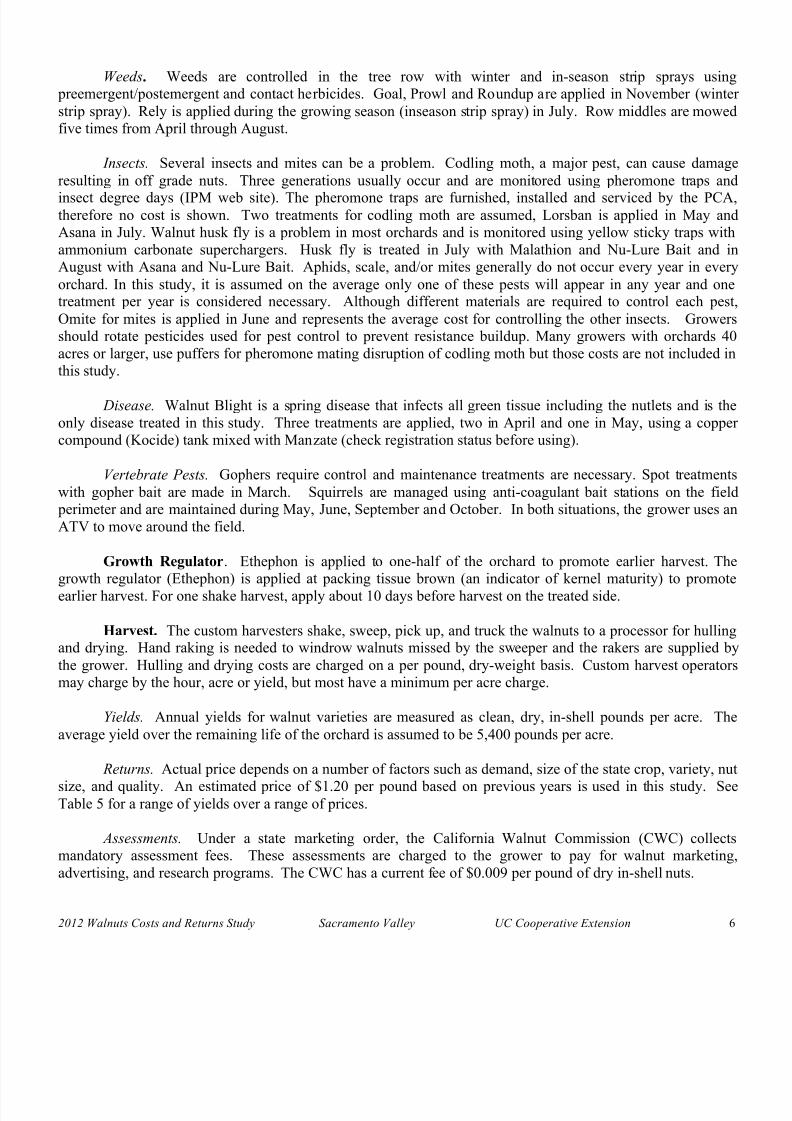
Harvest. Depending upon variety and orchard management,harvest usually starts in the fourth or fifth year. In this study, economicalharvest starts in the fourth year. A custom operator mechanically shakes,sweeps, picks up and hauls walnuts to a facility for hulling and drying.
Mature yield is reached in the eighth year. See harvest under the productionassumptions.
Production Cultural Practices and Material Inputs
(Table 2 – 8)
Pruning. Pruning to maintain light for healthy buds, lower tree height, remove dead and undesiredlimbs is done during the winter months. The trees are hedged by a custom operator between December and
March (February in this study) once every three years and one-third of the cost is included each year. Hand pruning is done each year in July to remove low and broken limbs. In both cases, prunings are placed in therow middles and are pushed to the orchard edge for burning. Brush removal includes the tractor driver and oneman on the ground.
Fertilization. Nitrogen (N) at an annual rate of 200 pounds per acre of actual N is applied through theirrigation system. The nitrogen source is UN 32 injected through the irrigation system in equal amounts inApril and August. Labor for the fertilizer application is included in the irrigation labor.
Leaf Samples. Nutrition is determined by leaf analysis. Leaf samples at one sample per 25 acres aretaken in July for tissue analysis. The grower uses the ATV to move around the field. Time assumed is 0.04ho rs per acre to collect and package the samples
Table C. Annual Yields
Yield (dry, In-shell)
Year ton/acre lb/acre
4 0.25 500
5 0.50 1,000
6 0.75 1,500
7 1.40 2,8008+ 2.70 5,400
8/20/2019 Walnuts v 2012
http://slidepdf.com/reader/full/walnuts-v-2012 6/20
Weeds. Weeds are controlled in the tree row with winter and in-season strip sprays using preemergent/postemergent and contact herbicides. Goal, Prowl and Roundup are applied in November (winterstrip spray). Rely is applied during the growing season (inseason strip spray) in July. Row middles are mowed
five times from April through August.
Insects. Several insects and mites can be a problem. Codling moth, a major pest, can cause damageresulting in off grade nuts. Three generations usually occur and are monitored using pheromone traps andinsect degree days (IPM web site). The pheromone traps are furnished, installed and serviced by the PCA,therefore no cost is shown. Two treatments for codling moth are assumed, Lorsban is applied in May andAsana in July. Walnut husk fly is a problem in most orchards and is monitored using yellow sticky traps withammonium carbonate superchargers. Husk fly is treated in July with Malathion and Nu-Lure Bait and in
August with Asana and Nu-Lure Bait. Aphids, scale, and/or mites generally do not occur every year in everyorchard. In this study, it is assumed on the average only one of these pests will appear in any year and onetreatment per year is considered necessary. Although different materials are required to control each pest,Omite for mites is applied in June and represents the average cost for controlling the other insects. Growersshould rotate pesticides used for pest control to prevent resistance buildup. Many growers with orchards 40acres or larger, use puffers for pheromone mating disruption of codling moth but those costs are not included inthis study.
Disease. Walnut Blight is a spring disease that infects all green tissue including the nutlets and is theonly disease treated in this study. Three treatments are applied, two in April and one in May, using a coppercompound (Kocide) tank mixed with Manzate (check registration status before using).
Vertebrate Pests. Gophers require control and maintenance treatments are necessary. Spot treatmentswith gopher bait are made in March. Squirrels are managed using anti-coagulant bait stations on the field perimeter and are maintained during May, June, September and October. In both situations, the grower uses anATV to move around the field.
Growth Regulator. Ethephon is applied to one-half of the orchard to promote earlier harvest. Thegrowth regulator (Ethephon) is applied at packing tissue brown (an indicator of kernel maturity) to promoteearlier har est For one shake har est appl abo t 10 da s before har est on the treated side

8/20/2019 Walnuts v 2012
http://slidepdf.com/reader/full/walnuts-v-2012 7/20
Miscellaneous Labor. Labor that may be used for short periods assisting various operations. Theoperation was completed before the end of the workday; therefore the grower may assign miscellaneous dutiessuch as weeding around the shop or equipment yard. Also covers extra labor that may be needed in one of the
operations or in the shop and has not been accounted for in that specific operation.
Pickup/ATV. The study assumes business use mileage of 3,000 miles per year for the pickup. TheATV is used for weed spraying, baiting squirrels and gophers and is included in those costs. Additional ATVuses for checking the orchard, diseases and irrigation system are shown as a line item. The travel and time areestimated and not taken from any specific data.
Labor, Equipment, and Interest
Labor. Hourly wages for workers are $12.50 for machine operators and $9.00 per hour non-machinelabor. Adding 33% for the employer’s share of federal and state payroll taxes, workers compensation insurancefor nut crops (code 0045) and other possible benefits results in labor rates of $16.63 and $11.97 per hour formachine labor and non-machine labor, respectively. Workers’ compensation costs will vary among growers, but for this study the cost is based upon the average industry final rate as of January 1, 2011 (CaliforniaDepartment of Insurance). Labor for operations involving machinery are 20% higher than the operation timegiven in Table 2 to account for the extra labor involved in equipment set up, moving, maintenance, work breaks,
and field repair.
Equipment Operating Costs. Repair costs are based on purchase price, annual hours of use, totalhours of life, and repair coefficients formulated by American Society of Agricultural Engineers (ASAE). Fueland lubrication costs are also determined by ASAE equations based on maximum power takeoff (PTO)horsepower, and fuel type. Prices for on-farm delivery of diesel and gasoline are $3.44 and $3.85 per gallon,respectively. The costs are based on January through June 2011, Department of Energy (DOE) monthly data.The cost includes a 2.5% local sales tax on diesel fuel and 7.5% sales tax on gasoline. Gasoline also includes
federal and state excise tax, which are refundable for on-farm use when filing your income tax. The fuel, lube,and repair cost per acre for each operation in Table 2 is determined by multiplying the total hourly operatingcost in Table 7 for each piece of equipment used for the selected operation by the hours per acre. Tractor timeis 10% higher than implement time for a gi en operation to acco nt for set p tra el and do n time

8/20/2019 Walnuts v 2012
http://slidepdf.com/reader/full/walnuts-v-2012 8/20
Cash Overhead
Cash overhead consists of various cash expenses paid out during the year that are assigned to the whole
farm and not to a particular operation. Employee benefits, insurance, and payroll taxes are included in laborcosts and not in overhead (see Labor).
Property Taxes. Counties charge a base property tax rate of 1% on the assessed value of the property.In some counties special assessment districts exist and charge additional taxes on property including equipment, buildings, and improvements. For this study, county taxes are calculated as 1% of the average value of the property. Average value equals new cost plus salvage value divided by two on a per acre basis.
Insurance. Insurance for farm investments varies depending on the assets included and the amount ofcoverage. Property insurance provides coverage for property loss and is charged at 0.775% of the average valueof the assets over their useful life. Liability insurance covers accidents on the farm and costs $728 for the entirefarm.
Office Expense. Office and business expenses are estimated at $120 per acre. These expenses includeoffice supplies, telephones, bookkeeping, accounting, legal fees, road maintenance, shop and office utilities andmiscellaneous administrative costs.
Sanitation Services. Sanitation services provide portable toilets with wash basins for the orchard andcost the farm $1,280 annually. This cost includes delivery and five months of weekly service.
Environmental Fees. Fees are estimated for various environmental and safety expenses.
Supervisor/Management Salaries. Wages for management are not included as a cash cost. Any returnabove total costs is considered a return to management and risk.
Investment Repairs. Costs are calculated as 2% of the purchase price on investments listed in Table 5except for establishment costs are 0.10% to account for tree replacement.
8/20/2019 Walnuts v 2012
http://slidepdf.com/reader/full/walnuts-v-2012 9/20
in years is estimated by dividing the wearout life, as given by ASAE by the annual hours of use in thisoperation. For other investments including irrigation systems, buildings, and miscellaneous equipment, thevalue at the end of its useful life is zero. The salvage value for land is the purchase price because land does not
depreciate. The purchase price and salvage value for equipment and investments are shown in Table 6.
Capital Recovery Factor . Capital recovery factor is the amortization factor or annual payment whose present value at compound interest is 1. The amortization factor is a table value that corresponds to the interestrate used and the life of the machine.
Interest Rate. An interest rate of 4.75% is used to calculate capital recovery. The rate will varydepending upon loan amount and other lending agency conditions, but is the basic suggested rate by a farm
lending agency as of January 2012.
Land. Crop or bare land values range from $4,000 to $8,000. The orchard site is assumed to be on previously farmed orchard ground. The basic land value in this study is $7,000 per acre.
Irrigation System. The cost is based on two 75-horsepower electric motors pumping from a depth of75 feet. Water is pumped to the orchard, after running through a filtration station. For this study, a pump andwell already exist, so the cost of the irrigation system is for recasing the well, refurbishing the pump and motor,
installing a new filtration system and micro sprinklers. The new irrigation system is installed after the orchardhas been laid out and prior to planting. The life of the irrigation system is estimated at 35 years.
Fuel Tanks. Two 250-gallon fuel tanks are placed on stands in cement containment meeting Federal,State, and local regulations. Fuel is delivered to the equipment by gravity feed.
Tools. Includes shop tools/equipment, hand tools, field tools such as pruning equipment, traps, etc.
Establishment Cost. Costs to establish the orchard are used to determine the non-cash overheadexpenses, capital recovery, and interest on investment for the production years. The establishment cost is thesum of cash costs for land preparation, planting, trees, production expenses, and cash overhead for growingalmond trees thro gh the first ear n ts are har ested less ret rns from prod ction The A l t d N t C h

8/20/2019 Walnuts v 2012
http://slidepdf.com/reader/full/walnuts-v-2012 10/20
REFERENCES
American Society of Agricultural Engineers. (ASAE). 1992. American Society of Agricultural Engineers
Standards Yearbook . St. Joseph, MO.
Boehlje, Michael D., and Vernon R. Eidman. 1984. Farm Management . John Wiley and Sons. New York, NY.
California Chapter of the American Society of Farm Managers and Rural Appraisers. 2011. Trends in Agricultural Land and Lease Values. California Chapter of the American Society of Farm Managersand Rural Appraisers, Inc. Woodbridge, CA.
California State Board of equalization. Fuel Tax Division Tax Rates. Internet accessed July 2011.http://www.boe.ca.gov/sptaxprog/spftdrates.htm
Energy Information Administration. 2011. Weekly Retail on Highway Diesel Prices. Internet accessed July2011. http://tonto.eix.doe.gov/oog/info/wohdp
Doanes Editors. Facts and Figures for Farmers. 1977. Doane Publishing, St. Louis, MO. P 292.
Krueger, William H., Buchner, Richard P., John P. Edstrom, Janine K. Hasey, Karen M. Klonsky, and RichardL. De Moura. 2007. Sample Costs to Establish and Produce Walnuts, Sacramento Valley. University ofCalifornia, Cooperative Extension. Department of Agricultural and Resource Economics. Davis, CA.
Ramos, David E. (ed.). Walnut Production Manual . University of California, Division of Agricultural and Natural Resources. Oakland, CA. Publication 3373.
Reil, Wilbur. 2001. Walnut Production in Yolo and Solano Counties of California. University of CaliforniaCooperative Extension. Woodland, CA.
Sch ankl Larr Terr Prichard Blaine Hanson Ilene Wellman 2000 C t f P i d I i ti S t

8/20/2019 Walnuts v 2012
http://slidepdf.com/reader/full/walnuts-v-2012 11/20
UC COOPERATIVE EXTENSION
Table 1. COSTS PER ACRE TO ESTABLISH AN ENGLISH WALNUT ORCHARD
SACRAMENTO VALLEY - 2012
Cost Per AcreYear: 1st 2nd 3rd 4th 5th 6th 7th
Yield: Dry, In-Shell Pounds Per Acre 500 1,000 1,500 2,800
Planting Costs:
Nematode Sampling (10/100 acres) 4
Land Preparation: Subsoil/Rip 2X, Disk 2X, Float 2X 550
Land Preparation: Fumigate (solid, untarped) 2,500
Land Prep: Berms 4
Land Prep-Weed: Preplant Strip Spray (Roundup) 6
Trees: 65 Per Acre @ $16.50 ea., (2% in 2nd year) 1,073 33
Plant: Survey, Mark, Dig Holes & Plant 219 7
Plant: Stake & Paint Trees 309TOTAL PLANTING COSTS 4,665 40
Cultural Costs:
Prune (Yrs 1-3 prune/train. Yrs 4+ prune, Yr 7+ prune 1X/3 yrs) 48 72 54 240 320 400 67
Fertilizer: Nitrogen (Urea, Yr 1-2. UN32, Yr 3+) 37 57 68 85 102 136 136
Weed: Strip Spray (Yr 1 Prowl, Yr 2 Rely) 18 17
Weed: Dormant Strip (Yr 1-2, Goal, Prowl. Yr 2+, Goal, Prowl, Roundup) 43 43 46 46 46 46 46
Weed: Mow Middles 5X 46 46 46 46 46 46 46
Weed: In-Season Strip Spray (Yr 1 Roundup, 1X. Yr 2-5, Roundup 1X, Rely 1X. Yr 6+, Rely) 10 10 27 27 27 17 17
Irrigate 75 117 117 117 117 138 138
Vertebrate: Gophers (Bait) 11 11 11 4 4 4 4
Insect: Caterpillar (Dipel) 19 19 19Prune: Brush Disposal 13 13 13 13 4
Fertilize: Leaf Analysis 2 2 2 2
Disease: Blight (Kocide, Manzate) 105 105 105 105
Insect: Codling Moth (Lorsban) 24 24 24
Vertebrate: Squirrels (Bait) 7 7 7
Insect: Husk Fly (Malathion, Nu Lure Bait 1X) (Asana, Nu Lure 1X) 112 112
Insect: Miscellaneous Insects (Omite for mites) 37 37
Pickup Use 31 31 31 31 31 31 31
ATV use 46 46 46 46 46 46 46
Miscellaneous Labor 36 36 36 36 36 36 36
PCA Services 10 10 10 30 30 30 30TOTAL CULTURAL COSTS 430 515 524 828 956 1,230 887
Harvest Costs:
Shake, Sweep, Pickup 240 240 240 240
Hand Rake 9 12 12 12
8/20/2019 Walnuts v 2012
http://slidepdf.com/reader/full/walnuts-v-2012 12/20
UC COOPERATIVE EXTENSION
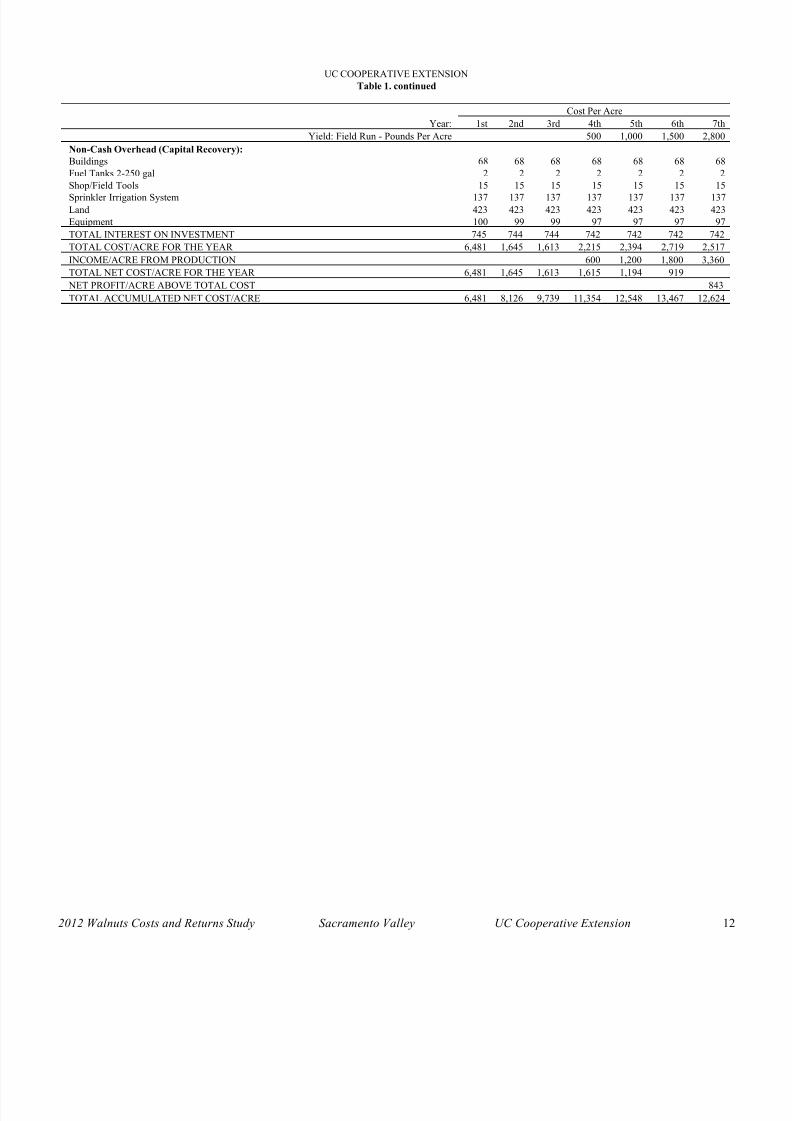
Table 1. continued
Cost Per Acre
Year: 1st 2nd 3rd 4th 5th 6th 7th
Yield: Field Run - Pounds Per Acre 500 1,000 1,500 2,800Non-Cash Overhead (Capital Recovery):
Buildings 68 68 68 68 68 68 68
Fuel Tanks 2-250 gal 2 2 2 2 2 2 2
Shop/Field Tools 15 15 15 15 15 15 15
Sprinkler Irrigation System 137 137 137 137 137 137 137
Land 423 423 423 423 423 423 423
Equipment 100 99 99 97 97 97 97
TOTAL INTEREST ON INVESTMENT 745 744 744 742 742 742 742
TOTAL COST/ACRE FOR THE YEAR 6,481 1,645 1,613 2,215 2,394 2,719 2,517
INCOME/ACRE FROM PRODUCTION 600 1,200 1,800 3,360
TOTAL NET COST/ACRE FOR THE YEAR 6,481 1,645 1,613 1,615 1,194 919 NET PROFIT/ACRE ABOVE TOTAL COST 843
TOTAL ACCUMULATED NET COST/ACRE 6,481 8,126 9,739 11,354 12,548 13,467 12,624
8/20/2019 Walnuts v 2012
http://slidepdf.com/reader/full/walnuts-v-2012 13/20
UC COOPERATIVE EXTENSION
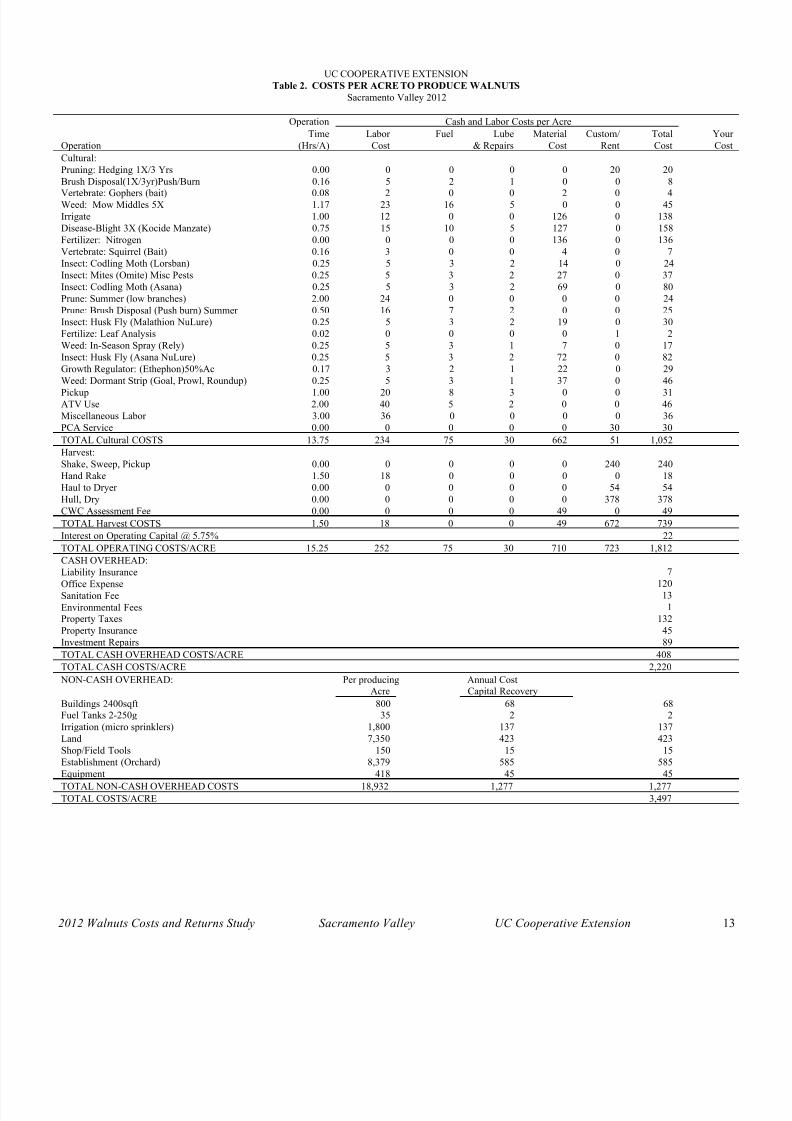
Table 2. COSTS PER ACRE TO PRODUCE WALNUTS
Sacramento Valley 2012
Operation Cash and Labor Costs per Acre
Time Labor Fuel Lube Material Custom/ Total YourOperation (Hrs/A) Cost & Repairs Cost Rent Cost Cost
Cultural:
Pruning: Hedging 1X/3 Yrs 0.00 0 0 0 0 20 20
Brush Disposal(1X/3yr)Push/Burn 0.16 5 2 1 0 0 8Vertebrate: Gophers (bait) 0.08 2 0 0 2 0 4
Weed: Mow Middles 5X 1.17 23 16 5 0 0 45
Irrigate 1.00 12 0 0 126 0 138
Disease-Blight 3X (Kocide Manzate) 0.75 15 10 5 127 0 158
Fertilizer: Nitrogen 0.00 0 0 0 136 0 136
Vertebrate: Squirrel (Bait) 0.16 3 0 0 4 0 7
Insect: Codling Moth (Lorsban) 0.25 5 3 2 14 0 24
Insect: Mites (Omite) Misc Pests 0.25 5 3 2 27 0 37
Insect: Codling Moth (Asana) 0.25 5 3 2 69 0 80
Prune: Summer (low branches) 2.00 24 0 0 0 0 24
Prune: Brush Disposal (Push burn) Summer 0.50 16 7 2 0 0 25Insect: Husk Fly (Malathion NuLure) 0.25 5 3 2 19 0 30
Fertilize: Leaf Analysis 0.02 0 0 0 0 1 2
Weed: In-Season Spray (Rely) 0.25 5 3 1 7 0 17
Insect: Husk Fly (Asana NuLure) 0.25 5 3 2 72 0 82
Growth Regulator: (Ethephon)50%Ac 0.17 3 2 1 22 0 29
Weed: Dormant Strip (Goal, Prowl, Roundup) 0.25 5 3 1 37 0 46
Pickup 1.00 20 8 3 0 0 31
ATV Use 2.00 40 5 2 0 0 46Miscellaneous Labor 3.00 36 0 0 0 0 36
PCA Service 0.00 0 0 0 0 30 30
TOTAL Cultural COSTS 13.75 234 75 30 662 51 1,052
Harvest:
Shake, Sweep, Pickup 0.00 0 0 0 0 240 240
Hand Rake 1.50 18 0 0 0 0 18
Haul to Dryer 0.00 0 0 0 0 54 54
Hull, Dry 0.00 0 0 0 0 378 378
CWC Assessment Fee 0.00 0 0 0 49 0 49
TOTAL Harvest COSTS 1.50 18 0 0 49 672 739
Interest on Operating Capital @ 5.75% 22TOTAL OPERATING COSTS/ACRE 15.25 252 75 30 710 723 1,812
CASH OVERHEAD:
Liability Insurance 7
Office Expense 120
S it ti F 13
8/20/2019 Walnuts v 2012
http://slidepdf.com/reader/full/walnuts-v-2012 14/20
UC COOPERATIVE EXTENSION
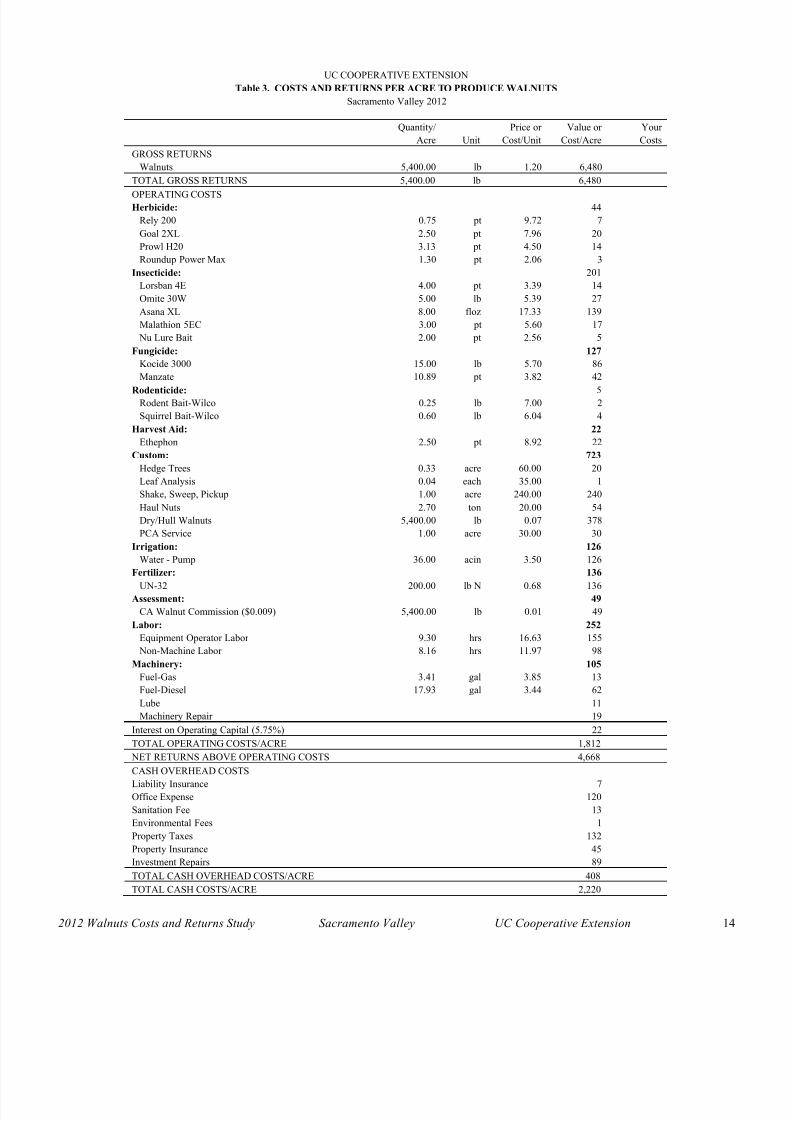
Table 3. COSTS AND RETURNS PER ACRE TO PRODUCE WALNUTS
Sacramento Valley 2012
Quantity/ Price or Value or Your
Acre Unit Cost/Unit Cost/Acre Costs
GROSS RETURNS
Walnuts 5,400.00 lb 1.20 6,480
TOTAL GROSS RETURNS 5,400.00 lb 6,480
OPERATING COSTS
Herbicide: 44
Rely 200 0.75 pt 9.72 7
Goal 2XL 2.50 pt 7.96 20
Prowl H20 3.13 pt 4.50 14
Roundup Power Max 1.30 pt 2.06 3
Insecticide: 201Lorsban 4E 4.00 pt 3.39 14
Omite 30W 5.00 lb 5.39 27
Asana XL 8.00 floz 17.33 139
Malathion 5EC 3.00 pt 5.60 17
Nu Lure Bait 2.00 pt 2.56 5
Fungicide: 127
Kocide 3000 15.00 lb 5.70 86
Manzate 10.89 pt 3.82 42
Rodenticide: 5
Rodent Bait-Wilco 0.25 lb 7.00 2Squirrel Bait-Wilco 0.60 lb 6.04 4
Harvest Aid: 22
Ethephon 2.50 pt 8.92 22
Custom: 723
Hedge Trees 0.33 acre 60.00 20
Leaf Analysis 0.04 each 35.00 1
Shake, Sweep, Pickup 1.00 acre 240.00 240
Haul Nuts 2.70 ton 20.00 54
Dry/Hull Walnuts 5,400.00 lb 0.07 378
PCA Service 1.00 acre 30.00 30
Irrigation: 126
Water - Pump 36.00 acin 3.50 126
Fertilizer: 136
UN-32 200.00 lb N 0.68 136
8/20/2019 Walnuts v 2012
http://slidepdf.com/reader/full/walnuts-v-2012 15/20
UC COOPERATIVE EXTENSION
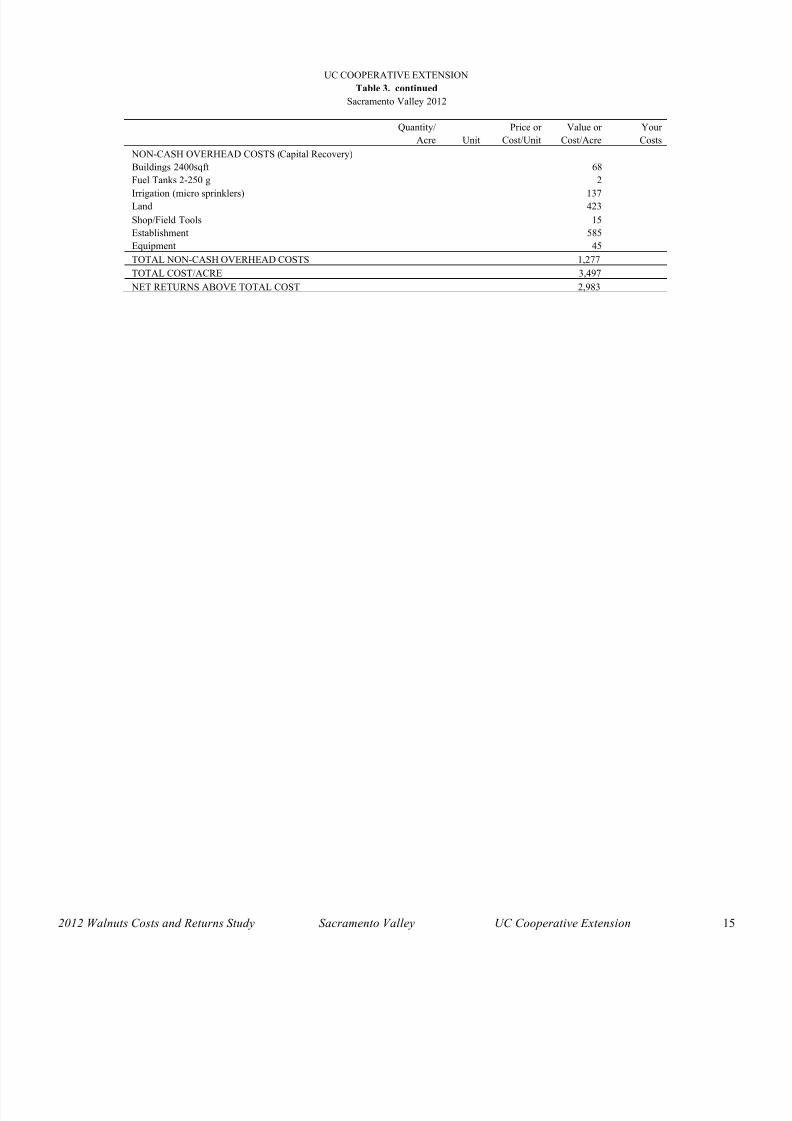
Table 3. continued
Sacramento Valley 2012
Quantity/ Price or Value or Your
Acre Unit Cost/Unit Cost/Acre Costs
NON-CASH OVERHEAD COSTS (Capital Recovery)
Buildings 2400sqft 68
Fuel Tanks 2-250 g 2
Irrigation (micro sprinklers) 137
Land 423
Shop/Field Tools 15
Establishment 585
Equipment 45
TOTAL NON-CASH OVERHEAD COSTS 1,277
TOTAL COST/ACRE 3,497 NET RETURNS ABOVE TOTAL COST 2,983
8/20/2019 Walnuts v 2012
http://slidepdf.com/reader/full/walnuts-v-2012 16/20
2012 Walnuts Costs and Returns Study Sacramento Valley UC Cooperative Extension 16
UC COOPERATIVE EXTENSION
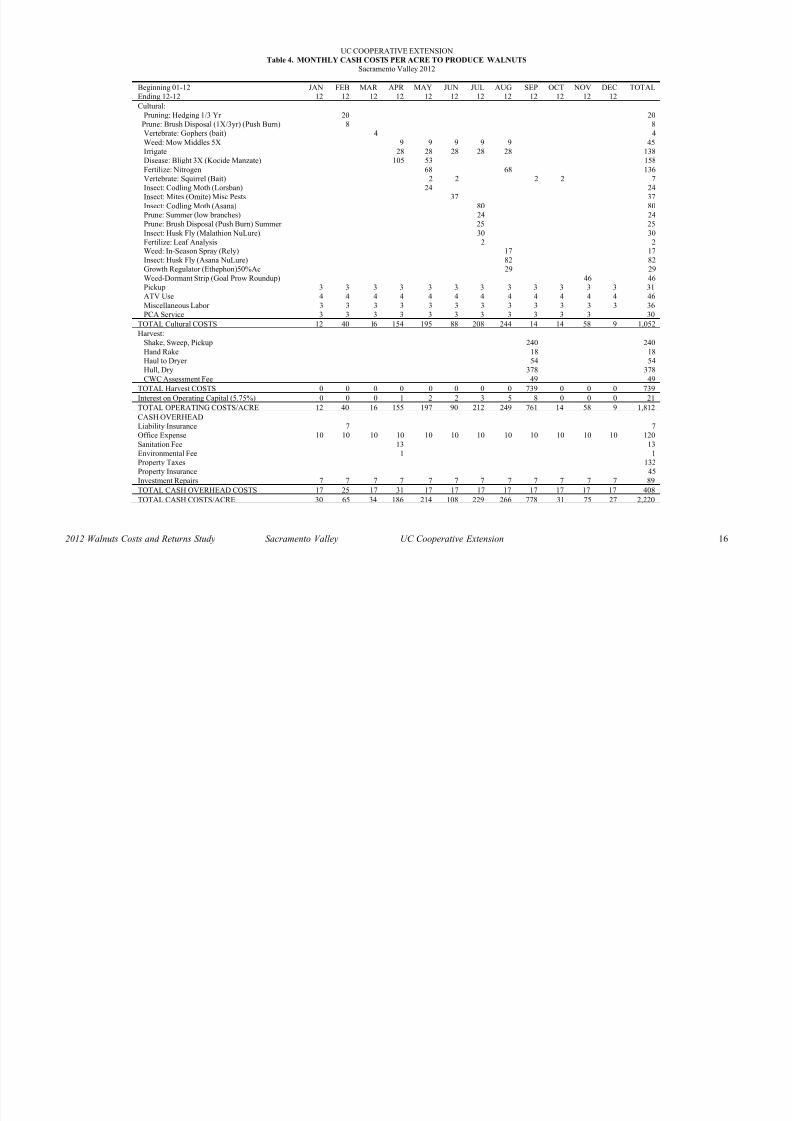
Table 4. MONTHLY CASH COSTS PER ACRE TO PRODUCE WALNUTS
Sacramento Valley 2012
Beginning 01-12 JAN FEB MAR APR MAY JUN JUL AUG SEP OCT NOV DEC TOTAL
Ending 12-12 12 12 12 12 12 12 12 12 12 12 12 12
Cultural:
Pruning: Hedging 1/3 Yr 20 20
Prune: Brush Disposal (1X/3yr) (Push Burn) 8 8
Vertebrate: Gophers (bait) 4 4Weed: Mow Middles 5X 9 9 9 9 9 45
Irrigate 28 28 28 28 28 138
Disease: Blight 3X (Kocide Manzate) 105 53 158
Fertilize: Nitrogen 68 68 136
Vertebrate: Squirrel (Bait) 2 2 2 2 7
Insect: Codling Moth (Lorsban) 24 24
Insect: Mites (Omite) Misc Pests 37 37
Insect: Codling Moth (Asana) 80 80
Prune: Summer (low branches) 24 24
Prune: Brush Disposal (Push Burn) Summer 25 25
Insect: Husk Fly (Malathion NuLure) 30 30
Fertilize: Leaf Analysis 2 2Weed: In-Season Spray (Rely) 17 17
Insect: Husk Fly (Asana NuLure) 82 82
Growth Regulator (Ethephon)50%Ac 29 29Weed-Dormant Strip (Goal Prow Roundup) 46 46
Pickup 3 3 3 3 3 3 3 3 3 3 3 3 31
ATV Use 4 4 4 4 4 4 4 4 4 4 4 4 46
Miscellaneous Labor 3 3 3 3 3 3 3 3 3 3 3 3 36
PCA Service 3 3 3 3 3 3 3 3 3 3 3 30
TOTAL Cultural COSTS 12 40 16 154 195 88 208 244 14 14 58 9 1,052
Harvest:
Shake, Sweep, Pickup 240 240
Hand Rake 18 18
Haul to Dryer 54 54
Hull, Dry 378 378
CWC Assessment Fee 49 49
TOTAL Harvest COSTS 0 0 0 0 0 0 0 0 739 0 0 0 739
Interest on Operating Capital (5.75%) 0 0 0 1 2 2 3 5 8 0 0 0 21
TOTAL OPERATING COSTS/ACRE 12 40 16 155 197 90 212 249 761 14 58 9 1,812CASH OVERHEAD
Liability Insurance 7 7
Office Expense 10 10 10 10 10 10 10 10 10 10 10 10 120
Sanitation Fee 13 13
Environmental Fee 1 1
Property Taxes 132
Property Insurance 45
Investment Repairs 7 7 7 7 7 7 7 7 7 7 7 7 89
TOTAL CASH OVERHEAD COSTS 17 25 17 31 17 17 17 17 17 17 17 17 408
TOTAL CASH COSTS/ACRE 30 65 34 186 214 108 229 266 778 31 75 27 2,220
8/20/2019 Walnuts v 2012
http://slidepdf.com/reader/full/walnuts-v-2012 17/20
UC COOPERATIVE EXTENSION
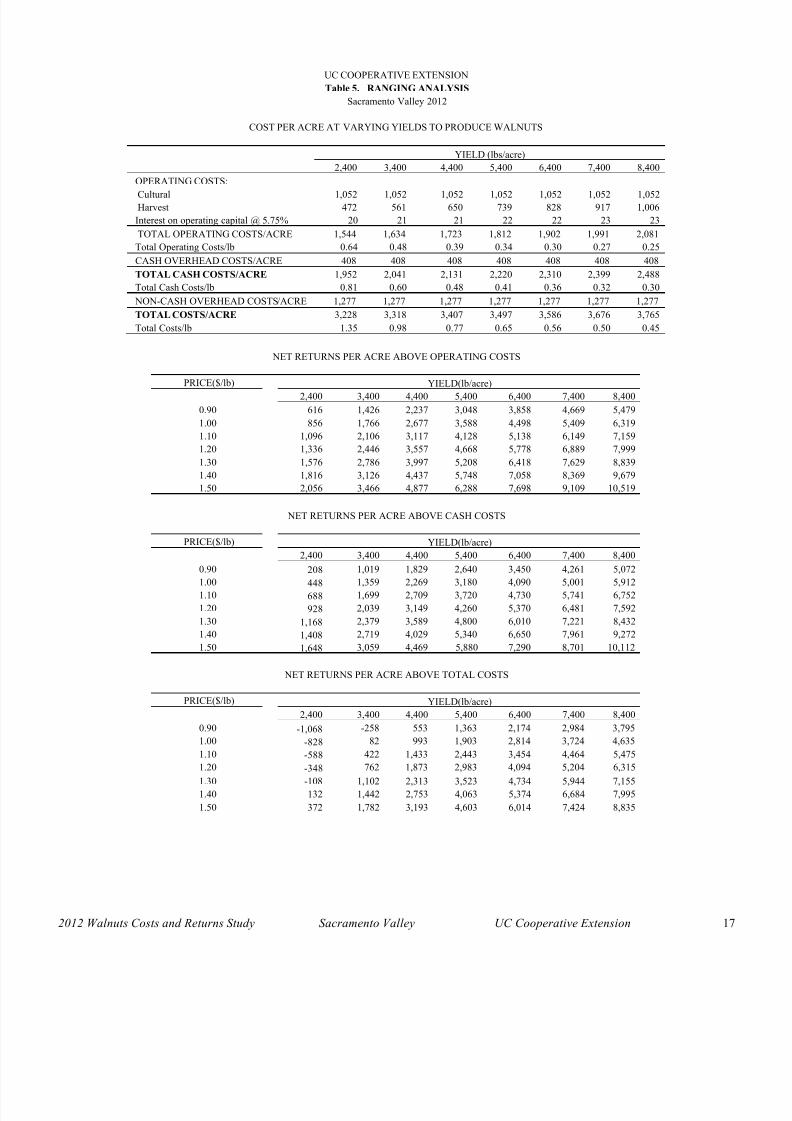
Table 5. RANGING ANALYSIS
Sacramento Valley 2012
COST PER ACRE AT VARYING YIELDS TO PRODUCE WALNUTS
YIELD (lbs/acre)
2,400 3,400 4,400 5,400 6,400 7,400 8,400
OPERATING COSTS:
Cultural 1,052 1,052 1,052 1,052 1,052 1,052 1,052
Harvest 472 561 650 739 828 917 1,006
Interest on operating capital @ 5.75% 20 21 21 22 22 23 23
TOTAL OPERATING COSTS/ACRE 1,544 1,634 1,723 1,812 1,902 1,991 2,081
Total Operating Costs/lb 0.64 0.48 0.39 0.34 0.30 0.27 0.25
CASH OVERHEAD COSTS/ACRE 408 408 408 408 408 408 408
TOTAL CASH COSTS/ACRE 1,952 2,041 2,131 2,220 2,310 2,399 2,488Total Cash Costs/lb 0.81 0.60 0.48 0.41 0.36 0.32 0.30
NON-CASH OVERHEAD COSTS/ACRE 1,277 1,277 1,277 1,277 1,277 1,277 1,277
TOTAL COSTS/ACRE 3,228 3,318 3,407 3,497 3,586 3,676 3,765
Total Costs/lb 1.35 0.98 0.77 0.65 0.56 0.50 0.45
NET RETURNS PER ACRE ABOVE OPERATING COSTS
PRICE($/lb) YIELD(lb/acre)
2,400 3,400 4,400 5,400 6,400 7,400 8,400
0.90 616 1,426 2,237 3,048 3,858 4,669 5,479
1.00 856 1,766 2,677 3,588 4,498 5,409 6,319
1.10 1,096 2,106 3,117 4,128 5,138 6,149 7,159
1.20 1,336 2,446 3,557 4,668 5,778 6,889 7,999
1.30 1,576 2,786 3,997 5,208 6,418 7,629 8,839
1.40 1,816 3,126 4,437 5,748 7,058 8,369 9,679
1.50 2,056 3,466 4,877 6,288 7,698 9,109 10,519
NET RETURNS PER ACRE ABOVE CASH COSTS
PRICE($/lb) YIELD(lb/acre)2,400 3,400 4,400 5,400 6,400 7,400 8,400
0.90 208 1,019 1,829 2,640 3,450 4,261 5,072
1.00 448 1,359 2,269 3,180 4,090 5,001 5,912
1 10 688 1 699 2 709 3 720 4 730 5 741 6 752
8/20/2019 Walnuts v 2012
http://slidepdf.com/reader/full/walnuts-v-2012 18/20
UC COOPERATIVE EXTENSION
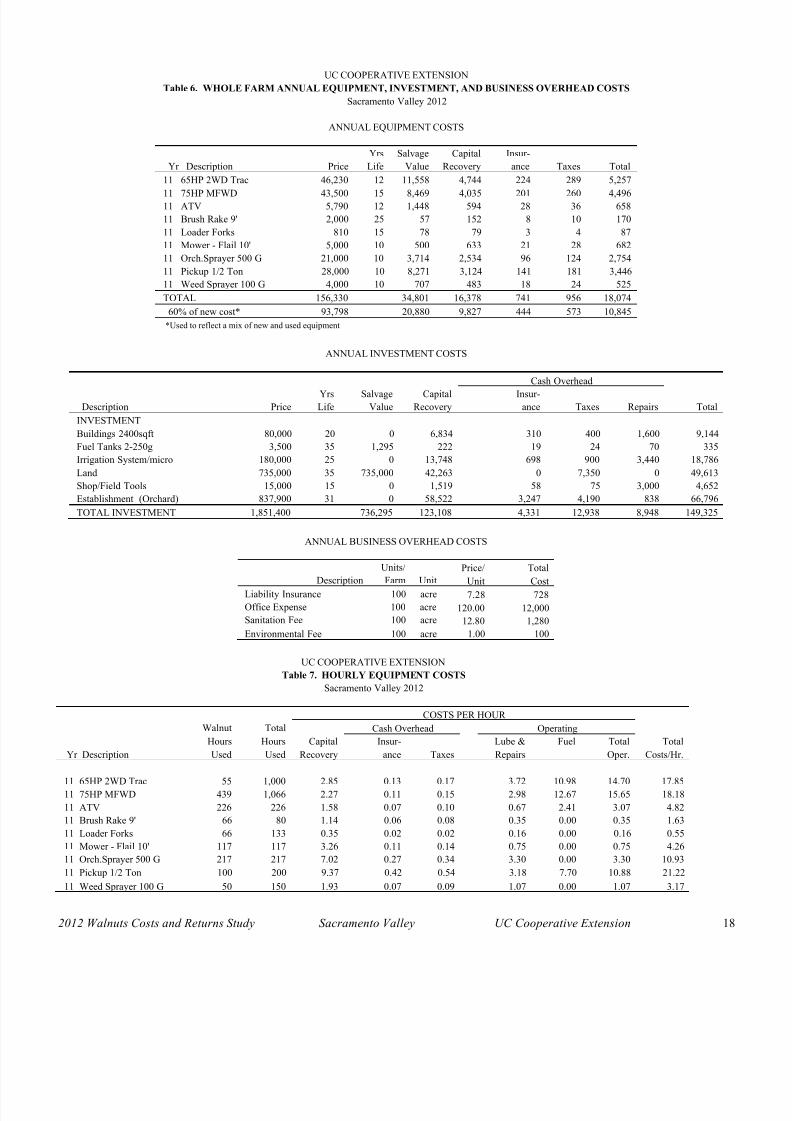
Table 6. WHOLE FARM ANNUAL EQUIPMENT, INVESTMENT, AND BUSINESS OVERHEAD COSTS
Sacramento Valley 2012
ANNUAL EQUIPMENT COSTS
Yrs Salvage Capital Insur-
Yr Description Price Life Value Recovery ance Taxes Total
11 65HP 2WD Trac 46,230 12 11,558 4,744 224 289 5,257
11 75HP MFWD 43,500 15 8,469 4,035 201 260 4,496
11 ATV 5,790 12 1,448 594 28 36 658
11 Brush Rake 9' 2,000 25 57 152 8 10 170
11 Loader Forks 810 15 78 79 3 4 87
11 Mower - Flail 10' 5,000 10 500 633 21 28 682
11 Orch.Sprayer 500 G 21,000 10 3,714 2,534 96 124 2,754
11 Pickup 1/2 Ton 28,000 10 8,271 3,124 141 181 3,44611 Weed Sprayer 100 G 4,000 10 707 483 18 24 525
TOTAL 156,330 34,801 16,378 741 956 18,074
60% of new cost* 93,798 20,880 9,827 444 573 10,845
*Used to reflect a mix of new and used equipment
ANNUAL INVESTMENT COSTS
Cash Overhead
Yrs Salvage Capital Insur-
Description Price Life Value Recovery ance Taxes Repairs TotalINVESTMENT
Buildings 2400sqft 80,000 20 0 6,834 310 400 1,600 9,144
Fuel Tanks 2-250g 3,500 35 1,295 222 19 24 70 335
Irrigation System/micro 180,000 25 0 13,748 698 900 3,440 18,786
Land 735,000 35 735,000 42,263 0 7,350 0 49,613
Shop/Field Tools 15,000 15 0 1,519 58 75 3,000 4,652
Establishment (Orchard) 837,900 31 0 58,522 3,247 4,190 838 66,796
TOTAL INVESTMENT 1,851,400 736,295 123,108 4,331 12,938 8,948 149,325
ANNUAL BUSINESS OVERHEAD COSTS
Units/ Price/ Total
Description Farm Unit Unit Cost
Liability Insurance 100 acre 7 28 728
8/20/2019 Walnuts v 2012
http://slidepdf.com/reader/full/walnuts-v-2012 19/20
2012 Walnuts Costs and Returns Study Sacramento Valley UC Cooperative Extension 19
UC COOPERATIVE EXTENSION
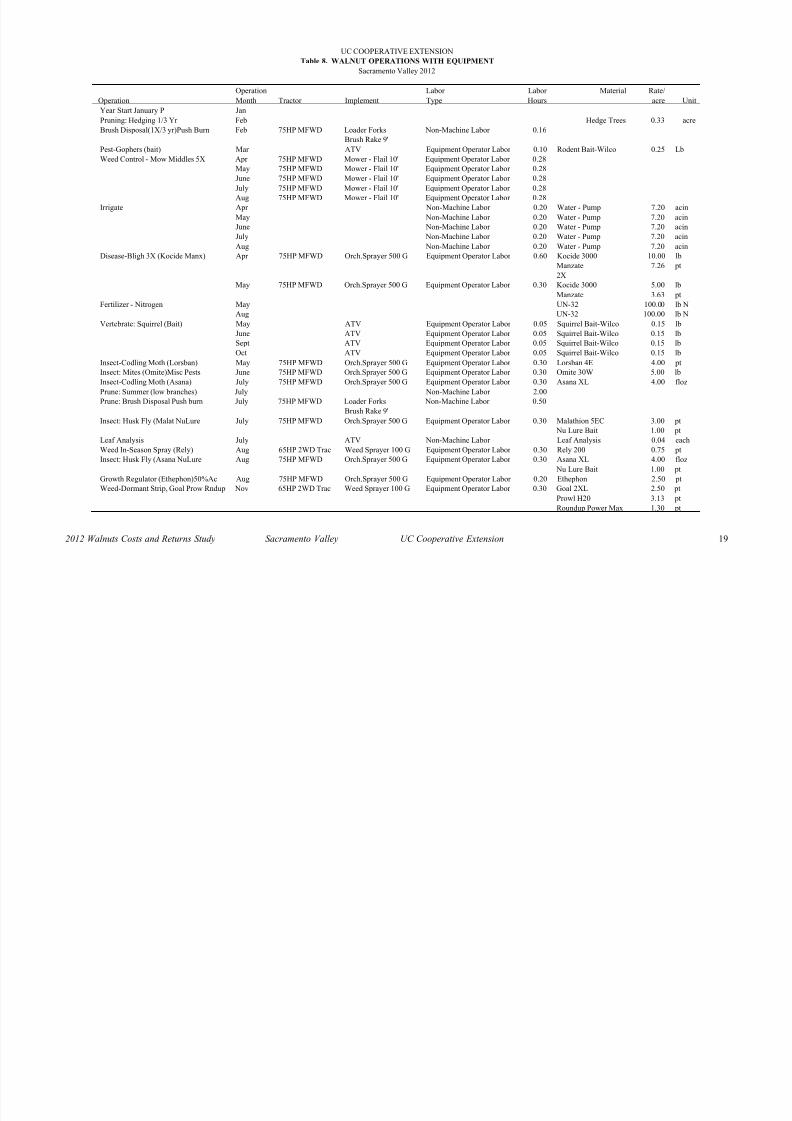
Table 8. WALNUT OPERATIONS WITH EQUIPMENT
Sacramento Valley 2012
Operation Labor Labor Material Rate/
Operation Month Tractor Implement Type Hours acre Unit
Year Start January P Jan
Pruning: Hedging 1/3 Yr Feb Hedge Trees 0.33 acre
Brush Disposal(1X/3 yr)Push Burn Feb 75HP MFWD Loader Forks Non-Machine Labor 0.16
Brush Rake 9'
Pest-Gophers (bait) Mar ATV Equipment Operator Labor 0.10 Rodent Bait-Wilco 0.25 Lb
Weed Control - Mow Middles 5X Apr 75HP MFWD Mower - Flail 10' Equipment Operator Labor 0.28
May 75HP MFWD Mower - Flail 10' Equipment Operator Labor 0.28
June 75HP MFWD Mower - Flail 10' Equipment Operator Labor 0.28
July 75HP MFWD Mower - Flail 10' Equipment Operator Labor 0.28
Aug 75HP MFWD Mower - Flail 10' Equipment Operator Labor 0.28
Irrigate Apr Non-Machine Labor 0.20 Water - Pump 7.20 acin
May Non-Machine Labor 0.20 Water - Pump 7.20 acin
June Non-Machine Labor 0.20 Water - Pump 7.20 acin
July Non-Machine Labor 0.20 Water - Pump 7.20 acin
Aug Non-Machine Labor 0.20 Water - Pump 7.20 acin
Disease-Bligh 3X (Kocide Manx) Apr 75HP MFWD Orch.Sprayer 500 G Equipment Operator Labor 0.60 Kocide 3000 10.00 lb
Manzate 7.26 pt
2X
May 75HP MFWD Orch.Sprayer 500 G Equipment Operator Labor 0.30 Kocide 3000 5.00 lb
Manzate 3.63 pt
Fertilizer - Nitrogen May UN-32 100.00 lb N
Aug UN-32 100.00 lb N
Vertebrate: Squirrel (Bait) May ATV Equipment Operator Labor 0.05 Squirrel Bait-Wilco 0.15 lb
June ATV Equipment Operator Labor 0.05 Squirrel Bait-Wilco 0.15 lb
Sept ATV Equipment Operator Labor 0.05 Squirrel Bait-Wilco 0.15 lb
Oct ATV Equipment Operator Labor 0.05 Squirrel Bait-Wilco 0.15 lb
Insect-Codling Moth (Lorsban) May 75HP MFWD Orch.Sprayer 500 G Equipment Operator Labor 0.30 Lorsban 4E 4.00 pt
Insect: Mites (Omite)Misc Pests June 75HP MFWD Orch.Sprayer 500 G Equipment Operator Labor 0.30 Omite 30W 5.00 lb
Insect-Codling Moth (Asana) July 75HP MFWD Orch.Sprayer 500 G Equipment Operator Labor 0.30 Asana XL 4.00 floz
Prune: Summer (low branches) July Non-Machine Labor 2.00
Prune: Brush Disposal Push burn July 75HP MFWD Loader Forks Non-Machine Labor 0.50
Brush Rake 9'
Insect: Husk Fly (Malat NuLure July 75HP MFWD Orch.Sprayer 500 G Equipment Operator Labor 0.30 Malathion 5EC 3.00 pt
Nu Lure Bait 1.00 pt
Leaf Analysis July ATV Non-Machine Labor Leaf Analysis 0.04 each
Weed In-Season Spray (Rely) Aug 65HP 2WD Trac Weed Sprayer 100 G Equipment Operator Labor 0.30 Rely 200 0.75 pt
Insect: Husk Fly (Asana NuLure Aug 75HP MFWD Orch.Sprayer 500 G Equipment Operator Labor 0.30 Asana XL 4.00 floz
Nu Lure Bait 1.00 pt
Growth Regulator (Ethephon)50%Ac Aug 75HP MFWD Orch.Sprayer 500 G Equipment Operator Labor 0.20 Ethephon 2.50 pt
Weed-Dormant Strip, Goal Prow Rndup Nov 65HP 2WD Trac Weed Sprayer 100 G Equipment Operator Labor 0.30 Goal 2XL 2.50 pt
Prowl H20 3.13 pt
Roundup Power Max 1.30 pt

8/20/2019 Walnuts v 2012
http://slidepdf.com/reader/full/walnuts-v-2012 20/20
2012 Walnuts Costs and Returns Study Sacramento Valley UC Cooperative Extension 20
UC COOPERATIVE EXTENSION
Table 8. Continue d
Sacramento Valley 2012
Operation Labor Labor Material Rate/
Operation Month Tractor Implement Type Hours acre Unit
Pickup Nov Pickup 1/2 Ton Equipment Operator Labor 1.20
ATV Use Nov ATV Equipment Operator Labor 2.40
Miscellaneous Labor Nov Non-Machine Labor 3.00
PCA Service Nov PCA Service 1.00 acreShake, Sweep, Pickup Sept Shake Sweep Pickup 1.00 acre
Hand Rake Sept Non-Machine Labor 1.50
Haul to Dryer Sept Non-Machine Labor Haul Nuts 2.70 ton
Hull, Dry Sept Dry/Hull Walnuts 5,400.00 lb
CWC Assessment Fee Sept CA Walnut Comm. 5,400.00 lb