Embed Size (px)
DESCRIPTION
walton on the naze
Citation preview
LV Fieldtrip to Walton-on-the-Naze
The Hypothesis is:
‘The coastal management at Walton-on-the-Naze has disturbed the natural balance of the
coastline’.

Aims of the project
1. To investigate the coastal processes at work at two contrasting sites - North (unprotected) and South (coastal defences constructed).
2. To identify and evaluate the coastal protection strategies employed at Walton.
3. To classify the land use at both sites and to evaluate the appropriateness of the management techniques.
4. To determine whether the coastal protection scheme has had a positive or negative impact on the local area.
5. To ascertain how the hypothesis affects these key terms: Hard and soft engineering, managed retreat, natural balance and physical processes

Where is Walton-on-the-Naze?
Walton is 66 miles from Chigwell and has a population of 6,000 people.
Introducing the 2 sites at
Walton-on-the-Naze
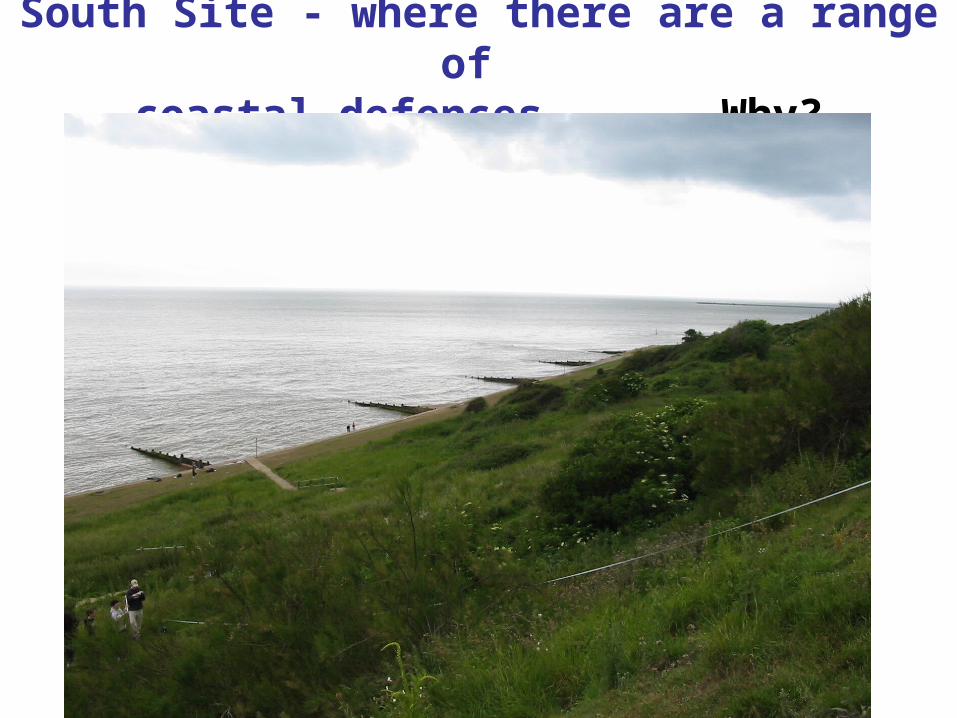
South Site - where there are a range of coastal defences. Why?
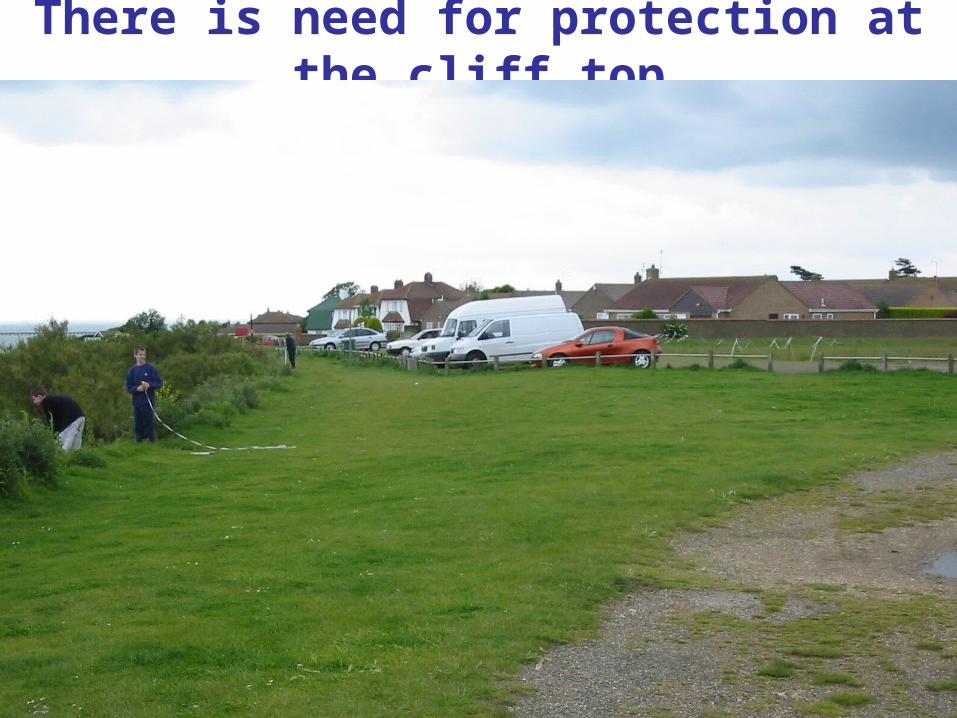
There is need for protection at the cliff top

North Site - where there are no coastal defencesErosion here is more than 1 metre a year and ifthis rate continues the Naze will be eroded in approx. 100 years.
The management of the South site has interupted Longshore Drift processes at the North site. This has kept the beach at the North site narrow. How does this increase erosion?
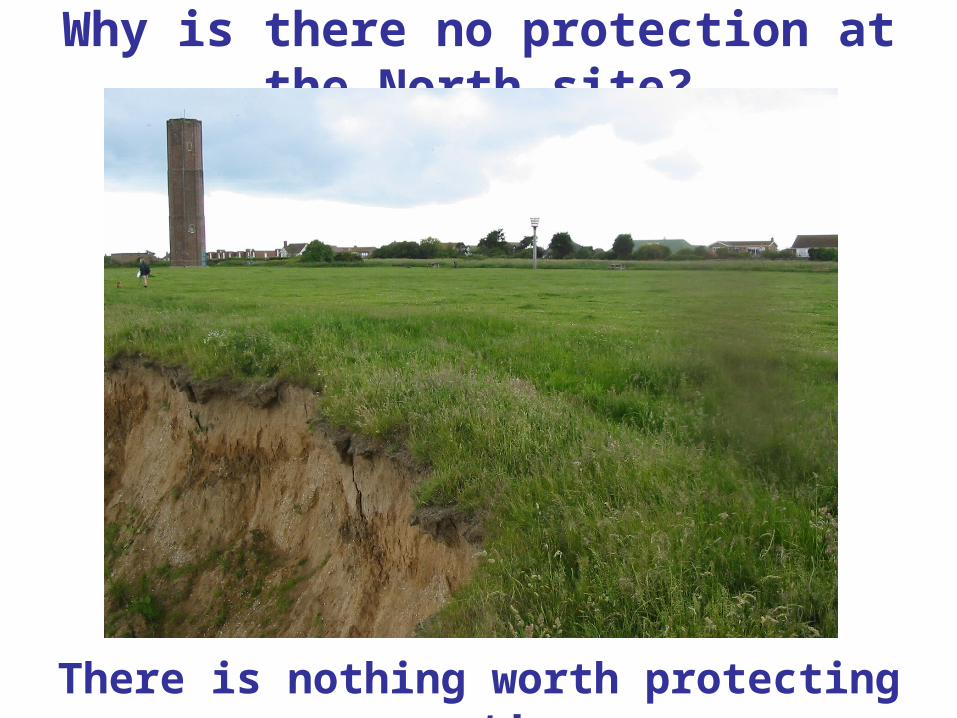
Why is there no protection at the North site?
There is nothing worth protecting yet!
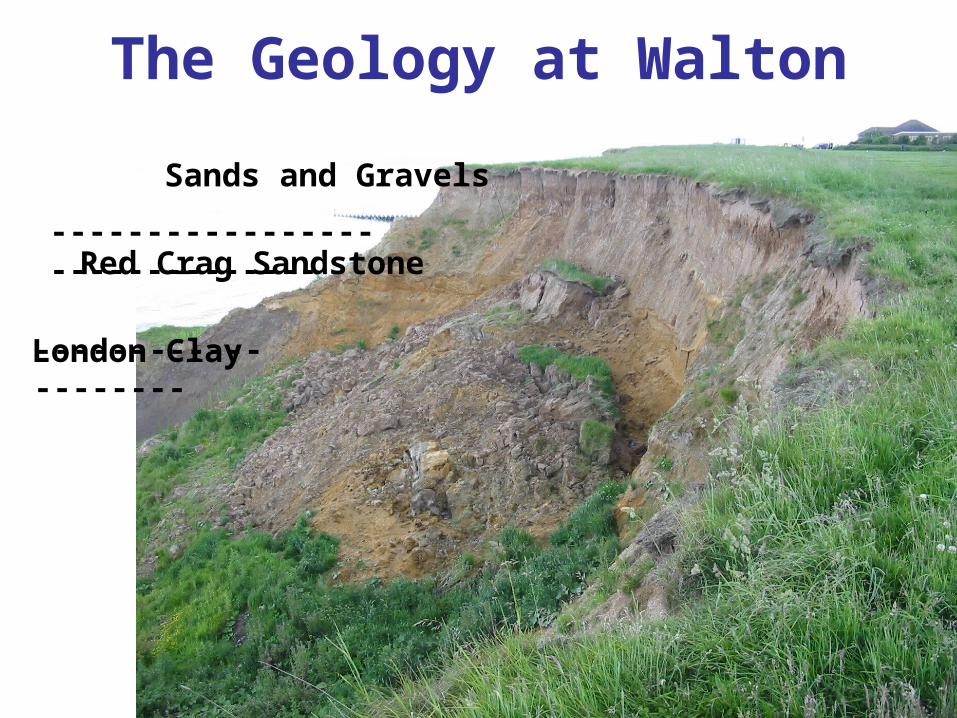
The Geology at Walton
Sands and Gravels
Red Crag Sandstone
London Clay
-------------------------------
--------------------

Sands and Gravels - around 100,000 - 10,000 years old and was laid down during the last Ice Age.
Red Crag Sandstone - This was laid down during the Pleistocene era and was originally formed under the sea. Thegrains are large for sand and this suggests it was formednearer the coast.
London Clay - This rock type was laid down during the Eoceneera around 65 million years ago. It was formed in a warm shallow sea and this suggests that Britain was nearer the Equator at this time! The particles are fine and this suggeststhe rock type was formed further out to sea. There are fossilscontained in this clay.
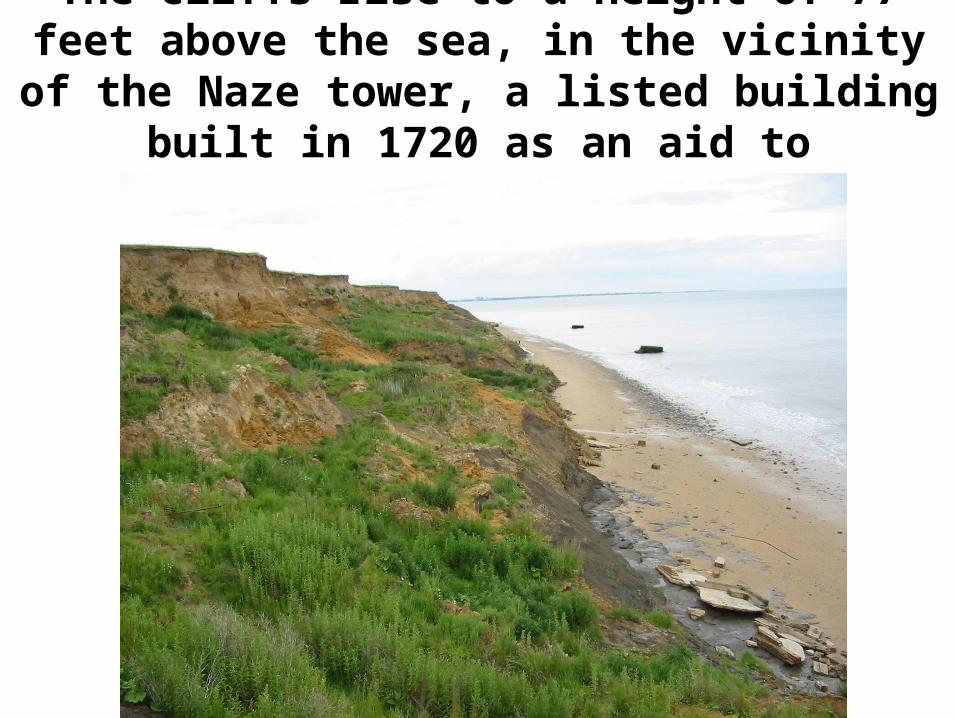
The cliffs rise to a height of 77 feet above the sea, in the vicinity of the Naze tower, a listed building built
in 1720 as an aid to navigation.
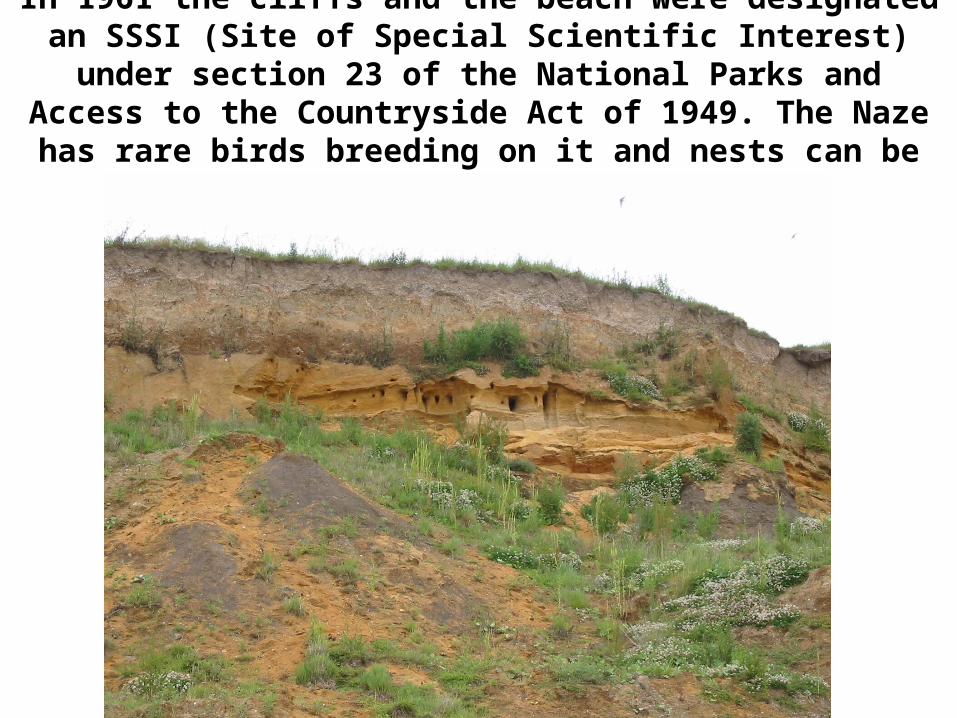
In 1961 the cliffs and the beach were designated an SSSI (Site of Special Scientific Interest) under section 23 of the National Parks
and Access to the Countryside Act of 1949. The Naze has rare birds breeding on it and nests can be seen in this slide

Methods of Data Collection
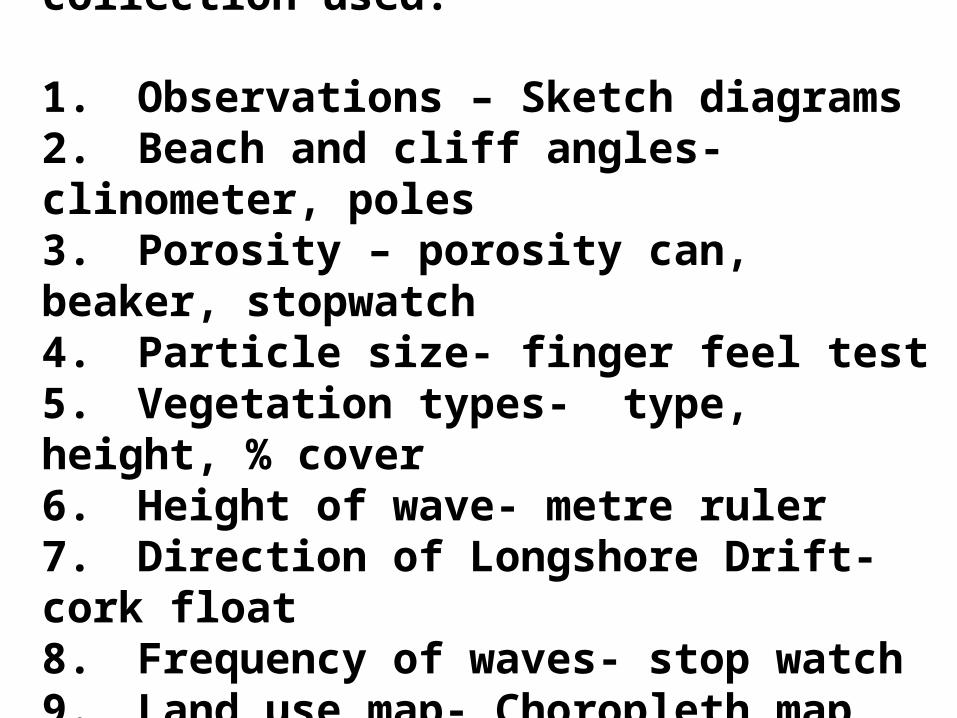
A list of the methods of data collection used:
1. Observations – Sketch diagrams2. Beach and cliff angles- clinometer, poles3. Porosity – porosity can, beaker, stopwatch4. Particle size- finger feel test5. Vegetation types- type, height, % cover6. Height of wave- metre ruler7. Direction of Longshore Drift- cork float8. Frequency of waves- stop watch9. Land use map- Choropleth map10. Quality of Land- E.Q.I

How did we measure the beach and cliff angles?

How did we measure the porosity of the beach?

How did we measure the particle size?
At each ranging pole we measured the long axis of the material
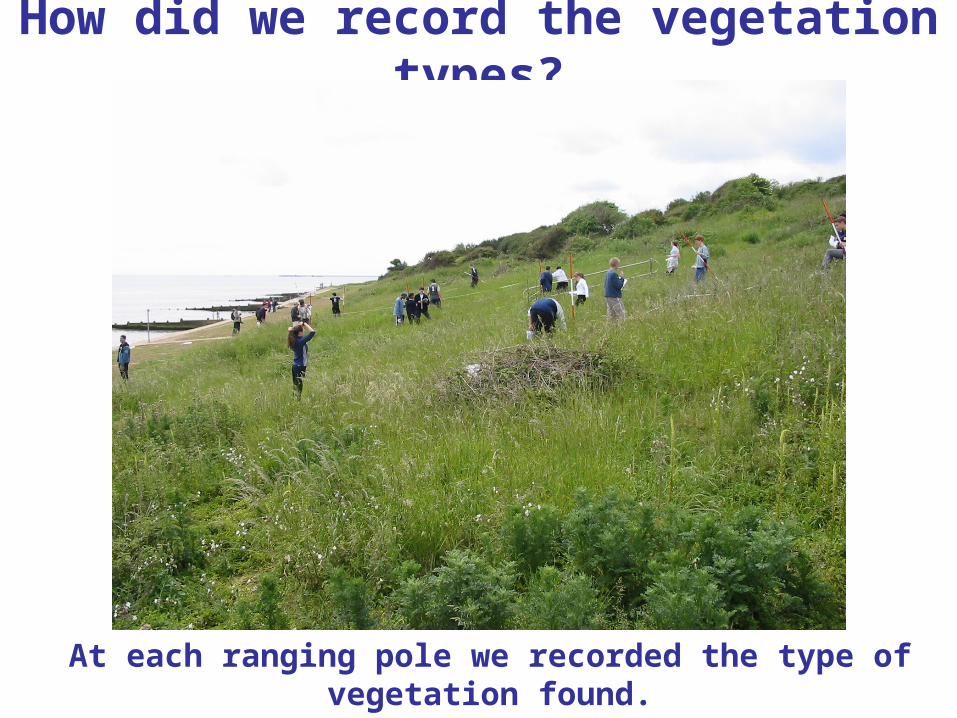
How did we record the vegetation types?
At each ranging pole we recorded the type of vegetation found.Whether it was grass, mud, brambles, bushes, trees etc…

How did we measure the height of a wave?
We used a metre rule to measure between a wave trough and a crest
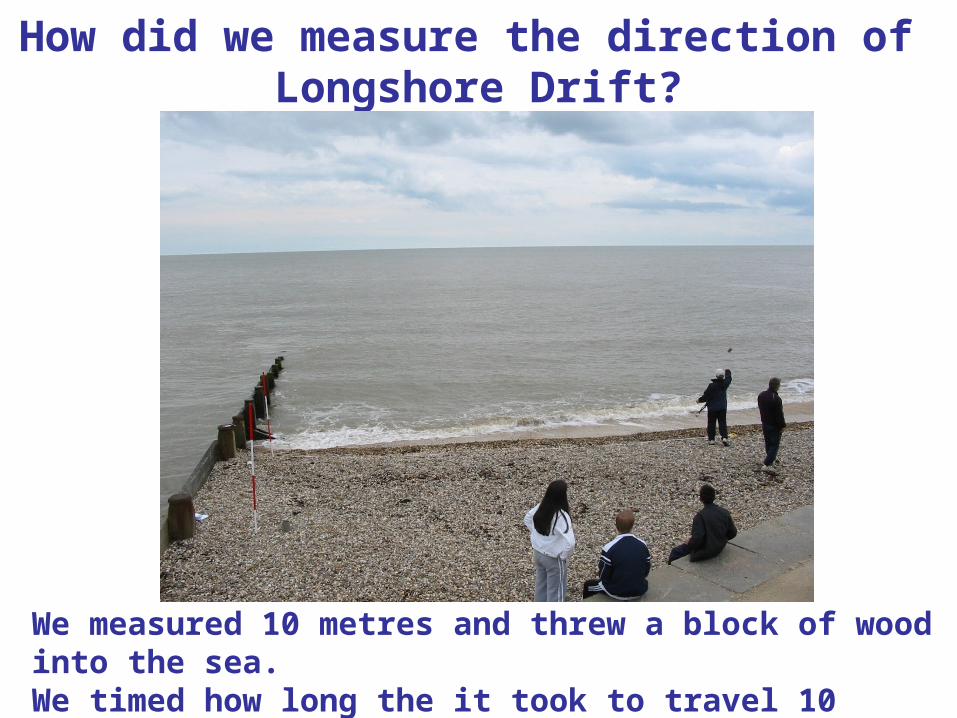
How did we measure the direction of Longshore Drift?
We measured 10 metres and threw a block of wood into the sea. We timed how long the it took to travel 10 metres and recorded the direction.
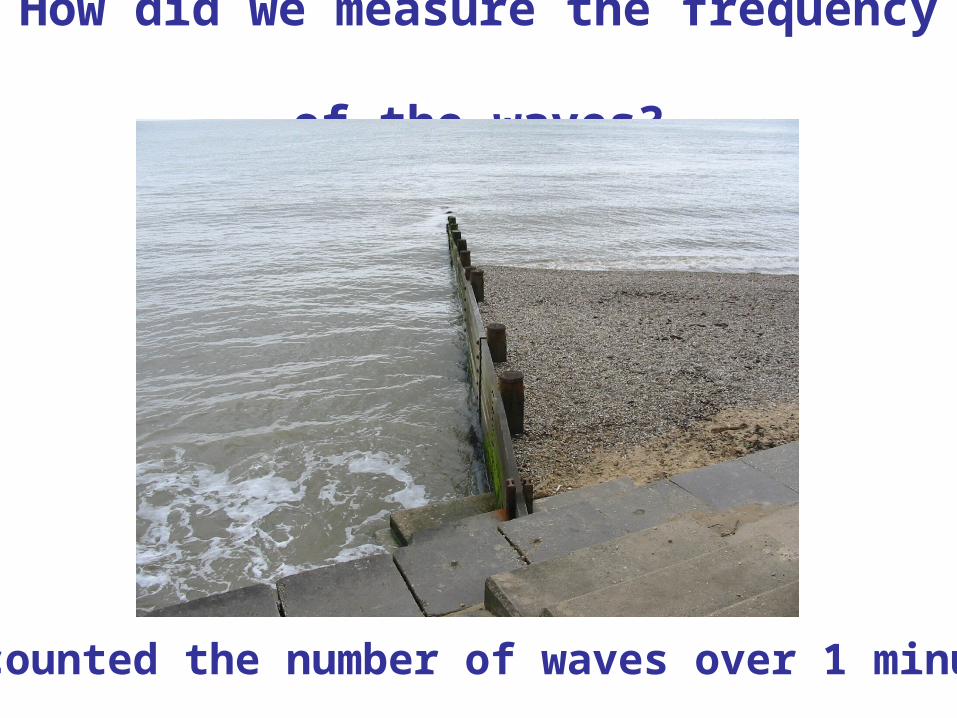
How did we measure the frequency of the waves?
We counted the number of waves over 1 minute
Environmental Quality Surveys
Land Use Maps
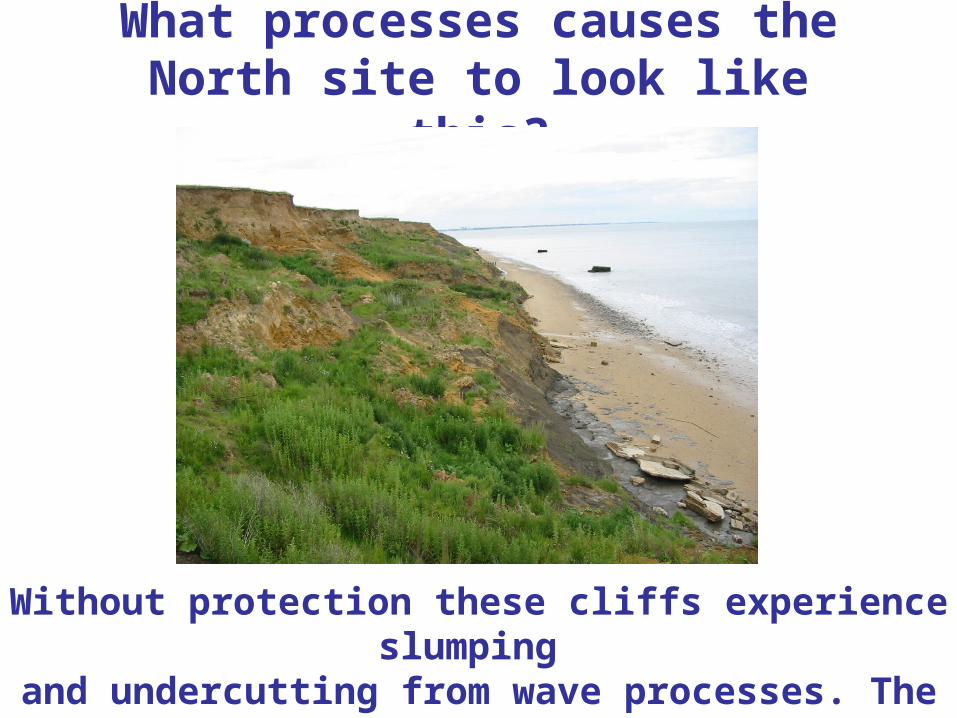
What processes causes the North site to look like this?
Without protection these cliffs experience slumping and undercutting from wave processes. The beach is very narrow so the waves can easily reach the base of the cliff.
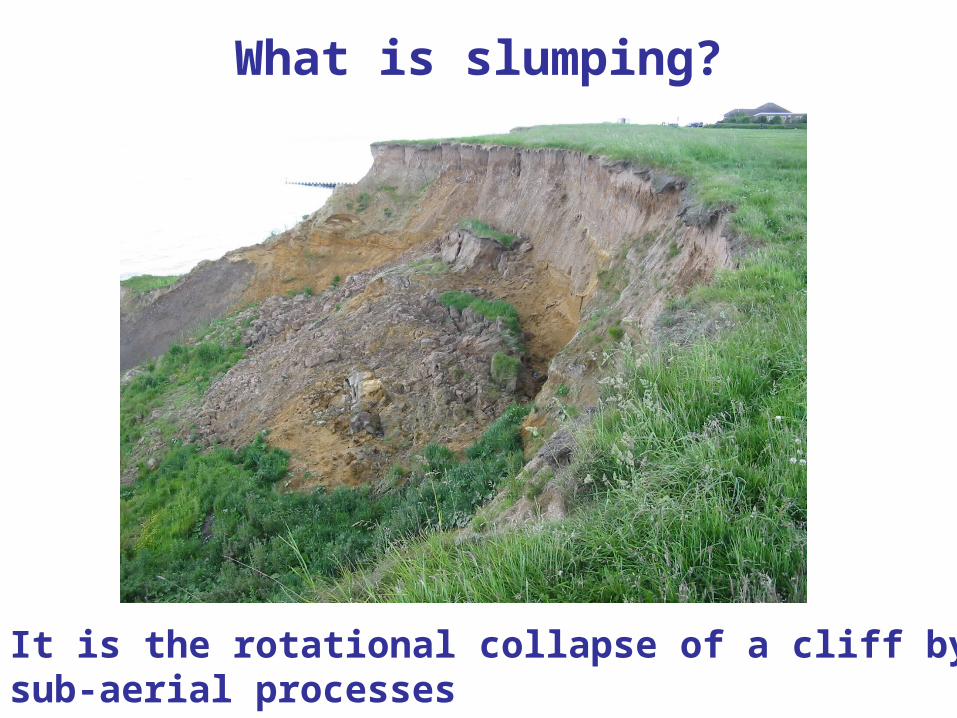
What is slumping?
It is the rotational collapse of a cliff by sub-aerial processes
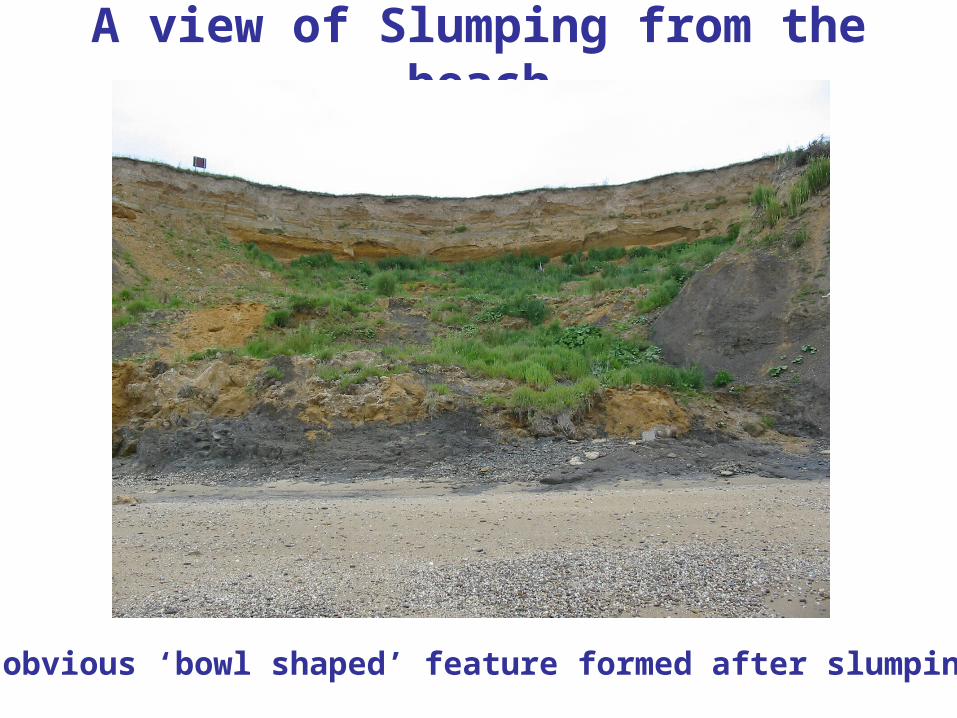
A view of Slumping from the beach
An obvious ‘bowl shaped’ feature formed after slumping
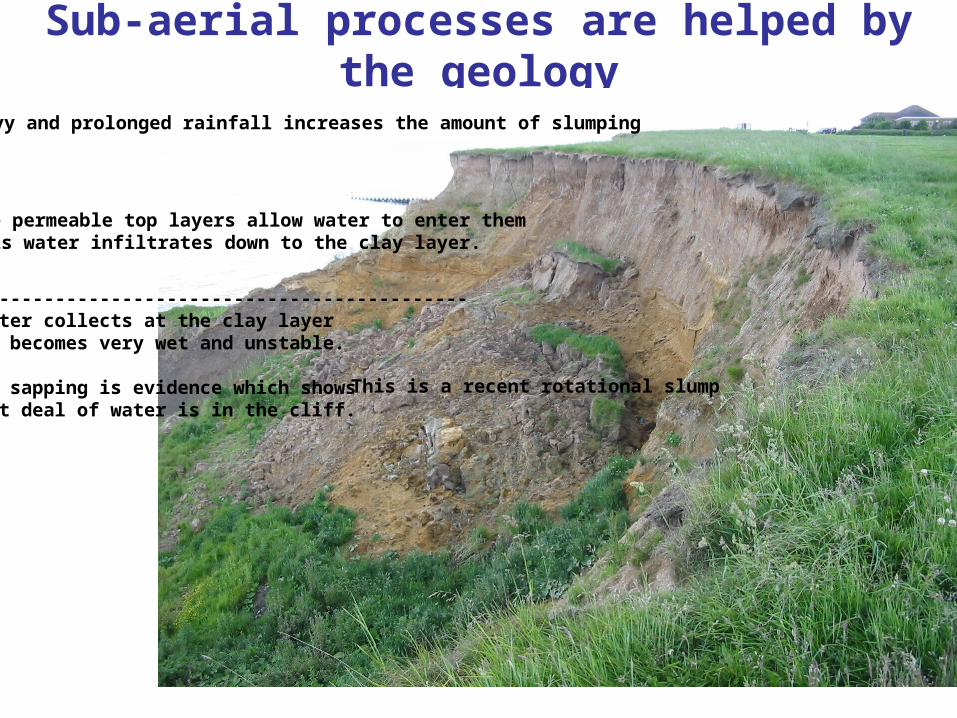
Sub-aerial processes are helped by the geology
The permeable top layers allow water to enter themThis water infiltrates down to the clay layer.
------------------------------------------------The water collects at the clay layerand it becomes very wet and unstable.
Spring sapping is evidence which shows a great deal of water is in the cliff.
This is a recent rotational slump
Heavy and prolonged rainfall increases the amount of slumping
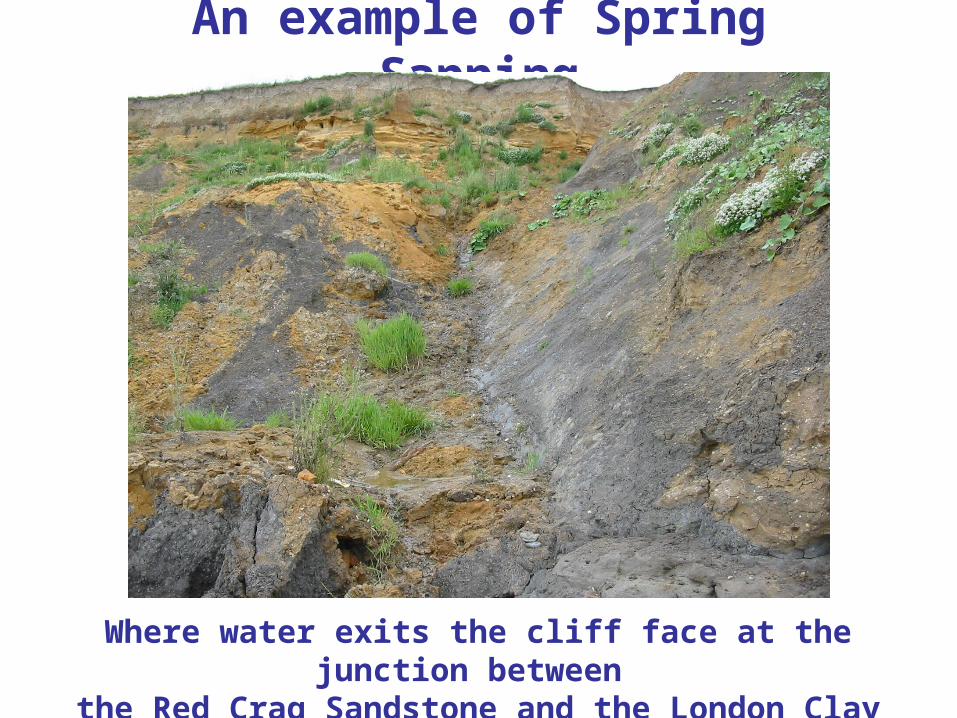
An example of Spring Sapping
Where water exits the cliff face at the junction between the Red Crag Sandstone and the London Clay layer.

Results

North Site Beach Results
Distance Angle Particle size Porosity from sea (secs)
0 3 clay saturated5 3 clay 32510 5 sand 14315 6 sand 12620 4 sand/shingle 11525 6 sand 9230 7 sand 7635 8 sand/shingle 44

South Site Beach and Cliff ResultsDistance Angle Particle size Porosity from sea (secs)
0 3 sand 2955 4 sand 20610 4 sand 13415 5 shingle 4020 7 shingle 3725 7 shingle 20SEAWALL_____________________________________________30 9 mud35 12 Short grass40 14 Short grass45 15 Long grass50 18 Bushes55 18 Brambles60 18 Short trees65 4 Grass (Path)70 38 Brambles75 38 Brambles
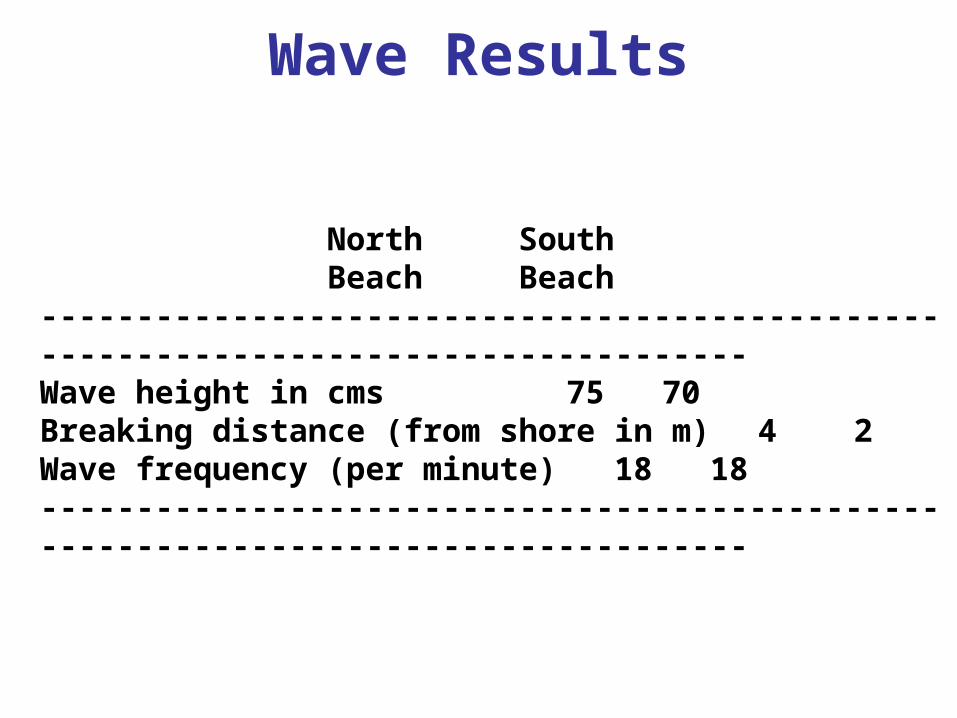
Wave Results
North SouthBeach Beach
------------------------------------------------------------------------------------Wave height in cms 75 70Breaking distance (from shore in m) 4 2Wave frequency (per minute) 18 18------------------------------------------------------------------------------------
Longshore Drift Measurements
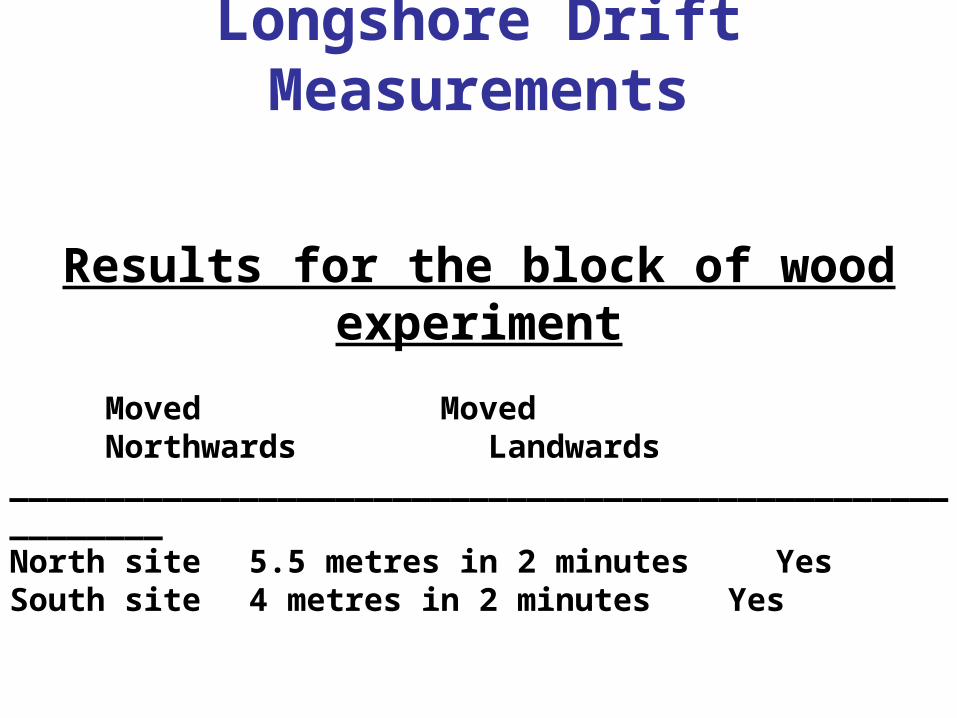
Results for the block of wood experiment
Moved MovedNorthwards Landwards
_________________________________________________________
North site 5.5 metres in 2 minutes YesSouth site 4 metres in 2 minutes Yes

Coastal Management Strategies
There are 4 options available to protect the coast. The options are different when considering whether protection is against marine or sub-aerial processes.
(a) Hard Engineering - examples include groynes, seawalls, rip rap, revetements
etc(b) Soft Engineering - examples include encouraging
vegetation, regrading of the slope, beach rebuilding etc…
(c) Managed Retreat(d) Do Nothing
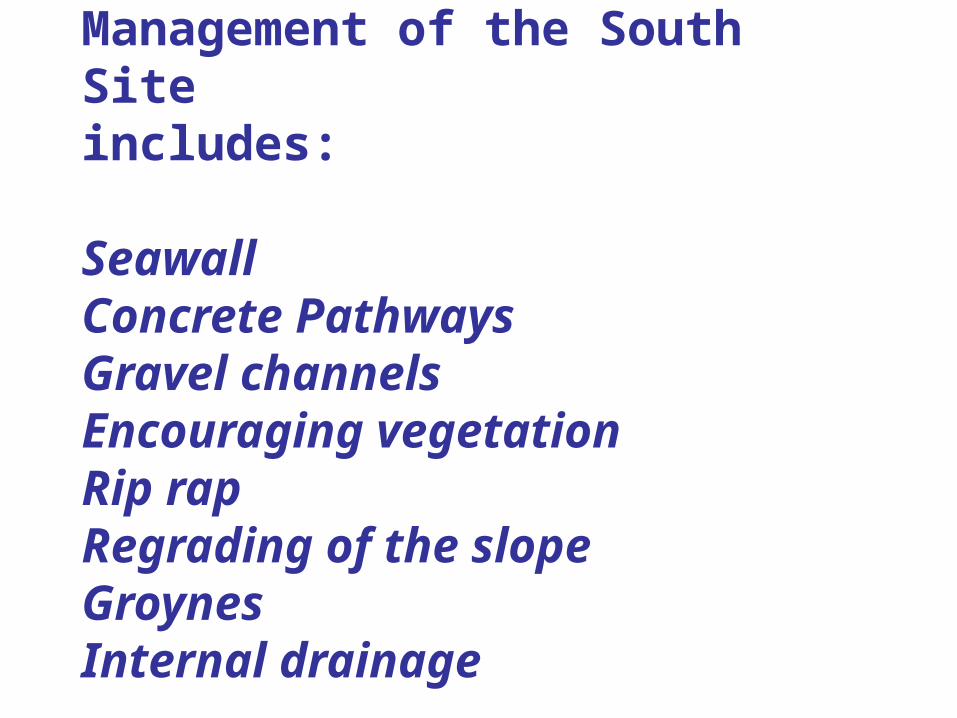
Management of the South Siteincludes:
SeawallConcrete PathwaysGravel channelsEncouraging vegetationRip rapRegrading of the slopeGroynesInternal drainage
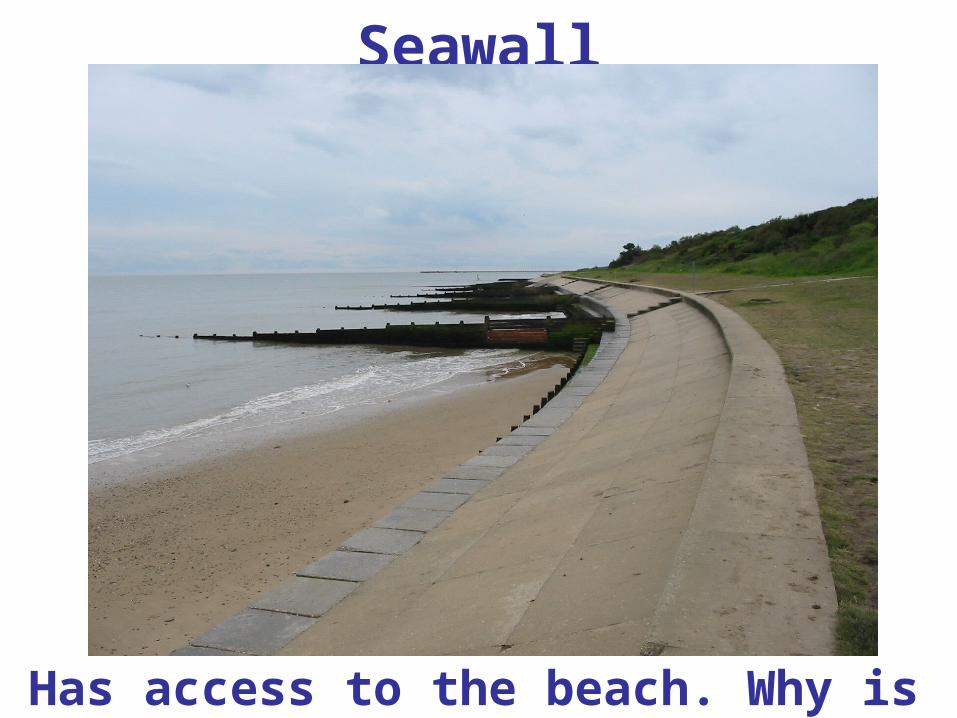
Seawall
Has access to the beach. Why is it at an angle?
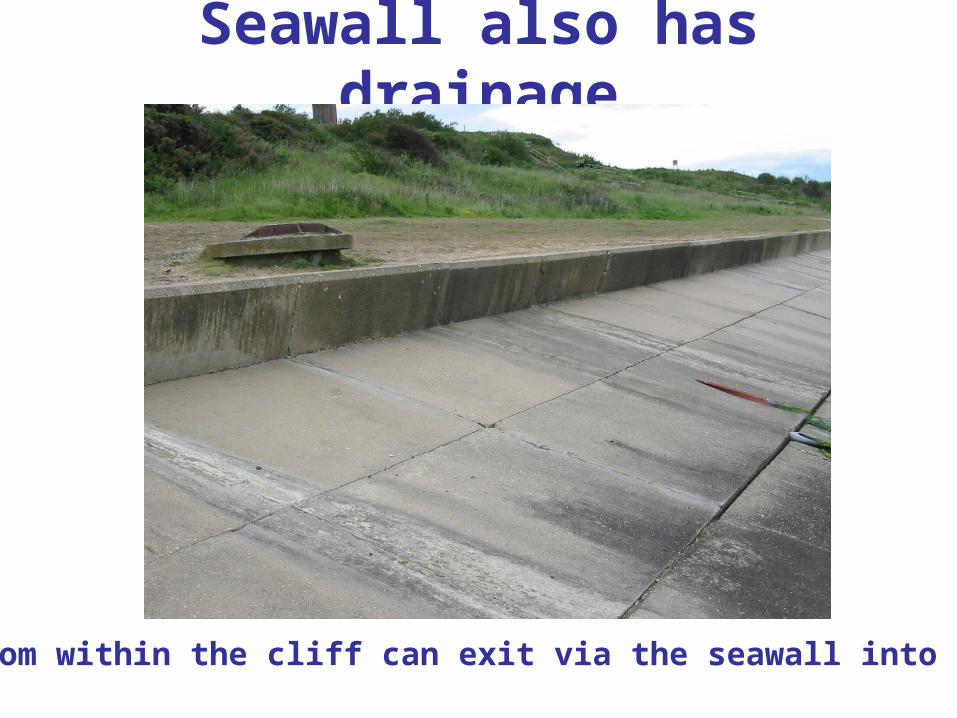
Seawall also has drainage
Water from within the cliff can exit via the seawall into the sea.
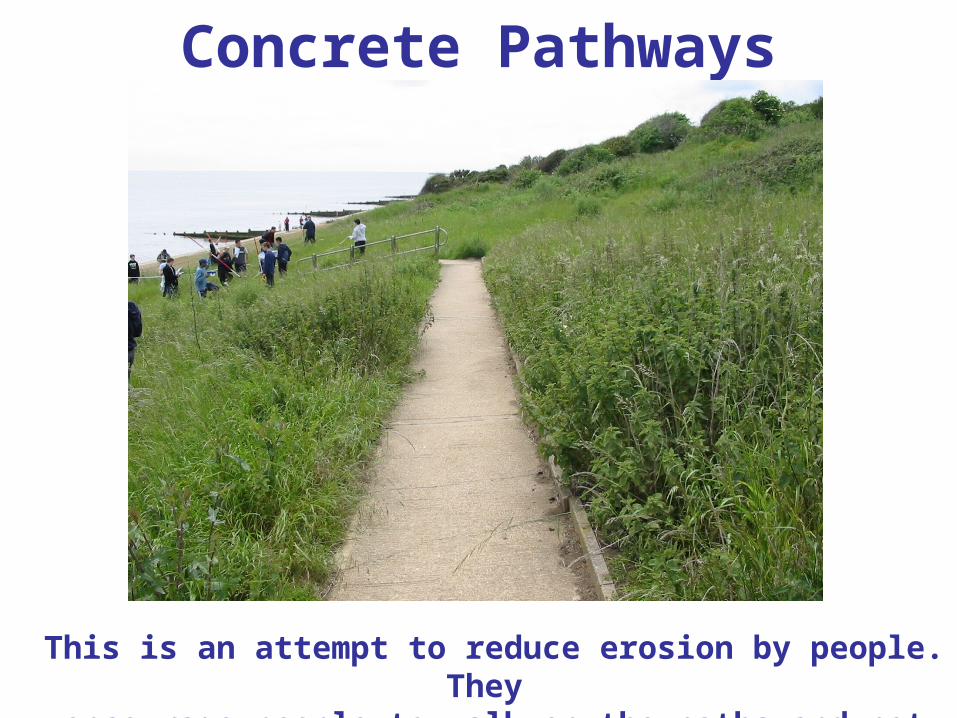
Concrete Pathways
This is an attempt to reduce erosion by people. They encourage people to walk on the paths and not on the slope.
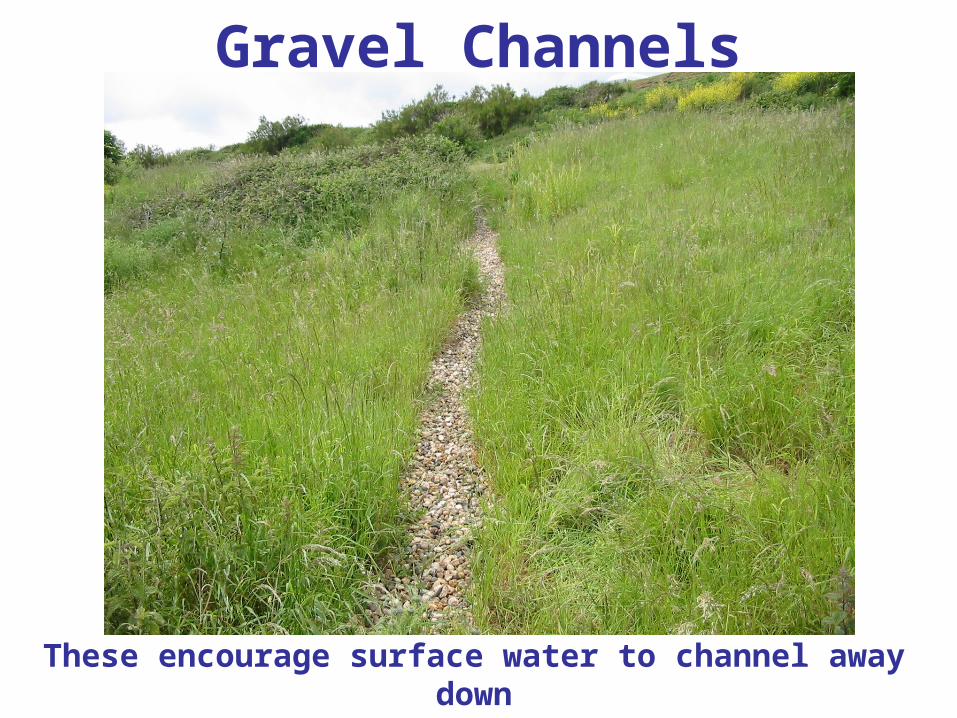
Gravel Channels
These encourage surface water to channel away down the slope and not infiltrate which may cause slumping.
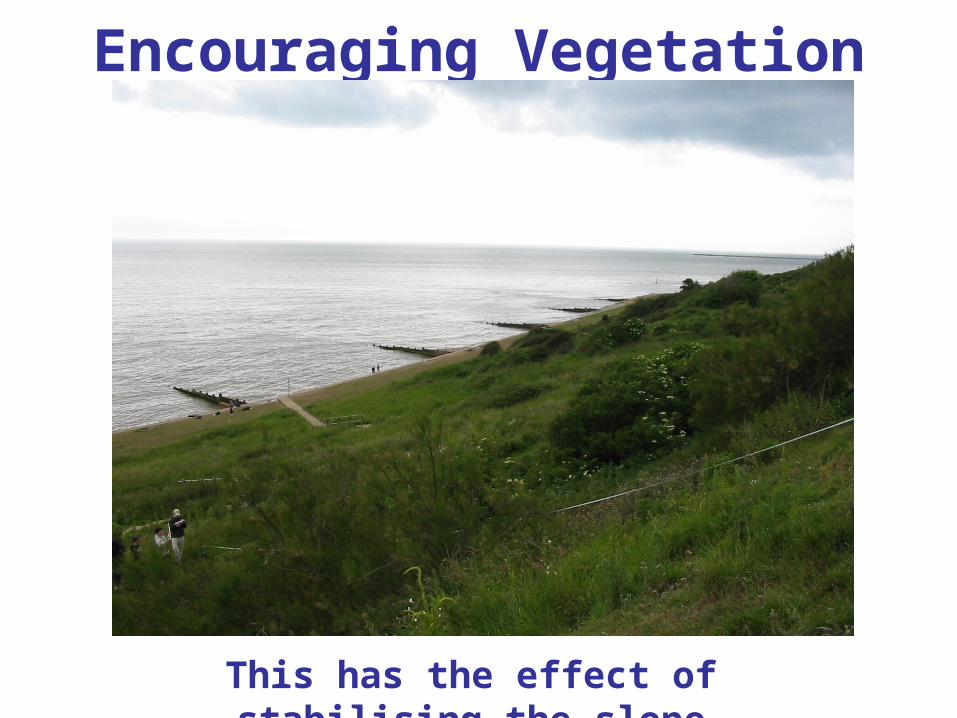
Encouraging Vegetation
This has the effect of stabilising the slope

Rip Rap
This was built in 1998 from 300 tons of Leicestershire Granite. It cost £167,000.
It acts as a barrier to erosion.
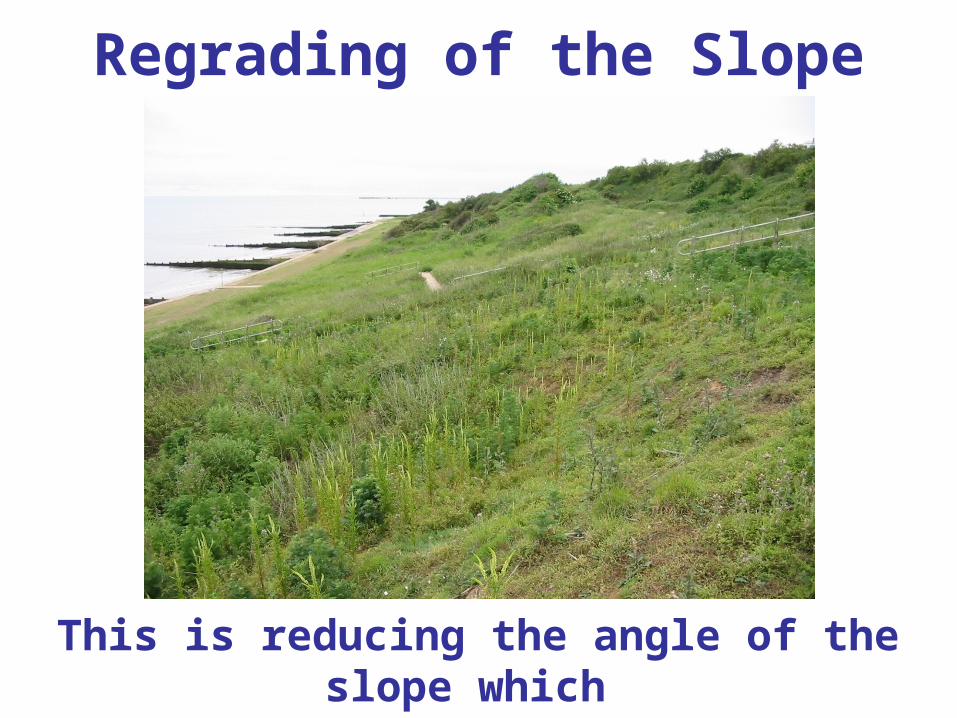
Regrading of the Slope
This is reducing the angle of the slope which has the effect of making it more stable.

Groynes
These structures keep the beach in place by halting Longshore Drift. A beach can then help to protect the cliff by acting as a barrier to the waves.

Internal Drainage
This enables access within the cliff to pump out excess water therefore reducing the liklehood of slumping.
Erosion Processes
(a) Corrasion(b) Attrition(c) Solution(d) Hydraulic Action(e) Wave Pounding(f) Sub-aerial Processes(g) Man
Factors Which Affect The Rate Of Erosion(a) Beach width(b) Angle of dip(c) Breaking distance of the wave(d) Geology of cliffs(e) Length and direction of fetch

Analysis of Results
Ask yourself the question -
What are the reasons for the results collected?

![[Naze Culture & Communlty Center, Arnaml City!!] ICC (B ... · [Naze Culture & Communlty Center, Arnaml City!!] ICC (B) : 00—5 : 00 0997-52-1816 (FAX) 0997-57-0507 (E-mail) naze-kouminkan@wateraocn.neajp](https://img.pdfslide.net/doc/110x75/5e894c530ee66d27a61bd53a/naze-culture-communlty-center-arnaml-city-icc-b-naze-culture-.jpg)