Embed Size (px)
Citation preview

Ware County High Ware County High SchoolSchool
State of the School AddressState of the School Address
Dr. Tim DixonDr. Tim Dixon

IntroductionsIntroductions►Cornerstone Principal – Susan ZeiglerCornerstone Principal – Susan Zeigler►CHAPS Principal – Sonya MixonCHAPS Principal – Sonya Mixon►TIME Principal – Lee RobertsonTIME Principal – Lee Robertson►Ware A&M Principal – Henry AcreeWare A&M Principal – Henry Acree


Where we Where we are . . .are . . .

ELA AMOELA AMO YearYear 3rd-8th3rd-8th 9th-12th9th-12th
20042004 6060 81.681.6
20052005 66.766.7 81.681.6
20062006 66.766.7 84.784.7
20072007 66.766.7 84.784.7
20082008 73.373.3 87.787.7
20092009 73.373.3 87.787.7
20102010 73.373.3 87.787.7
20112011 8080 90.890.8
20122012 86.786.7 93.993.9
20132013 93.393.3 96.996.9
20142014 100100 100100

Where we were in Where we were in ELAELA
AllAll BlackBlack WhiteWhite SWDSWD EDED
04-0504-05 83.383.3 73.773.7 91.391.3 26.726.7 73.473.4
05-0605-06 84.084.0 74.574.5 90.290.2 47.447.4 76.176.1
06-0706-07 89.789.7 88.088.0 90.290.2 50.050.0 83.983.9
07-0807-08 88.788.7 86.086.0 91.091.0 43.543.5 84.184.1
08-0908-09 88.488.4 79.879.8 93.593.5 69.069.0 84.884.8
09-1009-10 84.384.3 73.973.9 90.890.8 48.148.1 77.177.1

Where are we now?Where are we now?AllAll BlackBlack WhiteWhite SWDSWD EDED
04-0504-05 83.383.3 73.773.7 91.391.3 26.726.7 73.473.4
05-0605-06 84.084.0 74.574.5 90.290.2 47.447.4 76.176.1
06-0706-07 89.789.7 88.088.0 90.290.2 50.050.0 83.983.9
07-0807-08 88.788.7 86.086.0 91.091.0 43.543.5 84.184.1
08-0908-09 88.488.4 79.879.8 93.593.5 69.069.0 84.884.8
09-1009-10 84.384.3 73.973.9 90.890.8 48.148.1 77.177.1
10-1110-11 92.892.8 88.288.2 96.096.0 59.459.4 89.989.9
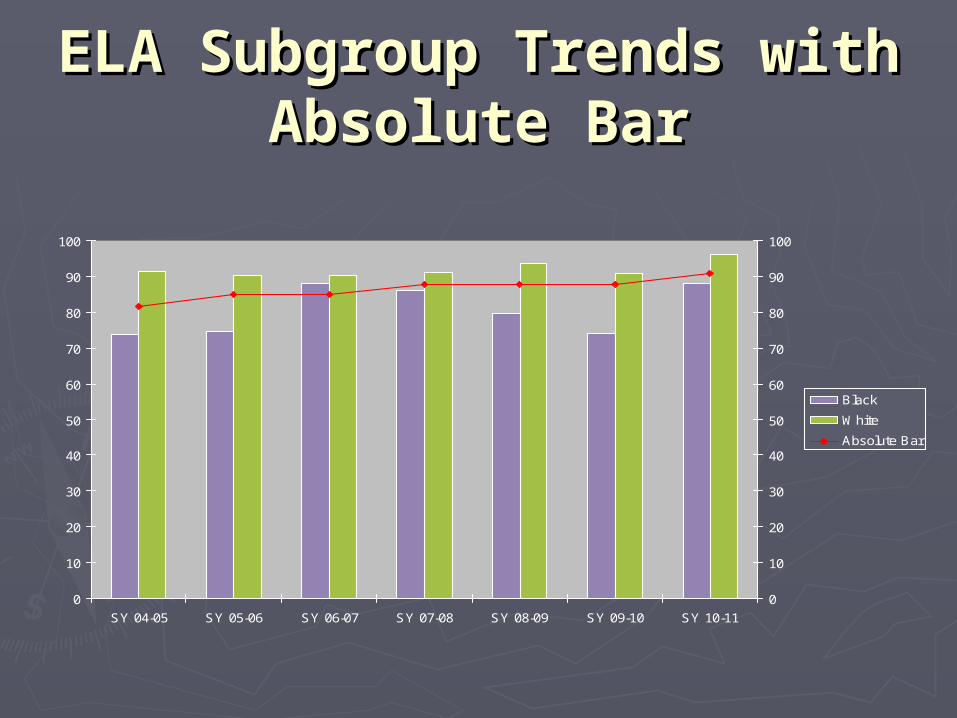
ELA Subgroup Trends with ELA Subgroup Trends with Absolute BarAbsolute Bar
0
10
20
30
40
50
60
70
80
90
100
SY 04-05 SY 05-06 SY 06-07 SY 07-08 SY 08-09 SY 09-10 SY 10-11
0
10
20
30
40
50
60
70
80
90
100
Black
White
Absolute Bar

Math AMOMath AMOYearYear 3rd-8th3rd-8th 9th-12th9th-12th
20042004 5050 62.362.3
20052005 58.358.3 62.362.3
20062006 58.358.3 68.668.6
20072007 58.358.3 68.668.6
20082008 59.559.5 74.974.9
20092009 59.559.5 74.974.9
20102010 6767 74.974.9
20112011 75.775.7 81.481.4
20122012 83.883.8 87.487.4
20132013 91.991.9 93.793.7
20142014 100100 100100

Where we were in Where we were in MathMath
AllAll BlackBlack WhiteWhite SWDSWD EDED
04-0504-05 57.857.8 39.839.8 7272 24.124.1 43.143.1
05-0605-06 62.862.8 45.345.3 75.275.2 31.631.6 48.548.5
06-0706-07 6666 53.953.9 72.272.2 25.925.9 55.755.7
07-0807-08 71.971.9 63.463.4 78.178.1 30.430.4 66.466.4
08-0908-09 71.971.9 59.659.6 77.977.9 37.937.9 60.060.0
09-1009-10 64.564.5 45.045.0 76.676.6 22.222.2 54.854.8

Where are we now?Where are we now?AllAll BlackBlack WhiteWhite SWDSWD EDED
04-0504-05 57.857.8 39.839.8 7272 24.124.1 43.143.1
05-0605-06 62.862.8 45.345.3 75.275.2 31.631.6 48.548.5
06-0706-07 6666 53.953.9 72.272.2 25.925.9 55.755.7
07-0807-08 71.971.9 63.463.4 78.178.1 30.430.4 66.466.4
08-0908-09 71.971.9 59.659.6 77.977.9 37.937.9 60.060.0
09-1009-10 64.564.5 45.045.0 76.676.6 22.222.2 54.854.8
10-1110-11 87.987.9 80.580.5 94.094.0 53.153.1 83.683.6

Math Subgroup Trends Math Subgroup Trends with Absolute Barwith Absolute Bar
0
10
20
30
40
50
60
70
80
90
100
SY 04-05 SY 05-06 SY 06-07 SY 07-08 SY 08-09 SY 09-10 SY10-11
0
10
20
30
40
50
60
70
80
90
100
Black
White
Absolute Bar

Where we were with Where we were with Graduation RateGraduation RateAllAll BlackBlack WhiteWhite SWDSWD EDED
04-0504-05 45.145.1 31.131.1 54.554.5 8.98.9 31.031.0
05-0605-06 57.457.4 50.050.0 61.561.5 15.515.5 43.343.3
06-0706-07 58.958.9 49.749.7 66.766.7 16.716.7 41.541.5
07-0807-08 59.359.3 51.651.6 64.264.2 27.427.4 46.246.2
08-0908-09 73.673.6 73.973.9 73.973.9 38.038.0 66.266.2
09-1009-10 67.867.8 66.066.0 69.169.1 28.928.9 58.258.2

Where are we now?Where are we now?AllAll BlackBlack WhiteWhite SWDSWD EDED
04-0504-05 45.145.1 31.131.1 54.554.5 8.98.9 31.031.0
05-0605-06 57.457.4 50.050.0 61.561.5 15.515.5 43.343.3
06-0706-07 58.958.9 49.749.7 66.766.7 16.716.7 41.541.5
07-0807-08 59.359.3 51.651.6 64.264.2 27.427.4 46.246.2
08-0908-09 73.673.6 73.973.9 73.973.9 38.038.0 66.266.2
09-1009-10 67.867.8 66.066.0 69.169.1 28.928.9 58.258.2
10-1110-11 80.180.1 76.176.1 82.982.9 50.050.0 78.878.8

ELA GHSGT ComparisonELA GHSGT Comparisonin RESA Districtin RESA District
2011 2011 Pass Pass RateRate
Total Total Test Test
TakersTakers
BlackBlack HisHis WhiteWhite SWDSWD EDED
PiercePierce 96%96% 202088
2626 169169 1313 107107
WareWare 94%94% 272733
9898 162162 2525 132132
ClinchClinch 93%93% 7575 3333 4242 1111 5454CoffeeCoffee 90%90% 4444
55147147 6363 225225 3838 280280
AtkinsoAtkinsonn
89%89% 101000
1717 2424 5959 100100
BrantleBrantleyy
88%88% 191911
182182 2020 8484
BaconBacon 87%87% 9999 2424 7070 4848CharltoCharltonn
81%81% 121288
4343 8383 1616 7373

Math GHSGT Comparison Math GHSGT Comparison in RESA Districtin RESA District
2011 2011 Pass Pass RateRate
Total Total Test Test
TakersTakers
BlackBlack HisHis WhiteWhite SWDSWD EDED
PiercePierce 94%94% 202088
2626 169169 1313 107107
WareWare 93%93% 272755
100100 162162 2626 134134
BaconBacon 89%89% 9999 2424 7070 4848ClinchClinch 88%88% 7373 3333 4242 1111 5454BrantleBrantleyy
83%83% 191911
182182 2020 8484
CharltoCharltonn
81%81% 121288
4343 8383 1616 7373
CoffeeCoffee 81%81% 444455
147147 6363 225225 3838 280280
AtkinsoAtkinsonn
70%70% 101000
1717 2424 7979 100100

Social Studies GHSGT Social Studies GHSGT Comparison Comparison
in RESA Districtin RESA District2011 2011 Pass Pass RateRate
Total Total Test Test
TakersTakers
BlackBlack HisHis WhiteWhite SWDSWD EDED
PiercePierce 89%89% 202088
2626 169169 1313 107107
ClinchClinch 87%87% 7575 3333 4242 1111 5454WareWare 84%84% 2727
55100100 162162 2626 134134
AtkinsoAtkinsonn
76%76% 101000
1717 2424 5959 100100
BaconBacon 76%76% 9999 2424 7070 4848BrantleBrantleyy
74%74% 191911
182182 2020 8484
CoffeeCoffee 70%70% 444455
147147 6363 225225 3838 280280
CharltoCharltonn
65%65% 121288
4343 8383 1616 7373

Science GHSGT ComparisonScience GHSGT Comparisonin RESA Districtin RESA District
2011 2011 Pass Pass RateRate
Total Total Test Test
TakersTakers
BlackBlack HisHis WhiteWhite SWDSWD EDED
PiercePierce 97%97% 202088
2626 169169 1313 107107
AtkinsoAtkinsonn
96%96% 101000
1717 2424 5959 100100
BaconBacon 96%96% 9999 2424 7070 4848WareWare 95%95% 2727
339898 162162 2525 132132
CoffeeCoffee 94%94% 444455
147147 6363 225225 3838 280280
CharltoCharltonn
93%93% 121288
4343 8383 1616 7373
ClinchClinch 93%93% 7575 3333 4242 1111 5454BrantleBrantleyy
91%91% 191911
182182 2020 8484

Now, for the EXCITING Now, for the EXCITING NEWS…NEWS…
►We have been ranked 27We have been ranked 27thth in in the state of Georgia by district the state of Georgia by district for all high schoolsfor all high schools
►Ware County is one of only 23 Ware County is one of only 23 systems in the state of Georgia systems in the state of Georgia to make AYPto make AYP

More Exciting News…More Exciting News…
►Only ten high schools in Georgia who Only ten high schools in Georgia who were designated as NI for last year made were designated as NI for last year made AYP this year – WCHS is one of those ten!AYP this year – WCHS is one of those ten!
►Of those ten, WCHS was the Of those ten, WCHS was the onlyonly school school to have to reach the benchmark in 5 to have to reach the benchmark in 5 specific areas to make AYP – and we did specific areas to make AYP – and we did it!!!it!!!
►We were one of only three schools to We were one of only three schools to make AYP who had to overcome all three make AYP who had to overcome all three AYP indicators.AYP indicators.

How did we get How did we get
here?here?

► RtIRtI► Integration of CTAE and Academic ClassesIntegration of CTAE and Academic Classes► Small Learning Communities through Small Learning Communities through
Talent DevelopmentTalent Development► Standards Based ClassroomStandards Based Classroom► CLASS KeysCLASS Keys► Student AchievementStudent Achievement► ELTELT► Differentiation/Flexible GroupingDifferentiation/Flexible Grouping► EXPRESSEXPRESS► ALL teachers Highly QualifiedALL teachers Highly Qualified► Community InvolvementCommunity Involvement

What the future What the future
holds. . .holds. . .

Proposed Secondary Assessment Proposed Secondary Assessment Transition MatrixTransition Matrix
Ninth GradersNinth Graders Tenth GradersTenth Graders Eleventh Eleventh GradersGraders
Twelfth Twelfth GradersGraders
2011/20122011/2012
EOCTEOCT = 20% of course = 20% of course grade. Must pass the grade. Must pass the
EOCT and ClassEOCT and Class
Pass the GHSWTPass the GHSWT
EOCT = 20% of EOCT = 20% of course gradecourse grade(Pass one EOCT in each of (Pass one EOCT in each of the four content areas or the four content areas or pass the corresponding pass the corresponding subject test of GHSGT)subject test of GHSGT)
Pass GHSWTPass GHSWT
EOCT = 20% of EOCT = 20% of course gradecourse grade(Pass one EOCT in each (Pass one EOCT in each of the four content areas of the four content areas or pass the or pass the corresponding subject corresponding subject test of GHSGT)test of GHSGT)
Pass GHSWTPass GHSWT
EOCT = 20% of EOCT = 20% of course gradecourse grade(Pass one EOCT in each (Pass one EOCT in each of the four content of the four content areas or pass the areas or pass the corresponding subject corresponding subject test of GHSGT)test of GHSGT)
Pass GHSWTPass GHSWT
2012/20132012/2013
EOCTEOCT = 20% of course = 20% of course grade. Must pass the grade. Must pass the
EOCT and ClassEOCT and Class
Pass the GHSWTPass the GHSWT
EOCTEOCT = 20% of = 20% of course grade. Must course grade. Must pass the EOCT and pass the EOCT and
ClassClass
Pass the GHSWTPass the GHSWT
EOCT = 20% of EOCT = 20% of course gradecourse grade(Pass one EOCT in each (Pass one EOCT in each of the four content areas of the four content areas or pass the or pass the corresponding subject corresponding subject test of GHSGT)test of GHSGT)
Pass GHSWTPass GHSWT
EOCT = 20% of EOCT = 20% of course gradecourse grade(Pass one EOCT in each (Pass one EOCT in each of the four content of the four content areas or pass the areas or pass the corresponding subject corresponding subject test of GHSGT)test of GHSGT)
Pass GHSWTPass GHSWT
2013/20142013/2014
EOCTEOCT = 20% of course = 20% of course grade. Must pass the grade. Must pass the EOCT and Class gradeEOCT and Class grade
Pass the GHSWTPass the GHSWT
EOCTEOCT = 20% of = 20% of course grade. Must course grade. Must pass the EOCT and pass the EOCT and
ClassClass
Pass the GHSWTPass the GHSWT
EOCTEOCT = 20% of = 20% of course grade. Must course grade. Must pass the EOCT and pass the EOCT and
the Classthe Class
Pass the GHSWTPass the GHSWT
EOCT = 20% of EOCT = 20% of course gradecourse grade(Pass one EOCT in each (Pass one EOCT in each of the four content of the four content areas or pass the areas or pass the corresponding subject corresponding subject test of GHSGT)test of GHSGT)
Pass GHSWTPass GHSWT
2014/20152014/2015
Common Core Common Core Assessment Assessment
ImplementationImplementation (Language Arts & (Language Arts &
MathematicsMathematics))
EOCTEOCT = 20% = 20%(Science & Social Studies)(Science & Social Studies)
Common Core Common Core Assessment Assessment
ImplementationImplementation (Language Arts & (Language Arts &
MathematicsMathematics))
EOCTEOCT = 20% = 20%(Science & Social Studies)(Science & Social Studies)
Common Core Common Core Assessment Assessment
ImplementationImplementation (Language Arts & (Language Arts &
MathematicsMathematics))
EOCTEOCT = 20% = 20%(Science & Social Studies)(Science & Social Studies)
EOCTEOCT = 20% of = 20% of course grade. Must course grade. Must pass the EOCT and pass the EOCT and
the Classthe Class
Pass the GHSWTPass the GHSWT

Common CoreCommon Core

More RigorMore RigorNext Generation Next Generation
TestingTesting

New AYP IndicatorsNew AYP IndicatorsCollege and Career College and Career Ready Performance Ready Performance
Index, Index, High School ModelHigh School Model
Grades 9 - 12Grades 9 - 12

GraduationGraduation RateRate
►Graduation Rate (90%)Graduation Rate (90%)►Graduation Rate for “At Risk” students Graduation Rate for “At Risk” students
(%)(%)►Students with ninety seven percent Students with ninety seven percent
(97%) or higher attendance rate (%)(97%) or higher attendance rate (%)

Career ReadyCareer Ready
►Students Completing Three (3) or more Students Completing Three (3) or more designated CTAE Pathway Courses(%)designated CTAE Pathway Courses(%)
►CTAE Pathway Completers earning a CTAE Pathway Completers earning a CTAE Industry-Recognized CTAE Industry-Recognized Credential(%)Credential(%)
►Students receiving a Silver Certificate Students receiving a Silver Certificate or higher on the Georgia Work Ready or higher on the Georgia Work Ready Assessment (%)Assessment (%)

Postsecondary Postsecondary PreparationPreparation
► Graduates entering TCSG technical colleges Graduates entering TCSG technical colleges and/or USG two(2) or four (4) year colleges and/or USG two(2) or four (4) year colleges and universities not requiring remediation or and universities not requiring remediation or support courses(90%)support courses(90%)
► Students earning high school credit(s) for Students earning high school credit(s) for accelerated enrollment courses via Dual accelerated enrollment courses via Dual Enrollment, Move on When Ready, Advanced Enrollment, Move on When Ready, Advanced Placement or International Baccalaureate Placement or International Baccalaureate courses. (%)courses. (%)
► Graduated students earning two(2) or more Graduated students earning two(2) or more high school credits in one world language. high school credits in one world language. (70%)(70%)

National ExaminationsNational Examinations
► Seniors scoring a minimum of 22 on the ACT Seniors scoring a minimum of 22 on the ACT (%)(%)
► Seniors scoring a minimum of 1550 on the Seniors scoring a minimum of 1550 on the SAT (%)SAT (%)
► Seniors scoring three (3) or higher on AP Seniors scoring three (3) or higher on AP exams and/or four (4) or higher on IB exams exams and/or four (4) or higher on IB exams (%)(%)
► Students scoring “College Ready” on the Students scoring “College Ready” on the COMPASS examinations and/or the PSAT (%)COMPASS examinations and/or the PSAT (%)

Course Mastery Course Mastery (EOCTs to be replaced by Common Core Assessments 2014-15)(EOCTs to be replaced by Common Core Assessments 2014-15)
► Students scoring at meets or exceeds on the Students scoring at meets or exceeds on the Ninth Grade Literature End of Course Text (90%)Ninth Grade Literature End of Course Text (90%)
► Students scoring at meets or exceeds on the Students scoring at meets or exceeds on the Mathematics I (or equivalent discrete course) End Mathematics I (or equivalent discrete course) End of Course Test (90%)of Course Test (90%)
► Students scoring at meets or exceeds on the Students scoring at meets or exceeds on the Physical Science End of Course Test(80%)Physical Science End of Course Test(80%)
► Students scoring at meets or exceeds on the Students scoring at meets or exceeds on the Biology End of Course Test (80%)Biology End of Course Test (80%)
► Students scoring at meets or exceeds on the Students scoring at meets or exceeds on the American Literature End of Course Test (90%)American Literature End of Course Test (90%)
► Students scoring at meets or exceeds on the US Students scoring at meets or exceeds on the US History End of Course Text(75%)History End of Course Text(75%)
► Students scoring at meets or exceeds on the Students scoring at meets or exceeds on the Economics End of Course Test (80%)Economics End of Course Test (80%)

Teacher and Leader Teacher and Leader EffectivenessEffectivenessCore TeachersCore Teachers
TEM & LEM
CLASS CLASS & &
LeaderLeaderKeysKeys
OtherStudent
Learning Measures/Surveys/Artifacts
Growth Score
AchievementGap

Teacher and Leader Teacher and Leader EffectivenessEffectiveness
CTAE, Fine Arts, & PE TeachersCTAE, Fine Arts, & PE Teachers
TEM & LEM
CLASS CLASS & &
LeaderLeaderKeysKeys
OtherStudent
Learning Measures/Surveys/Artifacts

Film Clip

Free Tutoring for your ChildFree Tutoring for your Child
As a result of the federal No Child Left Behind Act, As a result of the federal No Child Left Behind Act, your child may be able to receive academic your child may be able to receive academic tutoring by outside companies to help him or tutoring by outside companies to help him or her do better in school. Families that qualify for her do better in school. Families that qualify for free or reduced lunch can participate in this free or reduced lunch can participate in this program. If you qualify, you can choose a free program. If you qualify, you can choose a free tutoring program that best meets your child’s tutoring program that best meets your child’s needs from the list of approved tutoring needs from the list of approved tutoring programs. Contact Dean Moody at programs. Contact Dean Moody at [email protected] for more information. for more information.
(Title I)(Title I)

Thank you for coming!Thank you for coming!
Have a good evening!Have a good evening!