Embed Size (px)
Citation preview
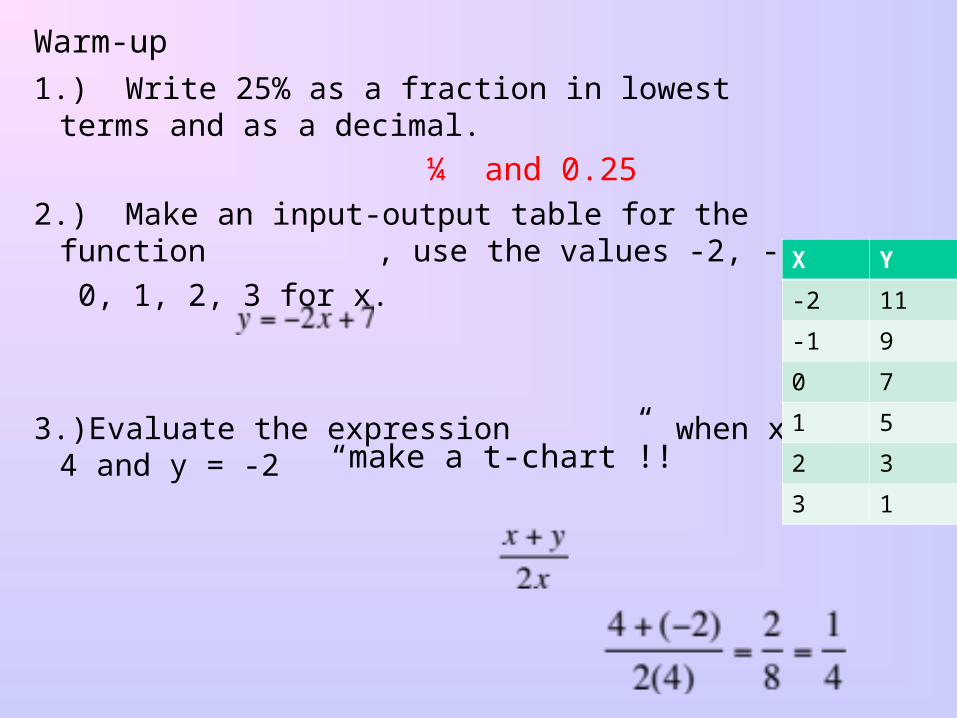
Warm-up
1.) Write 25% as a fraction in lowest terms and as a decimal.
2.) Make an input-output table for the function , use the values -2, -1,
0, 1, 2, 3 for x.
3.)Evaluate the expression when x = 4 and y = -2
¼ and 0.25
X Y
-2 11
-1 9
0 7
1 5
2 3
3 1
“make a t-chart”!!
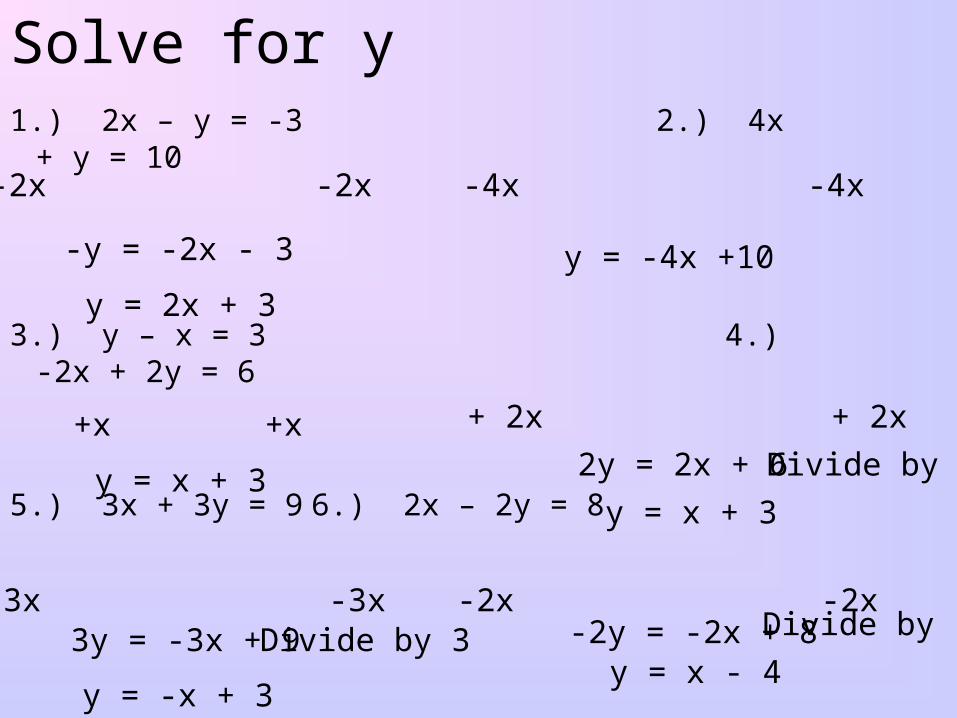
Solve for y1.) 2x – y = -3 2.) 4x + y = 10
3.) y – x = 3 4.) -2x + 2y = 6
5.) 3x + 3y = 9 6.) 2x – 2y = 8
-2x -2x
-y = -2x - 3
y = 2x + 3
-4x -4x
y = -4x +10
+x +x
y = x + 3
+ 2x + 2x
2y = 2x + 6
y = x + 3
-3x -3x3y = -3x + 9
y = -x + 3
-2x -2x-2y = -2x + 8
y = x - 4
Divide by 2
Divide by 3 Divide by -2
Chapter 3
Section 1
The Rectangular Coordinate System
-5
-5
5
5
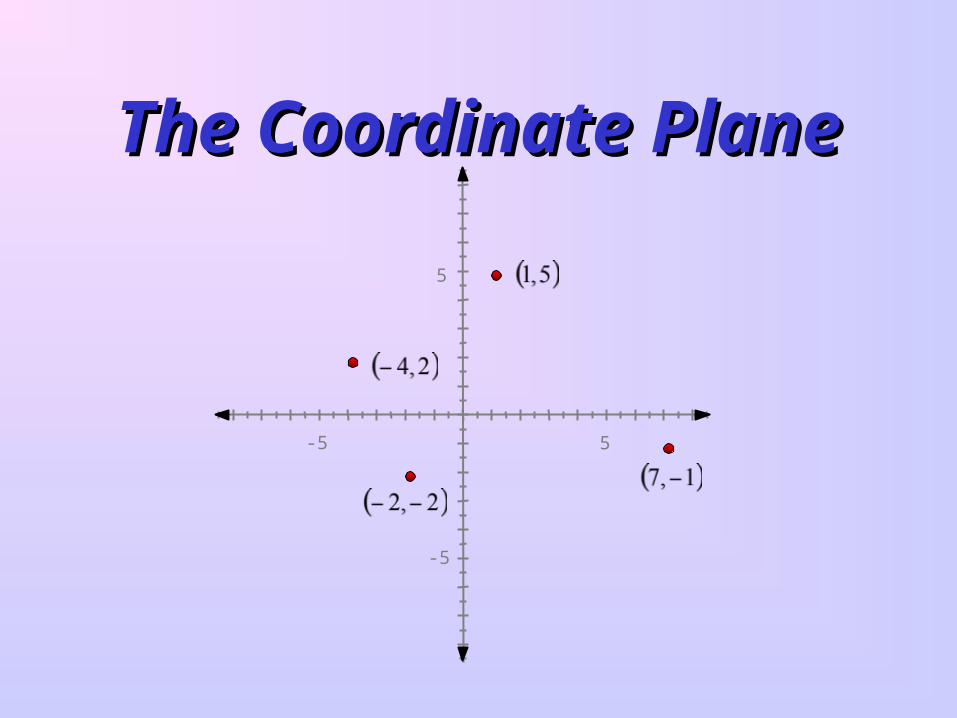
The Coordinate PlaneThe Coordinate Plane

The coordinate plane is divided by two number lines.
We have vertical and horizontal number lines.
-5 50 10-10
-5 50 10-10
5
-5
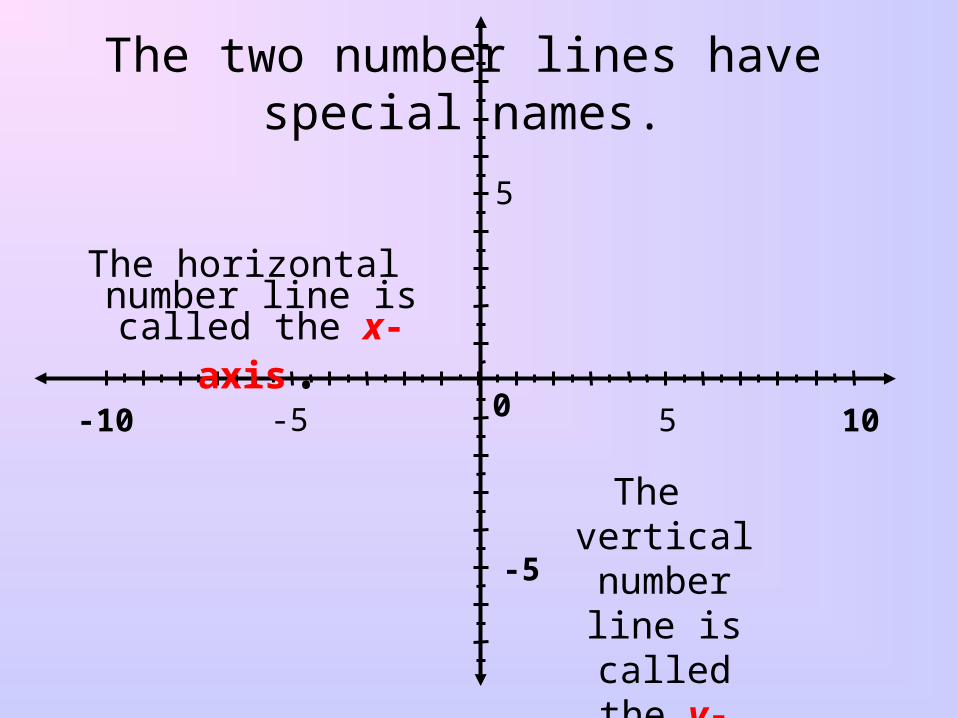
The two number lines have special names.
The horizontal number line is called the x-axis.
The vertical number line is called the
y-axis.

The coordinate plane is filled with points . . .

. . . infinitely many points.
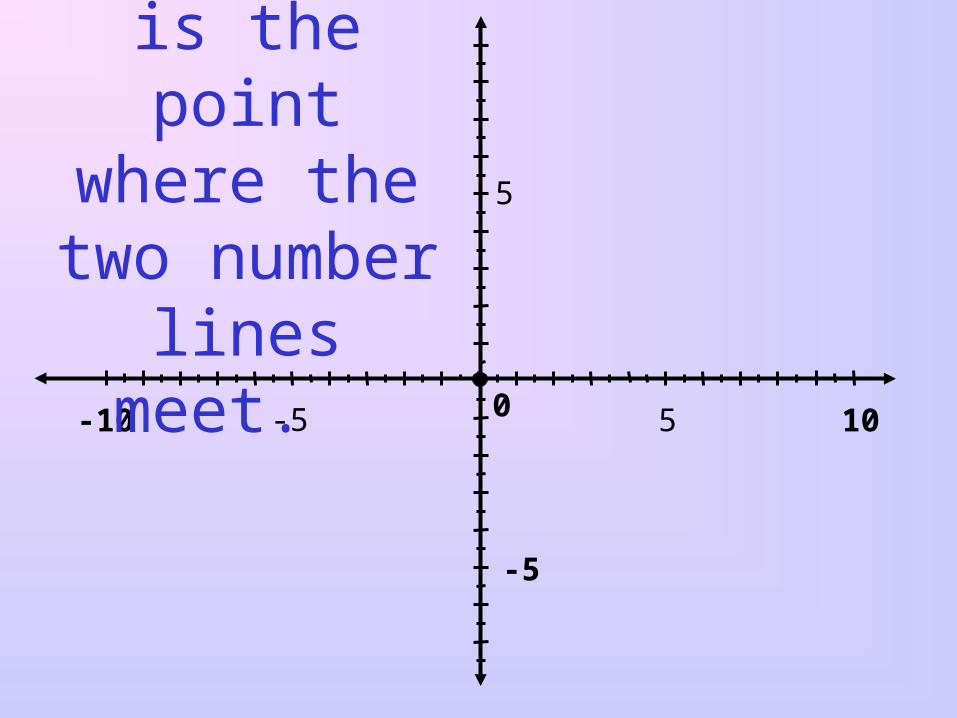
And somewhere among all those points is the
point we call the origin.
-5 50 10-10
5
-5
The origin is the point where the two number
lines meet.

-5 50 10-10
5
-5
Coordinates are always written in parentheses, with the x-value first.
Coordinates written in parentheses are called an ordered
pair.
-5 50 10-10
5
-5
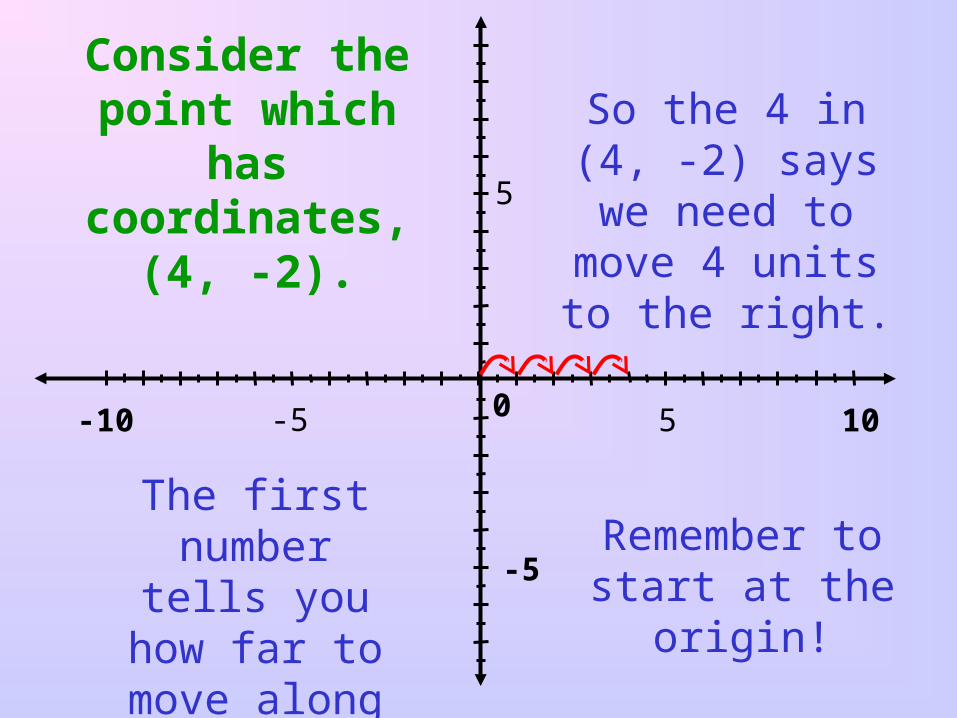
The first number tells you how far
to move along the x-axis.
Consider the point which has
coordinates, (4, -2).
So the 4 in (4, -2) says we need to move
4 units to the right.
Remember to start at the origin!

-5 50 10-10
5
-5
The second number tells you how far to move up or down.
The –2 in (4, -2) tells you to
move down two units.
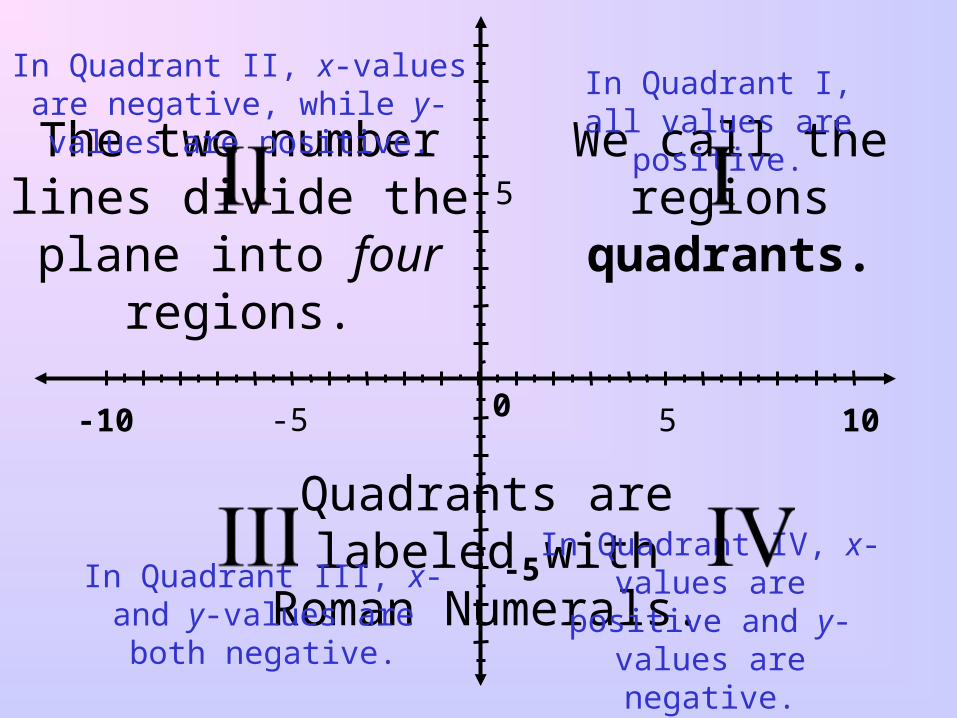
The two number lines divide the plane into
four regions.
Quadrants are labeled with Roman Numerals.
We call the regions quadrants.
In Quadrant I, all values are positive.
In Quadrant II, x-values are negative, while y-values are
positive.
In Quadrant III, x- and y-values are both negative.
In Quadrant IV, x-values are positive and y-values
are negative.
-5 50 10-10
5
-5
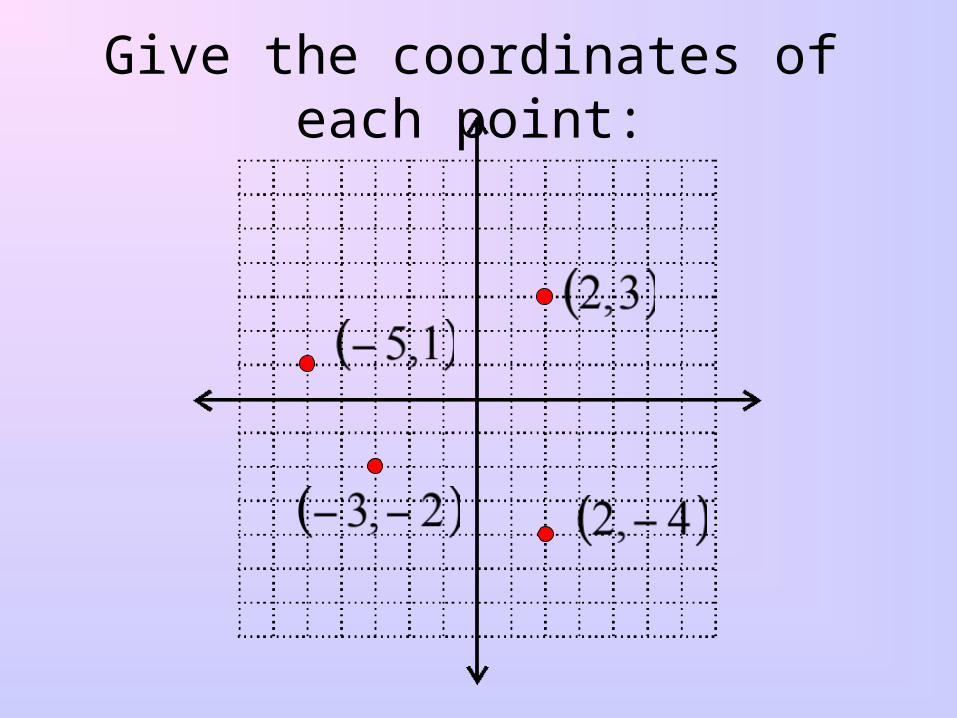
Give the coordinates of each point:
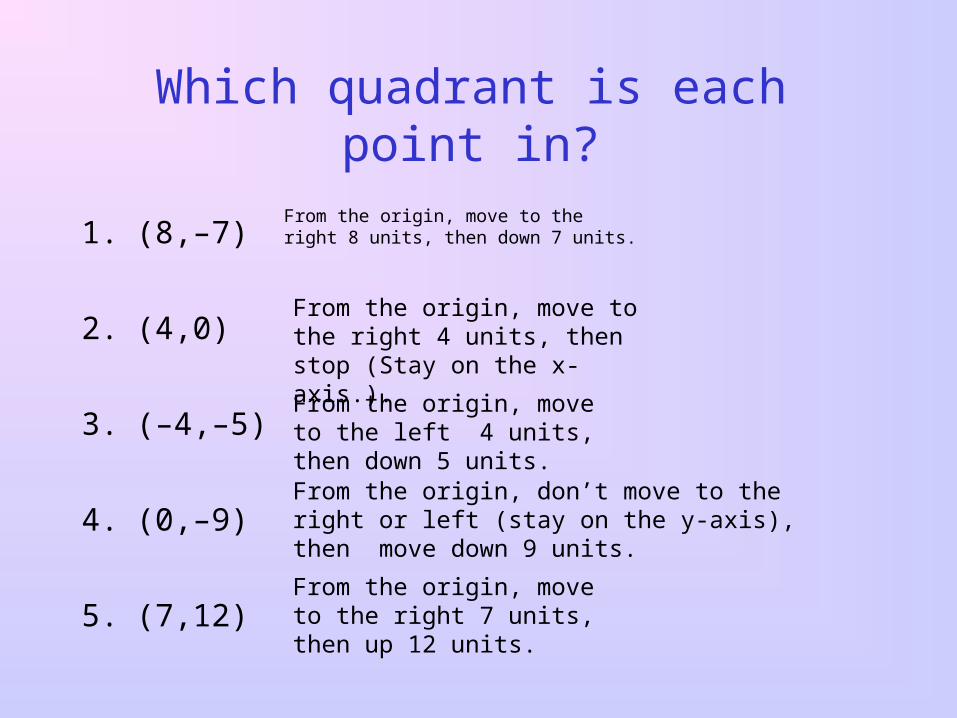
1. (8,–7)
2. (4,0)
3. (–4,–5)
4. (0,–9)
5. (7,12)
Which quadrant is each point in?
From the origin, move to the right 8 units, then down 7 units.
From the origin, move to the right 4 units, then stop (Stay on the x-axis.).
From the origin, move to the left 4 units, then down 5 units.
From the origin, don’t move to the right or left (stay on the y-axis), then move down 9 units.
From the origin, move to the right 7 units, then up 12 units.

Plotting Points in a Rectangular Coordinate System
Quadrant 1
Quadrant 11
Quadrant 111
Quadrant 1v
Points graphed in a rectangular coordinate system are defined by two numbers as an ordered pair (x , y)
(+, +)
(-, +)
(-, -) (+, -)
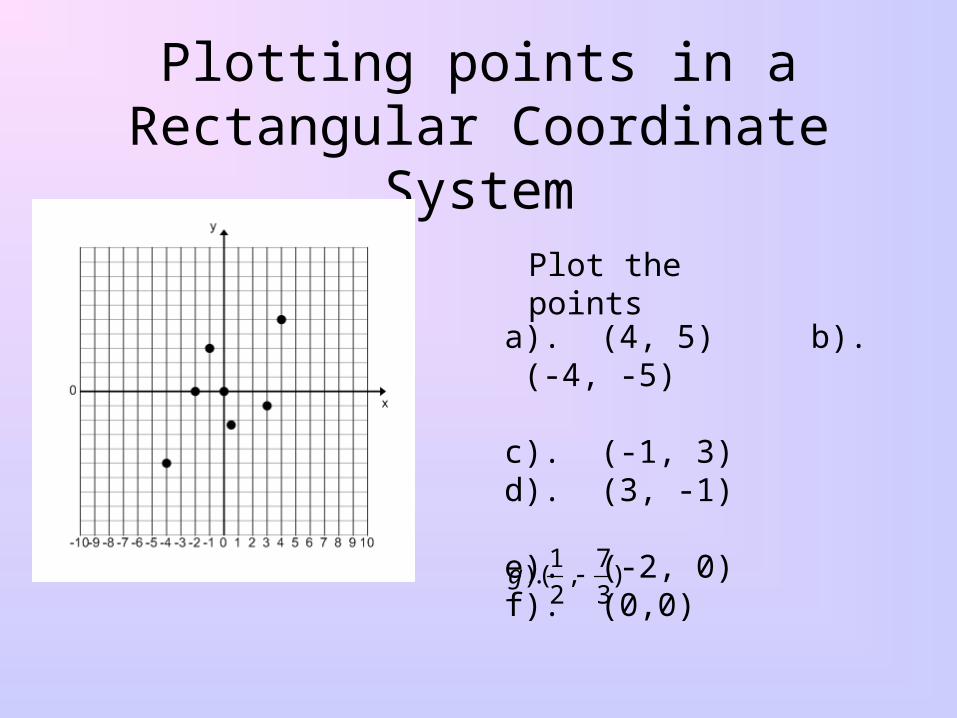
Plotting points in a Rectangular Coordinate System
Plot the points
a). (4, 5) b). (-4, -5)
c). (-1, 3) d). (3, -1) e). (-2, 0) f). (0,0)
1 7).( , )
2 3g
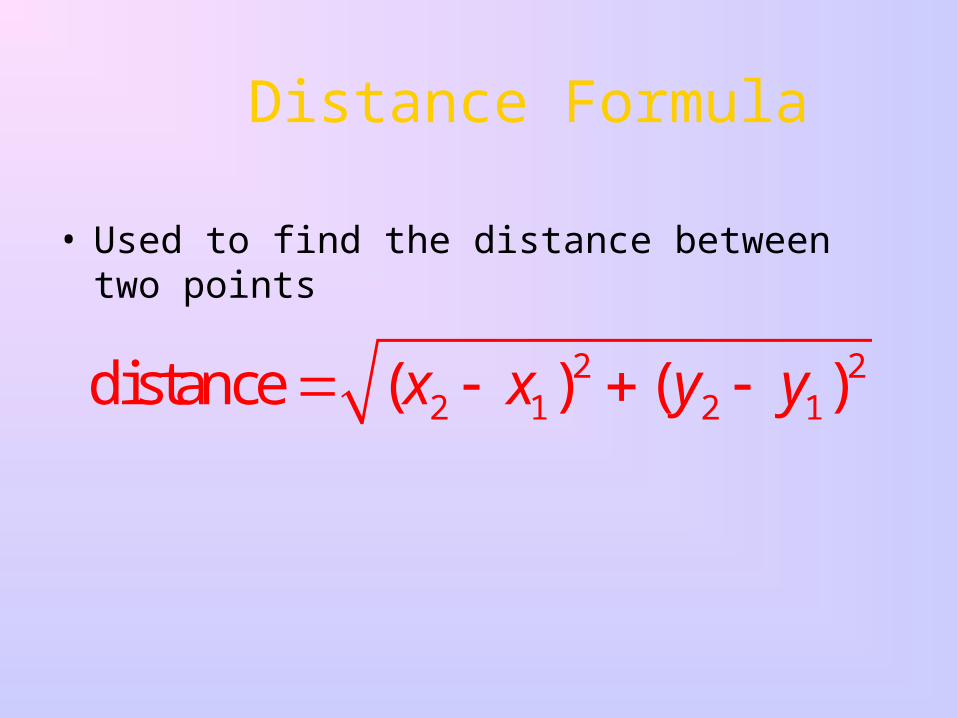
Distance Formula
• Used to find the distance between two points
2 22 1 2 1distance ( ) ( )x x y y
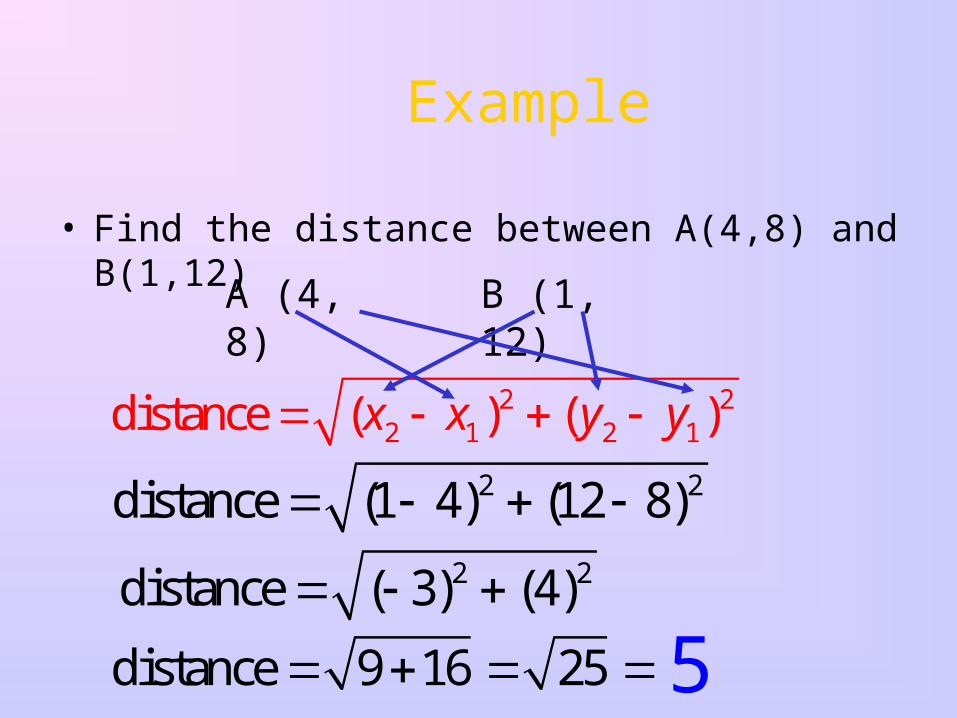
Example
• Find the distance between A(4,8) and B(1,12)
2 22 1 2 1distance ( ) ( )x x y y
A (4, 8) B (1, 12)
2 2distance (1 4) (12 8) 2 2distance ( 3) (4)
distance 9 16 25 5

YOU TRY!!
• Find the distance between:– A. (2, 7) and (11, 9)
– B. (-5, 8) and (2, - 4)
2 2(9) (2) 85
2 2(7) ( 12) 193

Midpoint Formula
• Used to find the center of a line segment
2 1 2 1midpoint ,2 2
x x y y
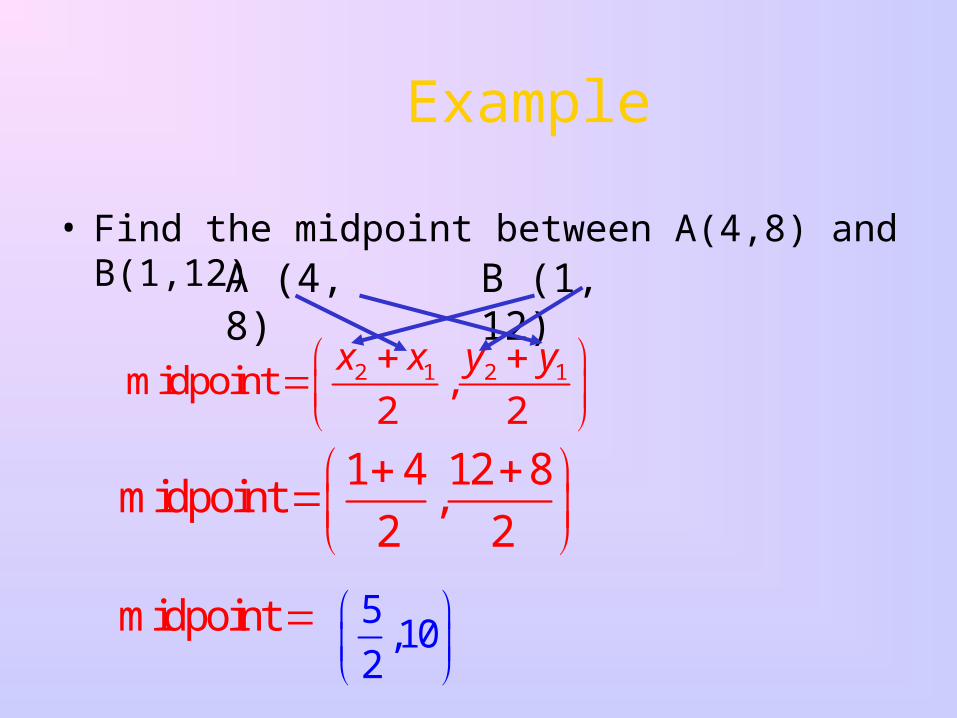
Example
• Find the midpoint between A(4,8) and B(1,12)
2 1 2 1midpoint ,2 2
x x y y
A (4, 8) B (1, 12)
1 4 12 8midpoint ,
2 2
midpoint 5,10
2
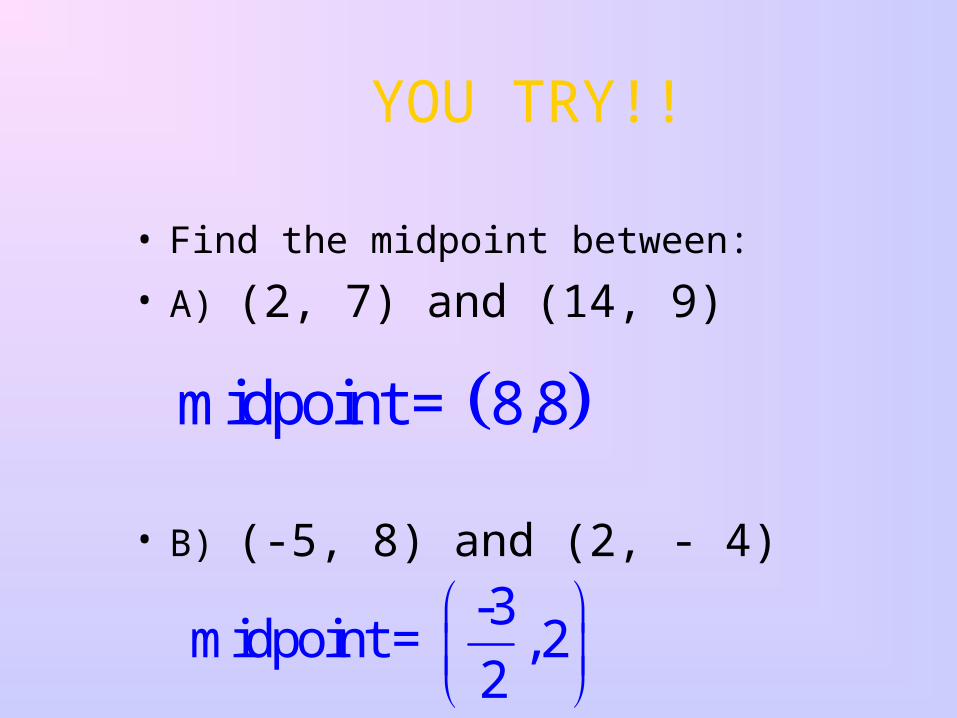
YOU TRY!!
• Find the midpoint between:
• A) (2, 7) and (14, 9)
• B) (-5, 8) and (2, - 4)
midpoint = 8,8
-3midpoint = , 2
2

Constant Rate of Change
• The slope of a nonvertical line is the ratio of the vertical change (rise) to the horizontal change (run) between any two points on the line.
Find the slope between (2, 4) and (4, 8).
2 1
2 1
y ychange in ym
changein x x x
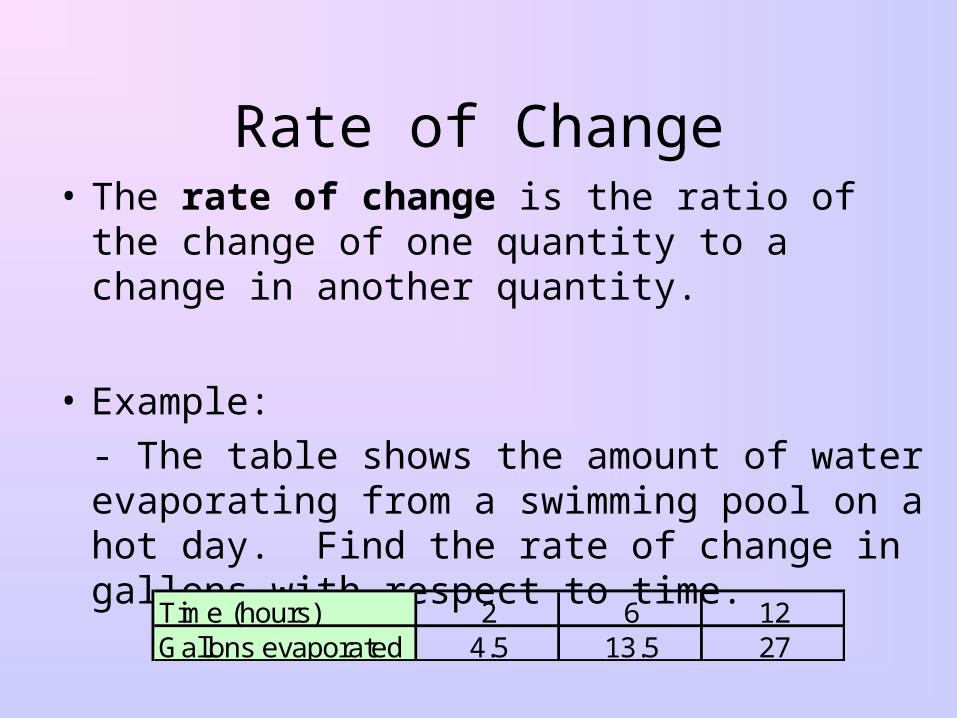
Rate of Change• The rate of change is the ratio of the
change of one quantity to a change in another quantity.
• Example:- The table shows the amount of water evaporating from a swimming pool on a hot day. Find the rate of change in gallons with respect to time.Time (hours) 2 6 12
Gallons evaporated 4.5 13.5 27

Example
Where is the greatest rate of increase?
How about the lowest rate of increase?
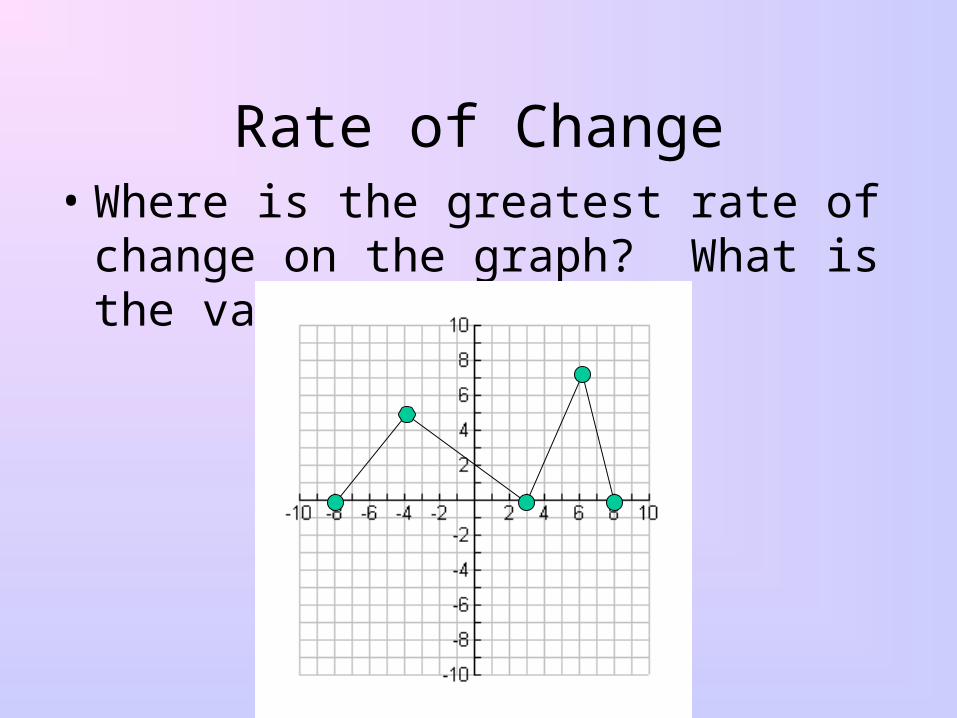
Rate of Change• Where is the greatest rate of
change on the graph? What is the value?
Average Rate of Change• If you travel 200 miles in 4 hours, what is
your average speed?• 50 mph• Does this mean that you necessarily travel
50 mph for the whole trip?• No! The rate can change so we call it your
AVERAGE speed.• In the same way, Because the rate of
change is not constant for some functions, we can’t just call it rate of change.
• So we call it AVERAGE rate of change.
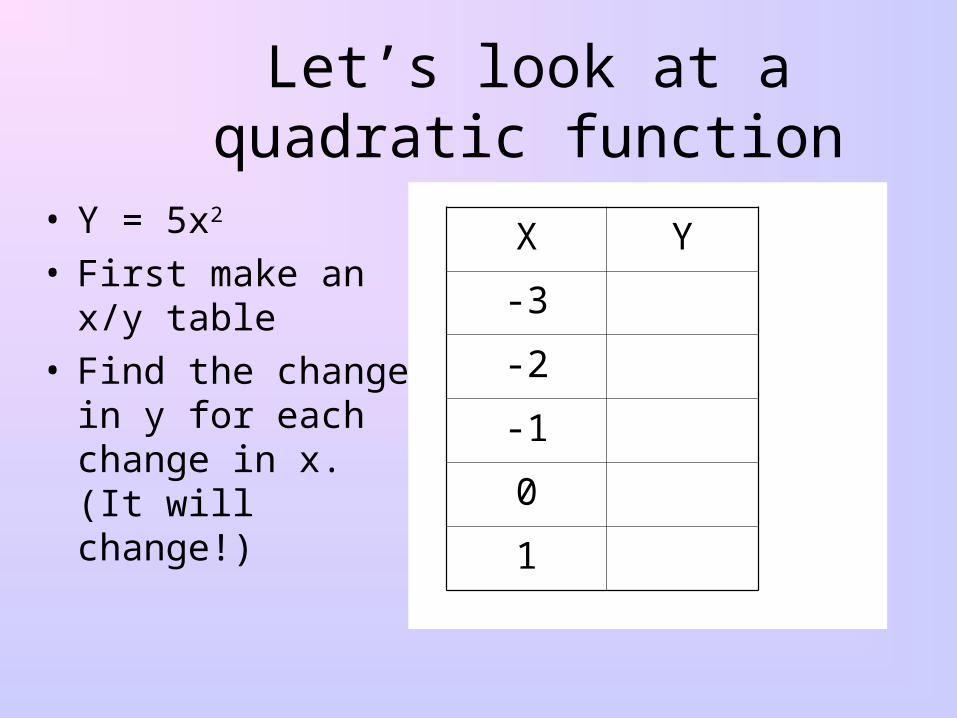
Let’s look at a quadratic function
• Y = 5x2
• First make an x/y table
• Find the change in y for each change in x. (It will change!)
X Y
-3
-2
-1
0
1
5(-3)2 =5(9) =45
5(-2)2 =5(4) =20
5(-1)2 =5(1)=4
5(0)2 =5(0)=0
5(1)2 =5(1)=5
X Y
-3
-2
-1
0
1

You try!
• Y = 3x2
a) Find the average rate of change between x = -2 and x= -1
b) Find the average rate of change between x = 0 and x = 1
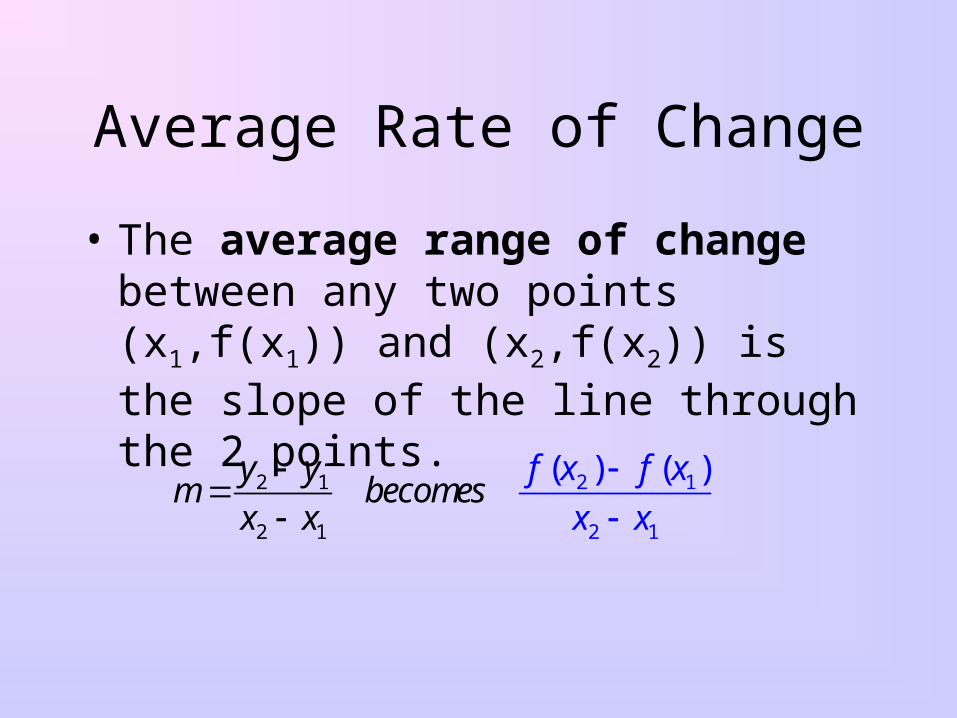
Average Rate of Change
• The average range of change between any two points (x1,f(x1)) and (x2,f(x2)) is the slope of the line through the 2 points.
2 1
2
2
1
1
2 1
( ) ( )y ym becomes
x x
f x f x
x x
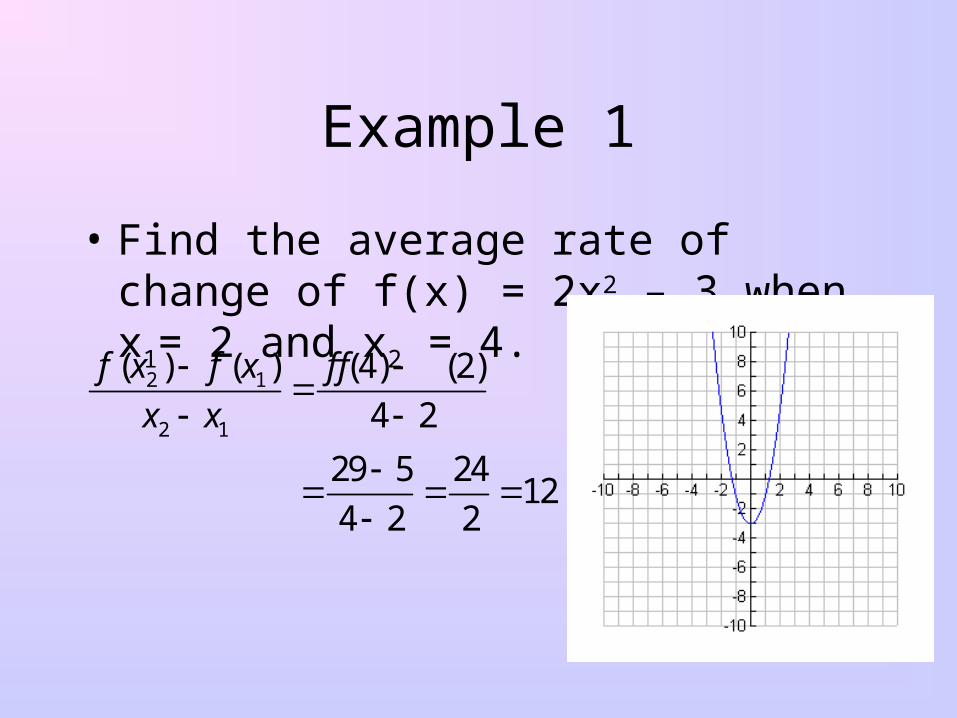
Example 1
• Find the average rate of change of f(x) = 2x2 – 3 when x1= 2 and x2 = 4.
2 1
2 1
( ) ( ) (4) (2)
4 2
29 5 2412
4 2 2
f x f x f f
x x
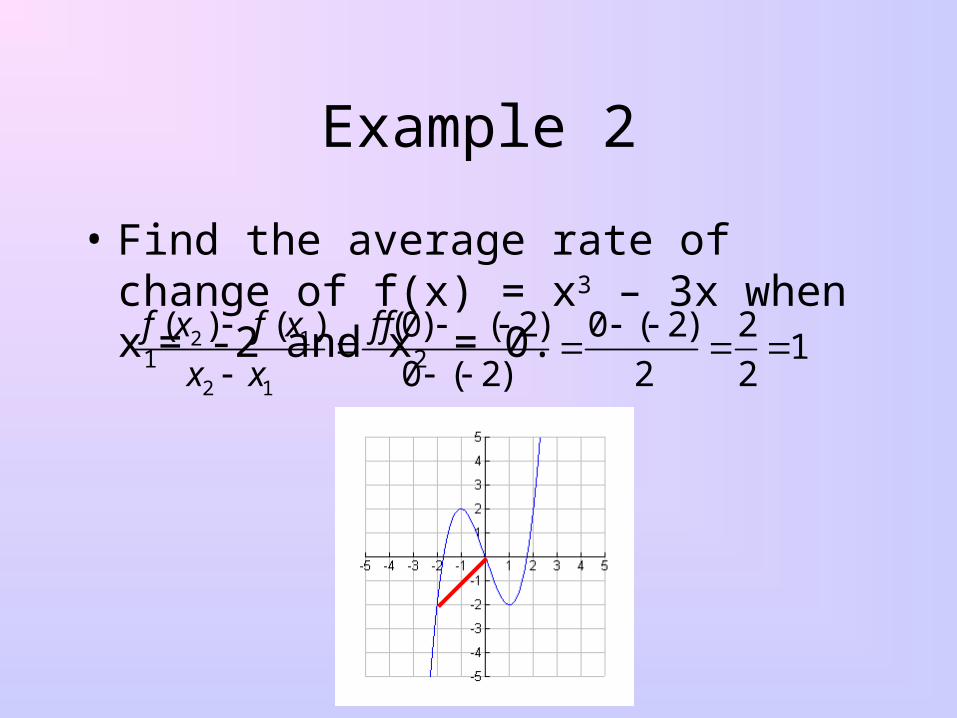
Example 2
• Find the average rate of change of f(x) = x3 – 3x when x1= -2 and x2 = 0. 2 1
2 1
( ) ( ) (0) ( 2) 0 ( 2) 21
0 ( 2) 2 2
f x f x f f
x x