Embed Size (px)
Citation preview
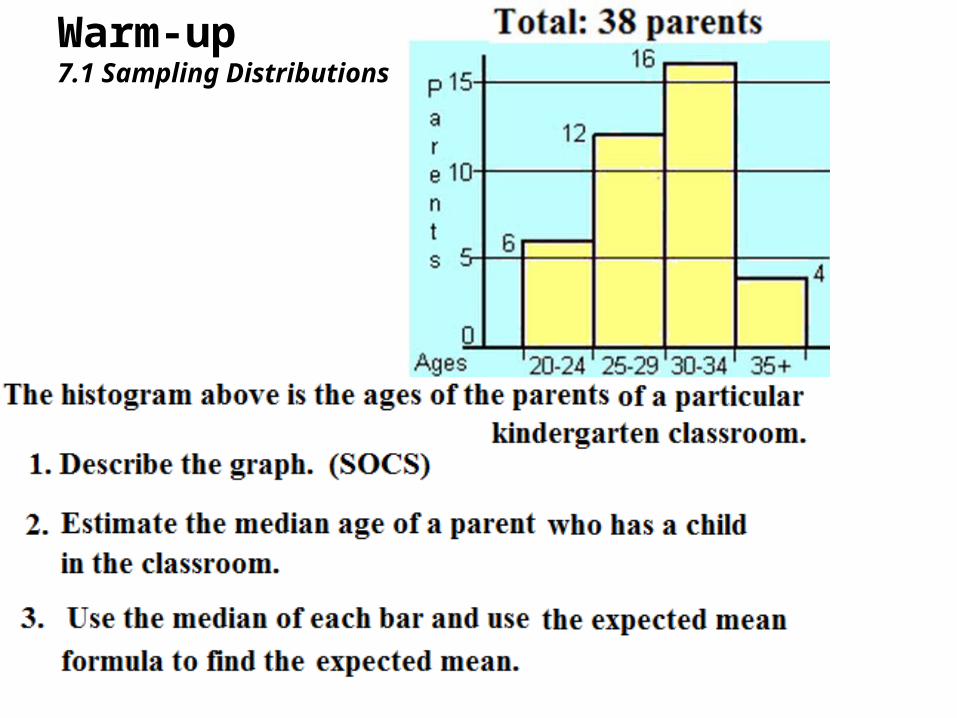
Warm-up7.1 Sampling Distributions
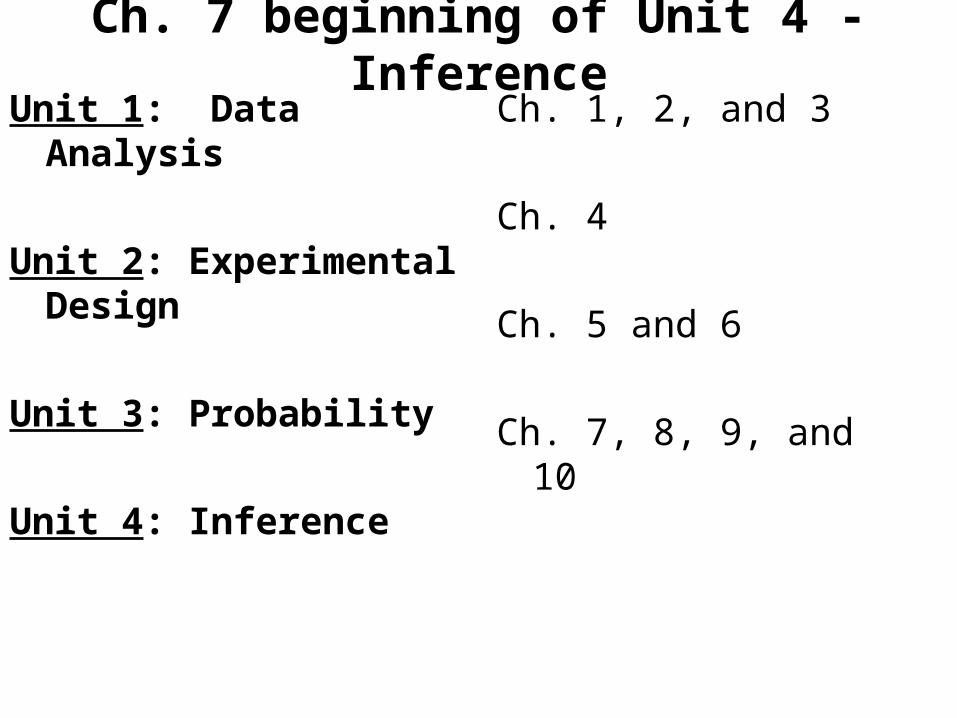
Ch. 7 beginning of Unit 4 - InferenceUnit 1: Data Analysis
Unit 2: Experimental Design
Unit 3: Probability
Unit 4: Inference
Ch. 1, 2, and 3
Ch. 4
Ch. 5 and 6
Ch. 7, 8, 9, and 10

Student of the day!Block 4

Student of the day!Block 5
Introduction In November 2005 the Harris Poll asked 889 U.S. adults
“Do you believe in ghosts?” 40% said they did.
At almost the same time CBS News polled 808 U.S. adults and asked the same question. 48% of the respondents professed a belief in ghosts.
Why the difference?
Sampling Distribution• Both the Harris Poll and CBS news sampled a certain
number of adults for the information. Both proportions gathered are statistics and should be
written as: • Imagine we have the actual parameter. And it is p = 0.45.• Both samples were not really wrong, the difference
between the statistics and the parameter is called sampling error or sampling variability.
48ˆ40ˆ pp
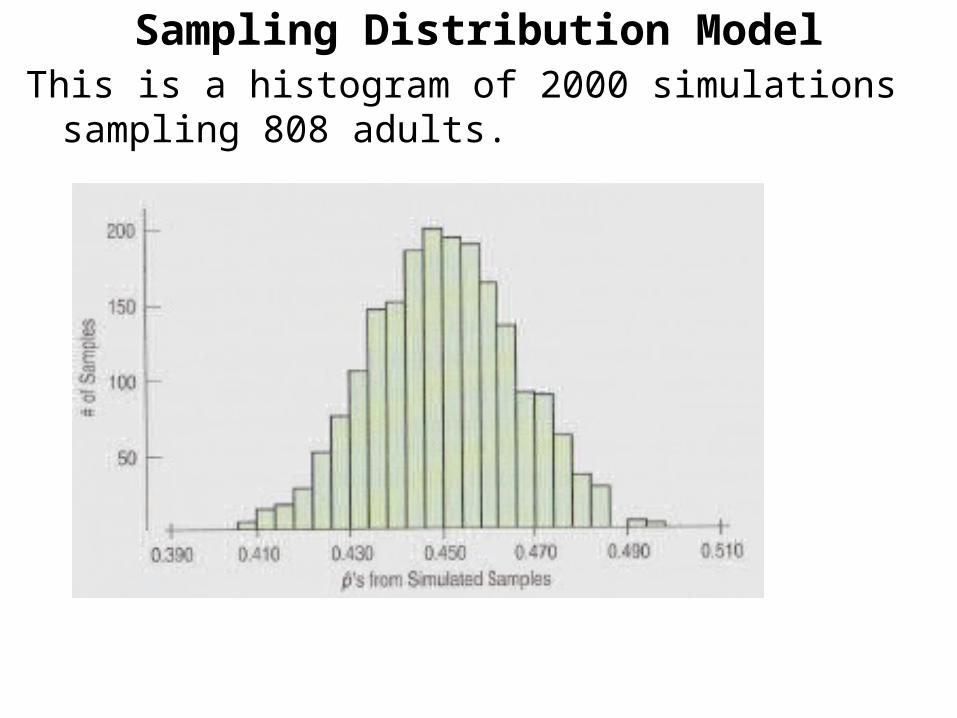
Sampling Distribution ModelThis is a histogram of 2000 simulations sampling 808 adults.
Characteristics of a fair sized sample• Symmetric (very Normal)• No outliers• Center p-hat will match p• The bigger the sample size the smaller the
spread
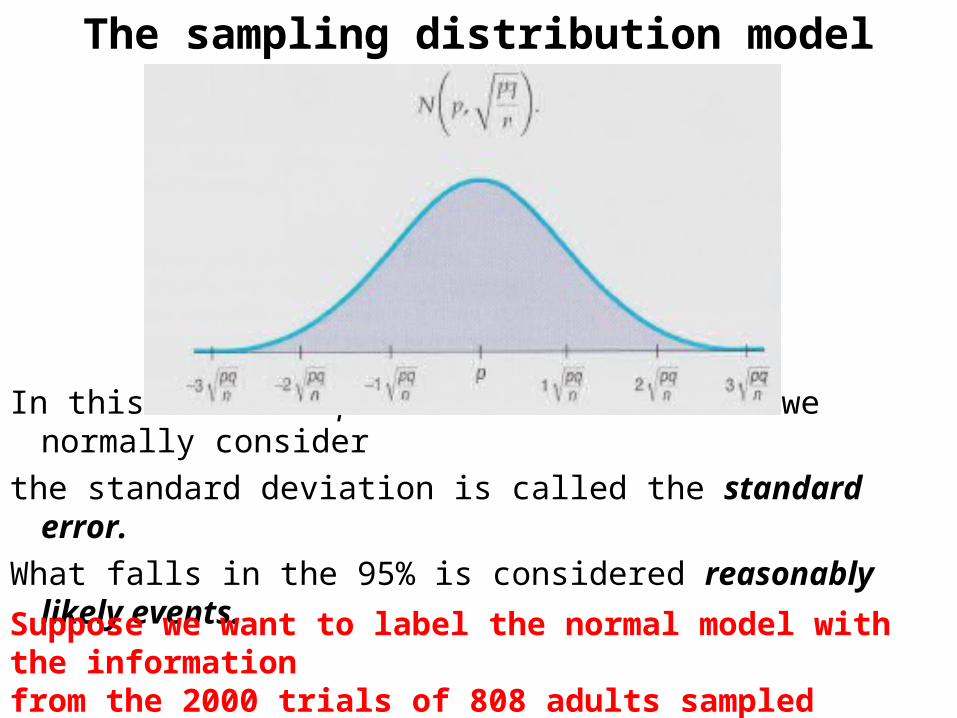
The sampling distribution model
In this case the p is the mean and what we normally considerthe standard deviation is called the standard error.What falls in the 95% is considered reasonably likely events.
Suppose we want to label the normal model with the information from the 2000 trials of 808 adults sampled about ghosts.
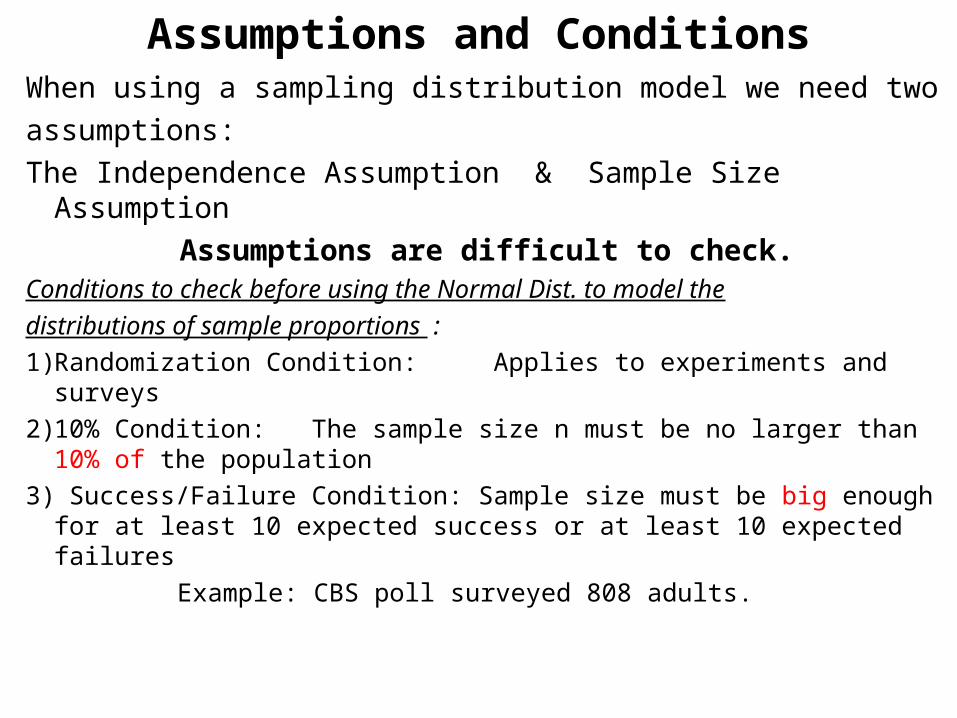
Assumptions and ConditionsWhen using a sampling distribution model we need twoassumptions: The Independence Assumption & Sample Size Assumption
Assumptions are difficult to check.Conditions to check before using the Normal Dist. to model thedistributions of sample proportions :1) Randomization Condition: Applies to experiments and surveys2) 10% Condition: The sample size n must be no larger than 10% of
the population3) Success/Failure Condition: Sample size must be big enough for at
least 10 expected success or at least 10 expected failures Example: CBS poll surveyed 808 adults.
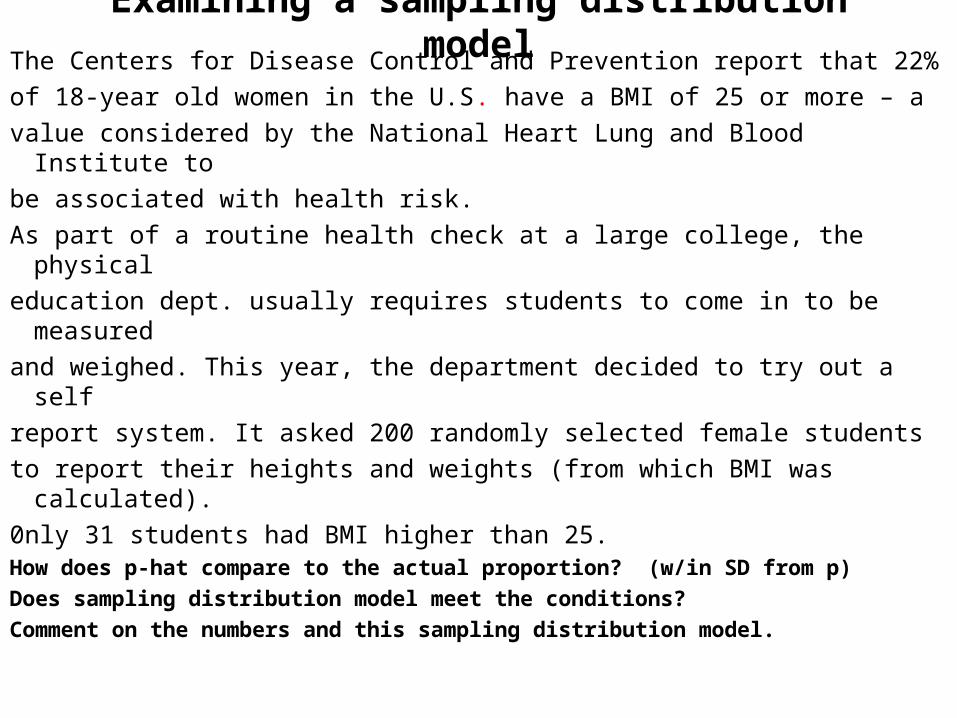
Examining a sampling distribution modelThe Centers for Disease Control and Prevention report that 22%of 18-year old women in the U.S. have a BMI of 25 or more – avalue considered by the National Heart Lung and Blood Institute tobe associated with health risk.As part of a routine health check at a large college, the physicaleducation dept. usually requires students to come in to be measuredand weighed. This year, the department decided to try out a selfreport system. It asked 200 randomly selected female studentsto report their heights and weights (from which BMI was calculated).0nly 31 students had BMI higher than 25. How does p-hat compare to the actual proportion? (w/in SD from p)
Does sampling distribution model meet the conditions?
Comment on the numbers and this sampling distribution model.
Why use sampling distribution models?The textbook calls p-hat and standard error of p-hat pointestimators because you use these numbers to infersomething about the parameter of the population you aresampling.
Just like the conditions mentioned earlier, the distributionmodel must produce a statistics that is unbiased andprecise.
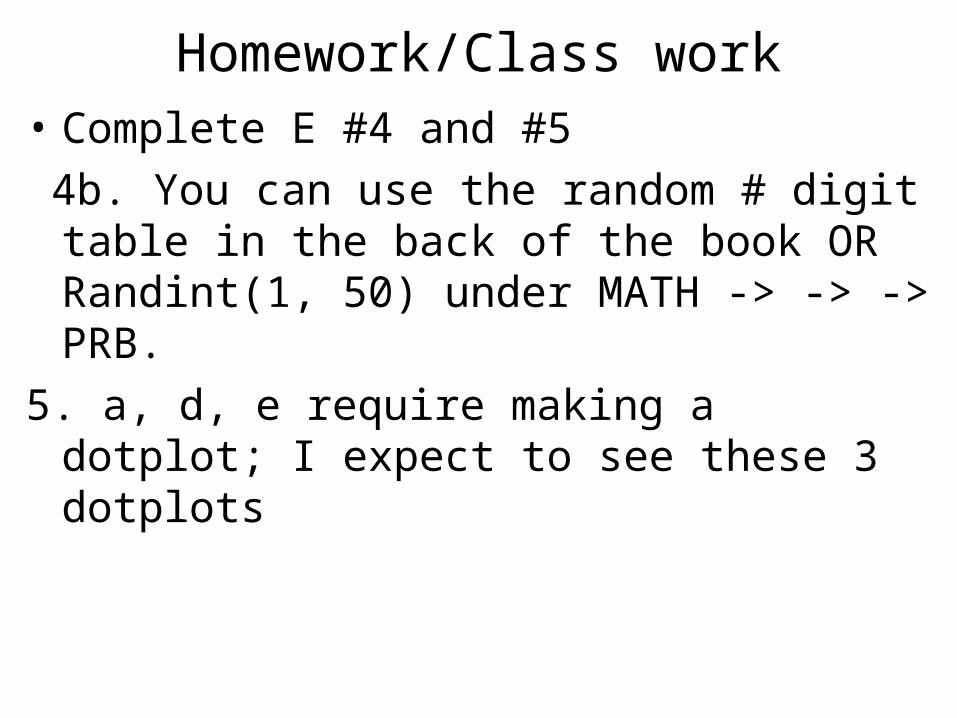
Homework/Class work• Complete E #4 and #5 4b. You can use the random # digit table in the back
of the book OR Randint(1, 50) under MATH -> -> -> PRB.
5. a, d, e require making a dotplot; I expect to see these 3 dotplots
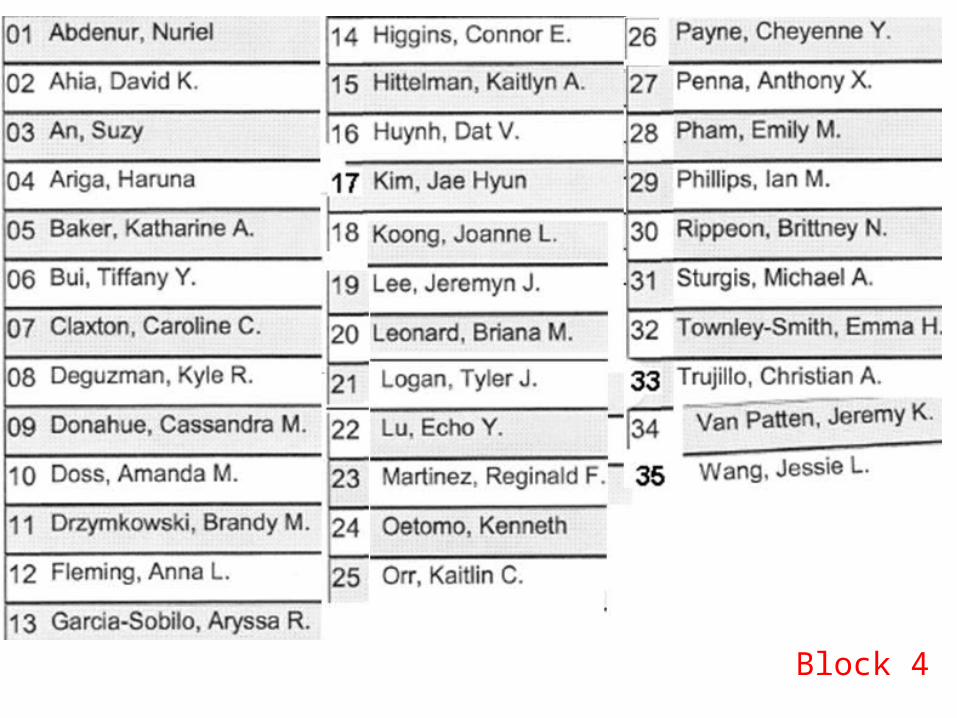
Block 4
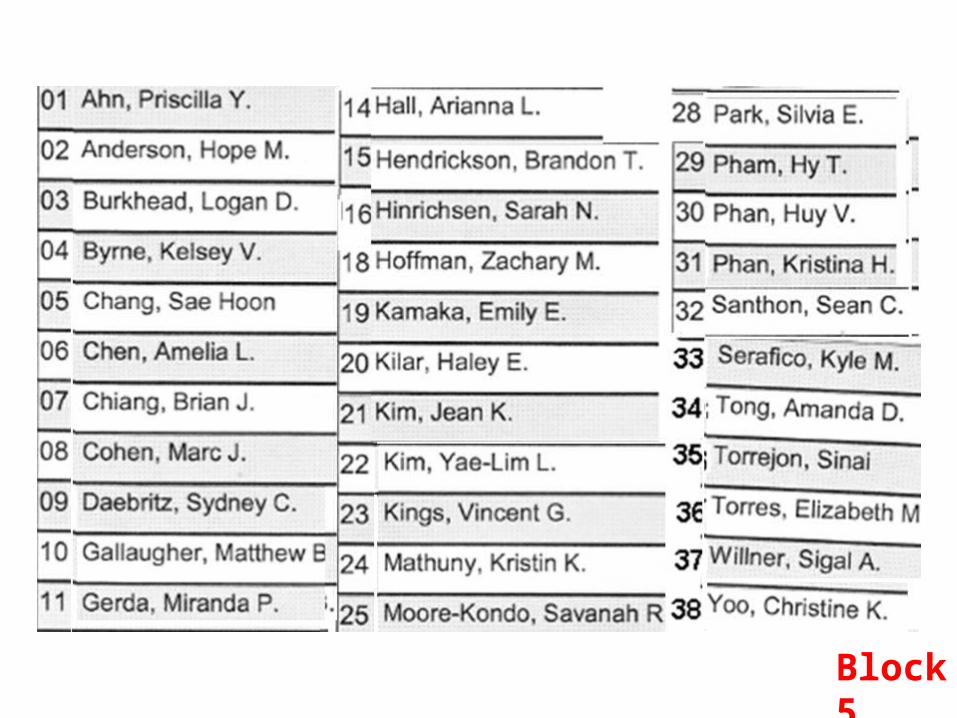
Block 5
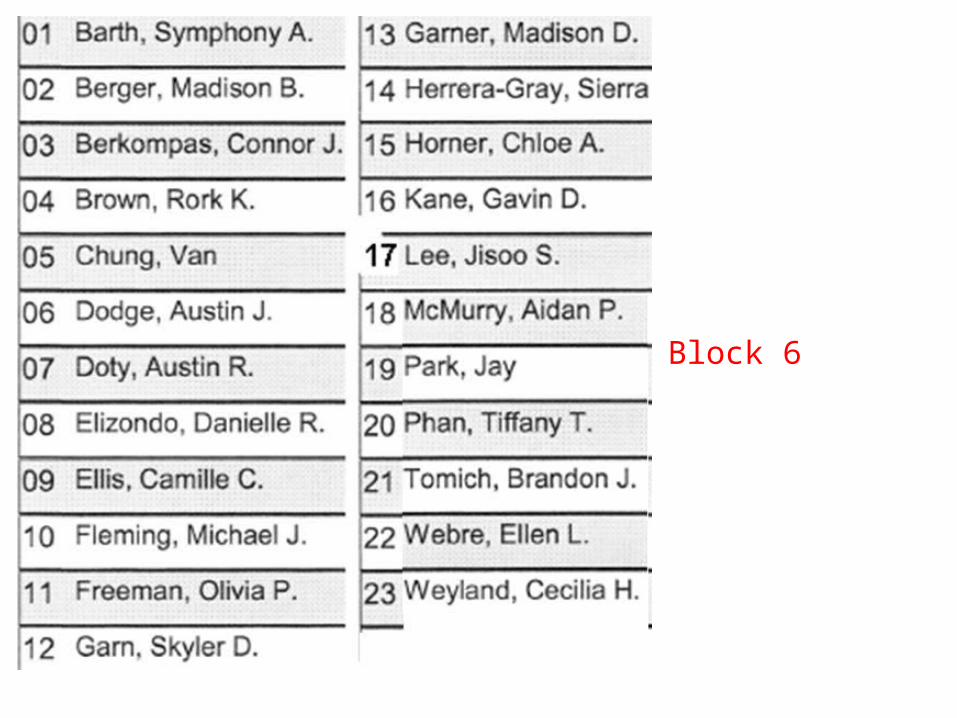
Block 6