Embed Size (px)
Citation preview

© Edgenuity, Inc. 1
Warm-Up Quadratic Functions: Standard Form
Lesson
Question
Lesson Goals
?
Calculate the
of
the quadratic
function.
Graph the
quadratic function.
Calculate the
quadratic
function’s
.

© Edgenuity, Inc. 2
Warm-Up
WK2 Words to Know
Fill in this table as you work through the lesson. You may also use the glossary
to help you.
in a function, the 𝑦-coordinate of the highest point on
the graph of the function or the largest value in the
range
in a parabola, the point at which the function goes from
increasing to decreasing, or vice versa
in a function, the 𝑦-coordinate of the lowest point on
the graph of the function or the smallest value in the
range
the point on a graph at which the graph crosses the
𝑦-axis
graphically, a point on a graph at which the graph
crosses or touches the 𝑥-axis; algebraically, an input of
a function that results in an output of 0
in a parabola, the line that passes through the vertex
and is the line of reflection
Quadratic Functions: Standard Form

© Edgenuity, Inc. 3
Warm-Up
Quadratic Functions
The function 𝑓(𝑥) = 𝑎𝑥2 + 𝑏𝑥 + 𝑐 is a quadratic function in
form.
𝑓 𝑥 = 3𝑥2− 4𝑥 − 10
Leading Coefficient (𝒙𝟐-Term)
Quadratic Functions: Standard Form
𝒙-Term Coefficient Constant Term
𝑎 = 𝑏 = −4 𝑐 =
© Edgenuity, Inc. 4
Identifying the Vertex of a Quadratic Function
Slide
2
When a local high school football
kicker punts the ball, the ball’s
trajectory follows a path that can
be modeled by the function
𝑓 𝑥 = −4.9𝑥2 + 20𝑥.
After 2.04 seconds, it reaches a
height of
20.4 meters.
Draw the axis of symmetry.
Instruction Quadratic Functions: Standard Form
The graph is symmetrical on either side of the axis of symmetry.
When the distance is the same from the axis of symmetry, the output will be
the same.
Heig
ht
(me
ters
)
Time (seconds)

© Edgenuity, Inc. 5
Slide
2 The or maximum value of a quadratic function,
𝑓(𝑥) = 𝑎𝑥2+ 𝑏𝑥 + 𝑐, is called the vertex.
Instruction Quadratic Functions: Standard Form
𝒈 𝒙 = −𝒙𝟐 + 𝟐𝒙 + 𝟑𝒇 𝒙 = 𝒙𝟐− 𝟐𝒙− 𝟖
𝑎 = 1, 𝑎 > 0
opens
vertex: min.
𝑎 = −1, 𝑎 < 0
opens
vertex: max.
© Edgenuity, Inc. 6
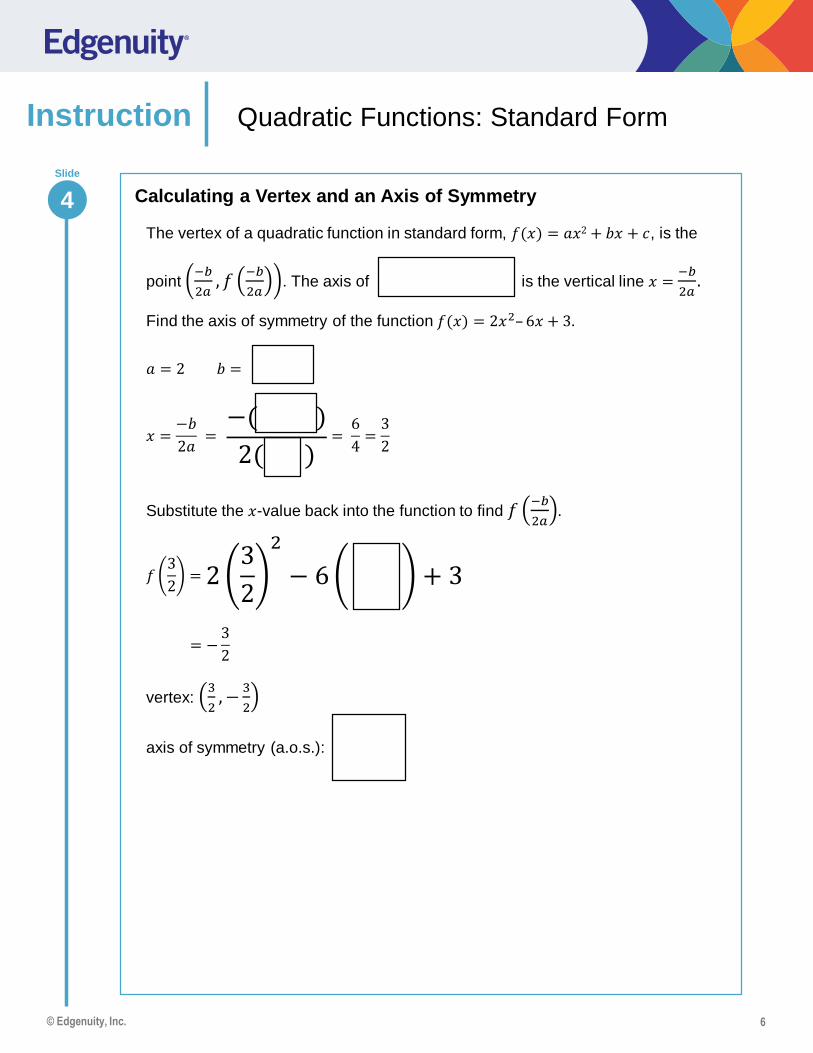
Slide
4
Instruction Quadratic Functions: Standard Form
Calculating a Vertex and an Axis of Symmetry
The vertex of a quadratic function in standard form, 𝑓(𝑥) = 𝑎𝑥2+ 𝑏𝑥 + 𝑐, is the
point −𝑏
2𝑎, 𝑓
−𝑏
2𝑎. The axis of is the vertical line 𝑥 =
−𝑏
2𝑎.
Find the axis of symmetry of the function 𝑓(𝑥) = 2𝑥2– 6𝑥 + 3.
𝑎 = 2 𝑏 =
𝑥 =−𝑏
2𝑎=
−( )
2( )=
6
4=3
2
Substitute the 𝑥-value back into the function to find 𝑓−𝑏
2𝑎.
𝑓3
2=
23
2
2
− 63
2+ 3
vertex: 3
2, −
3
2
axis of symmetry (a.o.s.):
= −3
2
−( )
2( )
23
2
2
− 63
2+ 3

© Edgenuity, Inc. 7
Slide
4
Instruction Quadratic Functions: Standard Form
The is −𝑏
2𝑎, 𝑓
−𝑏
2𝑎and
the axis of symmetry is the vertical
line 𝑥 =−𝑏
2𝑎.
𝑓 𝑥 = 2𝑥2– 6𝑥 + 3
vertex: 3
2, –
3
2
axis of symmetry: 𝑥 =3
2
6 Analyzing a Parabola
Vertex: (0, )
Domain: {𝑥|𝑥 is a real number}
Range: {𝑦│𝑦 ≥ −9}
Intervals increasing: ( , ∞)
Intervals decreasing: (−∞, )
(–4, 7)
(–3, 0)
(–2, –5)
(–1, –8)
(0, –9)
(1, –8)
(2, –5)
(3, 0)
(4, –7)

© Edgenuity, Inc. 8
𝑦-intercept: (0, )
Slide
10
Instruction Quadratic Functions: Standard Form
Calculating Intercepts
An is the point
where the graph crosses the 𝑥-axis and
the function’s value, or output, is 0.
𝑓(𝑥) = −𝑥2− 2𝑥 + 8
0 = −𝑥2− 2𝑥 + 8
0 = −(𝑥2+ 2𝑥 − 8)
0 = −1(𝑥− )(𝑥 + 4)
0 = 𝑥 − 2 0 = 𝑥 + 4
𝑥 =
𝑥-intercepts: (0, 2) and (0,−4)
Circle the 𝑥-intercepts.
An is the point
where the graph crosses the 𝑦-axis
and the function’s input is 0.
𝑓(𝑥) = –𝑥2 – 2𝑥 + 8
Circle the 𝑦-intercept.
𝑓(0) = – (0)2 – 2( ) + 8
= 0 − 0 + 8
𝑓(0) =
𝑥 = −4
−1(𝑥− )(𝑥 + 4)
– (0)2–2( ) + 8

© Edgenuity, Inc. 9
Slide
12
Instruction Quadratic Functions: Standard Form
Graphing a Quadratic Function
Graph the function 𝑓 𝑥 = 𝑥2 − 2𝑥 − 3.
Vertex:
𝑥 =−𝑏
2𝑎=− −2
2 1=
𝑓 1 = 12 − 2 1 − 3 =
( , )
Axis of symmetry:
𝑥 =
𝑥-intercepts:
= 𝑥2 − 2𝑥 − 3
0 = (𝑥 − 3)(𝑥 + 1)
𝑥 = ,
𝑦-intercept:
02 − 2 − 3 = −3
Find other points.
𝑓 4 = 42 − 2 4 − 3
𝑓 4 = 5
(4, 5)
Because of symmetry: (−2, 5)
Draw the parabola.
02 − 2 − 3

© Edgenuity, Inc. 10
Slide
14
Instruction Quadratic Functions: Standard Form
Analyzing Parabolas by 𝒙-Intercepts
Quadratic functions can have , 1, or 2 𝑥-intercepts, but they will always
have 𝑦-intercept.
𝑥-intercepts 𝑥-intercept
(𝑥-intercept = vertex)
𝑥-intercepts
The range does not
include , the
parabola does not
cross the 𝑥-axis.
The parabola touches
the 𝑥-axis at exactly
the vertex.
All other cases have 2
𝑥-intercepts.

© Edgenuity, Inc. 11
Summary
Answer
What do the coefficients of a quadratic function in standard form
reveal about its graph?
Lesson
Question?
Slide
2 Review: Key Concepts
Key aspects of quadratic function graphs:
𝑓(𝑥) = 𝑎𝑥2+ 𝑏𝑥 + 𝑐
• : −𝑏
2𝑎, 𝑓
−𝑏
2𝑎
• Minimum (if 𝑎 > 0)
• Maximum (if 𝑎 < 0)
• Axis of symmetry: 𝑥 =
• 𝑥-intercepts when 𝑓(𝑥) = 0
• 𝑦-intercept when 𝑥 = 0
Quadratic Functions: Standard Form

© Edgenuity, Inc. 12
Summary
Use this space to write any questions or thoughts about this lesson.
Quadratic Functions: Standard Form