Embed Size (px)
Citation preview

Warwick
Ward Profile
May 2014
For further information about the Ward Profiles please contact the Intelligence and Analysis Team, Strategy and Communications Sian Melhuish: 020 7641 2160 [email protected] (Main contact)
Damian Highwood: 020 7641 3283 [email protected] (Intelligence and Analysis Manager)

1
Index
Nickie Aiken Conservative
Edward Argar Conservative
Christabel Flight Conservative
Ward Councillors
Victoria Station is located in the west of the ward and is one
of the busiest transport interchanges in London. The area
around Victoria consists predominantly of commercial
property and private and social housing, with retail uses along
the main streets. The area is currently undergoing a
transformation on a large scale, with many new buildings and
improvements to the station underway.
Based on the latest population figures the ward has 9,538
residents making up 4.3% of the total Westminster
population.
1. Ward Information
1. Ward Information
2. Ward Map
3. Summary Chart
4. Population
5. Ethnicity/Nationality
6. Deprivation
7. Unemployment
8. Employment and Qualifications
9. Schools and Education
10. Housing
11. Household Composition
12. Crime, Disorder and Community Cohesion
13. Health and Wellbeing
14. Infrastructure, Service Usage and Satisfaction
15. Vulnerable Adults and Children
16. Transport, Travel and Visitors
17. Sources

2
2. Ward Map

3
Indicator
Ward
Number
Ward
Value WCC Avg
WCC Range
From
WCC Range
To
Population 1 Population Size 9,538 11,193 8,437 13,247
2 % Households in at least 1 dimension of deprivation 2,846 57% 61% 82% 39%
3 Average Household Income £41,899 £38,567 £25,355 £46,969
4 % Lone Parents Not in Employment 82 50% 58% 68% 44%
5 % Worklessness (working age) 665 8% 9% 20% 1%
6 % Job Seekers Allowance Claimants 180 2% 2% 5% 0.1%
7 % Incapacity Claimants 295 5% 6% 12% 0.3%
8 Average Property Price £1,095,615 £1,013,579 £512,342 £2,853,307
9 % of Social Renters 1,416 28% 26% 56% 4%
10 % Long-Term Vacant Dwellings 61 1% 2% 7% 1%
11 % Second Homes Located in the Area 260 5% 6% 0% 18%
12 % Living Alone 2,486 49% 45% 56% 33%
13 % of Over Crowded Households 461 9% 12% 22% 5%
14 % Households with Dependent Children 640 13% 19% 32% 9%
Education 15 % Students with 5+ GCSEs A*-C in Eng & Maths 63% 68% 50% 93%
16 % in Bad Health 489 5% 6% 11% 2%
17 Male Life Expectancy (age) 81 82 74 96
18 Female Life Expectancy (age) 93 86 77 97
19 Male Premature Mortality Ratio 109 87 162 32
20 Female Premature Mortality Ratio 68 78 160 42
21 % Feeling Safe in the Area in Which They Live #N/A 97% 87% 100%
22 % Feel People from Different Backgrounds Get on Well 79% 85% 61% 95%
23 % Satisfied with the Area as a Place to Live 94% 94% 85% 100%
24 All Crime per 100 Residents 1,390 15 24 150 5
Income and Deprivation
Unemployment
Housing
Health
Safety and Satisfaction
3. Summary Chart

4
4. Population In April 2012, the population in Warwick ward reached 9,538 people.
This accounts for 4.3% of the total Westminster population and is lower
than other wards.
The Warwick population has increased by 2% since March 2011.
Westminster saw an increase of 2%.
Compared to the Westminster average, Warwick has:
o a similar proportion of people aged over 65 (12%)
o a higher proportion of working age adults (77%)
o a lower proportion of under 16s (11%)
The majority of residents have lived in this ward between 3-10 years
which is higher than the Westminster average.
10% 8% 6% 4% 2% 0% 2% 4% 6% 8% 10%
0 ‒ 45 ‒ 9
10 ‒ 1415 ‒ 1920 ‒ 2425 ‒ 2930 ‒ 3435 ‒ 3940 ‒ 4445 ‒ 4950 ‒ 5455 ‒ 5960 ‒ 6465 ‒ 6970 ‒ 7475 ‒ 7980 ‒ 8485 ‒ 89
90 and over
Proportion of Population by Five Year Age Groups and Gender, MYE ONS, 2012
Westminster (M) Warwick Westminster (F) Warwick
Males Females
35
7
42
8
21
9
91 33
1
3,4
67
2,0
47
1,3
68
95
8
10
338
7
47
0
22
0
79 3
49
3,4
89
2,0
77
1,3
68
1,0
01
98
0
1,000
2,000
3,000
4,000A
ge 0
-3
Age
4-1
0
Age
11
-15
Age
16
-17
Age
18
-21
Age
22
-35
Age
36
-50
Age
51
-64
Age
65
-84
Age
85
plu
s
Number of People per Age Group
2011 2012
0%
6%6%
17%
33%
8%
1%
29%
Length of Time Living in the Borough, City Survey 2013
Less than 3 months
3-12 months
1 to 2 years
3 to 5 years
6 to 10 years
11 to 15 years
16 to 20 years
More than 20 years

5
Warwick is not as ethnically diverse compared to the City as a whole. The
ward is ranked in the top 6.7% of England according to its Simpson Diversity
Index Score (ONS 2012).
The main ethnic group in Warwick is White: British which makes up 50% of
the ward population. This is much higher than the Westminster average of
35%.
24% of Warwick residents are from non-white ethnic groups.
Just over half of the wards residents were born in the UK (56%).
The 3 main places outside of the UK where residents were born are:
o EU countries (15%)
o North America (4%)
o Rest of Europe ex. EU (3%)
Other than English (which is spoken by 74% of the ward population), the
other main languages are:
o Arabic
o Italian
o French
o Spanish
o Portuguese
0.01.02.03.04.05.06.07.08.09.0
Ch
urc
h S
tre
et
We
stb
ou
rne
Qu
ee
n's
Par
k
Har
row
Ro
ad
Hyd
e P
ark
Re
gen
t's
Par
k
Bry
anst
on
an
d …
Mai
da
Val
e
Ch
urc
hill
Litt
le V
en
ice
Ab
be
y R
oad
Lan
cast
er
Gat
e
We
st E
nd
Bay
swat
er
Kn
igh
tsb
rid
ge …
Mar
yle
bo
ne
…
St J
ame
s's
Vin
cen
t Sq
uar
e
War
wic
k
Tach
bro
ok
Sim
pso
n D
ive
rist
y In
de
x Sc
ore
5. Ethnicity/Nationality
Detailed Ethnic Breakdown Westminster
Count % of ward % of WCC
White: British 4,711 50% 35%
White: Other Western European 688 7% 7%
Black: African 301 3% 4%
White: European Mixed 260 3% 3%
White: Italian 252 3% 2%
Other: Arab 236 3% 7%
White: Irish 221 2% 2%
Asian: Bangladeshi 181 2% 3%
Asian: Indian 171 2% 3%
White: North American 161 2% 2%
Asian: Chinese 160 2% 3%
Mixed: White and Asian 125 1% 2%
Black: Caribbean 120 1% 2%
White: Australian/New Zealander 104 1% 1%
Asian: Pakistani 89 1% 1%
Asian: Filipino 74 1% 1%
Asian: Japanese 74 1% 1%
White: Polish 72 1% 1%
Source: 2011 Census
Warwick

6
The 2011 Census collected information to classify households by four
dimensions of deprivation; Employment, Education, Health and disability,
and Household overcrowding.
In Warwick 43% of households are not deprived in any dimension.
The Index of Multiple Deprivation (2010) places 100% of the ward outside
of the top 25% most deprived areas in England.
The Income Deprivation Affecting Children Index (2010) shows that, on
average, 26% of children live in income deprived households.
Another measure of deprivation is the proportion of children who are
eligible for free school meals. In 2013, in Warwick, 37% of children going
to Westminster schools were eligible to receive free meals.
A measure of deprivation in older people is those claiming pension
credits. Of the residents aged 60 or over, 20% were claiming pension
credits in August 2013.
In 2014, 34% of households in Warwick earned more than £55,000 a year.
0%
10%
20%
30%
40%
50%
2011 2012 2013
Proportion of Pupils Receiving Free School
Meals
Warwick Westminster
39%
43%
35%
35%
17%
15%
7%
6%
2%
1%
0% 25% 50% 75% 100%
Westminster
Warwick
Deprivation Dimensions: Census 2011
Not Deprived in Any Dimension Deprived in 1 Dimension
Deprived in 2 Dimensions Deprived in 3 Dimensions
Deprived in 4 Dimensions
19%
17%
25%
24%
26%
26%
34%
34%
0% 25% 50% 75% 100%
Westminster
Warwick
Household Income: CACI Paycheck, 2014
Under £20K £20-£35K £35-£55k £55k+
6. Deprivation

7
7. Unemployment
In August 2013, the workless rate in Warwick ward was 7.5% (665 people)
which is lower than the Westminster average of 8.6%.
There were 295 claimants of Employment Support Allowance/Incapacity Benefit
(ESA/IB) within the ward. The ESA/IB claimant rate is 4.8%, which is lower than
the Westminster average of 5.5%.
The area has a lower proportion of its workless population who are lone parents
(0.5% of the working age population) compared to the rest of Westminster.
In August 2013, the Job Seekers Allowance (JSA) claimant rate in Warwick was
2%. This is similar to the city rate of 2%.
The number of JSA claimants has decreased by -8% from the previous year from
195 claimants in August 2012 to 180 in August 2013.
24%
58%
5%5% 2%
Type of Benefit Claimed, August 2013
JSA
ESA & IB
Lone Parents
Carers
Others on income related benefits
London England
Count Rate Count Rate Rate Rate
Jobseeker's
allowance180 2.0 3,950 2.0 3.4 3.1
ESA and IB 295 4.8 7,605 5.5 5.5 5.8
Lone parents 40 0.5 1,560 0.8 1.4 1.3
Other 150 0.2 3,440 0.3 0.3 0.4
Out-of-Work
Benefits665 7.5 16,555 8.6 10.6 10.6
Sources: NOMIS and DWP
Warwick Westminster
August 2013 Worklessness
0%
1%
2%
3%
4%
5%
6%
050
100150200250300350400450
Qu
ee
n's
Par
k
Har
row
Ro
ad
Ch
urc
h S
tre
et
Ch
urc
hill
We
stb
ou
rne
St J
ame
s's
Vin
cen
t Sq
uar
e
War
wic
k
Mai
da
Val
e
Tach
bro
ok
Bay
swat
er
We
st E
nd
Lan
cast
er
Gat
e
Litt
le V
en
ice
Bry
anst
on
an
d …
Hyd
e P
ark
Mar
yle
bo
ne
…
Ab
be
y R
oad
Re
gen
t's
Par
k
Kn
igh
tsb
rid
ge …
Cla
iman
t ra
te (
%)
Cla
iman
t co
un
t
Job Seekers Allowance, Source: ONS
Claimant Count Claimant Rate

8
At the time of the 2011 Census, 75% of Warwick residents were
economically active, which was much higher than the Westminster
average of 69% and higher than the London rate of 72%.
Of the economically active residents, the majority were employed full-
time.
Of the economically inactive residents, the majority were students
(including full-time Students).
The majority of Warwick residents who are in employment are likely to
work full-time doing 31 to 48 hours a week.
Those living in this area are more likely to be highly qualified (degree or
above).
6%
50%
13%4% 2%
7% 7% 4% 4% 3%7%
42%
13%5% 3% 7% 10%
5% 5% 4%
0%10%20%30%40%50%60%
Par
t-ti
me
Full-
tim
e
Self
-Em
plo
yed
Un
em
plo
yed
Stu
de
nts
Re
tire
d
Stu
de
nt
Loo
kin
g af
ter
ho
me
Lon
g te
rm s
ick
Oth
er
Economically active Economically inactive
Proportion of working age population who are Economically Active and Inactive, Census 2011
Warwick Westminster
9%6% 7%
1%8%
58%
10%13%7% 8%
1%
9%
50%
13%
0%
10%
20%
30%
40%
50%
60%
70%
No
Qu
alif
icat
ion
s
Leve
l 1:
1+
GC
SEs
(an
y gr
ade
s), N
VQ
Le
vel 1
, or
eq
uiv
ale
nt
Leve
l 2:
5+
GC
SE A
*-C
, 1+
A
-le
vels
/AS-
leve
ls, N
VQ
Le
vel 2
, or
eq
uiv
ale
nt
Trad
e A
pp
ren
tice
ship
Leve
l 3: 2
+ A
-Le
vels
, 4+
AS-
Leve
ls, N
VQ
Le
vel 3
or
eq
uiv
ale
nt
Leve
l 4 p
lus:
Fir
st d
egr
ee
, H
igh
er
De
gre
e, N
VQ
Le
vel 4
-5
, or
eq
uiv
ale
nt
Oth
er
voca
tio
nal
/wo
rk
rela
ted
qu
alif
icat
ion
s
Highest Level of Qualification, Census 2011
Warwick Westminster
8. Employment and Qualifications
Top 5 Occupations
Professional Occupations
Associate Professional & Technical Occupations
Managers, Directors & Senior Officials
Administrative & Secretarial Occupations
Elementary Occupations
Source: Census 2011
Top 5 Industries
Professional, Scientific & Technical Activities
Financial & Insurance Activities
Wholesale & Retail Trade; Repair of Motor Vehicles/Cycles
Public Administration & Defence; Compulsory Social Security
Information & Communication
Source: Census 2011

9
In 2012, the majority of primary school pupils attended Westminster schools rather
than schools outside the City or were being privately educated. The same goes for the
ward's secondary school pupils.
The main Tri-borough primary school attended by Warwick residents was St Peter`s
Eaton Square, and the main secondary school was Pimlico Academy.
During a child’s early years at school a measure of their personal, social and emotional
development as well as communication, language and literacy skills is scored. For
Warwick residents attending a Westminster school, the average score was lower than
the Westminster average in 2012.
86% of resident pupils attending Westminster primary schools achieved at least level 4
in their Key stage 2 for both English and Maths in 2012.
At secondary schools, pupils are instead performing below the Westminster average
for GCSE results with 63% achieving at least 5 GCSE grades A* to C including Maths
and English. The ward's grades were an improvement on last year (61%).
58%
91% 89% 86%
63%65%
87% 85% 81%
69%
0%
25%
50%
75%
100%
78+ Early years inc. 6+ PSED &
CLL
Level 4+ Key stage 2 English
Level 4+ Key stage 2 Maths
Level 4+ KS2 Both Maths &
English
5 GCSE A*-C inc. Maths &
English
Qualification Level Achieved
Warwick Westminster
9. Schools and Education
11954%
2913%
6731%
52%
28460%
214%
16235%
31%
Location of Schools Attended
Attends Westminster school
Attends other Tri-borough school
Attends school outside of Tri-borough or privately educated
Attends special needs school or alternative provision
Primary
Secondary
Warwick
Primary pupils
St Peter`s Eaton Square 47
St Vincent de Paul RC 36
Burdett Coutts Primary 34
Millbank 33
St Barnabas` CofE 31
Churchill Gardens 27
St Gabriel`s CofE 26
Source: WCC Children and Young People
Main Primary Schools 2012
10
£0
£200,000
£400,000
£600,000
£800,000
£1,000,000
£1,200,000
February 2010 February 2011 February 2012 February 2013 February 2014
Average Property Price, Hometrack
Warwick Westminster
10. Housing
Westminster London England
Count % % % %
Owned: Outright 983 20 18 21 31
Owned: With a mortgage 719 14 13 27 33
Shared ownership 57 1 1 1 1
Social rented: From Council 386 8 12 13 9
Social rented: Other 1,030 20 14 11 8
Private rented: Landlord or
letting agency1,607 32 38 24 15
Private rented: Other 128 3 2 1 1
Living rent free 115 2 3 1 1
Total 5,025 100 100 100 100
Source: 2011 Census, ONS
2011 Census: Tenure Warwick
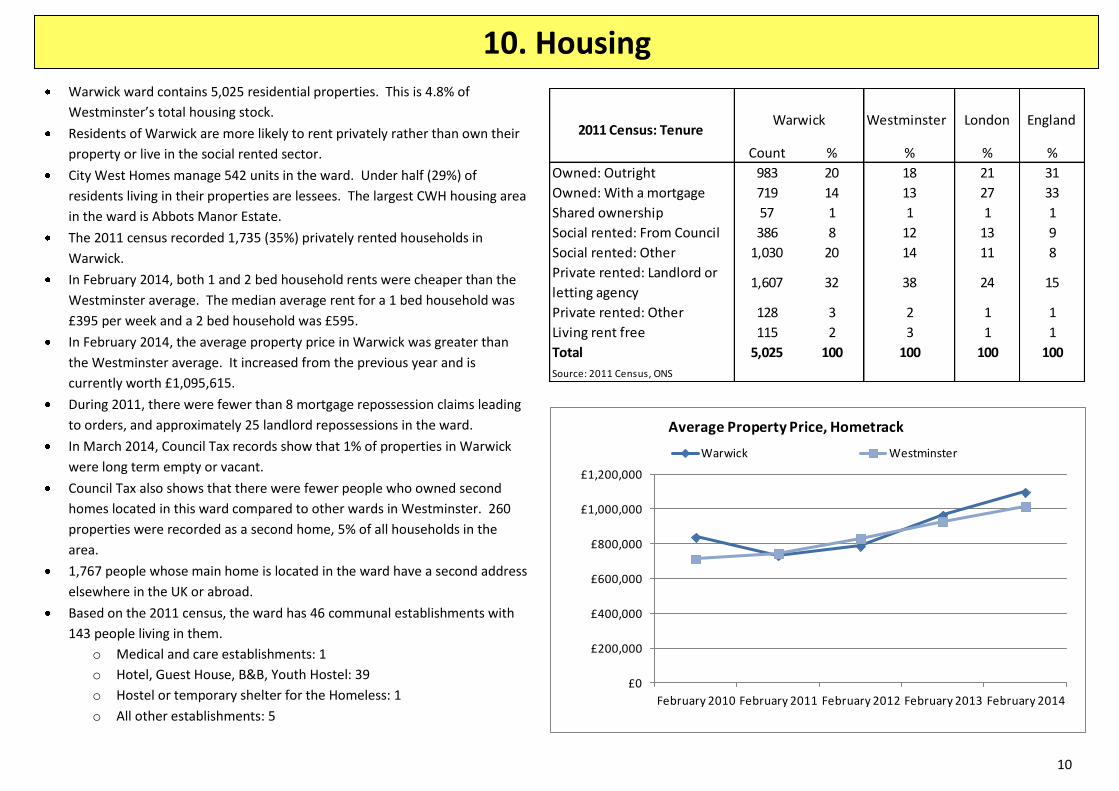
Warwick ward contains 5,025 residential properties. This is 4.8% of
Westminster’s total housing stock.
Residents of Warwick are more likely to rent privately rather than own their
property or live in the social rented sector.
City West Homes manage 542 units in the ward. Under half (29%) of
residents living in their properties are lessees. The largest CWH housing area
in the ward is Abbots Manor Estate.
The 2011 census recorded 1,735 (35%) privately rented households in
Warwick.
In February 2014, both 1 and 2 bed household rents were cheaper than the
Westminster average. The median average rent for a 1 bed household was
£395 per week and a 2 bed household was £595.
In February 2014, the average property price in Warwick was greater than
the Westminster average. It increased from the previous year and is
currently worth £1,095,615.
During 2011, there were fewer than 8 mortgage repossession claims leading
to orders, and approximately 25 landlord repossessions in the ward.
In March 2014, Council Tax records show that 1% of properties in Warwick
were long term empty or vacant.
Council Tax also shows that there were fewer people who owned second
homes located in this ward compared to other wards in Westminster. 260
properties were recorded as a second home, 5% of all households in the
area.
1,767 people whose main home is located in the ward have a second address
elsewhere in the UK or abroad.
Based on the 2011 census, the ward has 46 communal establishments with
143 people living in them.
o Medical and care establishments: 1
o Hotel, Guest House, B&B, Youth Hostel: 39
o Hostel or temporary shelter for the Homeless: 1
o All other establishments: 5

11
In Warwick the most common household size is one person per household.
Despite having a large proportion of single households, there are a number of
families living in Warwick. No Dependent Children in Family 5025 of the
households in this ward live as families.
13% of households have dependent children
6% of households have lone parents
33% of households are living as a couple (married, civil partnership or
cohabiting)
17% of households have the household reference person in the Census as aged
65 years and older
The occupancy rate suggests that:
o 54% have the just the right number of bedrooms for their composition
o 37% of households are under occupying their property
o 9% of households are over-crowded
Over-crowding here seems to be less of a problem compared to the rest of
Westminster, where the over occupancy rate is 12%.
11. Household Composition
Westminster
Count % %
No dependent children 4385 87% 81%
1 dependent child 340 7% 9%
2 dependent children 193 4% 6%
3 plus dependent children 107 2% 4%
Source: 2011 Census
2011 Census: Households
with dependent children
Warwick
Westminster
Count % %
One person aged under 65 1933 38% 35%
Two adults aged 16 to 64 and no children 1265 25% 22%
One person aged 65 and over 553 11% 10%
Three or more adults and no children 439 9% 10%
Two adults and one or two children 290 6% 8%
Two adults with at least one aged 65+ and no children 246 5% 6%
No adults or one adult and one or more children 134 3% 4%
Three or more adults and one or more children 96 2% 3%
Two adults and three or more children 69 1% 2%
Warwick2011 Census: Household Living Arrangements
2,486
1,601
503248 127 37 13 10
0
500
1,000
1,500
2,000
2,500
3,000
1 P
ers
on
2 P
eo
ple
3 P
eo
ple
4 P
eo
ple
5 P
eo
ple
6 P
eo
ple
7 P
eo
ple
8 P
eo
ple
p
lus
Nu
mb
er
of
ho
use
ho
lds
Number of People in Household, Census 2011
Warwick
1 2 3 or more
Age 0-4 163 110 68
Age 5-11 73 66 37
Age12-18 104 17 2
Age of youngest dependent
child
Number of children

12
12. Crime, Disorder and Community Cohesion
Warwick ward had 1,390 crimes reported in the past year which equates to 14.8 crimes
per 100 population. This is lower than the Westminster average of 24.1 crimes per 100
population and is higher than the London average of 0.0. These rates do not necessarily
indicate how likely ward residents are to become victims of crime.
Crime levels in the past year ending March 2014 have decreased by 16% compared to the
previous year in Warwick ward compared with a 13% decrease in Westminster overall.
The number of residential burglaries for this ward has decreased by 20% compared to the
previous year (40 compared to 50), this compares to the whole of Westminster where
burglaries decreased by 7%.
According to the City Survey, 2013, residents of Warwick perceive the top ASB issues to
be:
o Dog fouling
o Homeless/begging
o Drunk/rowdy people
o Gangs/gang violence
o Aggressive Dogs
There were 326 London ambulance service attendances to alcohol related incidents in
Warwick in the past year, this equates to 5.0% of the Westminster total for this type of
incident.
London Fire Service attendances to primary and secondary fires in the year ending March
2014 was 47, 5.0% of the Westminster total.
The City Survey found that 99% of respondents felt safe in the area they lived and if
walking alone after dark this changed to 93%.
The City survey found that 79% of residents felt that the local area was a place where
people from different backgrounds get on well together. This is lower than the City
average of 85%.
0200400600800
1,0001,2001,4001,6001,800
Mar
20
13
Jun
20
13
Sep
20
13
De
c 2
01
3
Mar
20
14
All Recorded Crimes: Rolling year total number of
crimes for month ending
Rolling year crime total Trend
Count Rate Count Rate
Ambulance attendances for
alcohol related incidents326 3.5 6,532 3.0
Fire service attendances for
primary and secondary fires47 0.5 943 0.4
All notifiable offences 1,390 14.8 52,915 24.1
Violence against the person 261 2.8 7,185 3.3
Criminal damage 73 0.8 2,095 1.0
Robbery 48 0.5 2,288 1.0
Burglary in a Dwelling* 40 0.8 1,530 1.4
Drug crime 158 1.7 3,874 1.8
Theft and Handling 705 7.5 32,168 14.7Sources: Met Police published CRIS data, Ambulance and Fire data from SafeStats London
Warwick WestminsterAnnual Service Statistics
* Rate based per 100 households rather than 100 residents

13
The 2011 census showed that 5% of the ward population felt they were in bad or very bad health which is similar
to the Westminster average of 6%.
The census also recorded 13% of the wards population as having a long-term limiting illness, similar to the
Westminster average of 14%.
In August 2013, 400 people in Warwick claimed Disability Living Allowance (DLA) which represents approximately
4.2% of the ward population.
375 people claimed under the ‘care’ element of DLA and 340 people claimed for the ‘mobility’ element (people
can receive both elements).
Life expectancy from birth is estimated using probability of survival, mortality and population for each age group
between 2006 -2010. In this ward, life expectancy is lower than the Westminster average for males but for
females the life expectancy is higher; however confidence ranges vary depending on the frequency of instances.
The premature mortality ratio is a comparison of observed deaths with the number of expected deaths in the
population aged under 75. In Warwick, whilst the male ratio was higher than the Westminster average, the
female ratio was lower than the Westminster average.
The GLA Well-being index (2012) is based on a number of measures including health, economic security, safety,
families, accessibility and community. Warwick is ranked 130 out of 625 London wards which means it records
one of the best 25% of well being scores in London.
Approximately 80% of adults took part in one or more sessions of sport or active recreation per week which is not
as good as the Westminster average (81%) (Sport England, 2008).
13. Health and Wellbeing
56%30%
9%4%
1%
Proportion of the Ward in Good or Bad
Health, Census 2011
Very Good Health
Good Health
Fair Health
Bad Health
Very Bad Health
81.382.3
93.2
86.3
60
65
70
75
80
85
90
95
100
105
Warwick Westminster average
Age
Life Expectancy from Birth
Male Female
14
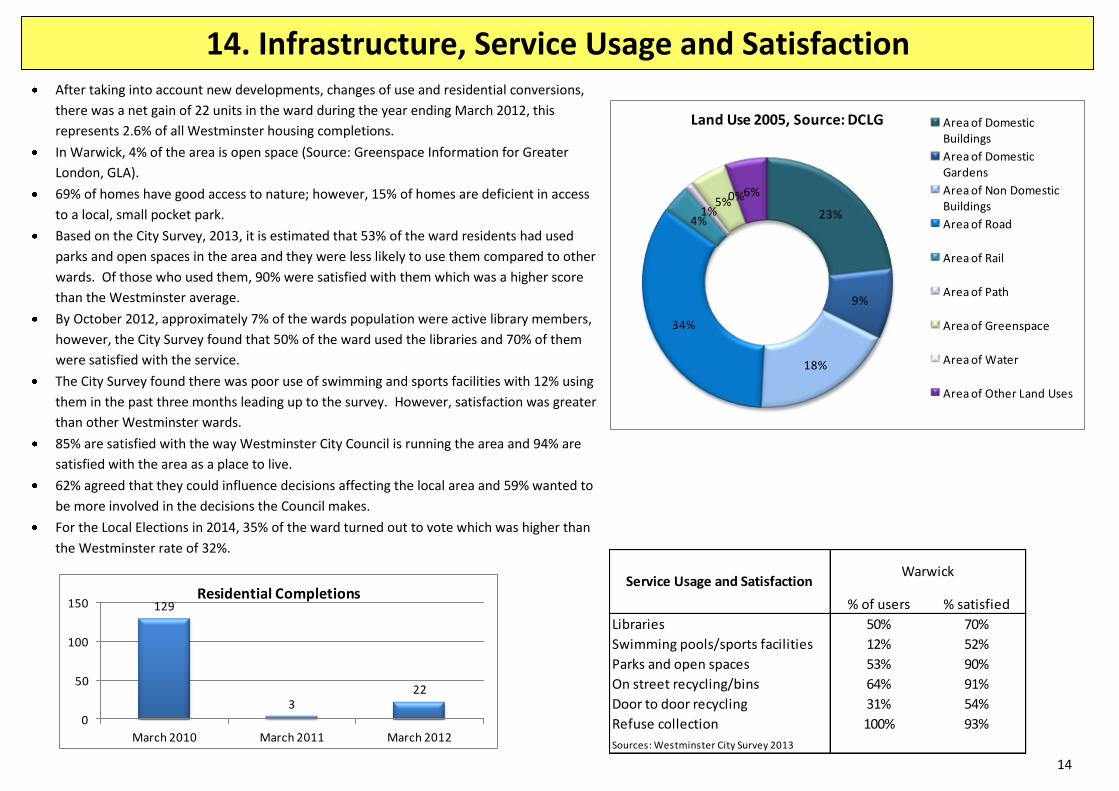
After taking into account new developments, changes of use and residential conversions,
there was a net gain of 22 units in the ward during the year ending March 2012, this
represents 2.6% of all Westminster housing completions.
In Warwick, 4% of the area is open space (Source: Greenspace Information for Greater
London, GLA).
69% of homes have good access to nature; however, 15% of homes are deficient in access
to a local, small pocket park.
Based on the City Survey, 2013, it is estimated that 53% of the ward residents had used
parks and open spaces in the area and they were less likely to use them compared to other
wards. Of those who used them, 90% were satisfied with them which was a higher score
than the Westminster average.
By October 2012, approximately 7% of the wards population were active library members,
however, the City Survey found that 50% of the ward used the libraries and 70% of them
were satisfied with the service.
The City Survey found there was poor use of swimming and sports facilities with 12% using
them in the past three months leading up to the survey. However, satisfaction was greater
than other Westminster wards.
85% are satisfied with the way Westminster City Council is running the area and 94% are
satisfied with the area as a place to live.
62% agreed that they could influence decisions affecting the local area and 59% wanted to
be more involved in the decisions the Council makes.
For the Local Elections in 2014, 35% of the ward turned out to vote which was higher than
the Westminster rate of 32%.
% of users % satisfied
Libraries 50% 70%
Swimming pools/sports facilities 12% 52%
Parks and open spaces 53% 90%
On street recycling/bins 64% 91%
Door to door recycling 31% 54%
Refuse collection 100% 93%
Sources: Westminster City Survey 2013
WarwickService Usage and Satisfaction
14. Infrastructure, Service Usage and Satisfaction
129
322
0
50
100
150
March 2010 March 2011 March 2012
Residential Completions
23%
9%
18%
34%
4%1%
5%0%6%
Land Use 2005, Source: DCLG Area of Domestic Buildings
Area of Domestic Gardens
Area of Non Domestic Buildings
Area of Road
Area of Rail
Area of Path
Area of Greenspace
Area of Water
Area of Other Land Uses

15
25% of resident primary and secondary school pupils attending a Westminster school have
specialist educational needs. 21% are children on School Action (where they have additional
support to meet their learning difficulties) or School Action Plus (external advice and support) and
4% have statements (a formal document detailing the child’s learning difficulties after a statutory
assessment).
In November 2012, 4 families were assessed as having complex needs.
The 2011 Census showed that there are 82 lone parents who are not in employment with
dependent children.
There is a higher proportion of older people aged 65 plus living in this ward compared to other
Westminster wards, they make up 12% of the wards population. Those aged 85 plus account for
1.0% of the wards population.
50% of older people aged 65 plus live alone.
In August 2012, there were 93 people being supported in the community with older
people/physical disability services from Westminster Council. This is lower than the Westminster
average where the number supported is 120.
Special Educational Needs Warwick Westminster
Action/Action plus 21% 26%
Statemented 4% 5%
Source: Schools and Children WCC
15. Vulnerable Adults and Children
55311,035
54614,352
0%
10%
20%
30%
40%
50%
60%
70%
80%
90%
100%
Warwick Westminster
Older People Living Alone, 2011 Census
Older people living alone Older people not living alone
0%
10%
20%
30%
40%
50%
60%
70%
80%
050
100150200250300350400450
Ch
urc
h S
tre
et
Hyd
e P
ark
Ch
urc
hill
We
stb
ou
rne
Ab
be
y R
oad
Litt
le V
en
ice
Har
row
Ro
ad
Mai
da
Val
e
Qu
ee
n's
Par
k
Bry
anst
on
an
d …
Bay
swat
er
Re
gen
t's
Par
k
Vin
cen
t Sq
uar
e
Lan
cast
er
Gat
e
We
st E
nd
Kn
igh
tsb
rid
ge …
War
wic
k
Tach
bro
ok
Mar
yle
bo
ne
Hig
h …
St J
ame
s's
Pro
po
rtio
n (%
)
Co
un
t
Lone parents not in employment, 2011 Census
Number in ward Proportion of all lone parents

16
16. Transport, Travel and Visitors
Based on modelled experimental statistics in August 2011, it is
estimated that the day time population in Warwick reaches
approximately 50,000 people (this includes working population,
residents at home in the day and visitors). This compares to the
resident population of 9,538.
Victoria Tube Station (also a Rail Station) is located in Warwick
ward. The annual entry and exits from the tube stations
identified amounts to 82.2million, this represents 3.2% of all of
London Underground entries and exits.
The Business Register and Employment Survey shows that in
2012, there were 19,300 jobs in the area, this represents 3.0% of
all Westminster jobs.
The main method that Warwick residents use to travel to work is
by underground/metro/light rail/tram; 32% use this method of
travel.
7%
32%
6%14%
1%2%
7%
1%
6%
23%
1%
Method of Travel to Work: 2011 Census
Work mainly at or from home
by underground/metro/light rail/tram
by train
by bus, minibus or coach
by taxi
by motorcycle, scooter or moped
by driving a car or van
by being a passenger in a car or van
by bicycle
on foot
Other method of travel to work

17
17. Sources Population Mid Year Estimates, 2012 Total Population and Population per Age Group, Census 2011 Length of Time Living in the Borough, City Survey 2013
Ethnicity/Nationality Detailed Ethnic Breakdown, Census 2011 Simpsons Diversity Index Score, GLA: London Data Store 2011 Country of Birth, Census 2011 Language Spoken, Census 2011
Deprivation Households by Deprivation Dimensions, Census 2011 Index of Multiple Deprivation, Department for Communities and Local Government 2010 Free School Meals, Tri-Borough Children’s Services: Schools 2013 Pension Credits, Department of Work and Pensions (DWP): Office for National Statistics 2013 Household Income: CACI Limited: Paycheck data 2014
Employment and Qualifications Economically Active and Inactive, Census 2011 Highest Level of Qualification, Census 2011 Hours Worked, Census 2011 Occupation Classification – Major Group, Census 2011 Industry Classification, Census 2011
Unemployment Out of Work Benefits by Type of Claimant, , DWP: Office for National Statistics 2013 Job Seekers Allowance, DWP: Office for National Statistics 2013
Schools and Education Primary and Secondary Schools Attended, Tri-Borough Children’s Services: Schools 2012 Qualification Level Achieved, Tri-Borough Children’s Services: Schools 2012
Housing City West Homes Households and Lessees, City West Homes 2011 Residential Properties and Tenure, Census 2011 Average Property Price, Hometrack 2014 Average Rents, Hometrack 2014 Repossessions, Ministry of Justice 2011 Second Homes located in Ward, WCC Strategic Finance: Council Tax 2014 Second Homes located outside Ward, Census 2011 Communal Establishments, Census 2011
Health and Wellbeing General Health, Census 2011 Long Term Health Problem or Disability, Census 2011 Disability Living Allowance, DWP 2013 Life Expectancy from Birth, London Health Programmes: Health Needs Assessment Toolkit 2006 - 2010 Premature Mortality Ratio, London Health Programmes: Health Needs Assessment Toolkit 2006 - 2010 Well-being Index, GLA 2010 Sport and Active Recreation, Sport England, 2008
Household Composition Household size, Census 2011 Households Composition, Census 2011 Families with Dependent Children, Census 2011 Household Living Arrangements, Census 2011 Occupancy Rating (Bedrooms), Census 2011
Crime, Disorder and Community Cohesion Ambulance Attendances, SafeStats London 2014 London Fire Brigade Attendances, SafeStats London 2014 Crime Data, Metropolitan Police Service 2014 Feelings of Safety, City Survey 2013 People Get On Well Together, City Survey 2013
Infrastructure, Service Usage and Satisfaction Residential Completions, WCC Built Environment: Planning 2012 Land Use, Department for Communities and Local Government from GLA London Data Store 2005 Open Space, Nature and Parks, Greener Information for Greater London GLA London Data Store 2012 Service Usage and Satisfaction, City Survey 2013 Active Library Users, Tri-Borough Libraries and Archives 2012 Council Involvement and Influencing Decisions, City Survey 2013 Electoral Turnout, London Elects from GLA London Data Store 2014
Vulnerable Adults and Children Special Educational Needs, Tri-Borough Children’s Services: Schools 2012 Troubled Families, Tri-Borough Children’s Services: Family Recovery 2012 Older People Living Alone, Census 2011 Lone Parents with Dependent Children, Census 2011 Households Composition, Census 2011 Older People/Physical Disabilities Supported in the Community, Tri-Borough Adult Social Care 2012
Transport, Travel and Visitors Experimental Day Time Population, WCC Strategic Finance: Intelligence and Analysis 2011 Underground Entry and Exits, Transport for London 2011 Area Employment, Business Register and Employment Survey from GLA London Data Store 2012 Method of Travel to Work, Census 2011