Embed Size (px)
Citation preview
1Section A
Warwickshire County Council
Statement of Accounts
2019/20

2Section A
Warwickshire County CouncilStatement of Accounts
Section A: Narrative Statement
Section B: Warwickshire County Council Statement of Accounts
Section C: Warwickshire County Council Annual Governance Statement
Section D: Warwickshire Pension Fund Statement of Accounts

3Section A

4Section A
IntroductionI am pleased to introduce our Financial Accounts for 2019/20. The purpose of these accounts is to present a true and fair view of the financial results of our activities for the year and the value of our assets and liabilities at the end of the year. They represent the financial results of the delivery of the third and final year of our 2017-2020 One Organisational Plan. This narrative report is set out in five parts. The first provides some key information on what the Council does, how it does it and its plans for the future. The second part provides further detail on how we plan to resource the Council’s activities. This section also
considers the factors in the external environment that influence our decisions and highlights some of the key risks that we have identified to our priorities. The third part summarises our financial and other performance in 2019/20 and our effectiveness in the use of our resources, while the fourth part describes our outlook moving forward into the new financial year. It includes some of the key pressures facing the Council over the next few years and the changes taking place in the Council to respond to those challenges. Finally, this report explains how the Financial Accounts for 2019/20 are prepared and set out.
Rob PowellStrategic Director for Resources

5Section A
Organisational Overview and Operational ModelIn February 2020 our 2020-2025 Council Plan was approved. It is a single, policy-led plan that sets out a clear and compelling vision for Warwickshire, clearly defining where we need to get to by 2025 and how we are going to get
there. The Council Plan provides the necessary framework to deliver change management and transformation and to ensure clear line of sight delivery of the Council’s core purpose and outcomes.
Reduce demand and reduce cost through innovative service design and focussed prevention interventions
Work with communities to promote safety, prevent harm and reduce crime and disorder across Warwickshire Support and enable children and young
people to access a place in a high quality education setting and achieve their full potential
Manage and maintain Warwickshire’s transport network in a safe, sustainable and integrated way
Increase reuse, recycling and composting rates and reduce waste across Warwickshire
Attract economic investment and maximise the rate of employment, business growth and skill levels in Warwickshire
Support communities and businesses to develop the digital skills and tools they need in an increasingly digital economy
Make it easy for customers to access our information and services so they have a positive experience of our services
Put our resources in the right place to support the organisation’s priorities and balance the books
Develop our workforce so that it has the right skills and capabilities to get the job done
Pursue leadership excellence and high performance at all levels
Support Warwickshire residents to take responsibility for their own health and wellbeing and reduce the need for hospital or long term health care
Support the most vulnerable and disadvantaged adults in Warwickshire to enjoy life; achieve and live independently
Support our most vulnerable and disadvantaged children, providing early support, before situations become complex
To make Warwickshire the
best it can be, sustainable now
and for future generations
Making the best use of resources
As part of our response to climate change, we make sure our work is in-line with the UN Sustainable Development Goals
Warwickshire’s communities and individuals are supported
to be safe, healthy and independent
PRIORITY OUTCOME
Warwickshire’s economy is vibrant and supported by the right jobs, training, skills and
infrastructure
PRIORITY OUTCOME
SUPPORTED BY
2

6Section A
The Council Plan is supported by a rolling five-year medium-term financial strategy. This helps us to plan ahead, so we are able to meet our spending requirements, taking into account Government grants, Business Rates and Council Tax income. The financial strategy helps us do this in a planned and careful way, so we are able to provide good quality services for our residents.
There are a number of key themes to the financial strategy:
• the organisation will invest in areas of focus, those being tackling climate change internally and in the local community;
• implementation of the commercialism agenda• Furthering the preventative strategy to help more
people avoid the need to use our services;• scoping innovation and development ideas and
progressing internal change;• where appropriate, we will invest in physical assets
to benefit those who live, work and visit the county.
We are becoming more commercially minded in the delivery of our services. This is a key driver of our change programme and will help us make better use of our resources to deliver the outcomes our residents have helped prioritise.
We use reserves to manage financial risk and promote financial sustainability. Any reserves not needed to manage financial risk are used for time-limited investment to support the delivery of the Council’s objectives or to deliver savings to reduce demand in future years.
The medium-term financial strategy will require regular reviews in order to remain dynamic, robust, ambitious and deliverable, and will be updated at least annually. Politically, Warwickshire County Council has 57 Councillors, who are elected every four years. The last elections were held on 4 May 2017. The current political composition of the Council is 35 Conservative members, 10 Labour members, eight Liberal Democrat members, two Green Party members and two Independent. The Council makes its decisions via a Cabinet of nine members including the Leader of the Council, Cllr Izzi Seccombe. Warwickshire’s Councillors are responsible for setting the strategic direction of the Council and for scrutinising
performance. Further details of the governance arrangements in the Council are included in the Annual Governance Statement, included within this document. Organisationally, Warwickshire operates through three Directorates: Communities (including Fire and Rescue and Education), People (including Public Health) and Resources. Each Directorate is headed by a Strategic Director who sits on the Council’s Corporate Board along with the Chief Executive. Services within each Directorate have plans in place which correspond to the budget set for them by Council and the key outcomes within the Council Plan. Each service has Key Performance Indicators which are monitored and included in quarterly performance reports to Directorate Leadership Teams and Members. At the end of the year we had the equivalent of 3,806 full-time employees and just under half our spending each year is on staffing. This is an increase of 32 full-time employees from last year. Warwickshire’s employees are responsible for translating Councillors’ strategic decisions into actions. Our Workforce Strategy sets out the key principles to ensure we have a workforce that is fit for purpose to deliver the Council Plan.
The Council collaborates with a number of external partner organisations to plan and deliver its intended outcomes. These include the neighbouring councils of Coventry City Council, Solihull Metropolitan Borough Council, and the five Warwickshire District and Borough Councils. We are a non-constituent member of the West Midlands Combined Authority and a member of the Coventry and Warwickshire Local Enterprise Partnership. We work closely with local NHS organisations and a number of other bodies, including:
• central government departments and ministries;
• national and local charities; • academy schools and academy trusts in
Warwickshire; • local universities and other academic
organisations; • local industry and businesses;• town and parish councils in Warwickshire. Further details of the Council’s key priorities, plans and outcomes are available in the Council Plan.
7Section A
Resourcing our activities
Revenue and capital spending
The medium-term financial plan underpins the delivery of the Council Plan and is agreed as part of the budget-setting process which concludes in February each year. Taking a medium-term approach allows for a more coordinated and planned approach to prioritisation, and allows
services to focus on delivery knowing the financial limits and constraints within which they are required to operate. Within the budget resolutions, the Council confirms and applies a number of fundamental financial strategies and policies.
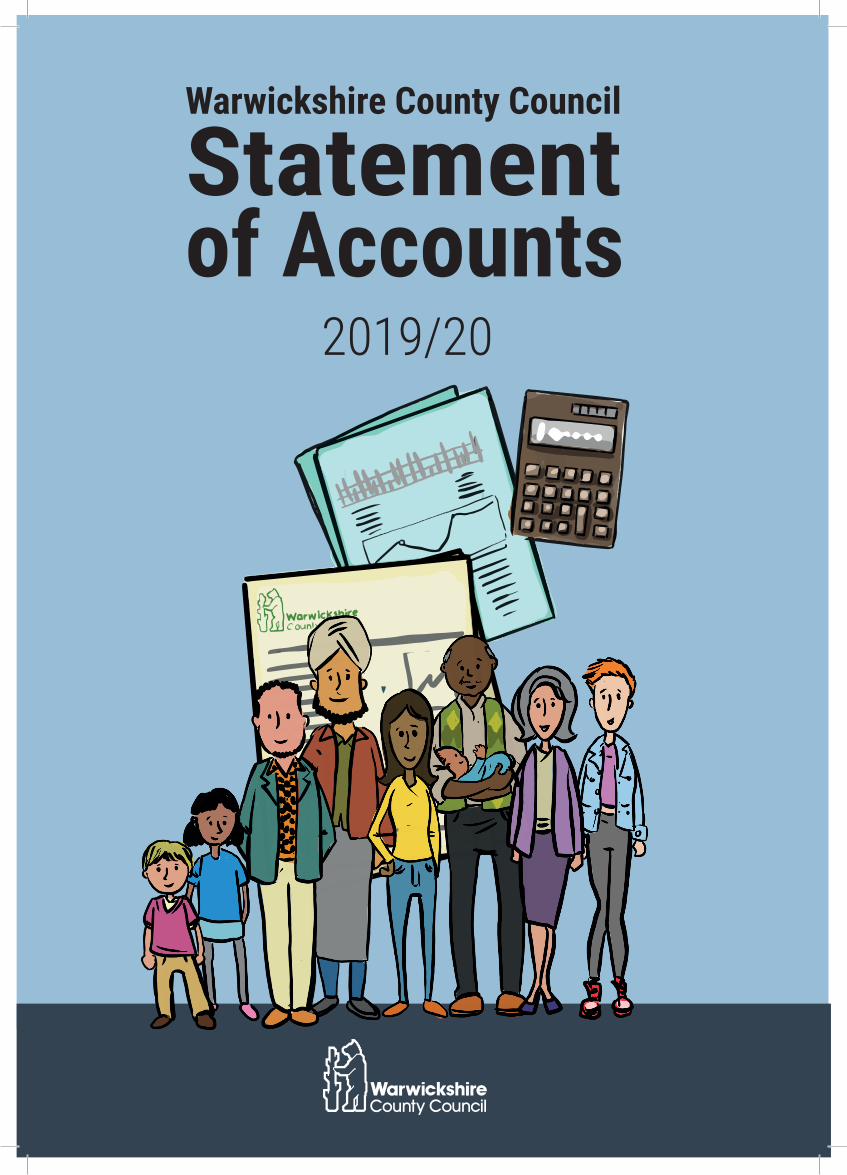
We use our resources in two ways, through revenue and capital spending. Broadly, our revenue spending relates to income received in year and spending on items used in the year. Most of our salary costs are included in revenue expenditure. Our capital spending relates to items we have bought, created or improved and which will be used for more than one year. An annualised amount is charged to our revenue accounts to reflect the economic use of assets each year to provide services or reduce cost in line with strategic objectives. This accounting charge does
not reduce our revenue resources, but borrowing to fund our capital expenditure does.
Revenue allocations are made to services through a process which balances demand forecasts, inflation and other price increases, commitment to our statutory duties and the investment choices which the Council wishes to make to improve services or reduce costs. By law, we must set a balanced budget which ensures that the Council meets not only its existing commitments but also remains on a firm footing for the future.
Revenue resourcesOriginal budget at start of year
Business Rates
Council Tax
2019/20 £m 2020/21£m
Specific Government Grants
Adult Social Care Levy
Receipts for Services
Dedicated Schools Grant
Total Revenue Resources
Total Unconditional Revenue Resources
67.4
275.7
343.5
71.9
21.2
92.7
226.1
755.4
71.2
286.4
357.6
79.7
27.2
115.4
238.0
817.9

8Section A
Adult Social Care is our second largest area of revenue spending after Schools. Each year since 2016-17 the Government has permitted local authorities to levy an additional 2% on top of their normal council tax increase each year, with this additional funding to be ring-fenced for use in adult social care. We have taken the additional levy (2% for each year in that period) and have increased the resources available to deliver adult social care by at least the amount raised this way.
The figures shown above for specific Government grants include a number of grants which come with conditions that limit our discretion in how they can be used. The largest of these is the Dedicated Schools Grant which we receive from government to meet the cost of funding schools and relevant pupil-related services; this is forecast to reduce year-on-year as more of our schools transfer to academy status. We are currently reviewing how we deploy these resources for maximum strategic effectiveness.

9Section A
Capital resourcesOriginal budget at start of each year
2019/20 £m (actual)
2020/21 £m(forecast)
2021/22and later £m (forecast)
Capital Grants and Contributions
Receipts from the Sale of Assets
Direct Application of Revenue Resources
Borrowing (to be repaid from revenue resources)
Total Capital Resources
109.2
39.1
1.7
5.1
155.1
109.5
35
1.6
1.7
147.8
95.4
11.1
0.1
2.7
109.3
Our capital allocations are made in line with our Capital Strategy, which includes two key elements: capital maintenance works to ensure our assets continue to be fit for purpose and able to support the provision of services; and capital investment to create and develop new assets. Each element has a number of strands that ensure a clear focus on the purpose of capital spending and the prioritisation of proposals, underpinned by specific service asset management strategies.
Allocations included in the maintenance programme meet one of the following three criteria:• maintaining our assets to ensure services can
continue to be delivered;• statutory health and safety and other
regulatory requirements;• annual equipment and/or vehicle replacement
programmes.
Our capital spending power is the combination of external income which must be spent on capital (such as specific grants or contributions and the receipts from the sale of our assets) and the extent to which the Council is willing to meet the costs associated with borrowing money from its revenue resources.
Our annual maintenance programme includes allocations from the Government grants received for schools and highways maintenance plus revenue funding used for the replacement of vehicles, where this is more cost effective than leasing the vehicle. We also finance some maintenance from borrowing.
Investment schemes are, by their nature, not routine and so are only considered if they move the organisation towards the delivery of our outcomes. Where we have discretion in how to apply capital financing, we use a structured evaluation process that assesses:• what we are trying to achieve for the
Warwickshire residents, businesses and visitors by investing in particular assets;
• the contribution of the new assets to the delivery of the corporate outcomes;
• the financial costs and benefits over the short, medium and long-term; and
• the risks inherent in the delivery of the scheme itself and the expected benefits, with a focus on better up-front planning and timetabling.
Investment schemes may be funded by any of the sources in the above table, and often a combination of these.

10Section A
Revenue resourcesOriginal budget at start of year
Business Rates
Council Tax
2019/20 £m 2020/21£m
Specific Government Grants
Adult Social Care Levy
Receipts for Services
Dedicated Schools Grant
Total Revenue Resources
Total Unconditional Revenue Resources
67.4
275.7
343.5
71.9
21.2
92.7
226.1
755.4
71.2
286.4
357.6
79.7
27.2
115.4
238.0
817.9
ReservesReserves are resources we have accumulated over time and set aside for a particular purpose as part of an integrated approach to the successful financial management of the authority over the short, medium and long term. We hold reserves to: • ensure future events outside of our control do
not undermine the authority’s overall financial position or impact on service delivery;
• plan for the effective use of resources over time for a specific purpose;
• ensure we meet funding conditions (set either by an external funding body or a specific decision of Members) in our use of any available resources;
• retain any other accumulated underspends prior to decisions on their use.
Our budget is set to include anticipated levels of reserves added or drawn down in the year; these plans may change as the year progresses to react to emerging pressures or other events and are approved in our quarterly monitoring process. Some reserves are held at a corporate level to support overarching risks and strategies. The level of general reserves is consistent with the overall financial environment and the key financial risks faced by the Council. These risks are assessed at least annually and take account of circumstances at the time of assessment as well as trends into the future.”
Savings and efficiencies
The resource estimates shown above reflect the impact of both continuing austerity and the broader economic outlook. The Council has successfully delivered savings through the previous three year One Organisation Plan to build reserves and therefore financial resilience against any negative impacts. The Council Plan aims to further this success, maintaining strategies of investment for longer term savings and finding new ways of working rather than
upfront cuts to decrease input. The two key themes are internal improvement through digital and commercial approaches and external demand management through prevention and joint working with partners and communities. The Council Plan tasks the authority over the next 5 years with finding £33.3m of savings (after growth and inflation) this figure is be reviewed annually, especially in light of pressures caused by Covid-19 and recovery (see separate section).

11Section A
The successful delivery of the Council Plan and our sustainability into the future are dependent on our ability to manage and respond to the risks we face. Many potential issues will remain on the risk register and be regularly monitored , while others are actively managed to reduce the risk or its impact. Further information can be found in the Annual Governance Statement section within this document.
Management of Risk
We undertake treasury management activities in a prudent and flexible manner so as to ensure we retain sufficient liquid funds to provide for day-to-day cashflow requirements whilst funding our capital spend at the lowest cost. These activities are managed within an overall framework determined by the Treasury Management and
The majority of the Council’s employees are members of the Warwickshire Local Government Pension Scheme, and the Council administers the fund that supports the Scheme. As a defined benefit scheme, the Scheme is shown as a long-term liability in our accounts. However, statutory arrangements for funding this deficit are in place, including increased contributions over the working life of employees, and means that our financial position remains healthy.
Investment strategies which are updated and approved by Members annually. Interest income and expenditure as a result of investments or borrowing is reflected in our revenue budgets. Our budget does not rely on significant income streams from commercial or service investment activities.
Both the accounts for the County Council and the Pension Fund are included in this document, though they are operated as independent entities. The County Council’s accounts reflect the pension disclosures relating only to its own employees. This includes disclosures for those staff with alternative pension schemes, such as Teachers and Firefighters.
Borrowing and investments
Pensions

12Section A
Our performance in 2019/20
1.5 million
Across our active WCC social accounts.
visits to our libraries, loaning 1.5 million items
Customer Service Centre answered
51%
The unemployment rate in the county was
2,583
Registration service took
of household waste was reused, recycled or composted
1.9%
246,910 calls
21 apprentices
Warwickshire County Council recruited
and 22 Civil Partnerships
and answered 3,775 Live
Chats
The percentage of early years providers that are judged by Ofsted as good/outstanding in Warwickshire continues to exceed the national figures
Primary admissions 2020/21 over-subscription criteria now includes disadvantaged children to increase their chances of getting a place at their preferred school
marriages
Delivery of 55 cybercrime awareness sessions and events, to over 4,800 residents across the county.
There were also 9,396,650 virtual visits and 90,298 eBooks issued on loan
56 Prevent-related awareness and training sessions were delivered to over 1,570 residents and professionals in Warwickshire.
including exceptions improved from 60% last year to 86% this year.
70% of Education
Health Care
Plans issued
within 20
weeks
7 Local Government and Social Care Ombudsman,Judicial Review cases or Information Commissioner’s Office adverse decisions for WCC, compared to 16 last year.
3,843 incidents attended by Warwickshire Fire and Rescue Service
We gained
37,495followers and likes across our social media accounts

13Section A
Warwickshire’s communities and individuals are supported to be safe, healthy and independent
Delivering against our aims for this outcome remains challenging as demand continues to rise; nevertheless, key outcomes have been achieved throughout the year.
We have introduced a new integrated model for safeguarding children and adults in the county. This allows for a family-focused approach to working across the safeguarding area, bringing together information and guidance for adults, children, young people and their families and the professionals who work with them to help keep everyone in Warwickshire safe.
As part of our commitment to give people better access to Assistive Technology and to help them focus on their strengths, we launched a new website, AskSARA. The easy-to-use website helps improve access to a range of self-help smart technology and associated services to help make daily activities easier, help people to stay well for longer.
Adult Social Care reviewed its practices and systems to launch a ‘Start with strengths’ approach in September 2019. The service works with people from a strengths perspective, by listening and understanding them, to build a picture of their qualities, skills, interests and networks to explore how they can best support their needs.
Our Children and Families services are embedding a new way of working with children and families by creating and maintaining respectful and trusting relationships.
Relationships are child centered - the service works with the whole family to provide practical support and recognises that families are the experts in their lives and their strengths and goals will be central to our approach.
Our redesigned Children and Family Centres launched in September 2019, offering a mix of services for families with children aged from 0-19 (25 for those with additional needs). Information and advice is provided on a range of issues affecting families such as parenting, finance and relationships as well as health.
We continue to support the care experience of young people, developing a range of activities for young people, to increase their confidence, improve social interaction, reduce loneliness and improve life chances. Examples include care leaver football team; breakfast club and the Chill & Grill, at the Young People’s Quirky Café; parent and baby group, NEETs (Not in Education, Employment or Training) group; food hygiene course and care leaver (free)shop and two new care leaver drop-in centres.
Positively the number of Child Protection Plans in place has reduced from 345 in March 2019 to 298 in March 2020 with, the rate reducing from 29.8 per 10,000 in March 2019 to 25.7 in March 2020. However, the challenge is the number of children in care, where including Unaccompanied Asylum Seeking Children (UASC), the number increased from 722 in March 2019 to 753 in March 2020 with a rate of 62.3 per 10,000 in March 2019 to 65 in March 2020. Excluding UASC,

14Section A
there was an increase from 654 in March 2019 to 679 in March 2020 and a rate of 56.4 per 10,000 in March 2019 to 58.6 in March 2020. To improve outcomes for children and families, over the next two years the Council is investing in children’s services to strengthen our early help services, and provide additional support to children in need and in care and care leavers.
Working in partnership with the South Warwickshire Clinical Commissioning Group we have commissioned a Hospital Social Prescribing Service run by Age UK. The service helps patients at the Warwick, George Eliot and St. Cross hospitals to access non-medical services that can enable them to manage their own physical and mental health better and can encourage them to make lasting changes to their lifestyles, so they stay well. The hospital-based service will play an important role in making sure that patients are discharged in a safe and timely way, with access to available help in their communities. 2019 was the Coventry and Warwickshire Year of Wellbeing which encouraged people to be part of a strong community which was inspired and empowered to take action to improve health and wellbeing for themselves and others in 2019 and beyond. There were many activities throughout the year including GoodGym where a community of volunteers came together to be active while doing good deeds such as painting community spaces, planting trees in the local park or sorting contributions to local food banks. Our Fire and Rescue Service has continued to develop the Hospital to Home Service over the year and has supported Warwick and the George Eliot hospitals by taking over 1,000 patients back to their homes and settling them in following their discharge. And from this year the service will be extended for use in the University Hospital Coventry and Warwickshire.
Improved data sharing and referrals from social care has helped the Fire and Rescue Service target the most vulnerable in our communities so they can visit them and deliver enhanced Safe and Well Checks in the home thus reducing the risk of slips, trips and falls as well as fires. The number of fire related deaths and injuries has remained low across the county throughout the year. However, achieving the agreed response standards to life and property risk incidents has remained a challenge for the Service. Constant monitoring to understand reasons and identify remedial action is underway.
Looking at data awaiting validation, the number of killed and seriously injured on our roads has reduced from 359 to 310 across the year. Our Road Safety Team has been chosen by Road Safety GB to test an augmented reality road safety app which brings road safety lessons to life for school children in the region. A comprehensive package of prevention and awareness raising Community Safety campaigns have been delivered this year including business, cyber and hate crime. Notably the number of hate crime / incidents reported through the Hate Crime Partnership’s Report Hate Now website almost doubled from 77 in 2018/19 to 140 in 2019/20.
An area of concern for Warwickshire is the rise in reported violence offences and all Community Safety Partnerships have identified violence as a continued key priority including county lines, exploitation and its connection with knife crime which will be addressed through the development of a countywide violence prevention strategy and board.

15Section A
Warwickshire’s economy is vibrant and supported by the right jobs, training, skills and infrastructure
Warwickshire remains an attractive part of the country for businesses to locate and over this year there have been numerous key achievements for us to be proud of. Our new five-year Economic Growth Strategy sets out how the Council will deliver one of three priority outcomes as outlined in the Council Plan. The ambition is for the strong economic growth that Warwickshire has experienced over the past decade to continue into the future, and that our levels of productivity both soon exceed the national average and also achieve parity with the best performing local economic areas in the South East of England. The Council has responded pro-actively to the Covid-19 pandemic and is supporting businesses and the local economy through the current economic crisis. We are also working with partners to develop an economic recovery plan for the medium-term. Warwickshire’s GVA (Gross Value Added) data has recently been revised and updated by the Office of National Statistics, and it now indicates that our position is below the national average, whereas previously it was above. However, we have still seen strong growth since the end of the recession in 2009, growing at a faster rate than the national average, 29.7% growth between 2009-2017, compared to 19.1% nationally, and faster than our surrounding areas. Indeed, Warwickshire has the seventh fastest growth rate out of all local authority areas in the country and the fourth fastest when London is excluded. Further research is being undertaken to understand the GVA position in more detail and to identify any interventions and activities needed as part of the new economic strategy.
Across this year we have supported over 500 businesses across our various business support programmes, helping create 70 new jobs in the Warwickshire economy and 50 people to start a business. Our business support programme funded through the European Regional Development Fund was featured in a national Ministry of Housing, Communities & Local Government publication as an example of good practice. Invest in Coventry and Warwickshire had another successful year of Foreign Direct Investment (FDI) by being the leading Local Enterprise Partnership area for FDI, with more than 50 new investments and securing over 2,500 new jobs. We also successfully completed the Games and Interactive Software High Performing Opportunities project with the Department for International Trade which focused on Leamington’s gaming sector. Our Business Centre initiative continues to support businesses. In addition to providing accommodation to 200 individual businesses, across a wide variety of sectors throughout Warwickshire, we have also: • developed and launched a number of fully
serviced and furnished start up offices at Eliot Park Innovation Centre which has an occupancy rate of 75%;
• introduced a delegate day rate conferencing and meeting room offer to service and capitalise on an identified gap in both the local and national markets;
• developed an affordable monthly subscription Business Club offer to respond to and support the changing workplace and market demand from enterprises and start ups; and
• seen occupancy levels across the 250 offices and light industrial units that comprise the business centre portfolio, remain at over 90%.
16Section A
Warwickshire’s employment rate is 4.7% above the national average, continuing to widen the gap between the local and national employment rates seeing positive growth over the last quarter with an increase of 1.1%. The percentage of 16-17 year-olds on apprenticeships is rising in Warwickshire to 7.6% whilst nationally numbers are falling to 5.5%. We are a strong advocate of apprenticeships with 201 county council employees undertaking apprenticeship training. The European Social Fund funded Active Inclusion programme supports people who are without work into employment or education destinations. Last year it helped 129 people including 38 people with starting a job and 15 starting education. The Skills for Employment programme continued to equip young people with the skills needed to enter the workplace. The programme has now supported over 10,000 young people through a combination of grants to schools and colleges, skills campaigns and other careers activities. At the end of March we have 209 good or outstanding schools, as rated by Ofsted, out of a total of 242. School attainment for Key Stage 1 reading, writing and maths is encouraging and is above national levels and comparable to statistical neighbours. For Key Stage 2 we have seen a decline of 2% on the previous year but are still in line with the national picture, and 1% behind statistical neighbours. The area for concern is reading which has seen a 4% decrease. Key Stage 2 performance is an identified area for improvement. There has been a 2% improvement in Key Stage 4 and we are 6% higher than the national figure. However, Nuneaton has the lowest educational performance within Warwickshire with 44% of secondary school aged young people attending a school in the town which is judged by Ofsted to require improvement. The Nuneaton Education Strategy is focused on Raising Aspiration, Working Together with a multi-agency approach to improve education and prospects for the young people of Nuneaton.
Within education the new Special Educational Needs and Disabilities (SEND) and Inclusion Strategy 2019-2023 was launched in April 2019 followed in October by a new approach to Early Help. In addition, a new Careers Strategy was launched in November which aims to raise awareness of local career opportunities, improve careers advice at schools and colleges, help vulnerable learners, connect the supply and demand of skills, and encourage businesses to recruit from a wider talent pool. Of our school age population with an Education, Health and Care (EHC) Plan, 6.1% were placed in independent specialist provision including independent and non-maintained special schools. This is a decrease compared to last year’s figure of 6.6%, continuing the downward trend over the past 4 years. This has led to reduced costs, however significant budget pressures remain in this area as the number of EHC plans increases. Investment in the infrastructure has continued and we have delivered a large programme of WCC and developer highway and traffic signal schemes plus works on bridges and structures and made substantial progress towards the delivery of the A46 Stoneleigh Junction and Stanks Island schemes. Recycling initiatives across the county including the Slim Your Bin, In to Win and Home Compost workshops have continued to progress well. Encouragingly, latest available information for 2018-19 period ranked, warwickshire tenth nationally against other disposal authorities with a recycling rate of 51.4%.
For 2019/20 51% of household waste has been reused, recycled and composted against a target of 50% and 61% at the Household Waste Recycling Centres (HWRC) compared to a target of 60%. This year there has been some policy changes in one of the District and Borough Councils where green waste collection is being charged for which has already had an downward impact on recycling rates, it remains to be seen whether any others follow suit and what the overall impact will be.

17Section A
To make best use of our resources there is a range of activity provided across the organisation to support delivery of our outcomes. This year has seen a period of ambitious transformation for us as we undertook a comprehensive review of the way we deliver our services and subsequently a new commissioning and delivery model has been adopted to ensure we are working effectively and efficiently. Alongside, we have been focussed on developing our refreshed leadership team to help drive our organisation forward. As we continue to transform, we have developed a new Council Plan which outlines our priorities for the next 5 years. Our Council Plan 2020–25 sets out our priority areas for action and how we will achieve them. In short, we want people to stay safe, and be healthy, independent and engaged with their communities. And we want a vibrant economy: an environment where businesses can thrive and everyone has access to jobs and training, and where there is a transport infrastructure that allows everyone to access these opportunities. Underpinning all this we want to address the long-term challenge of climate change. To underpin the Council Plan a Commissioning Intentions Performance Framework has been developed and introduced which includes new performance measures providing a sharpened focus on performance linked to our priorities.
Another innovation in performance reporting is visualisation utilising the functionality of the newly implemented Microsoft Power BI enabling improved consistency, transparency and access to timely, consistent performance data facilitating scrutiny, challenge and decision making. Our How We Will Work programme launched this year and is focused on changing the way we work so that we can meet the needs of the business in the most effective way. We want to develop an approach where flexible working should become a core document of how we work. With the right technology and workspaces we will be able to fulfill our roles from a variety of locations, with the level of flexibility determined by the needs of our service, team requirements and individual roles.
A key achievement for us this year was our move to Microsoft 365. We invested in the technology, which included new Surface Pro devices for all staff, to enable them to make best use of the Microsoft suite of products and support our flexible working approach. The cloud based Microsoft 365 offers improved security, better information governance, offline capability, an integrated telephony solution and team-based collaboration on top of all of the applications we use on a daily basis.
This investment has proved particularly beneficial during the COVID-19 period enabling our workforce to transition to working from home almost overnight and to support them to work effectively.
Making Warwickshire the best it can be

18Section A
Services and achievements have been recognised formally this year, including: • Young Peoples Legal Services won the
excellence in-house at the Law Society’s 2019 Excellence Awards;
• the Ecology Team won the 2019 Chartered Institute of Ecology and Environmental Management Award for Local Planning Authority of the Year;
• the new rail station at Kenilworth which was opened in April 2018 has been ‘highly commended’ in a regional award highlighting major transport projects in the West Midlands
while the Chartered Institute of Highways and Transportation also commended the project for bringing a station back to the town after the closure of the last one in 1965;
• we won the prestigious Planning Authority of the Year title at the national Chartered Institute of Ecology and Environmental Management (CIEEM) awards 2019; and,
• the council holds the continued accreditation of the Customer Service Excellence Standard.
Ongoing challenges
An ongoing challenge that we have experienced is with the recruitment and retention of social workers and through a focused effort we have successfully increased our number of social workers by 29% this year while decreasing turnover by 3% and a 79% reduction in the use of agency social workers. A challenge for us this year has been our rate of sickness absence which is now 10.9 days per full time equivalent compared to a target of 9.04, and last year’s outturn which was 9.51. This increase is set against the backdrop of significant organisation change and the global Covid-19
pandemic. Our strong focus on employee well-being and supporting and equipping line managers to effectively manage our people and their attendance will continue in the coming year and beyond.
Complaints
Warwickshire County Council takes complaints very seriously, and has robust complaints response and reporting procedures, managed by the Customer Relations Team. This allows managers to investigate and respond to or escalate complaints individually, with consideration to case specific situations, while also allowing sight of any recurring themes which require wider review of policy, process or operations. The Council has timescales for initial response to complaints made and subsequent resolution, which vary depending on the topic of the complaint. 78% of complaints were
responded to within these targeted timescales.Some complaints are escalated to the Local Government and Social Care Ombudsman (LGSCO) following the response from Warwickshire County Council. In 2019/20 there were 47 such complaints. Of these, 6 were upheld, 4 resulting in financial remedy and 2 in staff training and policy review. This represents a small number of complaints and complaints upheld, but the authority continues to focus on improving the complaints handling procedure and the learning from previous complaints in order to reduce the proportion of LGSCO complaints upheld.

19Section A
Revenue income and expenditure
Financial PerformanceTotal revenue income from all sources in 2019/20 was £837.8m. Adding technical adustments and capital grants make up the gross income shown on the CIES
£837.8 million
We have spent £594.8 million of this revenue income to finance the various services we provide (excluding schools). Adding on schools spending (£218.8 million) and technical adjustments, make up the gross expenditure shown in our Comprehensive Income and Expenditure Statement.
Total 837.8
Revenue resourcesOriginal budget at start of year
Business Rates
Council Tax
2019/20 £m 2020/21£m
Specific Government
Adult Social Care Levy
Customer and Client Receipts for Services
Dedicated Schools Grant
Total Revenue Resources
Total Unconditional Revenue Resources
67.4
275.7
343.5
71.9
21.2
92.7
226.1
755.4
71.2
286.4
357.6
79.7
27.2
115.4
238.0
817.9
Revenue IncomeRevenue resources
£m
Customer and client receipts 125.1
Grants 345.9
Council tax (inc. Adult Social Care levy) 298.4
Business rates 68.4
Payments relatingto staff
Running costs
Buying and using assets
Buying in services
Total spend 813.7
Revenue Spend by Type£m
24.9
271.7
329.0
188.0
Children and Education
£m
Adult Social Care
Schools
Fire and Rescue
Highways, Roads, Transport and Community Safety delivery services
Public Health &Strategic Commissioning
Other services
Total spend 813.7
Revenue Spend by Service
Capital Spend
Schools
Transport infrastructure
Property
Other
£m
10.0
29.2
55.2
15.2
(predominantly supportfunctions, corporate services,capitalfinancing costs and internal transformation spend)
189.9
38.1
44.6
108.4
218.8
157.9
21.1
34.9
Waste, Infrastructure, Economy and Transport planning services

20Section A
Revenue underspends/overspends
£m
OverspendUnderspend
Revenue underspends/overspendsThe net value of the funding and expenditure is a £24.1 million balance. £9.9 million of this was planned at the start of the year to contribute to reserves, and £14.2 million has been added to reserves following service underspends against budget at the end of the financial year. These underspends are as below:
0.1 Fire and rescue
Highways, roads, transport andCommunity Safety delivery services
Adult social care
-0.9
0.4Waste, Infrastructure, economy and Transport planning services
Public health &Strategic commissioning
10.2 Children and Education
-2.4
-0.6
Other services
-20.9
The main reasons for this decrease are: • £24.1 million of assets disposed of
or through schools transferring to Academy status;
• a spend of £90.4 million increasing the value of our assets;
• a write-down of £38.8 million to reflect our assets’ usage by services; and
• a net increase in the value of our assets of £6.9 million as a result of updated valuations to reflect market movements and usage changes.
We spent £109.6 million on the purchase and creation of assets in 2019/20, including £19.2 million on assets owned by other parties. Our initial estimate was £155.1 million but in-year adjustments for additions (for example, to spend newly awarded grants), reductions or rescheduling brought our approved budget for 2019/20 down to £144.0 million as at January 2020. Our capital spending was therefore £45.5 million less than our original budget, and £34.4 million less than the latest approved budget. This underspend was due to delays on individual projects. Most of this spending now is expected to be incurred in 2020/21, for which the budget is £147.8 million. The value of our assets has increased from £1,127.6 million to £1,162 million in 2019/20.
Capital spending and the value of our assets
The net value of the funding and expenditure is a £24.1 million balance. £9.9 million of this was planned at the start of the year to contribute to reserves, and £14.2 million has been added to reserves following service underspends against budget at the end of the financial year.
These underspends are as below:

21Section A
£m
OverspendUnderspend
Capital underspends/overspends
-2.5 Education Services
-17.3 Environment Services
-1.2 Fire and Rescue
-3.2 Strategic Commissioner for Communities
-2.1 Adult Social Care
-0.1 Children and Families
-0.5 Strategic Commissioner for People
-0.1 Business and Customer Support
-5.9 Enabling Services
-1.5 Governance and Policy
Children and Education
£m
Adult Social Care
Schools
Fire and Rescue
Highways, Roads, Transport and Community Safety delivery services
Public Health &Strategic Commissioning
Other services
Total spend 813.7
Revenue Spend by Service
Capital Spend
Schools
Transport infrastructure
Property
Other
£m
10.0
29.2
55.2
15.2
(predominantly supportfunctions, corporate services,capitalfinancing costs and internal transformation spend)
189.9
38.1
44.6
108.4
218.8
157.9
21.1
34.9
Waste, Infrastructure, Economy and Transport planning services

22Section A
Savings and efficiencies
2019/20 was the third and final year of the One Organisational Plan. Implementation of this plan has resulted in savings of £10.5m in 2019/20, with a total savings delivered across the three years of £48.3 million. These savings were spread across a number of areas. Some of the larger items were:
• £3.3 million reduced capital financing costs as a result of the review of our prudent Minimum Revenue Provision approach;
• £4.1 million reduction in demand for adult and children’s social care through early intervention, prevention and local, community-based care provision;
• £2.9 million savings through contract and provider management approaches across social care and Public Health;
• £2.3 million saving from a review of contracts in the Supporting People programme;
• £2.2 million decreased borrowing costs as a result of the Property Rationalisation Programme;
• £1.7 million net reduction in costs for adults needing 24 hour social care through developing supported living and extra care provision in the county as an alternative to residential care;
• £0.8 million saving arising from the school-led improvement approach; and
• £0.6 million reduction in waste management costs.
The original three year target of saving £56.5 million was reviewed each quarter for the three years and as the council received more income or where pressures did not materialise to the extent budgeted, those savings with a risk of a negative impact on service provision were removed.
Reserves
We planned to use £9.3 million of our reserves to support the delivery of services in 2019/20. However services spent £12.5 million more than their cash-limited budget; when combined with the £27.8 million additional resources received during the year and £18.1 million of 2020/21 grants received in advance, the outcome was that our usable revenue reserves increased overall by £24.1 million.
At 31 March 2020 our revenue reserves are therefore £193.0 million, of which £14.2 million is held by schools. We consider this to be a robust figure and allows us some flexibility to balance the challenges of meeting current and unknown future economic uncertainty alongside investment to improve our efficiency and the wider community economic recovery. We will continue to apply our Reserves Strategy which describes how and when these reserves should be used or added to.
Borrowing and Investments
Whilst the average short-term rate that financial institutions lend money to each other was 0.53% during 2019/20, our treasury management activity generated a higher average interest on investments of 0.99%. have managed the Council’s money prudently, with investments made to the UK Debt Management Office and to
other local authorities in line with our Treasury Management Strategy. Our long-term debt outstanding is £321.4 million at 31 March 2020; a year previously the figure was £341.4 million, and at 31 March 2020 we are holding £201.7 million of cash or cash equivalents.

23Section A
Pensions
At 31 March 2020 our total pensions liability was £812.6 million, a decrease of £112.2 million over the year. This remains within the expected
range and we are confident that this liability is well managed within the statutory arrangements.
Pre-Existing Financial Challenges
In 2019/20 the Council designed and implemented a new Council Plan, including a 5 year medium-term financial strategy and reserves strategy. This gives greater alignment of the financial position and plans of the Council to the strategic objectives of healthy communities and a vibrant local economy, as well as managing the risk inherent in providing a diverse range of services to a diverse community funded by numerous income streams.
The financial strategy recognised a number of risks to be monitored, managed and where uncontrollable to be financially underwritten:
• prolonged uncertainty around Central Government’s future decisions about local government financing, including a new funding model for adult social care to replace the social care Council Tax precept and the Better Care Fund grants;
• dependency on locally collected Business Rates, placing greater importance on the need to maintain reserves to manage any volatility;
• designing and delivering sustainable delivery of Special Educational Needs services within the level of DSG funding;
• the broader economic environment, such as the impacts of movement in inflation, council tax base and interest rates on our day-to-day costs, income and debt repayments;
• pension cost increases arising from revaluations and any Central Government decisions about the Local Goverment Pension scheme’s funding mechanisms.
• we are actively working to mitigate any risks to the authority and our communities from the future relationships with the European Union. Our key areas of focus are the impact of immigration and workers schemes on Council services and the local economy, the impact of changed trading arrangements and the evolution of post-transition legislation and regulation
Outlook

24Section A
Covid-19
In March 2020, with the outbreak of the Coronavirus Pandemic across the World, the Council’s staff and services changed overnight. The flexibility of the workforce, IT infrastructure and delivery routes meant that core services continued to be delivered alongside new requirements such as provision of Personal Protective Equipment, Shielding Hubs for vulnerable citizens and shared use of contract provision with NHS partners to enhance discharge pathways from hospitals.
Some front line functions, such as libraries, had to severely restrict their services due to social distancing rules, and a small number of internal support services were paused to free up resources to the Covid response efforts. Alongside this a number of income generating schemes and investments were stopped, such as parking charges and much construction and development work.
Over the longer-term there are anticipated risks which are still being investigated and quantified around: • tax bases for business rates and Council Tax;• increased costs for services we purchase,
especially in the care sector;• requirements around road spacing for social
distancing;• the impacts of the delays to delivery of internal
efficiency and development savings.
The costs of these increased pressures, reduced income and reduced ability to benefit in the future from investments made now is currently estimated to exceed government Covid-19 funding, but with caveats due to the uncertainty of the amount of time the pandemic will continue, the longer term impact on the economy and on our community’s requirements for service delivery and the level of central funding made available.
Mitigation
These risks are common to all local authorities, and we continue to combat these through a mix of active management and financial planning. In response to the Coronavirus Pandemic specific risks, the Council is carrying out four measures:
1. Highlighting and management of risks at an executive level through the risk register
2. A refresh of the medium-term financial strategy will be carried out once we move from the “response” phase of the pandemic to the “recovery” phase, to quantify the financial impact of the longer-term implications of new risks and develop plans to rebuild reserves or operate at lower cost.
3. Engaging nationally, regionally, sub-regionally and locally with partners, businesses and the voluntary sector to influence recovery and jointly manage any emerging risks and funding gaps.

25Section A
In considering this report, you should note that the comparison of spend against service budgets which we use internally to assess our financial performance is not directly comparable to the cost of services disclosed in the Statement of Accounts. This is mainly due to the accounting adjustments required to comply with reporting requirements, which do not impact on the amount
of our spending to be met by local taxpayers, which is central to our in-year monitoring of our financial performance. The key differences relate to the way in which we account for items such as depreciation, impairment, reserves, provisions and carry-forwards. Each of these items is explained further in our accounting policies or the glossary.
Basis of Preparation and Presentation
Comprehensive Income and Expenditure Statement
Balance Sheet
An accounting deficit of £4.4 million for 2019/20 has been reported; the outturn position is a £24.1 million surplus after budget movements approved by Members during the year.
An increase of £170.5 million in County Council’s net assets as at 31 March 2020.
This statement shows the accounting cost in the year of providing services rather than the amount to be funded from taxation. The main factors in the move from surplus to deficit are capital depreciation, revaluation and pensions charges.
The balance sheet shows the value of the assets and liabilities recognised by the County Council. At 31 March 2020 the County Council’s net worth was £270.9 million
Cash Flow Statement Movement in Reserves Statement
A net cash outflow of £3.0 million in 2019/20 in cash or cash equivalents.
An increase of £11.9 million in the County Council’s usable reserves, made up of an increase of £24.1 million in revenue reserves and a decrease of £12.2 million in capital reserves.
This statement summarises the cash that has been paid to us and which we have paid to other organisations and individuals.
This statement shows the movement in year on the different reserves held by the Council, analysed into usable reserves (i.e. those that can be used to fund spending or reduce taxation) and other reserves.
Core Financial StatementsThese comprise the four key pieces of information in the Statement of Accounts

26Section A
Rob PowellStrategic Director for Resources
Statement of accounting policies
This summarises the accounting rules and conventions we have used in preparing these financial statements. Our accounting policies have remained unchanged from 2018-19.
Notes to the core financial statements
The notes include more detail to support the information contained in the core financial statements as well as information on critical judgements and assumptions applied in the production of the accounts.
Other sections of this Document
As well as the Statement of Accounts for the County Council, this document includes separate sections for the Annual Governance Statement and the Statement of Accounts for the Warwickshire Pension Fund.
The Annual Governance Statement describes the Council’s Governance Framework and system of internal control. It includes a review of the effectiveness of this system in the past year and identifies key risks for the Council to manage in
the future. The Annual Governance Statement also covers the Warwickshire Pension Fund.
The Warwickshire Pension Fund’s Statement of Accounts describes the Fund’s financial position and performance in 2019/20. While the County Council administers the Fund, the Fund’s accounts represent its activities on behalf of all its member organisations. Further information about the Fund can be found in Note 1 of that section.

Warwickshire County Council
Statement of Accounts
2019/20

Section B - Page 1
We would welcome any comments or suggestions you have about this publication. Please contact Virginia Rennie, Strategic Finance, Resources Directorate, Warwickshire County Council.
• Phone: 01926 412239
• E-mail: [email protected] You can also leave your comments on our website at www.warwickshire.gov.uk If this information is difficult to understand, we can provide it in another format, for example, in Braille, in large print, on audiotape, in another language or by talking with you. Please contact Hayley Green on 01926 412232.
This document forms part of the Warwickshire County Council’s 2019/20 Statement of Accounts which also includes the Annual Governance Statement and the accounts for Warwickshire Pension Fund. The accounts for the Pension Fund are available at www.warwickshire.gov.uk
Section B - Page 2
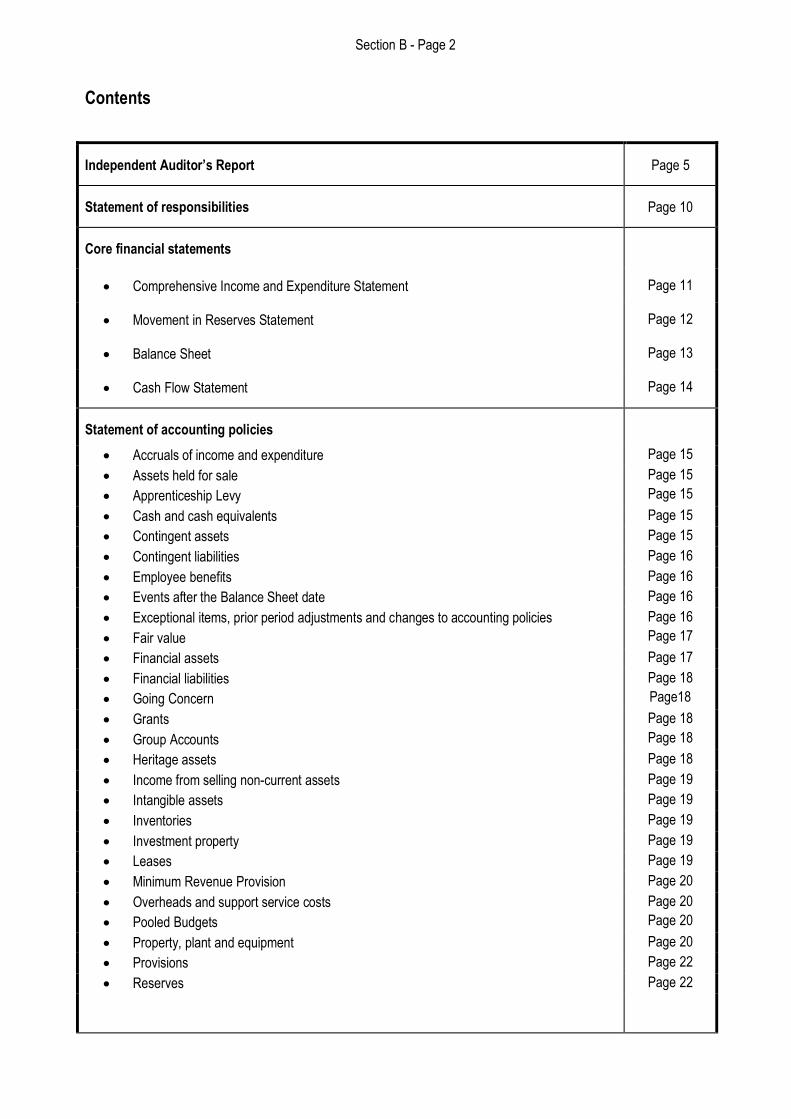
Contents
Independent Auditor’s Report Page 5
Statement of responsibilities Page 10
Core financial statements
• Comprehensive Income and Expenditure Statement Page 11
• Movement in Reserves Statement Page 12
• Balance Sheet Page 13
• Cash Flow Statement Page 14
Statement of accounting policies
• Accruals of income and expenditure Page 15
• Assets held for sale
• Apprenticeship Levy
Page 15
Page 15
• Cash and cash equivalents Page 15
• Contingent assets Page 15
• Contingent liabilities Page 16
• Employee benefits Page 16
• Events after the Balance Sheet date Page 16
• Exceptional items, prior period adjustments and changes to accounting policies
• Fair value
Page 16
Page 17
• Financial assets Page 17
• Financial liabilities
• Going Concern
Page 18
Page18
• Grants
• Group Accounts
Page 18
Page 18
• Heritage assets Page 18
• Income from selling non-current assets Page 19
• Intangible assets Page 19
• Inventories Page 19
• Investment property Page 19
• Leases Page 19
• Minimum Revenue Provision Page 20
• Overheads and support service costs
• Pooled Budgets
Page 20
Page 20
• Property, plant and equipment Page 20
• Provisions Page 22
• Reserves Page 22

Section B - Page 3
• Revenue expenditure funded from capital under statute Page 23
• Schools and School Assets Page 23
• VAT
Notes to the core financial statements
Notes relating to the Comprehensive Income and Expenditure Statement
• Note 1: Expenditure & Funding Analysis and the notes to the statement including income
and expenditure by nature
• Note 2: Adjustments between accounting basis and funding basis under regulations
Page 23
Page 24
Page 28
• Note 3: Significant items of income and expenditure and restatements of prior year figures
• Note 4: Other operating expenditure
• Note 5: Financing and investment income and expenditure
• Note 6: Taxation and non-specific grant income and expenditure
Notes relating to the Movement in Reserves Statement
Page 30
Page 30
Page 30
Page 31
• Note 7: Transfer to/from earmarked reserves Page 31
Notes Relating to the Balance Sheet
• Note 8: Property, plant and equipment Page 32
• Note 9: School property, plant and equipment Page 34
• Note 10: Heritage assets Page 35
• Note 11: Investment properties Page 35
• Note 12: Intangible assets Page 36
• Note 13: Financial instruments Page 37
• Note 14: Debtors Page 41
• Note 15: Cash and cash equivalents Page 41
• Note 16: Creditors Page 41
• Note 17: Provisions Page 42
• Note 18: Usable reserves Page 42
• Note 19: Unusable reserves Page 42
Notes relating to the Cash Flow Statement
• Note 20: Cash Flow Statement – operating activities Page 46
• Note 21: Cash Flow Statement – investing activities Page 47
• Note 22: Cash Flow Statement – financing activities Page 47
Other Notes to the Accounts
• Note 23: Grant income
• Note 24: Accounting standards issued that have not yet been adopted
Page 48
Page 50
• Note 25: Assumptions made about the future and other major sources of estimation
uncertainty
Page 50
• Note 26: Capital expenditure and capital financing Page 52
• Note 27: Critical judgements in applying accounting policies Page 53

Section B - Page 4
• Note 28: Dedicated Schools’ Grant
• Note 29: Events after the Balance Sheet date
• Note 30: External audit costs
• Note 31: Leases
• Note 32: Contingent assets
• Note 33: Contingent liabilities
• Note 34: Members’ allowances
Page 53
Page 56
Page 56
Page 56
Page 57
Page 57
Page 57
• Note 35: Nature and extent of risk arising from financial instruments Page 57
• Note 36: Officers’ remuneration and termination benefits Page 60
• Note 37: Pension schemes Page 63
• Note 38: Pooled budgets with health Page 70
• Note 39: Coventry and Warwickshire Business Rates Pool Page 71
• Note 40: Related parties and associated parties Page 71
• Note 41: Trading accounts Page 74
The Firefighters’ Pension Fund Page 76
Glossary Page 78

Section B - Page 5
Independent auditor’s report to the members of Warwickshire County Council
Report on the Audit of the Financial Statements
Opinion
We have audited the financial statements of Warwickshire County Council (the ‘Authority’) for the year ended 31 March 2020 which comprise the Comprehensive Income and Expenditure Statement, Movement in Reserves Statement, Balance Sheet as at 31 March 2020, Cash Flow Statement, Statement of Accounting Policies, Notes to the Core Financial Statements and The Firefighters’ Pension Fund. The financial reporting framework that has been applied in their preparation is applicable law and the CIPFA/LASAAC Code of Practice on Local Authority Accounting in the United Kingdom 2019/20. In our opinion, the financial statements:
• give a true and fair view of the financial position of the Authority as at 31 March 2020 and of its expenditure and income for the year then ended;
• have been properly prepared in accordance with the CIPFA/LASAAC Code of Practice on Local Authority Accounting in the United Kingdom 2019/20; and
• have been prepared in accordance with the requirements of the Local Audit and Accountability Act 2014.
Basis for opinion
We conducted our audit in accordance with International Standards on Auditing (UK) (ISAs (UK)) and applicable law. Our responsibilities under those standards are further described in the ‘Auditor’s responsibilities for the audit of the financial statements’ section of our report. We are independent of the Authority in accordance with the ethical requirements that are relevant to our audit of the financial statements in the UK, including the FRC’s Ethical Standard, and we have fulfilled our other ethical responsibilities in accordance with these requirements. We believe that the audit evidence we have obtained is sufficient and appropriate to provide a basis for our opinion.
The impact of macro-economic uncertainties on our audit
Our audit of the financial statements requires us to obtain an understanding of all relevant uncertainties, including those
arising as a consequence of the effects of macro-economic uncertainties such as Covid-19 and Brexit. All audits assess
and challenge the reasonableness of estimates made by the Strategic Director for Resources and the related disclosures
and the appropriateness of the going concern basis of preparation of the financial statements. All of these depend on
assessments of the future economic environment and the Authority’s future operational arrangements.
Covid-19 and Brexit are amongst the most significant economic events currently faced by the UK, and at the date of this
report their effects are subject to unprecedented levels of uncertainty, with the full range of possible outcomes and their
impacts unknown. We applied a standardised firm-wide approach in response to these uncertainties when assessing the
Authority’s future operational arrangements. However, no audit should be expected to predict the unknowable factors or
all possible future implications for an authority associated with these particular events.
Conclusions relating to going concern We have nothing to report in respect of the following matters in relation to which the ISAs (UK) require us to report to you where:
• the Strategic Director for Resources use of the going concern basis of accounting in the preparation of the financial statements is not appropriate; or

Section B - Page 6
• the Strategic Director for Resources has not disclosed in the financial statements any identified material uncertainties that may cast significant doubt about the Authority’s ability to continue to adopt the going concern basis of accounting for a period of at least twelve months from the date when the financial statements are authorised for issue.
In our evaluation of the Strategic Director of Resources conclusions, and in accordance with the expectation set out
within the CIPFA/LASAAC Code of Practice on Local Authority Accounting in the United Kingdom 2019/20 that the
Authority’s financial statements shall be prepared on a going concern basis, we considered the risks associated with the
Authority’s operating activities, including effects arising from macro-economic uncertainties such as Covid-19 and Brexit.
We analysed how those risks might affect the Authority’s financial resources or ability to continue operations over the
period of at least twelve months from the date when the financial statements are authorised for issue. In accordance with
the above, we have nothing to report in these respects.
However, as we cannot predict all future events or conditions and as subsequent events may result in outcomes that are
inconsistent with judgements that were reasonable at the time they were made, the absence of reference to a material
uncertainty in this auditor's report is not a guarantee that the Authority will continue in operation.
Emphasis of Matter – effects of Covid-19 on the valuation of the Authority’s land and buildings and pooled property investments within the pension scheme We draw attention to Note 25: Assumptions made about the future and other major sources of estimation uncertainty of the financial statements, which describes the effects of the Covid-19 pandemic on the valuation of the Authority’s land and buildings as at 31 March 2020. As disclosed in Note 25 the duration of the pandemic and the depth of and timeframe for recovery from any economic downturn remain uncertain. Therefore, the financial impact and risk of a material adjustment to the balance sheet going forward remains. The Council’s valuers have stated that there is a material uncertainty about the movement of property process and valuations as a result of Covid-19. The Council has decided to use the valuer’s estimates of property valuations and movements as the best available estimates of the values of the Council’s assets as at 31 March 2020, but these estimates are subject to greater uncertainty than in previous years. Our opinion is not modified in respect of this matter. We also draw attention to Note 37: Pension schemes, which describes the effects of the Covid-19 pandemic on the valuation of the Warwickshire Pension Fund’s two pooled property funds as at 31 March 2020. The property funds’ valuers have stated that there is a material uncertainty about the valuations as a result of Covid-19. The Fund has decided to use the valuer’s estimates as the best available estimates of the values of the Fund’s assets as at 31 March 2020, but these estimates are subject to greater uncertainty than in previous years. The Council’s proportion of these funds is approximately 50% which equates to £109 million. Our opinion is not modified in respect of this matter. Other information The Strategic Director of Resources is responsible for the other information. The other information comprises the information included in the Statement of Accounts (sections B and D), the Narrative Statement (section A) and the Annual Governance Statement (section C), other than the financial statements, our auditor’s report thereon and our auditor’s report on the pension fund financial statements. Our opinion on the financial statements does not cover the other information and, except to the extent otherwise explicitly stated in our report, we do not express any form of assurance conclusion thereon. In connection with our audit of the financial statements, our responsibility is to read the other information and, in doing so, consider whether the other information is materially inconsistent with the financial statements or our knowledge of the Authority obtained in the audit or otherwise appears to be materially misstated. If we identify such material inconsistencies or apparent material misstatements, we are required to determine whether there is a material misstatement in the financial statements or a material misstatement of the other information. If, based on the work we have performed, we conclude that there is a material misstatement of this other information, we are required to report that fact.

Section B - Page 7
We have nothing to report in this regard. Other information we are required to report on by exception under the Code of Audit Practice Under the Code of Audit Practice published by the National Audit Office on behalf of the Comptroller and Auditor General (the Code of Audit Practice) we are required to consider whether the Annual Governance Statement does not comply with the ‘delivering good governance in Local Government Framework 2016 Edition’ published by CIPFA and SOLACE or is misleading or inconsistent with the information of which we are aware from our audit. We are not required to consider whether the Annual Governance Statement addresses all risks and controls or that risks are satisfactorily addressed by internal controls. We have nothing to report in this regard. Opinion on other matter required by the Code of Audit Practice
In our opinion, based on the work undertaken in the course of the audit of the financial statements and our knowledge of the Authority gained through our work in relation to the Authority’s arrangements for securing economy, efficiency and effectiveness in its use of resources, the other information published together with the financial statements in the Statement of Accounts (sections B and D), the Narrative Statement (section A) and the Annual Governance Statement (section C) for the financial year for which the financial statements are prepared is consistent with the financial statements. Matters on which we are required to report by exception
Under the Code of Audit Practice, we are required to report to you if:
• we issue a report in the public interest under section 24 of the Local Audit and Accountability Act 2014 in the course of, or at the conclusion of the audit; or
• we make a written recommendation to the Authority under section 24 of the Local Audit and Accountability Act 2014 in the course of, or at the conclusion of the audit; or
• we make an application to the court for a declaration that an item of account is contrary to law under Section 28 of the Local Audit and Accountability Act 2014 in the course of, or at the conclusion of the audit; or;
• we issue an advisory notice under Section 29 of the Local Audit and Accountability Act 2014 in the course of, or at the conclusion of the audit; or
• we make an application for judicial review under Section 31 of the Local Audit and Accountability Act 2014, in the course of, or at the conclusion of the audit.
We have nothing to report in respect of the above matters. Responsibilities of the Authority, the Strategic Director for Resources and Those Charged with Governance for the financial statements
As explained more fully in the Statement of Responsibilities for the Financial Statements set out on page 10 in Section B, the Authority is required to make arrangements for the proper administration of its financial affairs and to secure that one of its officers has the responsibility for the administration of those affairs. In this authority, that officer is the Strategic Director for Resources. The Strategic Director for Resources is responsible for the preparation of the Statement of Accounts, which includes the financial statements, in accordance with proper practices as set out in the CIPFA/LASAAC code of practice on local authority accounting in the United Kingdom 2019/20, for being satisfied that they give a true and fair view, and for such internal control as the Strategic Director for Resources determines is necessary to enable the preparation of financial statements that are free from material misstatement, whether due to fraud or error.

Section B - Page 8
In preparing the financial statements, the Strategic Director for Resources is responsible for assessing the Authority’s ability to continue as a going concern, disclosing, as applicable, matters related to going concern and using the going concern basis of accounting unless there is an intention by government that the services provided by the Authority will no longer be provided. The Authority is Those Charged with Governance. Those charged with governance are responsible for overseeing the Authority’s financial reporting process. In this authority the Audit & Standards Committee is charged with assisting it in meeting these responsibilities. Auditor’s responsibilities for the audit of the financial statements
Our objectives are to obtain reasonable assurance about whether the financial statements as a whole are free from material misstatement, whether due to fraud or error, and to issue an auditor’s report that includes our opinion. Reasonable assurance is a high level of assurance, but is not a guarantee that an audit conducted in accordance with ISAs (UK) will always detect a material misstatement when it exists. Misstatements can arise from fraud or error and are considered material if, individually or in the aggregate, they could reasonably be expected to influence the economic decisions of users taken on the basis of these financial statements. A further description of our responsibilities for the audit of the financial statements is located on the Financial Reporting Council’s website at: www.frc.org.uk/auditorsresponsibilities. This description forms part of our auditor’s report.
Report on other legal and regulatory requirements - Conclusion on the Authority’s arrangements for securing economy, efficiency and effectiveness in its use of resources Conclusion
On the basis of our work, having regard to the guidance on the specified criterion issued by the Comptroller and Auditor General in April 2020, we are satisfied that the Authority put in place proper arrangements for securing economy, efficiency and effectiveness in its use of resources for the year ended 31 March 2020. Responsibilities of the Authority
The Authority is responsible for putting in place proper arrangements for securing economy, efficiency and effectiveness in its use of resources, to ensure proper stewardship and governance, and to review regularly the adequacy and effectiveness of these arrangements. Auditor’s responsibilities for the review of the Authority’s arrangements for securing economy, efficiency and effectiveness in its use of resources
We are required under Section 20(1)(c) of the Local Audit and Accountability Act 2014 to be satisfied that the Authority has made proper arrangements for securing economy, efficiency and effectiveness in its use of resources. We are not required to consider, nor have we considered, whether all aspects of the Authority's arrangements for securing economy, efficiency and effectiveness in its use of resources are operating effectively. We have undertaken our review in accordance with the Code of Audit Practice, having regard to the guidance on the specified criterion issued by the Comptroller and Auditor General in April 2020, as to whether in all significant respects the Authority had proper arrangements to ensure it took properly informed decisions and deployed resources to achieve planned and sustainable outcomes for taxpayers and local people. The Comptroller and Auditor General determined this criterion as that necessary for us to consider under the Code of Audit Practice in satisfying ourselves whether the Authority put in place proper arrangements for securing economy, efficiency and effectiveness in its use of resources for the year ended 31 March 2020.

Section B - Page 9
We planned our work in accordance with the Code of Audit Practice. Based on our risk assessment, we undertook such work as we considered necessary to be satisfied that the Authority has put in place proper arrangements for securing economy, efficiency and effectiveness in its use of resources.
Report on other legal and regulatory requirements - Delay in certification of completion of the audit
We are required to give an opinion on the consistency of the pension fund financial statements of the Authority included in the Pension Fund Annual Report with the pension fund financial statements included in the Statement of Accounts. The Local Government Pension Scheme Regulations 2013 require authorities to publish the Pension Fund Annual Report by 1 December 2020. As the Authority has not finalised the Pension Fund Annual Report at the time of this report we have yet to issue our report on the consistency of the pension fund financial statements. Until we have done so, we are unable to certify that we have completed the audit of the financial statements in accordance with the requirements of the Local Audit and Accountability Act 2014 and the Code of Audit Practice. We cannot formally conclude the audit and issue an audit certificate in accordance with the requirements of the Local Audit and Accountability Act 2014 and the Code of Audit Practice until we have also completed:
• the work necessary to issue our Whole of Government Accounts (WGA) Component Assurance statement for the Authority for the year ended 31 March 2020, and
• our consideration of an objection brought to our attention by a local authority elector under Section 27 of the Local Audit and Accountability Act 2014.
We are satisfied that these matters do not have a material effect on the financial statements or on our conclusion on the Authority's arrangements for securing economy, efficiency and effectiveness in its use of resources for the year ended 31 March 2020. Use of our report
This report is made solely to the members of the Authority, as a body, in accordance with Part 5 of the Local Audit and Accountability Act 2014 and as set out in paragraph 43 of the Statement of Responsibilities of Auditors and Audited Bodies published by Public Sector Audit Appointments Limited. Our audit work has been undertaken so that we might state to the Authority’s members those matters we are required to state to them in an auditor's report and for no other purpose. To the fullest extent permitted by law, we do not accept or assume responsibility to anyone other than the Authority and the Authority's members as a body, for our audit work, for this report, or for the opinions we have formed.
Grant Patterson
Grant Patterson, Key Audit Partner for and on behalf of Grant Thornton UK LLP, Local Auditor Birmingham 27 October 2020

Section B - Page 10
Statement of responsibilities for the statement of accounts
This section explains our responsibilities for our financial affairs and how we make sure we carry out these
responsibilities properly, in line with the Accounts and Audit (Coronavirus) (Amendment) Regulations 2020 and the
Account and Audit Regulations 2015.
Responsibilities of the Council
We do the following:
• Make sure that one of our officers is responsible for managing our financial affairs. In this council, the Strategic
Director for Resources is responsible for this;
• Manage our affairs to make sure we use our resources efficiently and effectively and protect our assets; and
• Approve the statement of accounts.
Responsibilities of the Strategic Director for Resources
As the Strategic Director for Resources, I am responsible for preparing our statement of accounts. These accounts must
present a true and fair view of our financial position, including our income and spending for the year.
In preparing our statement of accounts, I have:
• Selected suitable accounting policies and applied them consistently;
• Made reasonable and prudent judgements and estimates; and
• Followed the Chartered Institute of Public Finance and Accountancy/LASAAC Code of Practice on Local
Authority Accounting in the United Kingdom.
I have also:
• Kept proper accounting records which are up to date; and
• Taken steps to prevent and detect fraud and other irregularities.
I certify that the Statement of Accounts presents a true and fair view of the financial position of Warwickshire County
Council at 31 March 2020 and the income and expenditure for the year ended 31 March 2020. The unaudited draft
accounts were authorised for issue on 26 June 2020. These were audited and were considered and approved at a
meeting of the Council on 13 October 2020. The approved accounts were authorised for issue on that date.
Rob Powell
Strategic Director for Resources Date: 13 October 2020
Councillor Alan Cockburn
Chair of the Council Date: 13 October 2020

Section B - Page 11
Comprehensive Income and Expenditure Statement
Gross
expenditure
£m
Gross
income
£m
Net
expenditure
£m
Summary of revenue spending
Gross
expenditure
£m
Gross
income
£m
Net
expenditure
£m
Money spent on services
300.6 -33.7 266.9 ~ Communities Directorate 279.3 -38.1 241.2
296.0 -62.1 233.9 ~ People Directorate 314.7 -67.7 247.0
72.3 -8.1 64.2 ~ Resources Directorate 80.7 -8.8 71.9
183.3 -266.1 -82.8 ~ Schools 182.9 -260.7 -77.8
5.3 -38.5 -33.2 ~ Corporate Serv ices and Resourcing 8.2 -36.4 -28.2
8.6 0.0 8.6 ~ Non-distributed costs 0.8 0.0 0.8
866.1 -408.5 457.6 Net cost of services 866.6 -411.7 454.9
74.8 0.0 74.8 ~ Other operating expenditure (note 4) 9.8 0.0 9.8
53.1 -17.7 35.4~ Financing and investment income and expenditure
(note 5)53.0 -18.2 34.8
0.0 -454.8 -454.8~ Taxation and non-specific grant income and
expenditure (note 6) 0.0 -495.1 -495.1
994.0 -881.0 113.0 Surplus (-) or deficit on the provision of services 929.4 (925.0) 4.4
Items that will not be reclassified to the surplus (- )
/deficit on the provision of services
-58.2~ Surplus (-) or deficit on revaluation of property , plant
and equipment-14.1
0.0
~ Surplus or deficit from investments in equity
instruments designated at fair value through other
comprehensive income.
-0.1
88.9~ Remeasurements of the net defined benefit
liability /(asset)-160.7
30.7 Other comprehensive income and expenditure 0.0 -174.9
143.7 Total comprehensive income and expenditure -170.5
2018/19 (Restated) 2019/20
To arrive at the figures for each directorate in the table above we adjust the income and expenditure figures used
internally to report our financial performance as required by the Code and regulations. A reconciliation of these
adjustments and more details as to what each adjustment relates to are shown in the Expenditure and Funding Analysis
(Note 1) and the Adjustments between accounting basis and funding basis under regulations (Note 2) in conjunction with
the Movement in Reserves Statement.
The restatement of the 2018/19 figures is described in Note 3.

Section B - Page 12
Movement in Reserves Statement
Movement in Reserves Statement - 2019/20
Ge
ne
ral
Fu
nd
(U
ne
arm
ark
ed
Fu
nd
s)
Ge
ne
ral
Fu
nd
Ea
rma
rke
d
Re
se
rve
s
Ge
ne
ral
Fu
nd
Ca
pit
al
Fu
nd
To
tal
Ge
ne
ral
Fu
nd
Re
se
rve
s
Ca
pit
al
Re
ce
ipts
Re
se
rve
Ca
pit
al
Gra
nts
Un
ap
pli
ed
To
tal
Us
ab
le R
es
erv
es
Un
us
ab
le R
es
erv
es
To
tal
Au
tho
rity
Re
se
rve
s
£ m £ m £ m £ m £ m £ m £ m £ m £ m
Balance at 31 March 2019 32.3 135.2 1.4 168.9 9.6 15.1 193.6 -93.2 100.4
Movement in Reserves during 2019/20
Total Comprehensive Income and Expenditure -4.4 0.0 0.0 -4.4 0.0 0.0 -4.4 174.9 170.5
Adjustments between accounting basis and funding basis
under regulations (note 2)28.5 0.0 0.0 28.5 -0.7 -11.5 16.3 -16.3 0.0
Net Increase / Decrease (-) before Transfers to
Earmarked Reserves24.1 0.0 0.0 24.1 -0.7 -11.5 11.9 158.6 170.5
Transfers to / from (-) Earmarked Reserves (note 7) -35.2 34.9 0.3 0.0 0.0 0.0 0.0 0.0 0.0
Increase / Decrease (-) in Year -11.1 34.9 0.3 24.1 -0.7 -11.5 11.9 158.6 170.5
Balance at 31 March 2020 21.2 170.1 1.7 193.0 8.9 3.6 205.5 65.4 270.9
Movement in Reserves Statement - 2018/19
Ge
ne
ral
Fu
nd
(Un
ea
rma
rke
d F
un
ds
)
Ge
ne
ral
Fu
nd
Ea
rma
rke
d
Re
se
rve
s
Ge
ne
ral
Fu
nd
Ca
pit
al
Fu
nd
To
tal
Ge
ne
ral
Fu
nd
Re
se
rve
s
Ca
pit
al
Re
ce
ipts
Re
se
rve
Ca
pit
al
Gra
nts
Un
ap
pli
ed
To
tal
Us
ab
le R
es
erv
es
Un
us
ab
le R
es
erv
es
To
tal
Au
tho
rity
Re
se
rve
s
£ m £ m £ m £ m £ m £ m £ m £ m £ m
Balance at 31 March 2018 29.2 116.4 1.2 146.8 0.0 1.4 148.2 95.0 243.2
Opening Balance adjustment for financial
instrument reclassification (Note 3)0.0 3.1 0.0 3.1 0.0 0.0 3.1 -2.2 0.9
Balance as at 1 April 2018 29.2 119.5 1.2 149.9 0.0 1.4 151.3 92.8 244.1
Movement in Reserves during 2018/19
Total Comprehensive Income and Expenditure -113.0 0.0 0.0 -113.0 0.0 0.0 -113.0 -30.7 -143.7
Adjustments between accounting basis and funding
basis under regulations (note 2)131.9 0.0 0.1 132.0 9.6 13.7 155.3 -155.3 0.0
Net Increase / Decrease (-) before Transfers to
Earmarked Reserves18.9 0.0 0.1 19.0 9.6 13.7 42.3 -186.0 -143.7
Transfers to / from (-) Earmarked Reserves (note 7) -15.8 15.7 0.1 0.0 0.0 0.0 0.0 0.0 0.0
Increase / Decrease (-) in Year 3.1 15.7 0.2 19.0 9.6 13.7 42.3 -186.0 -143.7
Balance at 31 March 2019 32.3 135.2 1.4 168.9 9.6 15.1 193.6 -93.2 100.4

Section B - Page 13
Balance Sheet as at 31 March 2020
31 March 2019 31 March 2020 Notes
£ m £ m
1,093.9 Property, plant and equipment 1,130.9 8
25.6 Investment property 23.6 11
4.4 Heritage assets 4.5 10
3.7 Intangible assets 3.0 12
1,127.6 Total fixed assets 1,162.0
2.0 Long-term investments 12.3 13
0.8 Long-term debtors 0.0 13
1,130.4 Total long-term assets 1,174.3
Current assets
154.3 Short-term investments 162.3 13
0.6 Inventories 0.5
82.1 Short-term debtors 84.7 14
204.7 Cash and cash equivalents 201.7 15
441.7 Total current assets 449.2
Current liabilities
-5.3 -5.9 17
-18.5 Short-term borrowing -20.0 13
-120.1 Short-term creditors -122.9 16
-0.7 Short-term grants received in advance -0.9 23
-144.6 Total current liabilities -149.7
297.1 Current assets less current liabilities 299.5
-2.3 Long-term provisions - new -2.3 17
-341.4 Long-term borrowing -321.4 13
-58.6 Long-term grants received in advance -66.6 23
-924.8 Liability related to defined benefit pension scheme -812.6 19
-1,327.1 Long-term liabilities -1,202.9
100.4 Net assets 270.9
193.6 Usable reserves 205.5 18
-93.2 Unusable reserves 65.4 19
100.4 Total reserves 270.9
Short-term provisions
Rob Powell Strategic Director for Resources
13 October 2020

Section B - Page 14
Cash Flow Statement
2018/19 Note 2019/20
£ m £ m
-113.0 Net surplus or (deficit) on the provision of services -4.4
248.0
Adjustment to surplus or deficit on the provision of services for noncash
movements 20 110.2
-101.2
Adjust for items included in the net surplus or deficit on the provision of
services that are investing and financing activities 20 -100.1
33.8 Net Cash flows from operating activities 5.7
-18.2 Net Cash flows from Investing Activities 21 1.3
-1.2 Net Cash flows from Financing Activities 22 -10.0
14.4 Net increase or (decrease) in cash and cash equivalents -3.0
31 March 2019 Note 31 March 2020
£ m £ m
190.3 Cash and cash equivalents at the beginning of the reporting period 15 204.7
204.7 Cash and cash equivalents at the end of the reporting period 15 201.7
14.4 Net increase or (decrease) in cash and cash equivalents -3.0

Section B - Page 15
Statement of accounting policies
This section summarises the accounting rules and conventions we have used in preparing these financial statements.
General
The content, layout and general rules we used to prepare these accounts comply with the Code of Practice on Local
Authority Accounting 2019/20 (‘the Code’) issued by the Chartered Institute of Public Finance and Accountancy (CIPFA)
in accordance with International Financial Reporting Standards (IFRSs).
Accruals of income and expenditure
Activity is accounted for in the year that it takes place. This means that income from the sale of goods or the provision of
services is recorded in our accounts when the goods or services are transferred to the recipient in accordance with the
performance obligations in the contract. Expenditure is recorded in our accounts when services are received, rather than
when we actually make a payment, and supplies are recorded as expenditure when we use them or as inventories on
the Balance Sheet until that point. Interest receivable on investments and payable on borrowings is accounted for
respectively as income and expenditure on the basis of the effective interest rate for the relevant financial instrument
rather than the cash flows fixed or determined by the contract. Where income and expenditure have been recognised but
cash has not been received/paid, a debtor or creditor for the relevant amount is recorded in the Balance Sheet, subject
to a de minimis level for non-system generated accruals of £50,000. We do not expect the effect to be material to the
overall position.
Assets held for sale
Where we have decided to sell an asset and the asset is being actively marketed with a sale expected within 12 months
of making that decision, it is categorised as a current asset held for sale. We value these at the lower of carrying amount
and fair value less disposal costs. Those assets that we do not expect to sell within 12 months are not classed as assets
held for sale and instead are valued at their previous use.
Apprenticeship Levy
The cost of the Levy is recognised as a direct cost of employment in the Comprehensive Income and Expenditure
Statement (CIES) when it is paid to Her Majesty’s Revenue and Customs (HMRC). When funds are transferred from the
Government's Digital Apprenticeship Account to an approved training provider a training expense up to the value of the
training provided, with a corresponding entry for a government grant, will be recognised in the CIES against the service
benefiting from the training.
Cash and cash equivalents
Cash is money held in current bank accounts and overdrafts that are repayable on demand and are integral to daily cash
flow management. Money held in call accounts and short-term funds invested for a term of three months or less are
classified as cash equivalents because they are readily available to be converted into cash.
Contingent assets
We identify contingent assets where an event has taken place that gives the authority a possible asset whose existence will only be confirmed by the occurrence or non-occurrence of some uncertain future event not wholly within our control. Our contingent assets disclosure is shown in note 32. These are not included in our Balance Sheet.

Section B - Page 16
Contingent liabilities
We identify contingent liabilities where either:
• A possible obligation has arisen from past events and whose existence will be confirmed by the occurrence or
non-occurrence of some uncertain future event not wholly within our control; or
• A present obligation may arise from past event but is not recognised because either it is not probable that an
outflow of resources will be required, or the amount of the obligation cannot be measured reliably.
Our contingent liabilities disclosure is shown in note 33. These are not included in our Balance Sheet.
Employee benefits
Benefits payable during employment
The accounts reflect entitlements that have been earned by employees, such as salaries and wages, as a consequence
of the service completed by them as at 31 March each year even if we would never normally make payments for them,
such as annual leave and time-off in lieu not yet taken. These are accrued for in the cost of services in the CIES.
Termination benefits
Termination benefits are amounts payable as a result of a decision to terminate an officer’s employment before normal
retirement age or an officer’s decision to accept voluntary redundancy. Termination benefits are recognised immediately
as an expense to the service in the CIES at the earlier of when the authority can no longer withdraw the offer or when we
recognise costs of a restructuring.
Post-employment benefits
As part of the terms and conditions of employment we offer retirement benefits. Although these benefits will not actually
be payable until the employee retires, we account for post-employment benefits in the CIES at the time that employees
earn their future entitlement.
Our employees are members of four different pension schemes, and we participate in one compensation scheme:
• The Local Government Pension Scheme;
• The Teachers’ Pension Scheme;
• The Firefighters’ Pension Scheme and the Firefighters’ Injury Awards Scheme; and
• The National Health Service Pension Scheme.
All four pension schemes provide members with pensions and other benefits related to their pay and length of service.
Details of these schemes, our accounting policies in relation to them and their impact on the financial statements are
shown in note 37.
Events after the Balance Sheet date
We consider any material events that occur between the date of the Balance Sheet and the date the accounts are
authorised for issue by the Strategic Director for Resources.
Exceptional items, prior period adjustments and changes to accounting policies
Exceptional items are material items of income or expenditure that are disclosed separately in the CIES to aid
understanding of our financial performance.
Prior period adjustments are made where there are material adjustments applicable to prior years arising from changes
in accounting policies or to correct a material error. Where a change to accounting policies is made it is applied
retrospectively (unless stated otherwise) by adjusting opening balances and comparative amounts for earlier years as if
the policy had always applied.

Section B - Page 17
Fair value We value several classes of our assets at fair value. We define this as the price that would be received to sell an asset
or paid to transfer a liability in an orderly transaction between market participants at the measurement date. In 2019/20
fair value applies to non-operational property, plant and equipment classified as surplus assets, investment properties,
assets held for sale and financial instruments.
We use appropriate valuation techniques, maximising the use of relevant known data and thereby minimising the use of
estimates or subjective valuations. We assess the level of uncertainty in our valuations by assigning our assets into three
categories:
• Level 1 – quoted prices of identical assets or liabilities;
• Level 2 – inputs other than quoted prices that are observable, either directly or indirectly; and
• Level 3 – unobservable inputs.
Further detail is shown in notes 11 and 13.
Financial assets
Financial assets are classified based on our business model for holding them and their cashflow characteristics. There
are three main classes:
• Amortised cost;
• Fair value through profit or loss (FVPL); and
• Fair value through other comprehensive income and expenditure (FVOCI) – designated equity instruments.
Financial assets measured at amortised cost are recognised on the Balance Sheet when we become a party to the
contractual provisions of a financial instrument and are initially measured at fair value. They are subsequently measured
at their amortised cost. Annual credits to CIES for interest receivable are based on the carrying amount of the asset
multiplied by the effective rate of interest for the instrument. This means that the amount presented in the Balance Sheet
is the outstanding principal receivable (plus accrued interest) and interest credited to the CIES is the amount receivable
for the year in the loan agreement.
The fair value measurements of FVPL assets are based on the following techniques:
• Instruments with quoted market prices – the market price; and
• Other instruments with fixed and determinable payments – discounted cash flow analysis.
FVPL assets are recognised on the Balance Sheet when the authority becomes a party to the contractual provisions of a
financial instrument and are initially measured and carried at fair value. Fair value gains and losses are recognised as
they arrive in the Surplus or Deficit on the Provision of Services. A financial instrument revaluation reserve exists to hold
qualifying gains and losses on FVPL assets (see note 19). Those that do not qualify impact the general fund and are
held in an earmarked volatility reserve (see note 7).
Equity instruments designated as FVOCI are those which are not held in order to give rise to contractual cashflows and
are not held for trading. They are valued at fair value using the earnings multiple valuation method or at cost if suitable
information is not available or appropriate. Movements in fair value are recognised in the CIES in Other Comprehensive
Income and Expenditure and reflected in the Financial Instruments Revaluation Reserve. These gains or losses are only
realised in the General Fund when the assets are sold. Interest is recognised in the CIES is the amount receivable for
the year in the loan agreement.
We recognise expected credit losses on assets held at amortised cost or FVOCI either on a 12-month or lifetime basis
as appropriate. Impairment losses are calculated to reflect our expectation that future cash flows might not take place
because the debtor defaults on their obligations. Where risk has significantly increased since an instrument was

Section B - Page 18
recognised, losses are assessed on a lifetime basis. Where risk has not significantly increased or remains low, losses
are assessed on the basis of 12-month expectations. For further details on the impairment of current debtors
(allowances for bad debts) see note 35. These are shown in service expenditure in the CIES.
Financial liabilities
Financial liabilities are recognised on the Balance Sheet when we become party to the contractual provisions of a
financial instrument and are initially measured at fair value. They are subsequently carried at their amortised cost.
Annual charges to the CIES for interest payable are based on the carrying amount of the liability, multiplied by the
effective rate of interest for the instrument in the year it was due. For our borrowings, this means that the amount
presented in the Balance Sheet is the outstanding principal repayable (plus accrued interest) and interest charged to the
CIES is the amount payable for the year in the loan agreement.
Trade creditors are due within one year and carrying value is deemed to equate to fair value.
Going Concern
Local authorities cannot be created or dissolved without statutory prescription. The provisions of the Code on going
concern reflect the economic and statutory environment in which local authorities operate and hence these accounts are
prepared on the basis that the functions of the authority will continue in operational existence for the foreseeable future.
Grants
Grants are shown in the accounts in the year that they relate to rather than when we actually receive them. They are
only shown in the accounts if we are certain that we will receive them. General grants we receive are shown as Taxation
and non-specific grant income in the CIES. Revenue grants we receive to pay for spending on specific service activities
are shown as income for the relevant service area when we are confident that any grant conditions have been met.
Where revenue grants have conditions outstanding the grant is held as a receipt in advance; if the conditions are met but
the grant remains unspent it is held in an earmarked reserve.
Capital grants are also credited to the CIES when any relevant conditions governing their use have been met. This
income is then reversed out and charged to the Capital Adjustment Account upon use, so the level of council tax is not
affected. Unused non-conditional capital grants are held in the Capital Grants Unapplied Reserve. Before the conditions
are met, capital grants are also held on the Balance Sheet as a receipt in advance.
Group Accounts
We have assessed a number of entities, including our wholly owned subsidiaries, in line with the Code and accounting
standards. Having due regard to materiality of effects on the financial statements and other qualitative considerations
that may affect the understanding by the readers of the accounts, we have not established a requirement to produce
group accounts. Further details of all our associated companies, subsidiary company holdings and other related party
details are outlined in Note 40. In addition, we have accounted for schools’ income and expenditure, assets and liabilities
in the single entity financial statements rather than produce group accounts, in accordance with the Code.
Heritage assets
Our heritage assets are held for their cultural, environmental or historic associations, making their preservation for future
generations important. We value our museum collections and valuables at the Courts, Judges House and Shire Hall at
their insurance valuations. The Golden Tower of Leaves and our Waller of Woodcote archive collection of family and
estate letters and deeds at County Records are valued at cost. It would not be cost effective to undertake revaluations
for all other County Record documents and any valuations would not have a material impact on the accounts.
Operational heritage assets used in the provision of services or for other activities are accounted for under other asset

Section B - Page 19
classes elsewhere in the Balance Sheet. Heritage assets classified as community or other assets are valued at
insurance cost unless our valuer believes conventional methods relevant to their classification are more appropriate. Any
gains on reclassification are taken to the Revaluation Reserve. More detailed information on the heritage assets we hold
is available on our website https://www.warwickshire.gov.uk.
Income from selling non-current assets
We use the income from selling non-current assets (buildings, vehicles and land) to meet part of the cost of new capital
spending or to repay borrowing. We show the gain or loss on the sale of assets in the CIES. This is the difference
between the sale proceeds and the carrying value of an asset after allowing for costs relating to the sale of the asset. We
take all costs of disposal incurred in a year to the CIES, regardless of whether all the proceeds of the related sale have
been received. We use up to 4% of a capital receipt to meet these disposal costs.
The carrying value of the asset (the net book value after depreciation) and the sale proceeds are also reversed in the
Movement in Reserves Statement (MIRS) and transferred to the Capital Adjustment Account, so the level of council tax
is not affected.
Where we have the right to capital receipts but have not yet received the cash payment, the transactions in the CIES are
unaffected. However, instead of recognising the sales proceeds we instead recognise a Deferred Capital Receipt, which
cannot be used to pay for our capital expenditure until the cash is received.
Intangible assets
Intangible assets are non-financial non-current assets that do not have physical substance and are controlled by the
authority through custody or legal rights (such as software licences). We treat intangible assets in the same way as other
non-current assets. We gradually reduce the value of intangible assets on a straight-line basis over their useful life (up to
10 years) to reflect the consumption of the economic or service benefit and charge this to the CIES. Intangible assets are
valued at amortised historic cost.
Inventories
Inventories are materials or supplies that will be consumed in producing goods or providing services. The highways,
roads and transport services stocks are valued at the cost of replacing them. Other stocks are valued at the cost we paid
for them. These methods of valuing stocks are different from the methods set out by the Code. This does not have a
material effect on the financial statements.
Investment property
Investment property assets are those held for rental purposes or capital value appreciation or both. They are not used for
the delivery of services. Such assets are initially measured at cost. Investment property is not depreciated but is
revalued at fair value every year. Gains and losses on revaluation, as well as disposal and/or rental income, are shown
in the Financing and investment income and expenditure line in the CIES. Our valuation techniques in relation to
investment properties are as outlined in Note 25.
Leases
Leases can be designated as either finance leases or operating leases. Finance leases are those where substantially all
the risks and rewards relating to the leased asset transfer to the lessee. All other leases are operating leases.

Section B - Page 20
Finance leases
We deal with finance leases where we are the lessee in the same way as other capital spending. We include these as
assets in the Balance Sheet and charge depreciation on them. Rentals are apportioned between a charge for the
acquisition of the asset (recognised as a liability in the Balance Sheet at the start of the lease and written down annually
as rent becomes payable) and a finance charge made each year to the CIES.
We do not have material finance leases where we are the lessor.
Operating leases
The vast majority of our lease rental payments (as lessee) are assessed to be operating leases and are charged evenly
to the CIES over the life of the lease.
Where we grant an operating lease over a property or item of plant or equipment, the asset is retained on the Balance
Sheet and the rental income is credited to the CIES as it is due.
We do not disclose contingent rents as they are not material to the financial statements.
Minimum Revenue Provision
We are required to make an annual contribution from revenue for the repayment of our debt as approved in our Treasury
Management Strategy. This is known as the Minimum Revenue Provision (MRP). We calculate MRP on a straight-line
basis using the average remaining useful life of our asset portfolio over the two asset categories of:
• Land, buildings and infrastructure; and
• Vehicles, plant and equipment.
Overheads and support service costs
All support service costs are held within the directorate within which they are managed. In accordance with the CIPFA
Service Reporting Code of Practice 2019/20 support service costs are only apportioned to services on a relevant basis
for the purposes of unit costs reporting on services when required for Government statistical comparability.
Pooled Budgets
We are the host authority to a number of pooled budget arrangements. These are joint arrangements solely for the
purposes of working together with other public sector bodies and which do not create separate entities. We have
reported on those arrangements showing the total pooled resources and expenditure including the nature of those
arrangements in the notes to the accounts. We have accounted for in our income, expenditure, assets and liabilities in
our financial statements, only that where we are the commissioning body. This will include amounts owed to or owed by
the other parties in the pooled budget arrangement to the authority where it is the commissioning body.
Property, plant and equipment
Assets that have a physical substance, are held for use in the production or supply of services and that are expected to
be used during more than one financial year are classified as property, plant and equipment (PPE).
Recognition
Our spending on buying, creating or improving PPE is classed as capital spending provided that it is probable that the
future economic benefits or service associated with the item will flow to us and the cost of the item can be measured
reliably. Spending that does not provide a significant benefit in terms of value, asset life, or service performance or which
falls below our de minimis level of £6,000 is charged to our revenue account in full in the year it occurs.

Section B - Page 21
Measurement
Assets are initially measured at cost, comprising the purchase price and any costs attributable to bringing the asset to
the location and condition necessary for it to be capable of operating in the manner intended. Assets are valued on the
basis set out by CIPFA and in line with the Statements of Asset Valuation Practice and Guidance Notes issued by the
Royal Institute of Chartered Surveyors. Our valuation process is led by the Council’s Property Management team, who
commission external valuers as needed.
The closing balances on 31 March 2020 were determined in the following ways:
• Operational land and buildings are included in the Balance Sheet at their current value based on their existing
use less an annual charge for depreciation. However, where there is insufficient market valuation evidence, for
example schools, assets are included in the Balance Sheet at a depreciated replacement cost;
• Surplus assets are those which we do not use in our day-to-day work and which are not likely to be disposed of in
the next twelve months. We include these assets in the Balance Sheet at fair value, based on highest and best
use. These assets are revalued every year and so are not subject to depreciation;
• We include infrastructure assets, such as roads and bridges and community assets, vehicles and equipment in
the Balance Sheet at the amount they cost when brought into use less an annual charge for depreciation. These
assets are valued in this way because there is no meaningful market data available to calculate an existing use
value; and
• Assets under construction are held in the Balance Sheet at the cost incurred on their production to date. When
the asset is deemed operationally complete the balance is transferred to the appropriate asset class shown
above and depreciation begins.
We revalue operational PPE assets held at a value other than depreciated historic cost annually to ensure their carrying
amount is not materially different from their current value at year end. In particular, we review the need to revalue any
asset where there has been more than £0.250 million spend each year.
When asset values rise above the amount, we paid for them we add the difference to the Revaluation Reserve. When
asset values go down, the reduction is charged to any available Revaluation Reserve balance held for that asset, with
the remainder being charged to the relevant service line in the CIES. This charge is then reversed out in the MIRS so
that there is no impact on council tax.
Impairment
Assets are assessed at each year-end to identify whether there is any indication that an asset may be impaired. Where
indications exist and any possible differences are estimated to be material, the recoverable amount of the asset is
estimated and, where this is less than the carrying amount of the asset, an impairment loss is recognised for the
shortfall. The accounting treatment of impairment losses is the same as that for revaluation losses shown above.
Depreciation
Depreciation is an accounting estimate used to spread the cost of an asset over its useful economic life. We charge
depreciation on buildings over our valuer’s estimate of their useful economic life (between 5 and 58 years), on roads and
bridges over 30 years, and on vehicles and equipment over their own useful lives (between 3 and 20 years for vehicles
and between 3 and 30 years for equipment).
The cost of depreciation is calculated by the following methodology:
• Our new assets are depreciated from the start of the financial year after they become operationally complete;
• Depreciation is calculated on a straight-line basis meaning that an asset’s value falls equally each year
throughout its life. If the gross value or remaining life of the asset changes due to expenditure, impairment or
revaluation, the depreciation charge will change in the following year; and

Section B - Page 22
• We generally charge depreciation on buildings as a single asset. However, if we determine that the value of
major components within an asset are material with respect to the overall value of that asset, and that the lifetime
of these components is significantly shorter than the remaining useful economic life of the asset, the major
component is depreciated separately.
We do not charge depreciation on land we own, as it does not have a limited useful life, nor on investment properties or
assets held for sale. Similarly, heritage assets are generally assessed to have infinite lives and so are not depreciated.
The estimated useful economic lives of our land and buildings are assessed by our valuers as part of the revaluation of
these assets.
Provisions
We put amounts of money aside to meet future specific service payments. For future events to be reflected in provisions,
they need to meet three tests:
• They must be the result of a past event;
• A reliable estimate can be made; and
• There must be a clear responsibility for the Council to make a future payment because of the past event.
Provisions are charged to the appropriate service line in the CIES when we become aware that it is probable a payment
will be required. The provision is based on the best estimate of the likely settlement. When payments are made, they are
charged to the provision already set up in the Balance Sheet.
Reserves
We keep reserves to pay for spending on projects we will carry out in future years, to protect us against unexpected
events and to manage the financial risk of the uncertainty we face. Reserves include ‘earmarked reserves’ which we set
aside for certain policy purposes and other ‘general reserves’ which represent resources set aside for purposes such as
general events and managing our cash flow. By law, schools are entitled to keep any of their budgets they have not
spent. These amounts are shown separately from other reserves.
Reserves are created by appropriating amounts from the council’s General Fund in the MIRS. When expenditure is
financed from a reserve, the expenditure itself is charged to the appropriate service line in the CIES. The reserve is then
appropriated back via the MIRS so that there is no net charge against council tax. Some reserves hold unspent funding
which can only be applied in specific ways, such as the Capital Grants Unapplied and Capital Receipts Reserve.
Other ‘unusable reserves’ are kept to manage the accounting processes for non-current assets, financial instruments,
and retirement and employee benefits:
• The capital accounting system requires us to maintain a Revaluation Reserve to reflect unrealised gains on non-
current assets, and a Capital Adjustment Account to manage timing differences between their usage and
financing;
• We maintain a Collection Fund Adjustment Account which holds the difference between the amounts required to
be shown in the CIES for council tax and business rates and that required by legislation to be taken against the
General Fund;
• We maintain an Accumulated Absences Account to hold the amount we have to accrue for post-employment
benefits such as annual leave earned but untaken at the year-end so as not to affect the level of Council Tax; and
• We maintain a Pensions Reserve to hold the difference between any increase in the accounting cost of pensions
in the year and the statutory figure chargeable in any year, which is the contribution made by the authority.

Section B - Page 23
Revenue expenditure funded from capital under statute
We undertake some capital spending during the year that does not result in the creation of an asset we own. Any money
we spend this way must be charged to the CIES but be funded from capital resources, and so, we make an adjustment
in the MIRS equal to the expenditure to reverse this to the Capital Adjustment Account.
Schools and schools’ assets
The balance of control for local authority maintained schools, foundation, voluntary aided and voluntary controlled
schools are all deemed to lie with the local authority. We therefore recognise schools’ assets, liabilities, reserves and
cash flows in our financial statements as if they were transactions, cash flow and balances of the authority. Any asset
provided by a third party and consumed in the provision of an education service with schools or donated to the school
will be treated as a donated asset. School assets are derecognised in full on the date that a school transfers to academy
status. These are disposals for nil consideration. These losses on disposal/transfer are shown in the Other operating
income and expenditure line in the CIES.
VAT
VAT payable is included as an expense only to the extent that it is not recoverable from HMRC. VAT receivable is
excluded from income. We are subject to Partial Exemption: as long as the VAT we claim on purchases used to
generate exempt income is less than 5% of all VAT claimed on purchases in the year, we can claim all our VAT back in
full.
Note on Roundings Individual tables presented within disclosures may not sum due to roundings. This does not reflect any inaccuracy or error.

Section B - Page 24
Notes to the Core Financial Statements
Note 1: Expenditure and Funding Analysis and associated notes The purpose of the Expenditure and Funding Analysis is to demonstrate to council tax payers how the funding available to the authority (i.e. grants, council tax and business rates) for the year has been used in providing services in comparison with those resources consumed and earned by the authority in accordance with generally accepted accounting practices. Income and expenditure accounted for under generally accepted accounting practices is presented more fully in the Comprehensive Income and Expenditure Statement.
Net Expenditure
Chargeable to
the General
Fund
£m
Adjustments
Between the
Funding and
Accounting
Basis
£m
Net expenditure
in the
Comprehensive
Income and
Expenditure
Statement
£m
Summary of revenue spending
Net Expenditure
Chargeable to
the General
Fund
£m
Adjustments
Between the
Funding and
Accounting
Basis
£m
Net expenditure
in the
Comprehensive
Income and
Expenditure
Statement
£m
Money spent on services
178.5 88.4 266.9 ~ Communities Directorate 186.2 55.0 241.2
224.9 9.0 233.9 ~ People Directorate 236.3 10.7 247.0
45.4 18.8 64.2 ~ Resources Directorate 58.0 13.9 71.9
-83.4 0.6 -82.8 ~ Schools -82.9 5.1 -77.8
-106.9 73.7 -33.2 ~ Corporate Serv ices and Resourcing -123.4 95.2 -28.2
0.0 8.6 8.6 ~ Non-distributed costs 0.0 0.8 0.8
258.5 199.1 457.6 Net cost of services 274.2 180.7 454.9
-277.5 -67.1 -344.6 ~ Other income and expenditure -298.3 -152.2 -450.5
-19.0 132.0 113.0Surplus (-) or deficit on the
provision of services-24.1 28.5 4.4
146.8 Opening General Fund Balances 168.9
3.1Opening Balance Adjustment -
Financial instrument reclassification 0.0
19.0Less/Plus Surplus or (Deficit) on
General Fund Balance in Year24.1
168.9 Closing General Fund Balance 193.0
2018/19 (Restated) 2019/20
The General Fund balances above include a significant proportion of earmarked reserves including those held by schools. For more details and information see the Movement in Reserves Statement and Note 2 to the accounts. The analysis of the money spent on services used in the Expenditure and Funding Analysis are those reported to the Cabinet Committee for quarterly budget monitoring and year end reporting. The restatement of 2018/19 figures is described in Note 3. In 2018/19 the introduction of IFRS9 (Financial instruments) led to a restatement of opening balances of £3.1 million as above).

Section B - Page 25
Notes to the Expenditure and Funding Analysis The table below provides a reconciliation of the main adjustments to the net expenditure chargeable to the General Fund Balances to arrive at amounts in the Comprehensive Income and Expenditure Statement. The relevant transfers between reserves are explained in the Movement in Reserves Statements.
Adjustments from General Fund to arrive at the
Comprehensive Income and Expenditure Statement
Amounts
Adjustments for Capital
Purposes
(a)
£m
Net change for
Pensions
Adjustments
(b)
£m
Other Statutory
Differences (c)
£m
Total Adjustments
£m
~ Communities Directorate 45.8 7.7 1.5 55.0
~ People Directorate 0.8 7.8 2.1 10.7
~ Resources Directorate 4.5 6.2 3.2 13.9
~ Schools -0.3 4.8 0.6 5.1
~ Corporate Serv ices and Resourcing -11.9 1.9 105.2 95.2
~ Non-distributed costs 0.0 0.8 0.0 0.8
Net cost of services 38.9 29.2 112.6 180.7
~ Other income and expenditure from the
Expenditure and Funding Analysis-64.2 19.3 -107.3 -152.2
Difference between General Fund surplus or deficit
and Comprehensive Income and Expenditure
Statement surplus or deficit on the Provision of
Services
-25.3 48.5 5.3 28.5
2019/20
Adjustments from General Fund to arrive at the
Comprehensive Income and Expenditure Statement
Amounts
Adjustments for Capital
Purposes
(a)
£m
Net change for
Pensions
Adjustments
(b)
£m
Other Differences (c)
£m
Total Adjustments
£m
~ Communities Directorate 79.8 7.9 0.7 88.4
~ People Directorate -1.3 6.8 3.5 9.0
~ Resources Directorate 12.3 4.6 1.9 18.8
~ Schools -0.4 3.0 -2.0 0.6
~ Corporate Serv ices and Resourcing -12.3 0.4 85.6 73.7
~ Non-distributed costs 0.0 8.6 0.0 8.6
Net cost of services 78.1 31.3 89.7 199.1
~ Other income and expenditure from the
Expenditure and Funding Analysis5.8 17.7 -90.6 -67.1
Difference between General Fund surplus or deficit
and Comprehensive Income and Expenditure
Statement surplus or deficit on the Provision of
Services
83.9 49.0 -0.9 132.0
2018/19 (Restated)

Section B - Page 26
a) Adjustments for capital purposes – this column adds in depreciation, impairment and revaluation gains and losses as well as revenue expenditure funded by capital under statute and capital grants used to fund that expenditure to the service lines within the Comprehensive Income and Expenditure Account. It also includes:
• Other operating expenditure – income received on disposal of assets and the amounts written off on those assets are added;
• Financing and investment income and expenditure – statutory charges for capital financing i.e. Minimum Revenue Provision and other revenue contributions are deducted; and
• Taxation and non-specific grant income and expenditure – credits for capital grants receivable in the year without conditions or for which conditions were satisfied in the year are added.
b) Net change for the Pensions adjustments – this column adds the net change for the removal of pensions
contributions and the addition of employee pension-related expenditure and income.
• For services – this represents the removal of the employer pension contributions made by the authority as allowed by statute and the replacement of current service costs and past service costs as a result of employee service; and
• For financing and investment income and expenditure – the net interest on the defined benefit liability is added as a cost.
c) Other differences – this column adds other differences between the amounts debited/credited to the
Comprehensive Income and Expenditure Statement and amounts payable/receivable to be recognised under statute. These include:
• Taxation and non-specific grant income and expenditure – the difference between what is chargeable under statutory regulations for Council Tax and Business Rates and the income recognised under generally accepted accounting practices. This is a timing difference as any difference will be brought forward in future Surpluses or Deficits on the Collection Fund. Revenue grants that are receivable without conditions or service-specific stipulation are required to be shown within this line rather than within the Net Cost of Services.

Section B - Page 27
Expenditure and Income Analysed by Nature
Expenditure/Income
2018/19
£m
2019/20
£m
Expenditure:
~ Employee expenses 356.6 361.4
~ Other services expenses 456.7 495.2
~ Support service recharges 0.0 0.0
~ Depreciation and amortisation 43.0 38.8
~ Impairment and revaluation losses (including reductions in fair value of investment property) 45.5 7.3
~ Interest payments 17.1 16.9
~ Precepts and Levies 0.2 0.2
~ Loss on the disposal of assets 74.9 9.6
Total Expenditure 994.0 929.4
Income:
~ Fees, charges and other service income fromcontracts with customers -82.1 -84.9
~ Other contributions, reimbursements and statutory income -34.9 -36.9
~ Interest and investment income (including increases in fair value of investment property) -3.5 -4.4
~ Income from council tax -276.4 -295.9
~ Grants -484.1 -502.8
Total Income -881.0 -925.0
Surplus or Deficit on the Provision of Services 113.0 4.4
Total income received can be analysed on a segmental basis as follows:
Segmental Income Received
2018/19 (Restated)
£m
2019/20
£m
~ Communities Directorate -40.4 -44.2
~ People Directorate -65.7 -69.8
~ Resources Directorate -15.8 -16.6
~ Schools -266.4 -261.1
~ Corporate Serv ices and Resourcing -423.4 -459.6
-811.7 -851.3
~ Capital Grants Credited to the CIES (Note 23) -69.3 -73.1
~ Revaluation Gains and profit on sale of investment property credited to the CIES
(Notes 11 & 5)0.0 -0.6
Total Income Analysed on a segmental basis -881.0 -925.0
We lease some of our properties on long term contracts with customers, but these are not material. Any amounts outstanding at year end are shown amongst the debtors in Note 14 as appropriate.

Section B - Page 28
Note 2: Adjustments between accounting basis and funding basis under regulations Adjustments between accounting basis and funding basis under regulations
2019/20
General
Fund
Balance
Capital
Fund
Capital
Receipts
Reserve
Capital
Grants
Unapplied
Movement in
Unusable
Reserves
net spending£ m £ m £ m £ m £ m
Adjustments primarily involving the Capital Adjustment Account
~ Charges for depreciation of non-current assets 37.8 -37.8
~ Revaluation losses on property , plant and equipment assets 7.6 -7.6
~ Movements in the market value of investment properties -0.2 0.2
~ Amortisation of intangible assets 1.0 -1.0
~ Capital grants and contributions applied -96.6 96.6
~ Revenue expenditure funded from capital under statute 19.2 -19.2
~ Amounts of non-current assets written off on disposal to the CIES 24.1 -24.1
Insertion of items not debited or credited to the CIES
~ Minimum Revenue Prov ision -11.9 11.9
~ Capital expenditure charged to the General Fund Balance -2.7 2.7
Adjustments primarily involving the Capital Grants Unapplied Account
~ Application of Capital Grants to the Capital Adjustment Account 11.5 -11.5 0.0
Adjustments primarily involving the Capital Receipts Reserve & the Deferred Capital Receipts Reserve
~ Cash sale proceeds credited as part of the gain/loss on disposal to the CIES -3.6 3.6 0.0
~ Deferred capital receipts realised in year 6.0 -6.0
~ Deferred capital receipts credited as part of the gain/loss on disposal to the CIES -11.4 11.4
~ Use of Capital Receipts Reserve to finance new capital expenditure 0.0 -10.3 10.3
Adjustments primarily involving the Financial Instruments Revaluation Reserve
~ unrealised gains and losses of financial instruments which are shown in the CIES but
are not charged/credited to the General Fund Balance in accordance with statutory
requirements 0.4 -0.4
Adjustments primarily involving the Pensions Reserve
~ Grant funding of fire fighters' pension liabilities -5.1 5.1
~ Reversal of net charges made for retirement benefits in accordance with IAS19 98.8 -98.8
~ Employer's pensions contributions and direct payments to pensioners -45.2 45.2
Adjustments primarily involving the Collection Fund Adjustment Account
~ Amount by which council tax income credited to the CIES is different from council
tax income calculated in accordance with statutory requirements 2.4 -2.4
~ Amount by which business rates income credited to the CIES is different from
business rates income calculated in accordance with statutory requirements 1.2 -1.2
Adjustment primarily involving the Accumulated Absences Account
~ Amount by which officer remuneration charged to the CIES on an accruals basis is
different from remuneration chargeable in the year in accordance with statutory
requirements 1.3 -1.3
Total adjustments 28.5 0.0 -0.7 -11.5 -16.3
Reversal of items debited or credited to the Comprehensive Income and Expenditure Statement (CIES):
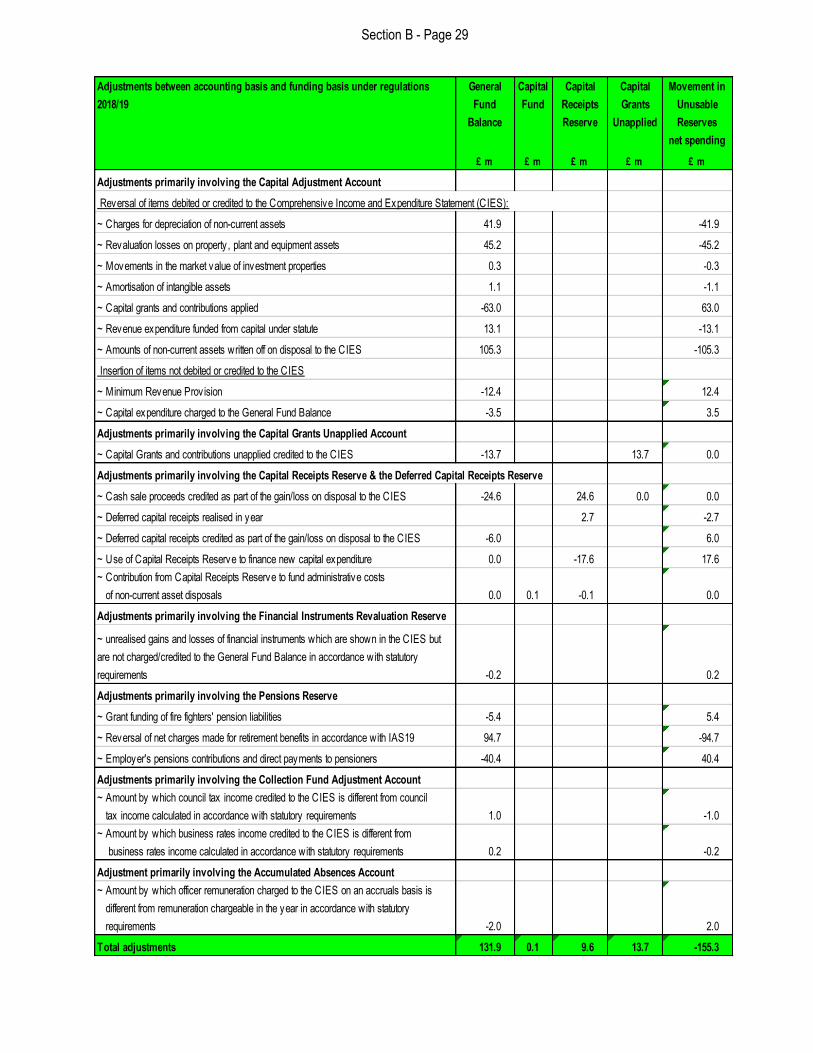
Section B - Page 29
Adjustments between accounting basis and funding basis under regulations
2018/19
General
Fund
Balance
Capital
Fund
Capital
Receipts
Reserve
Capital
Grants
Unapplied
Movement in
Unusable
Reserves
net spending
£ m £ m £ m £ m £ m
Adjustments primarily involving the Capital Adjustment Account
~ Charges for depreciation of non-current assets 41.9 -41.9
~ Revaluation losses on property , plant and equipment assets 45.2 -45.2
~ Movements in the market value of investment properties 0.3 -0.3
~ Amortisation of intangible assets 1.1 -1.1
~ Capital grants and contributions applied -63.0 63.0
~ Revenue expenditure funded from capital under statute 13.1 -13.1
~ Amounts of non-current assets written off on disposal to the CIES 105.3 -105.3
Insertion of items not debited or credited to the CIES
~ Minimum Revenue Prov ision -12.4 12.4
~ Capital expenditure charged to the General Fund Balance -3.5 3.5
Adjustments primarily involving the Capital Grants Unapplied Account
~ Capital Grants and contributions unapplied credited to the CIES -13.7 13.7 0.0
Adjustments primarily involving the Capital Receipts Reserve & the Deferred Capital Receipts Reserve
~ Cash sale proceeds credited as part of the gain/loss on disposal to the CIES -24.6 24.6 0.0 0.0
~ Deferred capital receipts realised in year 2.7 -2.7
~ Deferred capital receipts credited as part of the gain/loss on disposal to the CIES -6.0 6.0
~ Use of Capital Receipts Reserve to finance new capital expenditure 0.0 -17.6 17.6
~ Contribution from Capital Receipts Reserve to fund administrative costs
of non-current asset disposals 0.0 0.1 -0.1 0.0
Adjustments primarily involving the Financial Instruments Revaluation Reserve
~ unrealised gains and losses of financial instruments which are shown in the CIES but
are not charged/credited to the General Fund Balance in accordance with statutory
requirements -0.2 0.2
Adjustments primarily involving the Pensions Reserve
~ Grant funding of fire fighters' pension liabilities -5.4 5.4
~ Reversal of net charges made for retirement benefits in accordance with IAS19 94.7 -94.7
~ Employer's pensions contributions and direct payments to pensioners -40.4 40.4
Adjustments primarily involving the Collection Fund Adjustment Account
~ Amount by which council tax income credited to the CIES is different from council
tax income calculated in accordance with statutory requirements 1.0 -1.0
~ Amount by which business rates income credited to the CIES is different from
business rates income calculated in accordance with statutory requirements 0.2 -0.2
Adjustment primarily involving the Accumulated Absences Account
~ Amount by which officer remuneration charged to the CIES on an accruals basis is
different from remuneration chargeable in the year in accordance with statutory
requirements -2.0 2.0
Total adjustments 131.9 0.1 9.6 13.7 -155.3
Reversal of items debited or credited to the Comprehensive Income and Expenditure Statement (CIES):

Section B - Page 30
Note 3: Significant items of income and expenditure and restatements of prior year figures The Comprehensive Income and Expenditure Statement and related notes have been restated for 2018/19 for comparative purposes to reflect changes in the organisations structure on 1 April 2019. None of these changes have had a material effect on the restated income and expenditure. This does not change the overall reported position on the statement or the notes. Note 4: Other operating expenditure
2018/19
(Restated) Other operating expenditure 2019/20
£ m £ m
0.2 Environment Agency Levy 0.3
74.6 Losses on disposal/transfer of non-current assets 9.6
74.8 9.8
Note 5: Financing and investment income and expenditure
2018/19
(Restated) Financing and investment income and expenditure 2019/20
£ m £ m
17.1 Interest payable and similar charges 16.9
21.6 Net interest on the net defined benefit liability 22.5
-3.5 Interest receivable and similar income -3.8
0.0
Unrealised gains or losses on financial assets held at fair value through profit and loss
transferred to usable reserves 0.7
-0.2
Unrealised gains or losses on financial assets held at fair value through profit and loss
transferred to unusable reserves 0.4
-13.4 Trading account income -12.8
13.4 Trading account expenditure 12.0
0.7 Income and expenditure on investment properties and changes in their fair value -0.6
0.5 Other investment expenditure 0.4
-0.8 Other investment income -1.0
35.4 34.8

Section B - Page 31
Note 6: Taxation and non-specific grant income and expenditure
2018/19 Taxation and non specific grant income and expenditure 2019/20
£ m £ m
-276.4 Council tax income -295.9
Business rates income and expenditure
-39.0 ~ Retained business rates -39.9
-26.1 ~ Business rates top up -24.7
-1.8 Business rates pool growth (WCC share) -1.5
-1.5 Business rates pool surplus -1.2
-9.7 Revenue Support Grant 0.0
Other non-ringfenced Government grants
-5.4 ~ Fire Pensions Fund Grant -5.1
-25.7 ~ Revenue grants -53.7
-69.3 ~ Capital grants and contributions -73.1
-454.8 -495.1
Note 7: Transfers to/from earmarked reserves
Balance at
31 March
Opening
Balance
adjustment
Balance at
31 March
Balance at
31 March
2018 Out In 2019 Out In 2020
£ m £ m £ m £ m £ m £ m £ m £ m
Schools Balances (under a scheme of
delegation) 12.5 0.0 2.3 14.8 -0.6 0.0 14.2
DSG Reserve 1.0 -1.0 0.0 0.0 -5.2 2.3 -2.9
External Commitments Reserves 9.2 -2.0 3.0 10.2 -1.4 3.0 11.8
Redundancy Fund 11.9 -1.3 0.0 10.6 -2.2 0.0 8.4
Insurance Fund 8.9 0.0 0.0 8.9 0.0 0.2 9.1
DSG Offset Fund 0.0 0.0 0.0 0.0 0.0 12.3 12.3
Investment Funds 12.8 -2.4 10.3 20.7 -19.8 54.1 55.0
Projects and Policies Reserves 7.7 -1.6 1.6 7.7 -1.6 0.4 6.5
Volatility Reserves 10.2 3.1 0.0 4.3 17.6 -0.8 4.6 21.4
Management of Service Risk Reserves 27.0 -2.4 13.3 37.9 -42.2 26.8 22.5
Medium Term Financial Strategy 15.2 -8.4 0.0 6.8 0.0 5.0 11.8
Total 116.4 3.1 -19.1 34.8 135.2 -73.8 108.7 170.1
Movement in earmarked reserves
(including 2018/19 Restatement)
Transfers Transfers
The money that services set aside is held to make sure that they can meet future known budget commitments, and that services will have the resources to react to any unexpected events. Details of reserves allocated to and held by the Council’s services can be found in the 2019-20 Financial Outturn Report, available at https://www.warwickshire.gov.uk. During 2019/20 we reclassified our earmarked reserves to reflect the reason for holding the reserve. We have not included details of the amounts of the adjustments for each different line affected as we do not consider that including this detail has a material impact on the understanding of the users of the accounts. The total amount of earmarked reserves remains unchanged. Movements during 2018/19 have been restated for comparative purposes. In 2018/19 the introduction of IFRS9 (Financial instruments) led to a restatement of opening balances of £3.1 million as above).
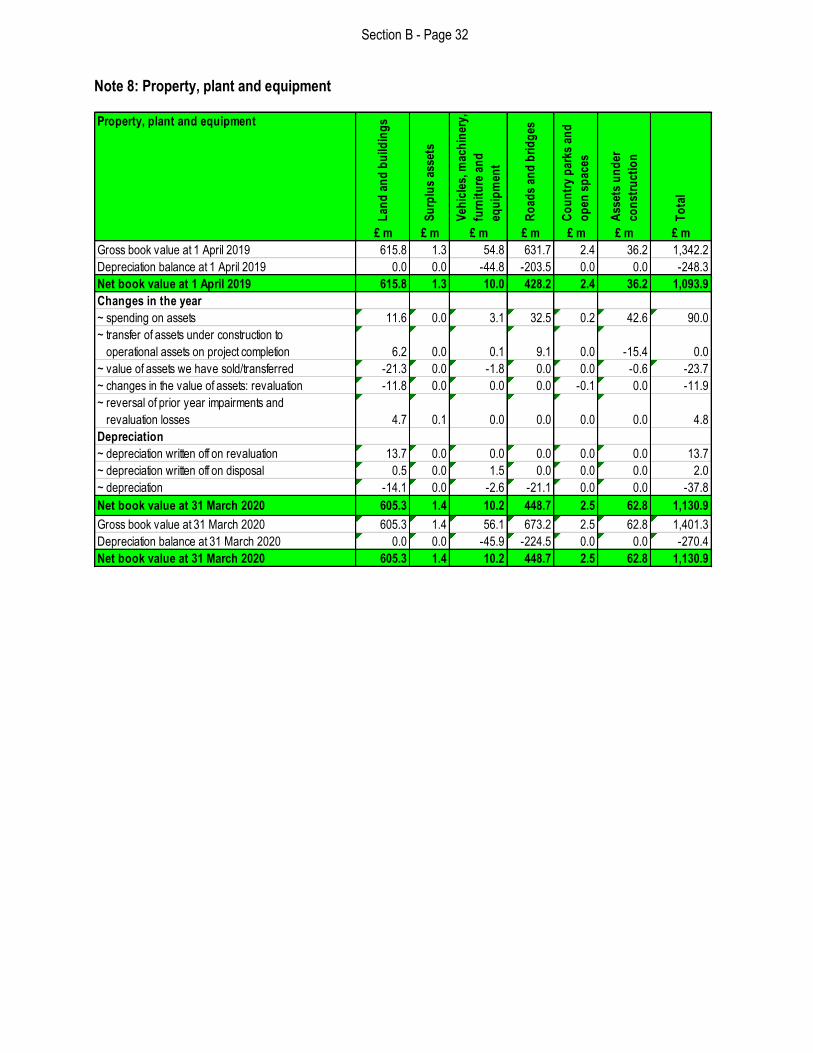
Section B - Page 32
Note 8: Property, plant and equipment
Property, plant and equipment
Lan
d a
nd
bu
ildin
gs
Su
rplu
s as
sets
Veh
icle
s, m
ach
iner
y,
furn
itu
re a
nd
equ
ipm
ent
Ro
ads
and
bri
dg
es
Co
un
try
par
ks a
nd
op
en s
pac
es
Ass
ets
un
der
con
stru
ctio
n
To
tal
£ m £ m £ m £ m £ m £ m £ m
Gross book value at 1 April 2019 615.8 1.3 54.8 631.7 2.4 36.2 1,342.2
Depreciation balance at 1 April 2019 0.0 0.0 -44.8 -203.5 0.0 0.0 -248.3
Net book value at 1 April 2019 615.8 1.3 10.0 428.2 2.4 36.2 1,093.9
Changes in the year
~ spending on assets 11.6 0.0 3.1 32.5 0.2 42.6 90.0
~ transfer of assets under construction to
operational assets on project completion 6.2 0.0 0.1 9.1 0.0 -15.4 0.0
~ value of assets we have sold/transferred -21.3 0.0 -1.8 0.0 0.0 -0.6 -23.7
~ changes in the value of assets: revaluation -11.8 0.0 0.0 0.0 -0.1 0.0 -11.9
~ reversal of prior year impairments and
revaluation losses 4.7 0.1 0.0 0.0 0.0 0.0 4.8
Depreciation
~ depreciation written off on revaluation 13.7 0.0 0.0 0.0 0.0 0.0 13.7
~ depreciation written off on disposal 0.5 0.0 1.5 0.0 0.0 0.0 2.0
~ depreciation -14.1 0.0 -2.6 -21.1 0.0 0.0 -37.8
Net book value at 31 March 2020 605.3 1.4 10.2 448.7 2.5 62.8 1,130.9
Gross book value at 31 March 2020 605.3 1.4 56.1 673.2 2.5 62.8 1,401.3
Depreciation balance at 31 March 2020 0.0 0.0 -45.9 -224.5 0.0 0.0 -270.4
Net book value at 31 March 2020 605.3 1.4 10.2 448.7 2.5 62.8 1,130.9

Section B - Page 33
Property, plant and equipment
Lan
d a
nd
bu
ildin
gs
Su
rplu
s as
sets
Veh
icle
s, m
ach
iner
y,
furn
itu
re a
nd
equ
ipm
ent
Ro
ads
and
bri
dg
es
Co
un
try
par
ks a
nd
op
en s
pac
es
Ass
ets
un
der
con
stru
ctio
n
To
tal
£ m £ m £ m £ m £ m £ m £ m
Gross book value at 1 April 2018 697.1 0.2 56.6 588.7 2.8 34.8 1,380.1
Depreciation balance at 1 April 2018 -25.5 0.0 -45.9 -183.8 -0.1 0.0 -255.3
Net book value at 1 April 2018 671.6 0.2 10.8 404.8 2.8 34.7 1,124.8
Changes in the year
~ reclassifications 2.2 1.3 0.0 0.0 0.0 0.1 3.6
~ spending on assets 11.6 0.0 2.3 32.2 0.1 24.1 70.3
~ transfer of assets under construction to
operational assets on project completion
11.8 0.0 0.1 10.8 0.0 -22.7 0.0
~ value of assets we have sold/transferred -78.8 0.0 -4.1 0.0 0.0 0.0 -83.0
~ changes in the value of assets: revaluation -50.2 -0.1 0.0 0.0 -0.6 0.0 -50.9
~ reversal of prior year impairments and
revaluation losses
22.2 0.0 0.0 0.0 0.0 0.0 22.2
Depreciation
~ depreciation written off on revaluation 41.3 0.0 0.0 0.0 0.2 0.0 41.5
~ depreciation written off on disposal 3.3 0.0 4.0 0.0 0.0 0.0 7.3
~ depreciation -19.3 0.0 -2.9 -19.6 -0.1 0.0 -41.9
Net book value at 31 March 2019 615.8 1.3 10.0 428.2 2.4 36.2 1,093.9
Gross book value at 31 March 2019 615.8 1.3 54.8 631.7 2.4 36.2 1,342.2
Depreciation balance at 31 March 2019 0.0 0.0 -44.8 -203.5 0.0 0.0 -248.3
Net book value at 31 March 2019 615.8 1.3 10.0 428.2 2.4 36.2 1,093.9
Our land and building assets include schools, fire stations, libraries, waste disposal sites and other buildings. Assets we have disposed of mainly relate to two schools that have transferred to Academy status during the year and one investment property. Depreciation We charge depreciation on buildings over our valuer’s estimate of their useful economic life (between 5 and 58 years), on roads and bridges over 30 years, and on vehicles and equipment over their own useful lives (between 3 and 20 years for vehicles and between 3 and 30 years for equipment). Capital commitments At 31 March 2020, the authority had entered into a number of contracts for the construction or enhancement of property, plant and equipment in 2019/20 and future years. The total of those payments we were still due to make on capital schemes that were not yet finished, or which we had not finished paying for is £18.9 million. Similar commitments at 31 March 2019 were £27.5 million.
The three largest outstanding commitments are as follows: 1. Rural Broadband project - BDUK Contract 3 £7.8m; 2. WCC Highway Maintenance – Balfour Beatty Contract £7.2m; and 3. Campion School - School expansion - £2.8m Effects of changes in estimates There have been no material changes to our accounting estimates for property, plant and equipment in 2019/20.

Section B - Page 34
Revaluations We carry out a programme of revaluations that ensures all property, plant and equipment required to be measured at fair value for the asset type is revalued annually. The table below shows the date at which our property, plant and equipment assets were last valued.
Revaluations
Lan
d a
nd
bu
ildin
gs
Su
rplu
s A
sset
s
Veh
icle
s, m
ach
iner
y,
furn
itu
re a
nd
equ
ipm
ent
Ro
ads
and
bri
dg
es
Co
un
try
par
ks a
nd
op
en s
pac
es
Ass
ets
un
der
con
stru
ctio
n
To
tal
£ m £ m £ m £ m £ m £ m £ m
Carried at Historical Cost 0.0 0.0 10.2 448.7 2.5 62.8 524.2
Valued at current value as at:
31st March 2020 605.3 1.4 0.0 0.0 0.0 0.0 606.7
Total cost or valuation 605.3 1.4 10.2 448.7 2.5 62.8 1,130.9 All our revalued assets carried at current value were valued in 2019/20. Valuation of land and buildings were carried out in accordance with the methodologies and basis for estimation set out in the professional standards of the Royal Institution of Chartered Surveyors. All our Surplus Assets fall within the Level 2 - Fair value category, valued using observable inputs. There has been no change in categorisation during the year. At this stage it is too early to be able to assess the impact on property values at 31 March 2020 as a result of Covid-19.
The valuation of our property assets is therefore reported on the basis of ‘material valuation uncertainty’ as per VPS 3 and VPGA 10 of the RICS Red Book Global. Consequently, less certainty – and a higher degree of caution – should
be attached to the valuations than would normally be the case.
Note 9: School property, plant and equipment The value of our school property, plant and equipment is £432.8 million (2018/19 - £451.0 million). The table below shows a breakdown across the various types of school.
School Property, plant and equipment Land Buildings Other Assets Total
At 31 March 2020 £ m £ m £ m £ m
Community Schools 132.3 101.1 1.7 235.1 75
Voluntary Aided Schools 51.5 27.5 0.0 79.0 29
Voluntary Controlled Schools 60.4 32.5 0.0 92.9 37
Foundation Schools 9.6 16.2 0.0 25.8 6
Net book value at 31 March 2020 253.8 177.3 1.7 432.8 147
Number of
Schools
School Property, plant and equipment Land Buildings Other Assets Total
At 31 March 2019 £ m £ m £ m £ m
Community Schools 142.0 107.6 2.0 251.6 78
Voluntary Aided Schools 51.5 28.6 0.0 80.1 29
Voluntary Controlled Schools 60.4 32.8 0.0 93.2 37
Foundation Schools 9.6 16.5 0.0 26.1 6
Net book value at 31 March 2019 263.5 185.5 2.0 451.0 150
Number of
Schools

Section B - Page 35
The number of schools has reduced by 2 (3 sites) which chose to take up academy status in 2019/20. Whilst we recognise the assets of voluntary aided, voluntary controlled and foundation schools in our accounts we do not have the right to access or dispose of these assets to settle any liabilities. We have no donated school assets.
Note 10: Heritage assets The net book value of the heritage assets we hold is £4.5 million (£4.4million in 2018/19). There have been no material acquisitions during 2019/20 and there have not been any significant disposals of heritage assets. More detailed information about the specific heritage assets we hold is on our website https://www.warwickshire.gov.uk.
Note 11: Investment properties We classify a number of properties as investment properties, most of which are leased out to third parties under operating leases. The following items of income and expense have been accounted for in the Financing and investment income and expenditure line in the Comprehensive Income and Expenditure Statement:
31 March 2019
£ m
Investment properties 31 March 2020
£ m
0.1 Direct net operating expense arising from investment property 0.1
0.0 Rental Income from Investment Property 0.0
0.0 Net gain/loss (-) 0.1
The table below summarises the movement in the fair value of investment properties over the year.
31 March 2019
£ m
Investment properties 31 March 2020
£ m
58.9 Balance at the start of the year 25.6
0.0 Opening balance adjustment 0.0
-3.5 Reclassifications 0.0
0.1 Additions 0.1
-29.6 Disposals -2.3
0.0 Net gains from fair value adjustments 0.2
-0.3 Net losses from fair value adjustments 0.0
25.6 Balance at the end of the year 23.6
The table below shows the fair value of these assets.
Investment Properties - Fair value Quoted Market
Price - Level 1
Using Observable
Inputs - Level 2
Unobservable
Inputs - Level 3 Total
£ m £ m £ m £ m
31st March 2019 0.0 25.6 0.0 25.6
31st March 2020 0.0 23.6 0.0 23.6 There have no changes in the year between levels.
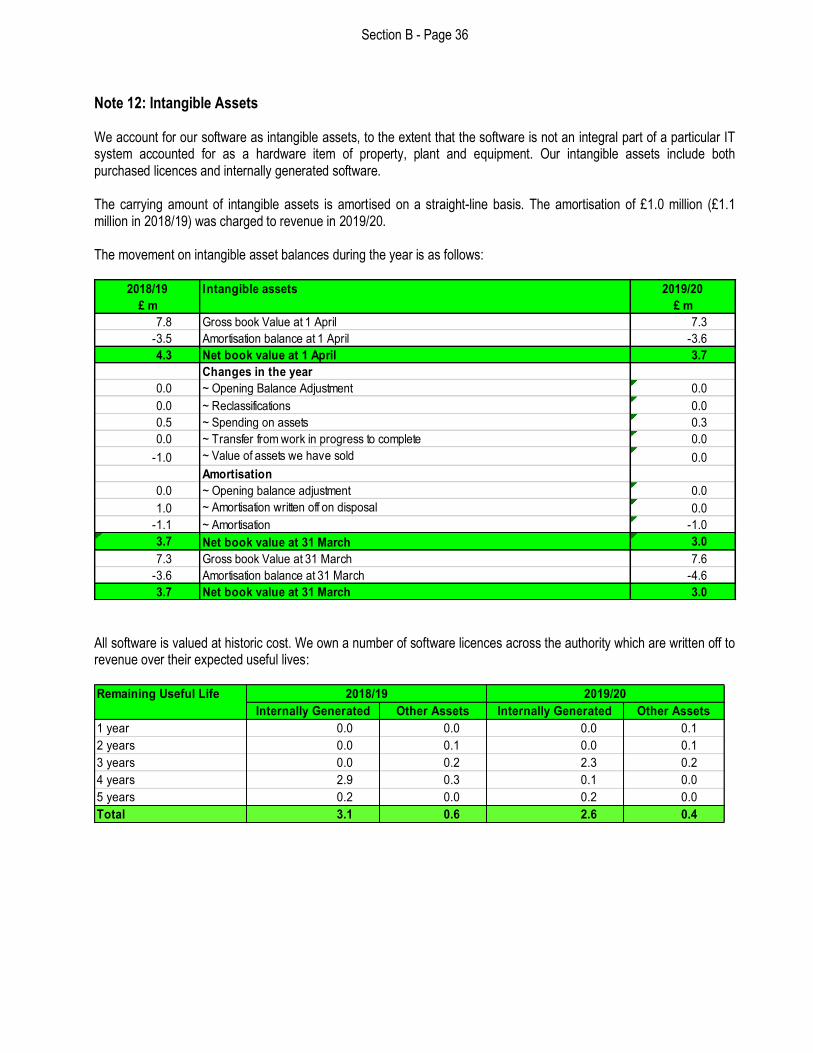
Section B - Page 36
Note 12: Intangible Assets We account for our software as intangible assets, to the extent that the software is not an integral part of a particular IT system accounted for as a hardware item of property, plant and equipment. Our intangible assets include both purchased licences and internally generated software. The carrying amount of intangible assets is amortised on a straight-line basis. The amortisation of £1.0 million (£1.1 million in 2018/19) was charged to revenue in 2019/20. The movement on intangible asset balances during the year is as follows:
2018/19 Intangible assets 2019/20
£ m £ m
7.8 Gross book Value at 1 April 7.3
-3.5 Amortisation balance at 1 April -3.6
4.3 Net book value at 1 April 3.7
Changes in the year
0.0 ~ Opening Balance Adjustment 0.0
0.0 ~ Reclassifications 0.0
0.5 ~ Spending on assets 0.3
0.0 ~ Transfer from work in progress to complete 0.0
-1.0 ~ Value of assets we have sold 0.0
Amortisation
0.0 ~ Opening balance adjustment 0.0
1.0 ~ Amortisation written off on disposal 0.0
-1.1 ~ Amortisation -1.0
3.7 Net book value at 31 March 3.0
7.3 Gross book Value at 31 March 7.6
-3.6 Amortisation balance at 31 March -4.6
3.7 Net book value at 31 March 3.0
All software is valued at historic cost. We own a number of software licences across the authority which are written off to revenue over their expected useful lives: Remaining Useful Life
Internally Generated Other Assets Internally Generated Other Assets
1 year 0.0 0.0 0.0 0.1
2 years 0.0 0.1 0.0 0.1
3 years 0.0 0.2 2.3 0.2
4 years 2.9 0.3 0.1 0.0
5 years 0.2 0.0 0.2 0.0
Total 3.1 0.6 2.6 0.4
2019/202018/19

Section B - Page 37
Note 13: Financial instruments The borrowings and investments disclosed in the Balance Sheet are made up of the following categories of financial instruments: Financial Assets and liabilities
Current Long-term Total Current Long-term Total
£m £m £m £m £m £m
Financial Assets
Investments:
~ Loans and receivables
~ Fair Value through Profit and Loss 43.5 0.0 43.5 32.1 10.3 42.4
~ Loans and Receivables/Amortised Cost 110.8 0.0 110.8 130.2 0.0 130.2
~ Fair value through other comprehensive
income - designated equity instruments 0.0 2.0 2.0 0.0 2.0 2.0
Total investments 154.3 2.0 156.3 162.3 12.3 174.6
Debtors - at amortised cost ~ Amortised cost 0.0 0.8 0.8 1.5 0.0 1.5
~ Financial assets carried at contract amounts 59.4 0.0 59.4 56.3 0.0 56.3
Total Debtors 59.4 0.8 60.2 57.8 0.0 57.8
Cash:
~ Cash and cash equivalents 204.7 0.0 204.7 201.7 0.0 201.7
Total Cash 204.7 0.0 204.7 201.7 0.0 201.7
Total Financial assets 418.4 2.8 421.2 421.8 12.3 434.1
31 March 2019 31 March 2020
Financial Assets and liabilities
Current Long-term Total Current Long-term Total
£m £m £m £m £m £m
Financial Liabilities
Borrowings:
~ Financial liabilities at amortised cost 18.5 341.4 359.9 20.0 321.4 341.4
Total Borrowings 18.5 341.4 359.9 20.0 321.4 341.4
Creditors - amortised cost
~ Financial liabilities at contractual amounts 75.9 0.0 75.9 67.9 0.0 67.9
Total 75.9 0.0 75.9 67.9 0.0 67.9
Total Financial Liabilities 94.4 341.4 435.8 87.9 321.4 409.3
31 March 2019 31 March 2020
Reconciliation to Balance Sheet carrying amounts 2018/19 2019/20
£m £m
Debtors that are financial instruments 59.4 57.8
Debtors that are not financial instruments 22.7 26.9
Total Debtors 82.1 84.7
Creditors that are financial instruments 75.9 67.9
Creditors that are not financial instruments 44.2 55.0
Total Creditors 120.1 122.9

Section B - Page 38
The valuation of financial instruments has been classified into the three levels of fair value hierarchy required in the Code according to the quality and reliability of the information and techniques used to value them at fair value. The fair values of financial liabilities and financial assets carried in the balance sheet at contractual amounts have been assessed by calculating the present value of the cash flows that will take place over the remaining term of the instruments. (Level 1 in the fair value hierarchy). The difference between the long term borrowing nominal amounts carried in the Balance Sheet and their fair value is based on a calculation that uses new loan rates to estimate what it would cost to borrow a similar portfolio of loans at the Balance Sheet date. These loans are with the Public Works Loan Board with interest rates fixed on the date of the initial lending. For more details see note 35. We use an external expert to provide the fair values for our borrowings, which along with our other financial assets held in the amortised cost and fair value through profit and loss categories are Level 2 in the fair value hierarchy. Equity instruments assets are valued internally using the earnings multiple valuation method based on the latest available accounts for the companies in which we hold shares. Details are shown in note 40. Where that data is not available, they are valued at cost. (Level 3 in the fair value hierarchy). Investments held at amortised cost of £130.2 million (£110.8 million in 2018/19) consist of bank, building society and local authority investments which are held solely for payment of principal and interest and a business model to collect contractual cash flows. The carrying amount and fair value consist of the principal amount and accrued interest to 31 March. Assets held at fair value through profit and loss of £42.4 million (£43.5 million in 2018/19) are made up of two funds: Threadneedle Social Bond Fund and CCLA Property Fund. At 31 March 2020 the CCLA Property Fund has been gated by the Fund manager, as a result of the Covid-19 pandemic and its effects on the accurate valuation of the property portfolios it holds, which means that we are unable to request for these funds to be cashed in for the foreseeable future until more certainty around prices can be measured. We have prudently treated this as held as long-term investments since it is uncertain whether we could liquidate them before 31 March 2021 if we so wished. The carrying amount and fair value are based on unit prices provided through fund manager statements. See also note 3 and accounting policies for FVPL assets. In assessing fair value, we have made the following assumptions:
• No early repayment or impairment is recognised;
• Where an instrument will mature in the next 12 months, carrying amount is assumed to approximate to fair value; and
• The fair value of trade and other receivables is taken to be the invoiced or billed amount. There have been no transfers between input levels in 2019/20 and no changes in the valuation techniques for financial instruments during the year. The fair value hierarchy of assets and liabilities is shown in the table below:

Section B - Page 39
Financial Instruments - Fair value 31 March 2020
Quoted Market
Price - Level 1
Using
Observable
Inputs - Level 2
Unobservable
Inputs - Level 3 Total
£ m £ m £ m £ m
Financial Assets:-
~ Amortised cost 0.0 130.2 0.0 130.2
- Fair Value through Profit and Loss 0.0 42.4 0.0 42.4
- Fair value through other comprehensive
income - designated equity instruments 0.0 0.0 2.0 2.0
Debtors:-
- Amortised cost 1.5 1.5
- Financial assets carried at contractual amounts
(deemed to be fair value)56.3 0.0 0.0 56.3
Cash:-
- Cash and cash equivalents (deemed to be fair value) 201.7 0.0 0.0 201.7
Total Financial Assets 259.5 172.6 2.0 434.1
Financial Liabilities:-
Borrowings:-
- Financial liabilities carried at amortised cost 0.0 507.5 0.0 507.5
Creditors:-
- Financial liabilities carried at contractual amounts
(deemed to be fair value)67.9 0.0 0.0 67.9
Total Financial Liabilities 67.9 507.5 0.0 575.4
Financial Instruments - Fair value 31 March 2019
(Restated) Quoted Market
Price - Level 1
Using
Observable
Inputs - Level 2
Unobservable
Inputs - Level 3 Total
£ m £ m £ m £ m
Financial Assets:-
~ Amortised cost 0.0 110.8 0.0 110.8
- Fair Value through Profit and Loss 0.0 43.5 0.0 43.5
- Fair value through other comprehensive
income - designated equity instruments 0.0 0.0 2.0 2.0
Debtors:-
- Amortised cost 0.8 0.8
- Financial assets carried at contractual amounts
(deemed to be fair value)59.4 0.0 0.0 59.4
Cash:-
- Cash and cash equivalents (deemed to be fair value) 204.7 0.0 0.0 204.7
Total Financial Assets 264.9 154.3 2.0 421.2
Financial Liabilities:-
Borrowings:-
- Financial liabilities carried at amortised cost 0.0 550.2 0.0 550.2
Creditors:-
- Financial liabilities carried at contractual amounts
(deemed to be fair value)75.9 0.0 0.0 75.9
Other short term liabilities:-
- other liabilities including finance leases 0.0 0.0 0.0 0.0
Total Financial Liabilities 75.9 550.2 0.0 626.1

Section B - Page 40
2018/19
(Restated) 2019/20 2018/19 2019/20
£m £m £m £m
Net gains and Losses
~ Financial assets measured at fair value through profit and loss -0.1 1.1 0.0 0.0
~ Investment in equity instrument designated at fair value through other
comprehensive income -0.8 -1.0 0.0 -0.1
Total net gains -0.9 0.1 0.0 -0.1
Interest Revenue
~ Financial assets measured at amortised cost -3.5 -3.8 0.0 0.0
Total Interest Revenue -3.5 -3.8 0.0 0.0
Interest Expense
~ Financial liabilities measured at amortised cost 17.1 16.9 0.0 0.0
Total Interest Expense 17.1 16.9 0.0 0.0
(Surplus)/Deficit on
the Provision of
Services
Other
Comprehensive
Income and
Expenditure
Interest paid and investment income received
Financial Assets
Carrying Amount Fair Value Carrying Amount Fair Value
£ m £ m £ m £ m
Financial assets held at amortised cost 110.8 110.8 130.2 130.2
Financial assets at fair value through Profit
and Loss43.5 43.5 42.4 42.4
Cash and Cash Equivalents 204.7 204.7 201.7 201.7
Fair value through other comprehensive
income - designated equity instruments2.0 2.0 2.0 2.0
Debtors carried at amortised cost 0.0 0.0 1.5 1.5
Debtors carried at contractual amounts 59.4 59.4 56.3 56.3
Long term debtors - amortised cost 0.8 0.8 0.0 0.0
Total 421.2 421.2 434.1 434.1
31 March 2019 31 March 2020
Financial Liabilities
Carrying Amount Fair Value Carrying Amount Fair Value
£ m £ m £ m 31 March 2020
Financial liabilities held at amortised cost 359.9 550.2 341.4 507.5
Long term creditors 0.0 0.0 0.0 0.0
Financial Liability at contractual amounts 75.9 75.9 67.9 67.9
Finance Lease liabilities 0.0 0.0 0.0 0.0
Total 435.8 626.1 409.3 575.4
31 March 2019 31 March 2020

Section B - Page 41
Note 14: Debtors
31 March 2019 Short-term debtors 31 March 2020
(Restated) £ m
26.7 Trade Receivables 14.9
3.7 VAT 4.8
10.3 Other Public Sector Debtors 13.5
0.2 Other Public Sector Prepayments 0.7
12.1 Council Tax and Non Domestic Rates - Taxpayers 14.1
4.8 Council Tax and Non Domestic Rates - Local authorities 3.4
-3.0 Council Tax and Non Domestic Rates - Bad Debts -3.7
0.6 Prepayments in relation to capital contracts 0.0
4.4 Other prepayments to External Organisations and Individuals 7.6
12.2 Social Care Debtors 13.6
8.0 Capital debtors from External Organisations and Individuals 14.6
4.2 Other debtors 4.7
-2.0 Bad Debts -3.5
82.1 Balance at the end of the year 84.7
Note 15: Cash and cash equivalents
31 March 2019 Cash and cash equivalents 31 March 2020
£ m £ m
18.1 Cash held by the authority (including schools and imprest accounts) 21.0
129.9 Bank current accounts (call accounts and instant access deposit accounts) 106.6
56.7Short-term deposits with building societies and other institutions less than 3
months maturity74.1
204.7 Total cash and cash equivalents 201.7
Note 16: Creditors
31 March 2019 Short-term Creditors 31 March 2020
£ m £ m
14.2 Trade Payables 13.9
5.0 Social Security Costs 5.2
7.0 Other Public Sector accruals 7.0
3.1 Council Tax and Non Domestic Rates - Taxpayers 3.3
4.6 Council Tax and Non Domestic Rates - Local authorities 7.8
5.3 Accumulated Absences 6.6
31.6 Receipts in Advance 38.6
13.6 Other accruals in relation to capital contracts 6.5
35.8 Other accruals to External Organisations and Individuals 34.0
120.1 Balance at the end of the year 122.9

Section B - Page 42
Note 17: Provisions Our provisions total £8.2 million (£7.6 million 2018/19). Our former liability insurers, Municipal Mutual Insurance (MMI) went into run-off (ceased to write new business) on 30 September 1992, following which a contingent Scheme of Arrangement became effective on January 1994 to ensure a smooth run-off should MMI subsequently be declared insolvent. In the event of the Scheme being triggered, claims paid by MMI after 30 September 1992 will be liable to claw back, at a percentage to be determined by the administrators, with subsequent claims to be paid in part at the same percentage. A Supreme Court judgement relating to establishment of liability arising from mesothelioma claims under employers' liability policies has resulted in the increased possibility of the Scheme being triggered. We have set aside £2.0 million to cover the claw back and the outstanding claims. We have to account for our share of non-domestic rating appeals that are still to be resolved by the Valuation Office Agency for the District and Borough Councils in Warwickshire. We cannot predict when these appeals may be raised or settled, so we have assumed that these settlements will be made within 1 year for the purposes of these accounts. The amount we have provided is £3.9 million. We have reassessed the balance of liabilities between the county council and the Firefighters’ Pension Fund. Some of the final costs are still uncertain and so a provision of £0.6 million has been included. We have had to plan to reduce our staff numbers to deliver our savings programme. We have accounted for these employment costs but only where the decisions taken are irreversible. This and all other provisions, totalling £1.7 million, are individually insignificant.
Note 18: Usable Reserves Movements in our usable reserves are detailed in the Movement in Reserves Statement and in notes 1 and 2. A summary of revenue and capital usable reserves is shown below:
31 March 2019 Usable reserves 31 March 2020
£ m £ m
32.3 General Fund 21.2
135.2 Earmarked Reserves 170.1
1.4 Capital Fund 1.7
9.6 Capital Receipts Reserve 8.9
15.1 Capital Grants Unapplied 3.6
193.6 Total usable reserves 205.5
Note 19: Unusable Reserves
31 March 2019 Unusable reserves 31 March 2020
£ m £ m
195.2 Revaluation Reserve 193.1
630.9 Capital Adjustment Account 679.2
6.0 Deferred Capital Receipts Reserve 11.4
2.4 Financial Instruments Revaluation Reserve 2.1
-5.3 Accumulated Absences Reserve -6.6
2.4 Collection Fund Adjustment Account -1.2
-924.8 Pensions Reserve -812.6
-93.2 Total unusable reserves 65.4

Section B - Page 43
Revaluation Reserve The Revaluation Reserve contains the gains we have made arising from increases in the value of our property, plant and equipment and intangible assets. The balance is reduced when assets with accumulated gains are:
• Revalued downwards or impaired and the gains are lost;
• Used in the provision of services and the gains are consumed through depreciation, or
• Disposed of and the gains are realised. The Reserve contains only revaluation gains accumulated since 1 April 2007, the date the Reserve was created. Accumulated gains arising before that date are consolidated into the balance on the Capital Adjustment Account.
2018/19 Revaluation Reserve 2019/20
£ m £ m
174.6 Balance on 1 April 195.2
89.5 Revaluation increases 16.4
-33.7 Revaluation decreases -2.3
-6.1 Depreciation adjustment to Capital Adjustment Account -6.2
-29.1 Revaluation written off on disposal -10.0
195.2 Balance on 31 March 193.1 Capital Adjustment Account The Capital Adjustment Account absorbs the timing differences arising from the different arrangements for accounting for the consumption of non-current assets and for the financing of the acquisition, construction or enhancement of those assets under statutory provisions:
• The Account is debited with the cost of acquisition, construction and enhancement as depreciation, impairment and revaluation losses and amortisations are charged to the Comprehensive Income and Expenditure Statement (with reconciling postings from the Revaluation Reserve to convert fair value figures to a historical cost basis). The Account is credited with the amounts we set aside as finance for the costs of acquisition, construction and enhancement;
• The Account contains the accumulated gains and losses on investment properties; and
• The Account also contains revaluation gains accumulated on property, plant and equipment before 1 April 2007, the date that the Revaluation Reserve was created to hold such gains. Note 2 provides details of the source of all the transactions posted to the Account, apart from those involving the Revaluation Reserve.
2018/19 Capital Adjustment Account 2019/20
£ m £ m
706.5 Balance on 1 April 630.9
22.2 Revaluation increase 0.2
-65.4 Revaluation decrease -12.3
0.0 Reversal of previous impairments 4.8
6.1 Depreciation adjustment to Revaluation Reserve 6.2
29.1 Revaluation written off on disposal 10.2
-105.3 Value of asset disposals -24.3
-2.7 Disposal proceeds received transferred to usable reserves 0.0
-13.1 Transfer of spending on assets we do not own -19.2
-30.7 Transfers to and from the revenue account -26.9
84.1 Money used to buy assets 109.6
630.9 Balance on 31 March 679.2

Section B - Page 44
Deferred Capital Receipts Reserve The Deferred Capital Receipts Reserve holds the gains recognised on the disposal of non-current assets but for which cash settlement has yet to take place. Under statutory arrangements, the authority does not treat these gains as useable for financing new capital expenditure until they are backed by cash receipts. When the deferred cash settlement eventually takes place, amounts are transferred to the Capital Receipts Reserve.
0.0 Balance on 1 April 6.0
6.0
Transfer of deferred sale proceeds credited as part of the gain/loss on disposal
to the comprehensive Income and Expenditure Statement 11.4
0.0 Transfer to the Capital Receipts Reserve upon receipt of cash -6.0
6.0 Balance on 31 March 11.4
31 March 2019
£ m
Deferred Capital Receipts reserve 31 March 2020
£ m
Financial Instruments Revaluation Reserve The Financial Instruments Revaluation Reserve contains the gains/losses made by the authority arising from increases/decreases in the value of its equity investments that are measured at fair value through other comprehensive income plus those financial assets valued at fair value through profit and loss for which a statutory over ride exists, because they meet the conditions of being classified as a pooled investment vehicle. This means that changes in their fair value do not hit the General Fund. The balance is reduced when investments with accumulated gains are:
• Revalued downwards or impaired and the gains are lost
• Disposed of and the gains are realised.
31 March 2019 Financial Instrument Revaluation Reserve 31 March 2020
£ m £ m
2.3 Opening Balance 2.4
0.1 Upward revaluation of investments 0.1
0.0 Downward revaluation of investments -0.4
0.0 Change in impairment loss allowances 0.0
2.4 2.1
0.0
Accumulated gains or loses on assets sold and maturing assets written out to the CIES
as part of other investment income 0.0
0.0
Accumulated gains or loses on assets sold and maturing assets written out to the
general fund balance for financial assets designated to fair value through other
comprehensive income. 0.0
2.4 Balance at 31 March 2.1
Accumulated Absences Account The Accumulated Absences Account absorbs the amounts that would otherwise affect the General Fund from accruing for compensated absences earned but not taken in the year, e.g. annual leave entitlement carried forward at 31 March. Statutory arrangements require that the impact on the General Fund is neutralised by transfers to or from the Account.

Section B - Page 45
Movement in Accumulated Absences Account
-7.3 Balance at 1 April -5.3
7.3Settlement or cancellation of accrual made at the end of the preceding
year5.3
-5.3 Amounts accrued at the end of the current year -6.6
2.0
Amount by which officer remuneration charged to the Comprehensive
Income and Expenditure Statement on an accruals basis is different from
remuneration chargeable in the year in accordance with statutory
requirements
-1.3
-5.3 Balance at 31 March -6.6
31 March 202031 March 2019
£ m£ m
Collection Fund Adjustment Account The Collection Fund Adjustment Account manages the differences arising from the recognition of council tax and business rates income in the Comprehensive Income and Expenditure Statement as it falls due compared with the statutory arrangements for paying across amounts due to the General Fund.
31 March 2019 31 March 2020
£ m £ m
3.7 Balance at start of year 2.4
-1.0
Amount by which council tax income credited to the Comprehensive Income and
Expenditure Statement is different from council tax income calculated for the year
in accordance with statutory requirements
-2.4
-0.2
Amount by which non domestic rates income credited to the Comprehensive
Income and Expenditure Statement is different from non domestic rate income
calculated for the year in accordance with statutory requirements
-1.2
2.4 Balance at end of year -1.2
Movement in Collection Fund Adjustment Account
Pensions Reserve The Pensions Reserve absorbs the timing differences arising from the different arrangements for accounting for post-employment benefits and for funding benefits in accordance with statutory provisions. We account for post-employment benefits in the Comprehensive Income and Expenditure Statement as the benefits are earned by employees accruing years of service, updating the liabilities to reflect inflation, changing assumptions and investment returns on any resources set aside to meet costs. However, statutory arrangements require benefits earned to be financed, as we make employer’s contributions to pension funds or eventually pay any pensions for which we are directly responsible. The debit balance on the Pensions Reserve therefore shows a substantial shortfall in the benefits earned by past and current employees and the resources we have set aside to meet them. The statutory arrangements will ensure that funding will have been set aside by the time that the benefits come to be paid.
On 31 March 2019 Pensions Reserve - All Schemes On 31 March 2020
£ m £ m
-787.0 Balance as 1 April -924.8
-88.9 Remeasurements of net defined (liability)/asset 160.7
-94.7 Reversal of net charges made for retirement benefits -98.8
40.4
Employer's pension contributions and direct payments to pensioners payable in the
year 45.2
5.4 Grant funding of firefighters' pensions liabilities 5.1
-924.8 Balance at 31 March -812.6

Section B - Page 46
Note 20: Cash Flow Statement – operating activities The surplus or deficit on the provision of services has been adjusted for the following non-cash movements:
31 March 2019 31 March 2020
£m £m
41.9 Depreciation 37.8
45.5 Impairment and downward valuations 7.3
1.1 Amortisation 1.0
10.7 Increase/(decrease) in creditors -3.0
1.2 (Increase)/decrease in debtors including bad debts -7.2
-0.2 (Increase)/decrease in inventories 0.1
43.0 Movement in pension liability 48.5
105.3
Carrying amount of non-current assets and non-current assets held for
sale, sold or derecognised 24.1
-0.5
Other non-cash items charged to the net surplus or deficit on the
provision of services 1.6
248.0 110.2 The cash flows for operating activities include the following items:
31 March 2019 31 March 2020
£m £m
3.2 Interest received 4.0
-17.1 Interest paid -25.4
0.8 Dividends received 1.0 The surplus or deficit on the provision of services has been adjusted for the following items that are investing and financing activities.
31 March 2019 31 March 2020
£m £m
-24.6
Proceeds from the sale of property, plant and equipment, investment
property and intangible assets -15.0
-76.7
Any other items for which the cash effects are investing or financing
cash flows -85.1
-101.2 -100.1

Section B - Page 47
Note 21: Cash Flow Statement – investing activities
31 March 2019 31 March 2020
£ m £ m
-68.2
Purchase of property,plant and equipment, investment property and
intangible assets -92.3
-60.4 Proceeds or purchase (-) of short-term and long-term investments -19.4
-0.3 Other receipts or payments (-) for investing activities -0.7
27.3
Proceeds from the sale of property, planty and equipment, investment
property and intangible assets 9.7
83.4 Other receipts from investing activities - capital grants 104.0
-18.2 Net cash flows from investing activities 1.3
Cash flows from investing activities
Note 22: Cash Flow Statement – financing activities
31 March 2019 31 March 2020
£ m £ m
0.0 Cash payments in respect of short-term and long-term borrowing 0.0
-1.2 Repayments of short and long term borrowing -10.0
0.0
Cash payments for the reduction of outstanding liabilities in relation to finance
leases 0.0
-1.2 Net cash flows from financing activities -10.0
Cash flows from financing activities
Our only cash flow in relation to borrowing was the repayment of £10.0 million of loans outstanding (£1.2 million for 2018/19). Included in the opening balance of short term borrowing at 31 March 2019 was an accrual for £8.5 million of interest which was paid on 1 April 2019. This is included in the cash flow for operating activities interest paid in Note 20 above.
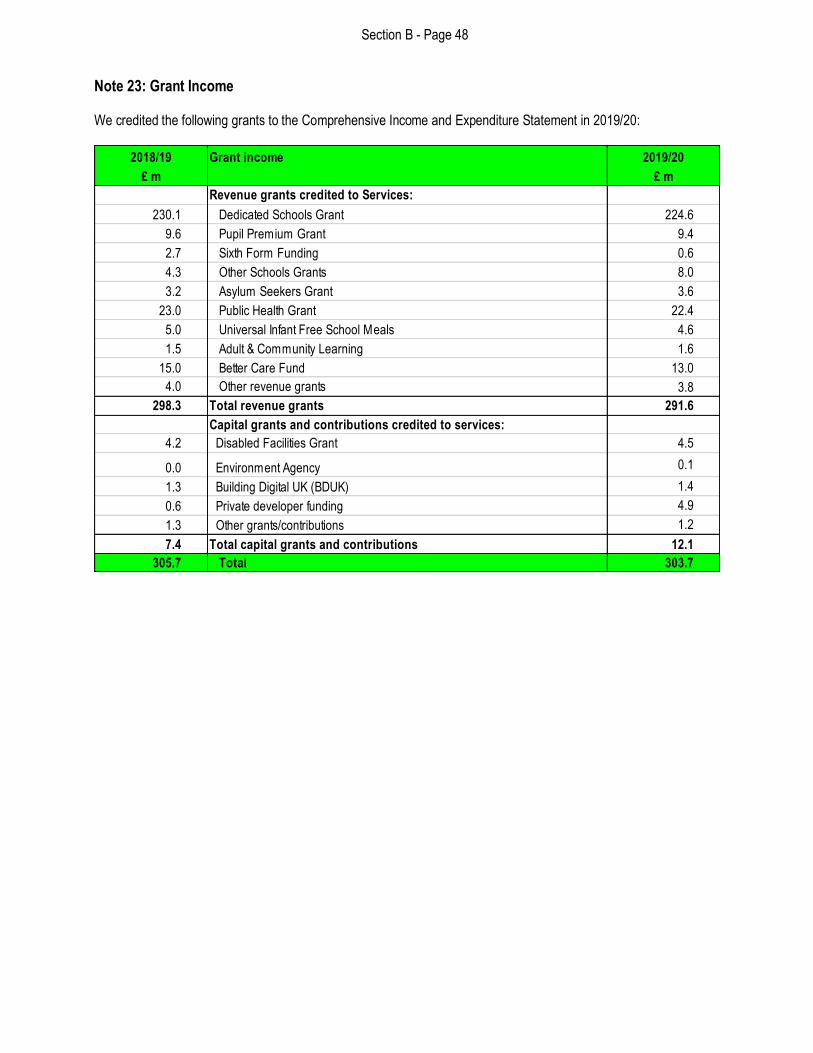
Section B - Page 48
Note 23: Grant Income We credited the following grants to the Comprehensive Income and Expenditure Statement in 2019/20:
2018/19 Grant income 2019/20
£ m £ m
Revenue grants credited to Services:
230.1 Dedicated Schools Grant 224.6
9.6 Pupil Premium Grant 9.4
2.7 Sixth Form Funding 0.6
4.3 Other Schools Grants 8.0
3.2 Asylum Seekers Grant 3.6
23.0 Public Health Grant 22.4
5.0 Universal Infant Free School Meals 4.6
1.5 Adult & Community Learning 1.6
15.0 Better Care Fund 13.0
4.0 Other revenue grants 3.8
298.3 Total revenue grants 291.6
Capital grants and contributions credited to services:
4.2 Disabled Facilities Grant 4.5
0.0 Environment Agency 0.1
1.3 Building Digital UK (BDUK) 1.4
0.6 Private developer funding 4.9
1.3 Other grants/contributions 1.2
7.4 Total capital grants and contributions 12.1
305.7 Total 303.7

Section B - Page 49
2018/19 Grant income 2019/20
£ m £ m
Credited to Taxation and Non Specific Grant Income:
4.2 Business Rates Retention/Compensation Scheme 9.5
12.1 Better Care Fund 18.5
0.0 Covid 19 Support Grant 14.1
2.6 New Homes Bonus 3.1
1.8 Independent Living Fund Grant 1.7
1.4 Tackling Troubled Families 0.9
1.6 Chilldrens Social Innovation Programme 2.4
0.0 Fire Service Pensions Grant 1.2
9.7 Revenue Support Grant 0.0
5.4 Fire Pension Fund Grant 5.1
2.1 Other Grants 2.3
40.8 Total revenue grants 58.8
Capital grants and contributions:
1.2 Devolved Formula Capital 1.7
4.0 HS2 Limited Funding 0.0
20.2 Schools Maintenance and Basic Need 21.5
24.2 Local Transport Plan & other transport grants 23.3
2.3 Contribution from other local authorities 7.9
16.8 Private developer funding 15.7
0.5 Other grants/contributions 3.0
69.2 Total capital grants 73.1
110.0 Total 131.9
We have received a number of grants, contributions and donations that have yet to be recognised as income as they have conditions attached to them that will require the monies or property to be returned to the giver. The balances at year end are as follows:
31 March 2019 Grant receipts in advance 31 March 2020
£ m £ m
Short-term grant receipts in advance - revenue
0.7 Other grants 0.9
0.7 Total revenue grants 0.9
Long-term grant receipts in advance - capital
1.5 Devolved Formula Capital 1.1
1.6 Grant from Other Local Authorities 2.4
1.2 Additional School Capital Funding 0.8
53.0 Private developer funding and capital receipt deposits 62.0
1.3 Other grants/contributions 0.3
58.6 Total capital grants 66.6
59.3 Total 67.5

Section B - Page 50
Note 24: Accounting standards issued that have not yet been adopted The following accounting standards have been issued but not yet adopted:
• Amendments to IAS28 Investments in associates and joint ventures: long term interests in associates and joint ventures;
• Annual improvements to IFRS standards 2015 to 2017;
• Amendments to IAS19 Employee benefits: Plan amendments, curtailment and settlements. These standards all apply to local authority accounts in 2020/21 but are not expected to have a material effect on the authority’s financial statements. The planned introduction of IFRS16 Leases was planned for implementation from 1 April 2020 but in light of COVID-19 CIPFA has deferred adoption with an effective date of 1 April 2021. The impact of this standard for lessees particularly will be that leases with underlying assets that had previously sat off the Balance Sheet will now be brought onto the Balance Sheet. In doing so it will create a fixed asset and lease liability on the Balance Sheet to be written down over the lease term. In addition, the lease payments will be split between an amount used to write down that liability and a finance charge to the CIES over the remaining lease life. Although we are still in the process of assessing the full financial impact on the financial statements on implementation, initial assessment suggests that the value of leased assets and corresponding liabilities to be brought into the Balance Sheet is likely to be material.
Note 25: Assumptions made about the future and other major sources of estimation uncertainty The Statement of Accounts contains estimated figures that are based on assumptions we have made about the future or that are otherwise uncertain. Estimates are made taking into account historical experience, current trends and other relevant factors. However, because balances cannot be determined with certainty, actual results could be materially different from the assumptions and estimates. The items in our Balance Sheet at 31 March 2020 for which there is a significant risk of material adjustment in the forthcoming financial year are as follows:
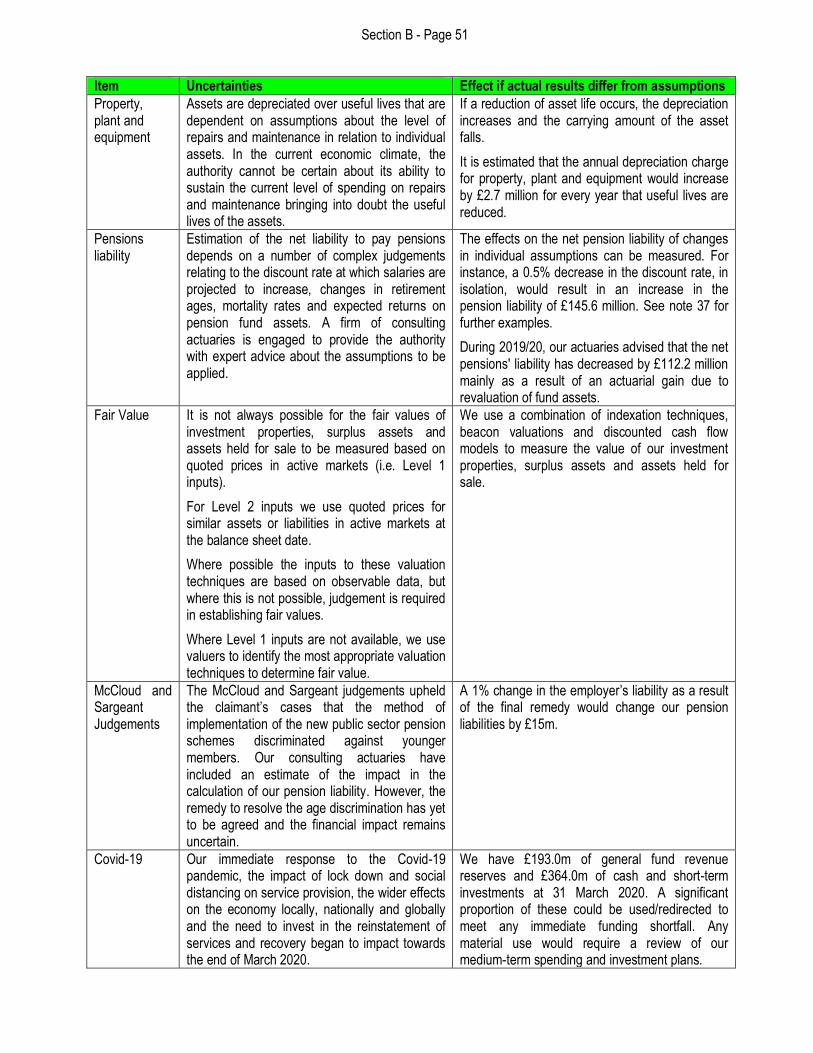
Section B - Page 51
Item Uncertainties Effect if actual results differ from assumptions
Property, plant and equipment
Assets are depreciated over useful lives that are dependent on assumptions about the level of repairs and maintenance in relation to individual assets. In the current economic climate, the authority cannot be certain about its ability to sustain the current level of spending on repairs and maintenance bringing into doubt the useful lives of the assets.
If a reduction of asset life occurs, the depreciation increases and the carrying amount of the asset falls.
It is estimated that the annual depreciation charge for property, plant and equipment would increase by £2.7 million for every year that useful lives are reduced.
Pensions liability
Estimation of the net liability to pay pensions depends on a number of complex judgements relating to the discount rate at which salaries are projected to increase, changes in retirement ages, mortality rates and expected returns on pension fund assets. A firm of consulting actuaries is engaged to provide the authority with expert advice about the assumptions to be applied.
The effects on the net pension liability of changes in individual assumptions can be measured. For instance, a 0.5% decrease in the discount rate, in isolation, would result in an increase in the pension liability of £145.6 million. See note 37 for further examples.
During 2019/20, our actuaries advised that the net pensions' liability has decreased by £112.2 million mainly as a result of an actuarial gain due to revaluation of fund assets.
Fair Value It is not always possible for the fair values of investment properties, surplus assets and assets held for sale to be measured based on quoted prices in active markets (i.e. Level 1 inputs).
For Level 2 inputs we use quoted prices for similar assets or liabilities in active markets at the balance sheet date.
Where possible the inputs to these valuation techniques are based on observable data, but where this is not possible, judgement is required in establishing fair values.
Where Level 1 inputs are not available, we use valuers to identify the most appropriate valuation techniques to determine fair value.
We use a combination of indexation techniques, beacon valuations and discounted cash flow models to measure the value of our investment properties, surplus assets and assets held for sale.
McCloud and Sargeant Judgements
The McCloud and Sargeant judgements upheld the claimant’s cases that the method of implementation of the new public sector pension schemes discriminated against younger members. Our consulting actuaries have included an estimate of the impact in the calculation of our pension liability. However, the remedy to resolve the age discrimination has yet to be agreed and the financial impact remains uncertain.
A 1% change in the employer’s liability as a result of the final remedy would change our pension liabilities by £15m.
Covid-19 Our immediate response to the Covid-19 pandemic, the impact of lock down and social distancing on service provision, the wider effects on the economy locally, nationally and globally and the need to invest in the reinstatement of services and recovery began to impact towards the end of March 2020.
We have £193.0m of general fund revenue reserves and £364.0m of cash and short-term investments at 31 March 2020. A significant proportion of these could be used/redirected to meet any immediate funding shortfall. Any material use would require a review of our medium-term spending and investment plans.

Section B - Page 52
Item Uncertainties Effect if actual results differ from assumptions
Covid-19 We used expert external valuers and actuaries to value of our assets and liabilities as at the end of March 2020 to ensure our balance sheet reflects the estimated impact at that point. However, the duration of the pandemic and the depth of and timeframe for recovery from any economic downturn remain uncertain. Therefore, the financial impact and risk of a material adjustment to our balance sheet going forward remains.
The key elements that could be negatively impacted include:
• The fair value of our assets and investments; and
• The level of reserves and cash we use compared to our plans to meet any unfunded costs as well as an increase in both demand for our services and a reduced resource base in future years.
Our long-term investments and investment property equate to 3% of our total long-term assets at 31 March 2020. The decrease in value of these assets will not affect the underlying strength of our asset base. £157.9m of our operational land and buildings assets are valued on the basis of their existing use. A 9% variation in the value of these assets would have a material impact on our accounts.
Note 26: Capital expenditure and capital financing The total amount of capital expenditure incurred in the year is shown in the table below, together with the resources that have been used to finance it. Where capital expenditure is to be financed from borrowing (resulting in future revenue charges), the expenditure results in an increase in the Capital Financing Requirement (CFR), a measure of the capital expenditure incurred historically yet to be financed. The CFR is analysed in the second part of this note.
2018/19 Capital financing requirement 2019/20
£ m £ m
314.0 Opening requirement 301.7
Capital investment:
70.3 - Property, plant & equipment 90.0
0.0 - Heritage assets 0.0
0.5 - Intangible assets 0.3
0.1 - Investment property 0.1
13.1 - Revenue spending from capital under statute 19.2
84.1 Total capital investment 109.6
Sources of finance:
-17.6 - Capital receipts -10.3
-63.0 - Government grants and other contributions -96.6
- Sums set aside from revenue:
-3.5 - Direct revenue contributions -2.7
-12.4 - MRP -11.9
-96.4 Total sources of income -121.5
301.7 Closing capital financing requirement 289.8
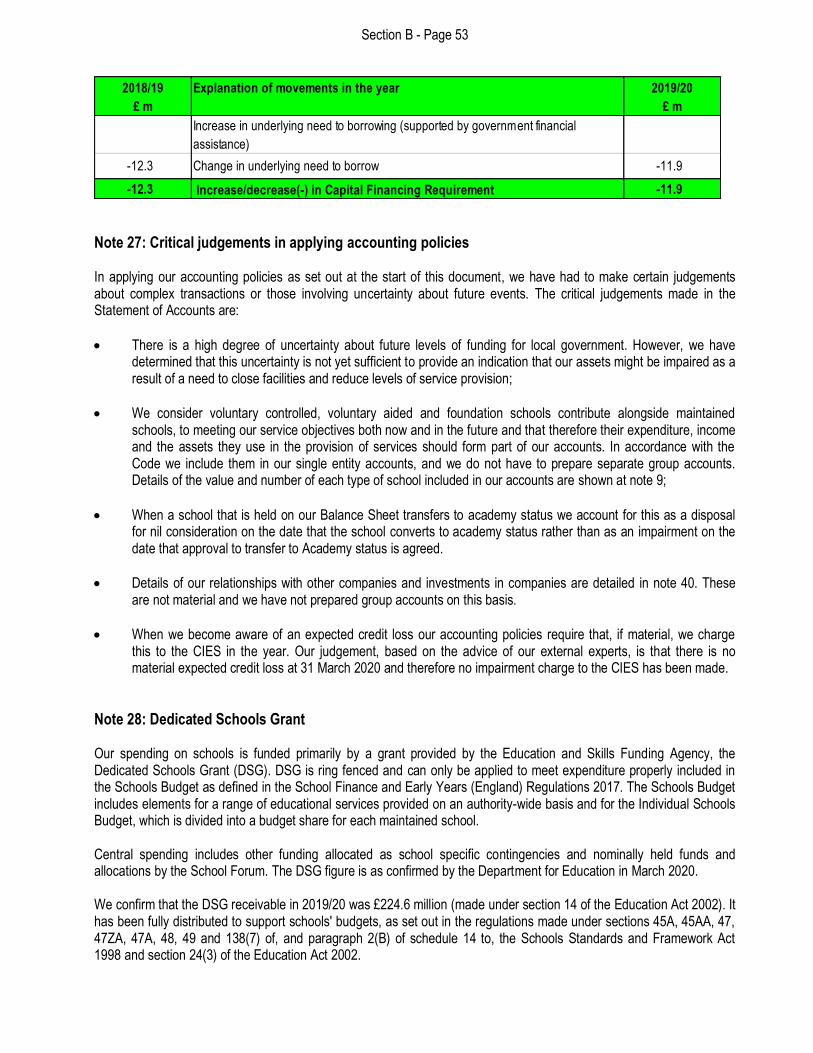
Section B - Page 53
2018/19 Explanation of movements in the year 2019/20
£ m £ m
Increase in underlying need to borrowing (supported by government financial
assistance)
-12.3 Change in underlying need to borrow -11.9
-12.3 Increase/decrease(-) in Capital Financing Requirement -11.9
Note 27: Critical judgements in applying accounting policies In applying our accounting policies as set out at the start of this document, we have had to make certain judgements about complex transactions or those involving uncertainty about future events. The critical judgements made in the Statement of Accounts are:
• There is a high degree of uncertainty about future levels of funding for local government. However, we have determined that this uncertainty is not yet sufficient to provide an indication that our assets might be impaired as a result of a need to close facilities and reduce levels of service provision;
• We consider voluntary controlled, voluntary aided and foundation schools contribute alongside maintained schools, to meeting our service objectives both now and in the future and that therefore their expenditure, income and the assets they use in the provision of services should form part of our accounts. In accordance with the Code we include them in our single entity accounts, and we do not have to prepare separate group accounts. Details of the value and number of each type of school included in our accounts are shown at note 9;
• When a school that is held on our Balance Sheet transfers to academy status we account for this as a disposal for nil consideration on the date that the school converts to academy status rather than as an impairment on the date that approval to transfer to Academy status is agreed.
• Details of our relationships with other companies and investments in companies are detailed in note 40. These are not material and we have not prepared group accounts on this basis.
• When we become aware of an expected credit loss our accounting policies require that, if material, we charge this to the CIES in the year. Our judgement, based on the advice of our external experts, is that there is no material expected credit loss at 31 March 2020 and therefore no impairment charge to the CIES has been made.
Note 28: Dedicated Schools Grant Our spending on schools is funded primarily by a grant provided by the Education and Skills Funding Agency, the Dedicated Schools Grant (DSG). DSG is ring fenced and can only be applied to meet expenditure properly included in the Schools Budget as defined in the School Finance and Early Years (England) Regulations 2017. The Schools Budget includes elements for a range of educational services provided on an authority-wide basis and for the Individual Schools Budget, which is divided into a budget share for each maintained school. Central spending includes other funding allocated as school specific contingencies and nominally held funds and allocations by the School Forum. The DSG figure is as confirmed by the Department for Education in March 2020. We confirm that the DSG receivable in 2019/20 was £224.6 million (made under section 14 of the Education Act 2002). It has been fully distributed to support schools' budgets, as set out in the regulations made under sections 45A, 45AA, 47, 47ZA, 47A, 48, 49 and 138(7) of, and paragraph 2(B) of schedule 14 to, the Schools Standards and Framework Act 1998 and section 24(3) of the Education Act 2002.

Section B - Page 54
New provisions, which come into force on 1 April 2020, under the Schools and Early Years Finance (England) Regulations 2020, mean that local authorities will be required to carry forward overspends of DSG to their schools’ budgets either in the year immediately following or the year after. Under Regulation 8, paragraphs (7) and (8) this also applies to a deficit from the previous year i.e. 2019/20, thus creating a comparable position to the statutory funding basis for the 2020/21 financial year. The overall deficit below has been shown as an overdrawn earmarked reserve in Note 7 of the accounts. Any future funding from a local authority to make good any deficit from its General Reserves can only be made upon approval from the Secretary of State. This reflects the statutory requirement that a deficit must be carried forward to be funded from future DSG income, unless the Secretary of State authorise the local authority not to do so. Furthermore, the DSG deficit has to allocated between service categories so that a deficit from one service category cannot be offset against a surplus from another. The early years DSG is based on data from earlier years. The final allocation will be determined and received during 2020/21 and will be shown in the table as an in-year adjustment. The £1.0m in-year adjustment shown in the table is £0.8m relating to the final in-year adjustment for 2018/19 and £0.2m estimated to be received as the additional final early years DSG for 2019/20. The deficit on the high needs DSG is £5.2m at the end of the 2019/20 financial year. This will be recovered through future funding growth and our recovery plan aimed at influencing the increasing level of demand in the high needs system and the push towards specialist placements.

Section B - Page 55
Details of the deployment of DSG receivable for 2019/20 across the different DSG blocks are shown below.
2018/19
Total
Schools
Block
Early Years
Block
High Needs
Block
Central
BlockTOTAL
Schools
Block
Early Years
Block
High Needs
Block
Central
BlockTOTAL Total
£ m £ m £ m £ m £ m £ m £ m £ m £ m £ m £ m £ m
403.4 Final DSG for the year before Academy recoupment 2.5 9.1 45.2 4.4 61.1 324.8 23.5 17.8 0.0 366.1 427.2
-172.0 Less Academy recouped for the year 0.0 0.0 0.0 0.0 0.0 -191.3 0.0 -12.4 0.0 -203.7 -203.7
231.4
Total DSG after Academy recoupment for the year and
agreed initial budget distribution in the year. 2.5 9.1 45.2 4.4 61.1 133.6 23.5 5.4 0.0 162.5 223.6
0.9 Plus DSG brought forward from the previous year 0.0 0.0 0.0 0.0 0.3 0.0 0.0 0.0 0.0 -0.3 0.0
0.0 Less DSG Carry forward to next year agreed in advance 0.0 0.0 0.0 0.0 0.0 0.0 0.0 0.0 0.0 0.0 0.0
232.3 Agreed initial budgeted distribution in the year 2.5 9.1 45.2 4.4 61.5 133.6 23.5 5.4 0.0 162.1 223.6
-1.3 In year Adjustments 0.0 0.0 0.0 0.0 0.0 0.0 1.0 0.0 0.0 1.0 1.0
231.1 Final budgeted DSG distribution for the year 2.5 9.1 45.2 4.4 61.5 133.6 24.5 5.4 0.0 163.1 224.6
-55.8 Actual central spending for the year -2.1 -1.6 -52.4 -4.2 -60.2 0.0 0.0 0.0 0.0 0.0 -60.2
-177.5 Actual ISB deployed to schools 0.0 0.0 0.0 0.0 0.0 -133.8 -30.2 -5.5 0.0 -169.4 -169.4
2.1 Our contribution in the year 0.0 0.0 2.1 0.0 2.1 0.0 0.0 0.0 0.0 0.0 2.1
0.0 Under/Over(-) spend for the year (carried forward) 0.4 7.5 -5.1 0.3 3.4 -0.2 -5.7 -0.1 0.0 -6.3 -2.9
Individual schools budget (ISB)
2019/20
Central Spending
Section B - Page 56
Note 29: Events after the Balance Sheet date As a result of the Government’s White Paper ‘The Importance of Teaching’, which allows Schools to opt out of local government control by becoming academies, two Warwickshire schools chose to take up the new academy status in 2019/20 and a further 6 Warwickshire schools are anticipated to also convert to academy status in 2020/21 and beyond. The significance of the conversion of these schools to academy is that the value of the land, buildings and any vehicles, plant and equipment will be removed from our Balance Sheet at the date of conversion. The value of the derecognition of the current schools looking to convert to academy status after 31 March 2020 will be in the region of £34.3 million. Coronavirus Pandemic In March 2020 it was announced that coronavirus was a global pandemic. This was swiftly followed by Government instituting a lockdown on 23 March 2020. As a result, the Council’s staff and services changed overnight. Core services continue to be delivered with staff primarily working from home. Some functions, such as libraries, are restricting their services due to social distancing rules, a small number of internal support services have been paused to free up resources to the Covid-19 response efforts and a number of income generating schemes and investments paused. The financial position of the Council/Local Government has changed significantly. In the longer term there is likely to be a further squeeze on public spending and there are anticipated risks around tax bases for business rates and Council Tax; increased costs for services we purchase, especially in the care sector, and the impacts of the delays to delivery of internal efficiency and development savings. Although the Government has announced, and continues to announce, financial support packages these are unlikely to be sufficient to cover all of the expected Covid-related pressures. Despite this uncertain position, the Council is considering strategies for managing these potential pressures including the implementation of further savings and investing in recovery, utilising reserves to pump-prime the activity. However, due to the level of uncertainty concerning the virus, and the absence of a firm future funding commitments from Government it is not possible to make a reliable estimate of the impact this may have on the Council at this time.
Note 30: External audit costs We have incurred costs of £0.097 million (£0.073 million in 2018/19) in the year in relation to the audit of the Statement of Accounts and £0.006 million (£0.049 million in 2018/19 (restated)) in respect of certification of grant claims and other services provided by our external auditors.
Note 31: Leases Authority as lessee
• Finance leases We have acquired some equipment under finance leases. The assets acquired under these leases are carried as property, plant and equipment in the Balance Sheet. These amounts are not material to the financial statements.
• Operating leases We have acquired a number of buildings, vehicles and items of equipment by entering into operating leases. These amounts are not material to the financial statements.
Authority as lessor
• Finance leases We do not have any finance leases as lessor.
• Operating leases We lease out property under operating leases for the following purposes:

Section B - Page 57
• For the provision of community services, such as community centres, homes for the elderly and disabled nurseries;
• For economic development purposes to provide accommodation for local businesses;
• For the support of rural businesses to support smallholdings and farming; and
• To individuals for personal and business use. The future minimum lease payments receivable under non-cancellable leases in future years are:
31 March 2019
£ m
Operating lease period 31 March 2020
£ m
1.6 Not later than 1 year 1.5
4.3 Later than 1 year and not later than 5 years 3.9
10.8 Later than 5 years 10.3
16.7 Total 15.7
The minimum lease payments receivable do not include rents that are contingent on events taking place after the lease was entered into, such as adjustments following rent reviews. The contingent rent is not material to the financial statements.
Note 32: Contingent assets We currently have no contingent assets.
Note 33: Contingent liabilities A further legal ruling relating to Firefighter Additional Duties received in April 2019 charges Fire Authorities to ensure all allowances related to any regular additional duty are treated as pensionable. The appropriate changes have been made to the payroll system but backpay will be due once further advice is received concerning how far back we are required to consider recompense for. Until this advice is available, we are unable to calculate an appropriate provision amount, but our view is that for Warwickshire FRS this only relates to Training Allowance which is only paid to a small number of individuals and therefore should not be a material amount.
Note 34: Members’ allowances Elected members were paid a total of £0.802 million (£0.790 million in 2018/19) in allowances and expenses. In addition, we paid independent and co-opted members allowances and expenses of £0.014 million (£0.020 million in 2018/19). No single member was paid more than £50,000 during the year. Further details of allowances and expenses payments made to Elected Members in 2019/20 are available on our website https://www.warwickshire.gov.uk. Payments to Elected Members include expenses for the Police and Crime Panel which are reimbursed by the Home Office.
Note 35: Nature and extent of risk arising from financial instruments Our activities expose us to a variety of financial risks:
• Credit risk – the possibility that other parties might fail to pay amounts due to us;
• Liquidity risk – the possibility that we might not have funds available to meet our commitments to make payments; and
• Market risk – the possibility that financial loss might arise as a result of changes in such measures as interest rates and stock market movements.

Section B - Page 58
Our overall financial risk management programme focuses on the unpredictability of financial markets and seeks to minimise potential adverse effects on the resources available to fund services. Financial risk management is carried out by a central treasury management team, under policies approved by the Council annually in the Treasury Management Strategy, available via https://www.warwickshire.gov.uk. We have written policies covering specific areas, such as interest rate risk, credit risk and the investment of surplus cash. Credit risk Credit risk arises from deposits with banks and financial institutions, as well as credit exposures to our customers. Our Accounting Policies note describes our overall approach to evaluating impairments to be reflected in the carrying value of our financial assets. Many of the invoices we raise are the result of statutory obligations. However, where we are providing non statutory goods or services to customers, we consider their ability to pay. A number of checks are available to managers as outlined in our Corporate Debt Recovery Policy. Our current debtors, including trade debtors, are assessed at each year end for impairment. This is assessed using aged debt analysis and past experience of bad debt profiles. The change in the bad debt provision during the year and any amounts found to be irrecoverable are charged against services in the Net Cost of Services in the CIES. The amount of our bad debt provision is shown in Note 14. We have assessed our potential maximum exposure to credit risk, based on experience of default and collectability over the last five financial years. This has been adjusted to reflect current market conditions. However, there is no effect as there is no instance of institutions that meet our credit ratings defaulting in the last five years. Deposits are not made with banks and financial institutions unless they are rated independently with a minimum score as laid out in the Treasury Management Strategy. Liquidity risk As we have ready access to borrowings from the Public Works Loan Board, there is no significant risk that we will be unable to raise finance to meet our future commitments under financial instruments. Instead the risk is that we will be bound to replenish a significant proportion of our borrowings at a time of unfavourable interest rates. To mitigate this, our strategy is to ensure that not more than 20% of loans are due to mature within any rolling three-year period. The maturity analysis of financial liabilities is as follows:
2018/19 Loans we have not yet repaid 2019/20
£ m £ m
We owe money to:
351.4 ~ Public Works Loans Board 341.4
8.5 ~ Public Works Loans Board - Accrued Interest 0.0
359.9 Total 341.4
When we will pay the money back:
18.5 Less than 1 year 20.0
20.0 Between 1 and 2 years 0.0
0.0 Between 2 and 5 years 0.0
0.0 Between 5 and 10 years 18.0
321.4 More than 10 years 303.4
359.9 Total 341.4 Our level of borrowing is due to paying for capital spending in previous years. We have not borrowed any money from external sources in 2019/20 to pay for new capital spending. We use cash reserves which we have set aside to support future years’ revenue budgets to invest in the short term. We have included these as short-term investments on the Balance Sheet.

Section B - Page 59
All trade and other payables are due to be paid in less than one year. Market risk Interest Rate Risk We are exposed to significant risk in terms of our exposure to interest rate movements on our borrowings and investments. Movements in interest rates have a complex impact. For instance, a rise in interest rates would have the following effects:
• Borrowings at variable rates – the interest expense charged to the Comprehensive Income and Expenditure Statement will rise;
• Borrowings at fixed rates – the fair value of the borrowings will fall;
• Investments at variable rates – the interest income credited to the Comprehensive Income and Expenditure Statement will rise; and
• Investments at fixed rates – the fair value of the assets will fall. As part of our strategy for managing interest rate risk we aim to keep a maximum of 25% of our borrowing in variable rate loans. We have an active strategy for assessing interest rates exposure that allows for any adverse changes to be incorporated into the budget on a quarterly basis. According to this assessment strategy, at 31 March 2019, if interest rates had been 1% higher with all other variables held constant, the financial effect would be:
• No change in the fair value of fixed rate investment assets; and
• A decrease in fair value of fixed borrowing of £79.9 million (£82.1 million in 2018/19). Changes in interest payable and receivable on variable rate borrowings and investments will be posted to the Comprehensive Income and Expenditure Statement and affect the General Fund. Movements in the fair value of fixed rate investments will be reflected in the Comprehensive Income and Expenditure Statement. Price risk We have some shareholdings in specific interests and we are not in a position to diversify our portfolio. The current value of the shareholding is £2.0 million. For these equity instrument holdings, we have irrevocably elected to recognise any movements in price as gains and losses recognised in Other Comprehensive Income in the CIES. In 2019/20 this amounted to a gain of £0.046 million. They will not be credited or charged to the General Fund until such times as they are either impaired, sold or derecognised. We also have some investments held as Fair Value through Profit and Loss. All profits and losses on sales and impairments as well as in-year valuation movements on these assets must be recognised immediately in the CIES. We have not disposed of any of these holdings this year. At 31 March 2020 we recognised a total net loss of £1.1 million in the CIES. One of these investments has been classified as a pooled investment vehicle which allows us to apply a statutory override which means that any changes in fair value do not hit the General Fund but are reversed in the Movement in Reserves Statement and placed in the unusable Financial Instruments Revaluation Reserve until the investment is either sold or de-recognised. The other is not classed as a pooled investment vehicle so the statutory override does not apply and changes in fair value are reflected in the General Fund in the year. Treasury management We comply with CIPFA’s Treasury Management in Public Services Code of Practice and the Ministry for Housing, Communities and Local Government guidance on local government investments issued in March 2004. An updated version of the latter was released in February 2018 to apply to accounting periods from 1 April 2018 onwards. We aim to achieve the optimum return on our investments commensurate with proper levels of security and liquidity. The borrowing of monies purely to invest and make a return is unlawful and we do not engage in such activity. Our external fund managers comply with the Annual Investment Strategy, approved by Elected Members on an annual basis. The agreement between us and the fund managers additionally stipulates additional guidelines and limits in order to manage risk.

Section B - Page 60
Note 36: Officers’ remuneration and termination benefits
We are required to show the number of our staff who are paid more than £50,000 a year. This is shown in the table below. Pay includes salary, redundancy, taxable travel and other taxable costs. These figures do not include employer’s pension contribution and exclude remuneration for senior staff who are shown separately.
Remuneration Band
Number Number Left Number Number Left
of Staff in the Year of Staff in the Year
128 2 £50,000 - £54,999 138 0
73 1 £55,000 - £59,999 78 1
72 1 £60,000 - £64,999 71 3
40 3 £65,000 - £69,999 39 3
24 2 £70,000 - £74,999 27 2
21 2 £75,000 - £79,999 19 3
5 2 £80,000 - £84,999 14 3
2 0 £85,000 - £89,999 4 1
1 1 £90,000 - £94,999 4 1
5 0 £95,000 - £99,999 6 2
1 0 £100,000 - £104,999 2 0
2 1 £105,000 - £109,999 1 0
0 0 £110,000 - £114,999 1 1
1 0 £115,000 - £119,999 2 1
2 1 £120,000 - £124,999 0 0
0 0 £125,000 - £129,999 0 0
0 0 £130,000 - £134,999 0 0
1 1 £165,000 - £169,999 0 0
1 1 £170,000 - £174,999 0 0
379 18 406 21
2018/19 2019/20
We are required to disclose the remuneration of senior employees, as defined by regulation, by post for salaries under £150,000 and by name for those whose salary is over £150,000. Remuneration for senior staff includes the employer’s contribution to the appropriate pension fund.

Section B - Page 61
Post holder information (post title and
name)
Sa
lari
es
(in
clu
din
g
fee
s a
nd
All
ow
an
ce
s)
Ta
xa
ble
Ex
pe
ns
e
All
ow
an
ce
s
Co
mp
en
sa
tio
n f
or
los
s o
f o
ffic
e
Be
ne
fits
in
Kin
d
To
tal
ex
clu
din
g
pe
ns
ion
co
ntr
ibu
tio
ns
Em
plo
ye
r's
Pe
ns
ion
Co
ntr
ibu
tio
ns
To
tal
inc
lud
ing
pe
ns
ion
co
ntr
ibu
tio
ns
£ £ £ £ £ £ £
N/A - Note 1 2018/19
Chief Executive - Monica Fogarty (Head of Paid
Service) 2019/20 179,500 179,500 35,002 214,502
Joint Managing Director, Communities - Monica
Fogarty 2018/19 166,876 967 167,843 32,541 200,384
N/A - Note 1 2019/20
Joint Managing Director, Resources - David
Carter (Head of Paid Service) 2018/19 166,050 166,050 32,380 198,430
N/A - Note 1 2019/20
N/A - Note 2 2018/19 0 0
Strategic Director for Resources (Section 151
Officer) 2019/20 135,644 135,644 26,451 162,095
Assistant Director Finance (Section 151 Officer) 2018/19 92,854 0 0 92,854 18,106 110,960
N/a - Note 2 2019/20 0 0 0 0
Strategic Director, People Group 2018/19 134,284 134,284 26,185 160,469
Note 3 2019/20 139,250 139,250 27,154 166,404
Strategic Director, Communities Group 2018/19 22,007 0 0 22,007 4,291 26,298
Note 4 2019/20 132,038 0 132,038 25,747 157,785
Chief Fire Officer 2018/19 127,415 0 0 127,415 23,712 151,127
Note 5 2019/20 133,532 0 0 133,532 36,200 169,732
Assistant Director - People (Head of Public
Health - Dr John Linnane) 2018/19 164,702 271 0 164,973 23,167 188,140
N/A - Note 6 2019/20 0 0 0 0 0
Assistant Director Children & Families (Chief
Education Officer) - Note 7 2018/19 59,938 0 0 59,938 11,688 71,626
Assistant Director Education Services (Chief
Education Officer) - Note 7 2019/20 108,273 0 0 108,273 21,113 129,386
Assistant Director Governance and Policy
(Monitoring Officer) 2018/19 110,434 0 0 110,434 21,535 131,969
2019/20 111,555 0 0 111,555 21,753 133,308
Total 2018/19 1,044,560 1,238 0 0 1,045,798 193,605 1,239,403
Total 2019/20 939,792 0 0 0 939,792 193,420 1,133,212
Note 1: The Chief Executive (Head of Paid Services) was appointed from 1 April 2019. Previously this the post was
held by the Managing Director, Resources. On 31 March 2019 both Joint Managing Director roles ceased. Note 2: The Section 151 role passed to the Strategic Director for Resources from 1 April 2019. Previously the role
was held by the Assistant Director for Finance who left on 31 January 2019. Their annualised salary was £111,555. The role was covered by an Interim from 1 February 2019 and paid via an agency. Payments for the period 1 February 2019 to 31 March 2019 were £39,960.
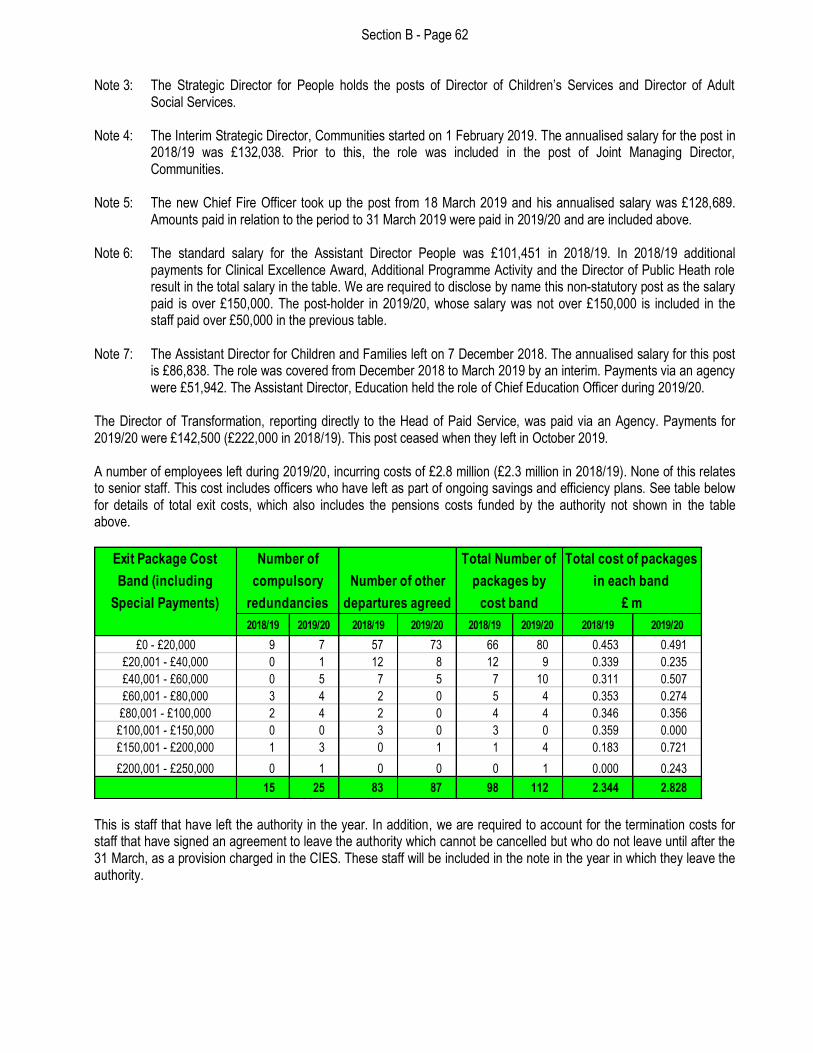
Section B - Page 62
Note 3: The Strategic Director for People holds the posts of Director of Children’s Services and Director of Adult Social Services.
Note 4: The Interim Strategic Director, Communities started on 1 February 2019. The annualised salary for the post in
2018/19 was £132,038. Prior to this, the role was included in the post of Joint Managing Director, Communities.
Note 5: The new Chief Fire Officer took up the post from 18 March 2019 and his annualised salary was £128,689.
Amounts paid in relation to the period to 31 March 2019 were paid in 2019/20 and are included above. Note 6: The standard salary for the Assistant Director People was £101,451 in 2018/19. In 2018/19 additional
payments for Clinical Excellence Award, Additional Programme Activity and the Director of Public Heath role result in the total salary in the table. We are required to disclose by name this non-statutory post as the salary paid is over £150,000. The post-holder in 2019/20, whose salary was not over £150,000 is included in the staff paid over £50,000 in the previous table.
Note 7: The Assistant Director for Children and Families left on 7 December 2018. The annualised salary for this post
is £86,838. The role was covered from December 2018 to March 2019 by an interim. Payments via an agency were £51,942. The Assistant Director, Education held the role of Chief Education Officer during 2019/20.
The Director of Transformation, reporting directly to the Head of Paid Service, was paid via an Agency. Payments for 2019/20 were £142,500 (£222,000 in 2018/19). This post ceased when they left in October 2019. A number of employees left during 2019/20, incurring costs of £2.8 million (£2.3 million in 2018/19). None of this relates to senior staff. This cost includes officers who have left as part of ongoing savings and efficiency plans. See table below for details of total exit costs, which also includes the pensions costs funded by the authority not shown in the table above.
Exit Package Cost
Band (including
Special Payments)
2018/19 2019/20 2018/19 2019/20 2018/19 2019/20 2018/19 2019/20
£0 - £20,000 9 7 57 73 66 80 0.453 0.491
£20,001 - £40,000 0 1 12 8 12 9 0.339 0.235
£40,001 - £60,000 0 5 7 5 7 10 0.311 0.507
£60,001 - £80,000 3 4 2 0 5 4 0.353 0.274
£80,001 - £100,000 2 4 2 0 4 4 0.346 0.356
£100,001 - £150,000 0 0 3 0 3 0 0.359 0.000
£150,001 - £200,000 1 3 0 1 1 4 0.183 0.721
£200,001 - £250,000 0 1 0 0 0 1 0.000 0.243
15 25 83 87 98 112 2.344 2.828
Number of
compulsory
redundancies
Number of other
departures agreed
Total Number of
packages by
cost band
Total cost of packages
in each band
£ m
This is staff that have left the authority in the year. In addition, we are required to account for the termination costs for staff that have signed an agreement to leave the authority which cannot be cancelled but who do not leave until after the 31 March, as a provision charged in the CIES. These staff will be included in the note in the year in which they leave the authority.

Section B - Page 63
Note 37: Pension schemes As part of the terms and conditions of employment, we offer retirement benefits. Although these benefits will not actually be payable until employees retire, the authority has a commitment to make payments that need to be disclosed at the time that employees earn their future entitlement. Pension Schemes operated by the Council Teachers We operate a pension scheme for our teaching staff, under the Superannuation Act 1972. The scheme provides teachers with a defined benefit when they retire. The Teachers' Pensions Agency manages the scheme under the Teachers’ Pensions Regulations 1997, as amended. The Government sets teachers' and employers' contribution rates on the basis of an assumed fund. The scheme has a large number of participating employers and so we are not able to identify our share of the underlying financial position and performance of the scheme with sufficient reliability for accounting purposes. For the purposes of our Statement of Accounts, the scheme is therefore accounted for on the same basis as a defined contribution scheme. We may be required to make two kinds of contributions to the scheme – ‘normal’ and ‘supplementary’. The normal contribution is the percentage of a newly recruited teacher's salary that is needed to meet the cost of the pension liability. We would pay a supplementary contribution if the Government found that future liabilities would not be met by the normal contributions. A supplementary contribution is not needed at present. Our total employer’s contribution cost was £14.7 million in 2019/20 (£12.2 million in 2018/19). We are also responsible for paying any extra added years of benefits and early retirement costs to pensioners. These extra costs are classed as defined benefits. As a result, in our accounts we show the extra cost of pensions decisions we made in the current year, no matter when we will actually pay these financial costs. There is no fund for these discretionary benefits and so there are no assets. In 2019/20 the payments relating to added pensionable years came to £3.2 million (£3.2 million in 2018/19). We made no payments relating to early retirement in 2019/20 or 2018/19. Firefighters There is a defined benefit pension scheme for our firefighters, under the Superannuation Act 1972. The Firefighters’ Pension Scheme in England is an unfunded scheme where we promise to provide employees with benefits under the scheme but make no advance funding in the scheme for those benefits. Benefits are paid directly when they become due. We pay an employer’s pension contribution, based on a percentage of pay, into the pension fund. The pension fund will be balanced to nil at the end of the year by either paying over to the government any excess, or by receiving cash in the form of pension top-up grant. This grant is paid to the Firefighters’ Pension Fund and not the County Council. The Government sets the employees’ and employer’s contribution rates by regulation. In 2019/20, pension payments totalled £6.8 million (£6.4 million in 2018/19). Costs relating to early retirement totalled £2.1 million in 2019/20 (£1.3 million in 2018/19). The estimated employer's contributions for Fire Fighters pension for the period to 31st March 2021 will be approximately £2.6 million. Firefighters’ Injury Awards Scheme Firefighters’ injury awards are financed from our revenue account. An ongoing liability to pay injury awards is included in our Balance Sheet. This liability is subject to the same actuarial assumptions as the main firefighters' scheme, though it is not a separate pension scheme as there is a benefit paid whether the recipient of the injury award is a member of the scheme or not. However, the liability forms part of our overall pensions' liability.

Section B - Page 64
National Health Service During 2013/14 some NHS staff transferred to us. These staff have maintained their membership in the NHS Pension Scheme. The scheme provides these staff with specified benefits upon their retirement and we contribute towards the costs by making contributions based on a percentage of members’ pensionable salaries. The scheme is an unfunded defined benefit scheme. However, we are not able to identify our share of the underlying financial position and performance of the Scheme with sufficient reliability for accounting purposes. For the purposes of this Statement of Accounts it is therefore accounted for on the same basis as a defined contribution scheme. In 2019/20 we paid £0.098 million (£0.164 million in 2018/19) to the NHS Pension Scheme in respect of former NHS staff retirement benefits, including employees’ contributions. Local Government Pension Scheme – all other Council employees We operate a funded, defined benefit pension scheme for staff, under the Local Government Pensions Scheme Regulations 2013. We manage the scheme for ourselves, the five district councils and a number of other organisations. We prepare the accounts, but they are separate from our financial statements. The Council and employees pay contributions into the fund calculated at a level intended to balance pension liabilities with investment assets. An actuarial valuation is carried out every three years to assess the difference between the fund’s projected assets and liabilities and the amount employers will have to contribute for the next three years. The valuation on 31 March 2019 set the rates for 2020/21, 2021/22 and 2022/23. In the valuation carried out as at 31 March 2016 the funding level increased from 77% to 82%. As a result, the employer’s rate is expected to increase by 0.75% per annum until 2019/20. In 2019/20, we made normal employer’s contributions totalling £26.6 million (£26.0 million in 2018/19). We are also responsible for all pension payments relating to benefits we have awarded for added years, together with related increases. In 2019/20, these came to £2.8 million (£1.7 million in 2018/19). The estimated employer's contribution for the period to 31st March 2021 is £28.3 million. The value of our LGPS assets at 31 March 2020 is based on the market value at 31 December 2019. The actuary has made an assumption about the movement in the investment market to arrive at the valuation at the Balance Sheet date. There were re-measurements as a result of a difference between expected and actual returns on assets which amounted to 0.25% of the value of assets at 31 March 2020. The movement in our LGPS assets in the year is as shown below:
31 March 2019
£ m Change in Fair Value of WCC Share of LGPS Assets
31 March 2020
£ m
1,047.4 Fair value of assets at the beginning of the year 1,117.0
-2.8 Effect of settlements 0.0
28.2 Interest Income on plan assets 26.8
46.7 Remeasurements on assets -118.3
28.1 Employers' contributions (including receipts covering early retirements) 30.4
8.5 Member contributions 8.7
-39.0 Benefits/transfers paid -45.4
1,117.0 Fair value of assets at the end of the year 1,019.2

Section B - Page 65
A breakdown of the nature of those assets is as follows:
Quoted prices in
Quoted prices
not in Quoted prices in
Quoted prices
not in
active markets active markets active markets active markets
£ m £ m £ m £ m
Equity securities:
53.8 0.0 Consumer 0.0 0.0
22.2 0.0 Manufacturing 0.0 0.0
1.3 0.0 Energy and utilities 0.0 0.0
24.4 0.0 Financial institutions 0.0 0.0
26.5 0.0 Health and care 0.0 0.0
27.4 0.0 Information technology 0.0 0.0
34.8 0.0 Other 0.0 0.0
Debt Securites:
0.0 31.8 Other 0.0 32.4
Private equity:
0.0 56.9 All 0.0 48.8
Real estate:
121.9 0.0 UK property 99.6 0.0
0.2 0.0 Overseas property 0.1 0.0
Investment funds and unit trusts:
420.8 0.0 Equities 584.2 0.0
183.9 0.0 Bonds 156.6 0.0
0.0 0.0 Hedge funds 0.0 0.0
0.0 25.8 Infrastructure 0.0 26.8
69.4 0.0 Other 56.5 0.0
15.8 0.0 Cash and cash equivalents 14.2 0.0
1,002.5 114.5 Totals 911.2 108.0
LGPS Assets
31 March 2019 31 March 2020
The expected return on scheme assets does not affect the Balance Sheet position as at 31 March 2020 but will affect the reported pension cost for the following year. It is based on market expectations at the beginning of the financial period for returns over the life of the obligation. This requires the consideration of the composition of the Scheme’s assets and the potential returns of different asset classes. The assumption used is the average of the assumptions appropriate to the individual asset classes weighted by the proportion of the assets in the particular asset class. The Impact of Pensions in our Accounts We show the cost of retirements benefits in ‘Money spent on services’ in the Comprehensive Income and Expenditure Statement when employees earn them. We have made adjustments in the Movement in Reserves Statement so that the charge made against the council tax reflects the actual cash we have paid relating to the year.

Section B - Page 66
Pension scheme accounting
LGPS Teachers
Fire
fighters
Fire fighter
Injury Total LGPS Teachers
Fire
fighters
Fire fighter
Injury Total
£m £m £m £m £m £m £m £m £m £m
Spending:
52.0 0.0 4.3 0.5 56.8 Current service cost 62.1 0.0 4.2 0.5 66.8
0.2 0.0 11.0 0.0 11.2 Past service cost and curtailments 0.8 0.0 0.0 0.0 0.8
-2.6 0.0 0.0 0.0 -2.6 Effects of Settlement 0.0 0.0 0.0 0.0 0.0
40.5 1.2 7.3 0.7 49.7 Interest cost 40.7 1.2 6.8 0.6 49.3
-28.2 0.0 0.0 0.0 -28.2 Interest income on plan assets -26.8 0.0 0.0 0.0 -26.8
62.0 1.2 22.6 1.2 87.0 Net charge to CIES 76.7 1.2 11.0 1.1 90.0
Contribution from Pensions Reserve:
-116.0 -4.0 -16.1 -1.7 -137.8 Movement on the Pensions Reserve 76.0 6.7 26.7 2.8 112.2
82.2 6.2 -0.5 1.0 88.8 Re-measurements recognised in CIES -122.3 -4.6 -30.6 -3.2 -160.7
n/a n/a -5.4 n/a -5.4 Funded by Government top up grant n/a n/a -5.1 n/a -5.1
-33.8 2.2 -22.0 -0.7 -54.4 Contribution (from) Pensions Reserve -46.3 2.1 -9.0 -0.4 -53.6
Actual amount charged against council tax:
28.1 n/a 1.3 n/a 29.4 Employer's contributions & ill-health contributions 30.4 n/a 2.6 n/a 33.0
28.1 n/a 1.3 n/a 29.4 Amount charged against council tax 30.4 0.0 2.6 0.0 33.0
Amount funded by government top up grant
n/a n/a 7.1 n/a 7.1
Retirement benefits paid and due to be paid to
pensioners and transfers out n/a n/a 8.2 n/a 8.2
n/a n/a -0.6 n/a -0.6
Retirement Benefits paid directly by Government Top Up
Grant n/a n/a -0.7 n/a -0.7
n/a n/a -1.1 n/a -1.1 Employee contributions n/a n/a -1.1 n/a -1.1
n/a n/a -1.3 n/a -1.3 Employer's contributions & ill-health contributions n/a n/a -2.6 n/a -2.6
n/a n/a 4.1 n/a 4.1 Government top up grant receivable 0.0 0.0 3.8 0.0 3.8
Movement in Reserves Statement
-61.9 -1.2 -30.4 -1.2 -94.7 Reversal of net charges made for retirement benefits -76.7 -1.2 -19.8 -1.1 -98.8
28.1 n/a 1.3 n/a 29.4 Employer's contributions & ill-health contributions 30.4 n/a 2.6 n/a 33.0
n/a 3.4 7.1 0.5 11.0
Retirement benefits paid or due to be paid to pensioners
and transfers out n/a 3.3 8.2 0.7 12.2
-33.8 2.1 -22.0 -0.7 -54.3 Movement in Reserves Statement -46.3 2.1 -9.0 -0.4 -53.6
31 March 2019 31 March 2020

Section B - Page 67
The key assumptions used by our actuary to determine valuations are as laid out in the table below:
Pension scheme assumptions
LGPS Teachers Firefighters
Firefighter
Injury Award LGPS Teachers
New
Firefighters
Firefighter
and Injury
Award
Financial assumptions:
2.5% 2.5% 2.5% 2.5% Rate of Inflation CPI 1.9% 1.9% 1.9% 1.9%
3.1% 3.1% 3.5% 3.5% Salary Increase 2.7% 2.7% 2.8% 2.8%
2.5% 2.5% 2.5% 2.5% Pensions increases 1.9% 1.9% 1.9% 1.9%
2.4% 2.4% 2.4% 2.4% Rate of discount 2.3% 2.3% 2.3% 2.3%
Life expectancy assumptions:
22.5 (24.7) 22.5 (24.7) 27.3 (29.4) 27.3 (29.4) A male (female) current pensioner aged 65 21.6 (23.8) 21.6 (23.8) 26.4 (28.5) 26.4 (28.5)
24.3 (26.7) 24.3 (26.7) 28.4 (30.6) 28.4 (30.6) A male (female) future pensioner aged 65 in 20 years 22.5 (25.4) 22.5 (25.4) 27.5 (29.7) 27.5 (29.7)
Commutation of pension for lump sum at
retirement:
75.0% n/a 90.0% 90.0% ~ Taking maximum cash 75.0% n/a 90.0% 90.0%
50.0% n/a n/a n/a ~ Taking 3/80th cash 50.0% n/a n/a n/a
31 March 202031 March 2019
The sensitivity regarding the principal assumptions used to measure the LGPS scheme liabilities are set out below.
Change in assumptions as at 31 March 2020 Approximate increase to Employer Liability Approximate monetary amount
% £ m
0.5% decrease in real discount rate 10% 145.6
1 year increase in member life expectancy 3% 45.2
0.5% increase in the salary increase rate 1% 13.8
0.5% increase in the pension increase rate 9% 130.5

Section B - Page 68
The liabilities associated with each scheme are as shown in the table below:
LGPS Teachers Firefighters
Firefighter
Injury
Award LGPS Teachers Firefighters
Firefighter
Injury
Award
£m £m £m £m £m £m £m £m
1,494.4 47.4 267.2 25.4 Benefit obligation at the beginning of the year 1,680.0 51.4 283.3 27.1
52.0 0.0 4.3 0.5 Current service costs 62.1 0.0 4.2 0.5
-5.5 0.0 0.0 0.0 Effect of Settlements 0.0 0.0 0.0 0.0
40.5 1.2 7.3 0.7 Interest on pensions liabilities 40.7 1.2 6.8 0.6
8.5 0.0 1.1 0.0 Member contributions 8.7 0.0 1.1 0.0
0.2 0.0 11.0 0.0 Past service costs 0.8 0.0 0.0 0.0
0.0 0.0 0.0 0.0 Curtailments 0.0 0.0 0.0 0.0
-39.0 -3.4 -7.1 -0.5 Benefits/transfers paid -45.5 -3.3 -8.2 -0.7
128.8 6.2 -0.5 1.0 Remeasurements on liabilities -240.6 -4.6 -30.6 -3.2
0.0 0.0 0.0 0.0 Changes in assumptions 0.0 0.0 0.0 0.0
0.0 0.0 0.0 0.0 Liabilities extinguished 0.0 0.0 0.0 0.0
1,680.0 51.4 283.3 27.1 Present value of liabilities at the end of the year 1,506.2 44.7 256.6 24.3
31 March 2019 31 March 2020
Change in present value of pension scheme liabilities
during the year

Section B - Page 69
This leaves each scheme with a net liability as shown below:
LGPS Teachers
Fire
fighters
Fire
fighter
Injury
Award Total
Pension assets and liabilities recognised in the
Balance Sheet
LGPS Teachers
Fire
fighters
Fire
fighter
Injury
Award Total
£m £m £m £m £m £m £m £m £m £m
1,680.0 51.4 283.3 27.1 2,041.8 Present value of the defined benefit oblicgation 1,506.2 44.7 256.6 24.3 1,831.8
1,117.0 0.0 0.0 0.0 1,117.0 Less: Fair value of plan assets 1,019.2 0.0 0.0 0.0 1,019.2
563.0 51.4 283.3 27.1 924.8
Net Liability arising from defined benefit
obligation charge to CIES 487.0 44.7 256.6 24.3 812.6
116.0 4.0 16.1 1.7 137.8
Increase/decrease (-) in net liability from
previous year -76.0 -6.7 -26.7 -2.8 -112.2
31 March 2019 31 March 2020

Section B - Page 70
The liabilities show the underlying commitments that we have in the long run to pay retirement benefits. However, statutory arrangements for funding the deficit mean that our financial position remains healthy:
• LGPS - the deficit will be recovered by increased contributions over the remaining working life of employees, as assessed by the scheme actuary;
• Firefighters Pension Scheme - the deficit is paid by Central Government;
• Teachers’ Pension Scheme - finance is provided by the Teachers Pensions Agency; and
• Firefighters' Injury Awards – these are financed through revenue budgets. The accounts of the Warwickshire Pension Fund include a disclosure note about a material uncertainty in respect of the property funds it holds. Details of these can be found in Note 5 of the Warwickshire Pension Fund Accounts. The Council’s proportion of these funds is approximately 50% which equates to £109 million. Therefore, less certainty can be attached to the valuation of these assets at 31 March 2020.
Note 38: Pooled budgets with health Section 75 of the National Health Service Act 2006 allowed joint-working arrangements between NHS organisations and local authorities. Pooled funds allow these health organisations and local authorities to work together to tackle specific health issues. An important feature of the pool is that the way resources are used will depend on the needs of the clients who meet the conditions set for the pooled budget, rather than the contributions of the partners. Warwickshire County Council is the host authority for the Section 75 Pooled budget arrangement via the Better Care Fund. The strategic aims of the programme are:
• People are helped to remain healthy and independent;
• People are empowered to play an active role in managing their own care and the care they receive; and
• People get the right service at the right time and in the right place – which means services will envelop individuals close to their home.
Agreements for the financial years since 1 April 2015 have been agreed by us and the three Clinical Commissioning Groups (CCGs) in Warwickshire. Annual contributions are agreed by the Better Together Programme Board before the commencement of each financial year thereafter. The agreement sets out the basis of the governance arrangements and reporting requirements to both the Better Together Programme Board and the Health and Wellbeing Board. The total pooled budget arrangement for 2019/20 is £61.6 million (£49.8 million in 2018/19) of which £4.5 million (£4.2 million in 2018/19) is capital funding for Disabled Facilities. Of the revenue element £27.1 million (£22.2 million in 2018/19) is held by the CCGs for them to commission services and of that £3.7 million (£3.9 million in 2018/19 (restated) has been passed back to the authority as part of a separate S75 Integrated Community Equipment Service agreement. A total of £30.0 million (£23.4 million in 2018/19) revenue funding was allocated to the council for commissioning services in accordance with the agreement. The surplus and deficit at the end of the year on the Integrated Community Equipment Service and Better Care Fund Revenue respectively belong to the CCGs. The surplus at the end of the year on Disabled Facilities belongs to the District and Borough Councils of Warwickshire. The S75 agreement for the Commissioning of Mental Health Services was agreed in 2018/19. The pooled resources total £5.4 million (£5.4 million in 2018/19) with any surplus or deficits remaining within the pool, to be allocated by agreement with the Partnership Board. The table below summarises the financial transactions of the pooled budgets.

Section B - Page 71
2018/19
Surplus(-)/
Deficit
Our
contribution
Total pool Total
spend
Surplus(-)/
Deficit
£ m £ m £ m £ m £ m
Better Care Fund Pooled Budget - S75
-0.5 ~ Integrated community equipment service 2.3 5.9 5.7 -0.2
0.5 ~ Better Care Fund - Revenue other 27.7 51.2 51.2 0.0
-1.3 ~ Disabled Facilities Capital Grant 0.0 4.5 3.4 -1.1
-1.3 Total Better Care Fund 30.0 61.6 60.3 -1.3
0.0
Commissioning of Mental Health Services for
Children & Young People 0.9 5.4 5.4 0.0
-1.3 Total 30.9 67.0 65.7 -1.3
Pooled budgets with health 2019/20
Note 39: Coventry and Warwickshire Business Rates Pool The Coventry and Warwickshire Business Rates Pool was created on 1 April 2013 with seven member authorities: Warwickshire County Council, the five District and Borough Councils within Warwickshire and Coventry City Council. Warwickshire County Council is the lead authority for the pool and there is an agreed memorandum of understanding in place that determines how the Pool’s resources are allocated. Under the agreement any surplus generated by the pool, will be shared between pool members. We have accounted for our share of the current surplus in the Comprehensive Income and Expenditure Account and the full pool surplus is held in our reserves until such times as it is distributed (see note 19).
Note 40: Related parties and associated parties Central Government Central Government has effective control over our general duties – it is responsible for providing the legal framework within which we work, provides funding in the form of grants and sets the terms of many of the relationships that we have with other organisations. Details of the grants we receive from government departments are set out in note 23. Details of the balances with central government departments are shown in notes 14 and 16. Pooled budget arrangements with the Department of Health via Clinical Commissioning Groups are disclosed in note 38. Elected Members Elected Members of the council have direct control over our financial and operating policies. The total of Elected Members’ allowances paid in 2019/20 is shown in note 34. During 2019/20 works and services to the value of £29.7 million (£32.3 million in 2018/19) was paid to companies in which elected members had an interest (this includes £14.2 million (£11.5 million in 2018/19) paid to District and Borough Councils in Warwickshire where they are also elected members). Contracts were entered into in full compliance with our contract standing orders. The above figure includes any grants paid to voluntary groups in which elected members had positions on the governing body, including any made to organisations whose senior management included close members of the families of elected members. In all instances, grants were made with proper consideration of declarations of interest. The relevant members did not take part in any discussions or decisions relating to the grants. Details of all these transactions are recorded in the Register of Members’ Interests, open to public inspection at Shire Hall. Details of the Members and the Committees and organisations for which they represent the authority are also available on the authority’s web-site www.warwickshire.gov.uk. Senior Officers During 2019/20 £2.7 million (2018/19 – nil) were made to organisations in which senior officers or members of their families had declared an interest.

Section B - Page 72
A number of senior officers and elected members represent us on the board of related companies (such as Warwick Technology Park Management Limited, Warwick Technology Park Management No 2 Limited, SCAPE Group Limited, and University of Warwick Science Park Innovation Centre Limited). In addition, a number of officers within the authority are directors of our two wholly owned Local Authority Trading Companies. You can see registers of members’ and officers’ interests at Shire Hall, Warwick or at the registered office of the company in question if this is not Shire Hall, Warwick. Other Public Bodies At the end of the year we owed £22.4 million (£20.2 million in 2018/19) to other local authorities, central government and public bodies including £5.2 million (£5.0 million in 2018/19) to Her Majesty’s Revenue and Customs, and they owed us £27.8 million (£25.2 million in 2018/19), including £4.8 million (£3.7 million in 2018/19) from Her Majesty’s Revenue and Customs. We charged the Warwickshire County Council Pension Fund £1.2 million (£0.9 million in 2018/19) for carrying out the administration work for the fund (not including payroll-processing costs). Other Entities We hold shares in the following companies as at 31 March 2020:
Company WCC Share holding Directors
Warwickshire Legal Services Trading Ltd Wholly owned LATC - £1 ordinary share
capital
Two officers appointed as directors
Educaterers Ltd Wholly owned LATC - £1 ordinary share
capital + working capital loan interest at
market rate
Three officers appointed as
directors
University of Warwick Science Park
Innovation Centre Limited
19.9% of ordinary share capital.
1/6 voting rights
£1,502,500 preference shares
One of six directors is appointed by
us
Warwick Technology Park Management
Company Limited
4.8% of called up share capital One officer and one elected
member as directors
Warwick Technology Park Management
Company (No 2) Limited
0.2% of called up Share capital One officer and one elected
member as directors.
Eastern Shire Purchasing Organisation
(ESPO)
n/a Two elected members from each
authority on Management
Committee
ESPO Trading Ltd - also owns 100%
share capital in Eduzone Ltd
16.67% of called up share capital No Directors appointed by WCC
SCAPE Group Limited 16.7% of the called up share capital One of the six directors is
appointed by us
Coventry and Warwickshire Local
Enterprise Partnership Limited
No share capital and liability limited to £1. Two type 'B' (public sector)
directors to be appointed by us
Coventry and Solihull Waste Disposal
Company
10,000 ordinary 'C' shares
I representative on shareholder panel with
1% voting rights and 24% voting rights for
matters relating to WCC SLA agreement
No right to appoint to board of
Directors.
1% proxy vote unless WCC SLA
related.
UK Municipal Bond Agency Plc 120,000 fully paid B shares of £0.01 each
180,000 ordinary shares of £0.01 each
No Directors appointed by WCC
We have two wholly owned local authority trading companies which started trading in 2017/18. Warwickshire Legal Services Trading Ltd started trading on 1 October 2017. It provides legal services to other entities outside the Council and pays the authority for the services of our staff to carry out that work. This company has negligible assets.

Section B - Page 73
Educaterers Ltd, providing meals services to schools, started trading on 1 September 2017. Its accounts for the year to 30 August 2019 showed net liabilities of £2.7 million (£0.1 million for the year to 30 August 2018). This is mainly as a result of an increased pensions liability. Most of the company’s trading is with maintained schools in Warwickshire so that expenditure is already included in our Comprehensive Income and Expenditure Statement. Some authority staff transferred to the trading company and we have given a guarantee to pay any amount or employer’s contributions due to the Warwickshire Pension Fund in respect of their pension liability if the company ever becomes insolvent and ceases trading. We have also agreed a working capital loan of up to £1.5 million as required for the three years to 31 August 2020. Interest is charged at a market rate of 6% per annum charged periodically with interest changes mirroring that of the Bank of England Base Rate. At 31 March 2020 the balance on the loan was £1.5 million (£0.8 million at 31 March 2019). No dividends or profit distributions have yet been agreed for the trading periods up to 31 March 2020. We have assessed these two companies, having due regard to the non-material external turnover of both entities and the potential effect of consolidating them into our financial statements both quantitatively and qualitatively. We have concluded there is no current need to consolidate them into our accounts. We are part of a purchasing partnership, Eastern Shires Purchasing Organisation (ESPO), with five other local authorities. Each authority is represented on the management committee by two elected members. There are controls in place so that none of our elected members are involved in letting our contracts. We received £0.5 million in dividends from ESPO in 2019/20 (£0.5 million in 2018/19). As part of ESPO’s strategic growth plan, ESPO Trading Limited was incorporated on 27 February 2018. We own 100 of the 600 shares for which we paid £100. The company has been set up to be able to trade with organisations outside the public sector customer base. It has also purchased Eduzone Ltd in June 2018 (100 shares) since its incorporation, a company with a strong base in the providing products to the early years sector. We have not received any income in respect of these new holdings in the year. We also received dividends from SCAPE Group Limited and University of Warwick Science Park companies in the year totalling £0.5 million (£0.3 million in 2018/19). All dividend income received is shown as investment income in note 5. We are part of the Coventry and Warwickshire Local Enterprise Partnership Limited (the LEP). This company is limited by guarantee and aims to co-ordinate public and private sector partners to develop the economy and increase prosperity. The LEP's four objectives are:
• To drive economic growth;
• To help remove barriers to economic growth;
• To help create high value jobs; and
• To co-ordinate local government co-operation and support. The LEP also has a role in coordinating elements of government funding for growth, for example the Growing Places Fund. The Gateway Alliance is a strategic partnership of primary schools in Warwickshire. It was created to provide professional development and school to school support following the reduction of Local Authority improvement services in 2011. The company is limited by guarantee and the members have confirmed that the governing documentation of the company contains the necessary provisions which are required pursuant to the School Company Regulations 2002. Under the regulations, all school companies are required to have a local authority as a supervising authority. Warwickshire is the supervising authority for the Gateway Alliance School Company and also processes the payroll for the Company staff, all costs of which are reimbursed in full. West Midland Rail Ltd is a company limited by guarantee with a Board of Directors appointed from each of the 14 constituent member authorities and 2 affiliate member authorities for the purpose of providing local democratic strategic guidance for the specification of the new West Midlands rail franchise being let by the Department of Transport during 2017.

Section B - Page 74
We are also a partner in a special company, Pride in Camp Hill Ltd. The company was set up in 2002/03 in partnership with the Homes and Communities Agency and Nuneaton and Bedworth Borough Council to carry out a redevelopment project in Camp Hill. Our initial share was £0.720 million and each partner is committed to funding the running costs of the company in equal shares until it completes its work, which is currently expected to be in 2023. We are part of the Regional Adoption Agency via a shared service arrangement with Solihull Metropolitan Borough Council, Coventry City Council, Worcestershire County Council and Herefordshire Council. The Regional Adoption Agency is known as Adoption Central England. We have become the host authority to facilitate the operational delivery of the shared service, however governance arrangements ensure that all f ive authorities retain strategic responsibility for performance delivery and outcomes. For 2019/20 our contribution was £1.046 million (£0.950 million in 2018/19) and we received £4.155 million (£3.566 million 2018/19) from the other local authorities and fees and charges. The total spend was £4.463 million (£4.144 million in 2018/19). The underspend belonging to the Agency for 2019/20 is £0.738 million (£0.372 million in 2018/19). When the agency was created staff were seconded from partner authorities. On 1 October 2019 the staff were TUPEd (see glossary) across to the County Council and are now our employees. The County Council, as administering authority on behalf of the Warwickshire Pension Fund is a shareholder in Borders to Coast Pension Partnership Limited. Borders to Coast is a wholly owned private limited company registered in England and Wales founded to carry out pension fund asset pooling obligations set out by the Government. The company provides the facility to pool the pension fund investments of twelve local authorities in order to gain the benefits of economies of scale: the concentration of expertise, improved ability to manage down investment costs and the benefits of investing on a larger scale. Each of the twelve local authorities is an equal joint owner of the company through purchase of a £1 class A ordinary share. The authority also owns £833,333 class B ordinary shares but these are not voting shares and do not give entitlement to dividends or other distributions of income.
Note 41: Trading accounts Our trading activities are expected to break even after taking account of charges for the assets they use to provide their services. These charges are worked out in line with the accounting rules we use when we prepare our accounts. Any surplus or loss these trading activities make is transferred to, or met from, directorate risk reserves. The spending in the table below is included in our main accounts. However, we have adjusted these surpluses to reflect the effects of the required accounting treatment of pension costs (to reflect the actual costs of pensions decisions they have taken in the current year). The total value of this adjustment is £1.9 million (£1.4 million in 2018/19).

Section B - Page 75
Trading activity
Net
Expenditure
Memo
Net
Expenditure
before
technical
adjustments Turnover
Spend after
internal
income
External
income
Net
expenditure
Memo
Net
Expenditure
before
technical
adjustments
£ m £ m £ m £ m £ m £ m £ m
-0.1 -0.1 Schools finance 0.9 0.0 -0.1 -0.1 -0.2
-0.2 -0.3 Construction services 5.0 0.7 -0.8 0.0 -0.1
0.3 0.2 County fleet maintenance 0.0 0.5 -0.5 0.0 0.0
-0.3 -0.7 Legal services 6.3 1.6 -2.3 -0.7 -1.3
0.2 0.0 ICT services 4.3 1.6 -1.7 0.0 -0.2
0.2 0.1 Warwickshire Music 2.6 1.6 -1.5 0.1 0.0
-0.1 -0.1 Specialist Teaching Services 1.0 0.3 -0.4 -0.1 -0.1
-0.1 -0.1 School absence (sickness scheme) 2.2 0.9 -0.4 0.5 0.5
0.0 0.1 Schools Insurance 3.3 -0.1 0.0 -0.1 -0.2
0.0 0.0 Archeology 1.2 1.2 -1.2 0.0 -0.1
0.1 0.1 Education Psychology Service 1.0 0.5 -0.5 0.0 -0.1
0.0 -0.5
Other trading accounts (turnover of less
than £1m each) 5.7 3.2 -3.5 -0.3 -0.8
0.0 -1.3 Total 33.4 12.0 -12.8 -0.8 -2.6
2018/19 2019/20
Negative figures show we have more income than our spending (surplus). Other trading accounts with a turnover of less than £1 million include Internal Audit and Risk Management, School Governance, County Print Unit, HR support and Payroll, Pension Services, and County Cleaning.

Section B - Page 76
The Firefighters’ Pension Fund
2018/19 Fund account 2019/20
£m £m
Income to the fund
Contributions receivable (funds due to us during the year):
- from employer: Warwickshire County Council
-1.3 - normal contributions in relation to pensionable pay -2.7
0.0 - early retirements 0.0
0.0 - other contributions 0.0
-1.1 - from members (firefighters' contributions) -1.1
Transfers in:
0.0 - individual transfers in from other authorities 0.0
-2.4 Income to the fund -3.8
Spending by the fund
Benefits payable:
6.4 - Pension payments 6.8
1.3 - Commutation of pensions and lump-sum retirement benefits 2.1
0.0 - Lump sum death benefits 0.0
Payments to and on account of leavers
0.0 - Refund of Contributions to people who leave the scheme 0.0
0.0 - Individual transfers out of the scheme to other authorities 0.0
7.7 Spending by the fund 8.9
5.4Net amount payable for the year (before top-up grant receivable from
Government)5.1
-5.4 Top-up grant payable by the Government -5.1
0.0 Net amount payable or receivable (-) for the year 0.0
31 March 2019 Firefighters' Pension Fund net assets statement 31 March 2020
£m £m
Current assets:
2.0 - Top-up grant receivable from Government 1.6
0.0 - other current assets (other than assets in the future) ~ debtor 0.1
Current liabilities:
-2.0 - other current liabilities (other than liabilities in the future) -1.70.0 - Top-up grant repayable to Government 0.0
0.0 Net assets or liabilities (-) at the end of the year 0.0 Notes to the Firefighters’ Pension Fund statements Note 1: Fund operations The Firefighters’ Pension Scheme in England is an unfunded scheme. The employer promises to provide employees with benefits under the scheme but makes no advance funding in the scheme for those benefits. Benefits are paid directly by the employer when they become due. We are required to pay an employer’s pension contribution based on a percentage of pay into the pension fund. Each Fire and Rescue authority must run a pension fund and the amounts that must be paid into and out of the pension fund are set by regulation. The legislation that controls its operation is the Firefighters’ Pension Scheme (Amendment) (England) Order 2006. The benefits payable are pensions to retired firefighters and/or widows/widowers of retired firefighters. The benefits paid and employee and employers contributions are administered through our human resources management system. The scheme has no investment assets. The pension fund is balanced to nil at the end of the year by either paying over to the sponsoring government department the amount by which the amount receivable by (due to) the fund is more than the amount payable, or
Section B - Page 77
by receiving cash in the form of pension top-up grant from the sponsoring department equal to the amount by which the amount payable from (owed by) the pension fund for the year is more than the amount receivable. An amount of 80% of the estimated grant needed each year is paid to the fund by the Government during the year. The balance is only paid once the Pensions statement has been audited by our external auditors and a claim, certified by the authority’s S151 officer, is submitted to the Government. Note 2: Accounting policies The financial statements are accounted for on an accruals basis. We did not use any estimation techniques in preparing the statements. For assets and liabilities in the net asset statement the fair value is deemed to be the carrying value as they are both due within one year. Note 3: Liabilities The statements do not take account of any liabilities to pay pensions and other benefits after the period end i.e. 31 March 2020. Details of the long-term pension obligations, employees and employer’s contribution rates and actuarial assumptions used in the required disclosures in accounts for the Firefighters’ Pension Fund are found in note 37 to the accounts. Note 4: Contribution levels Employees’ and employer’s contribution levels are based on percentages of pensionable pay set nationally by the Home Office (previously dealt with by the Department for Communities and Local Government) and are subject to triennial revaluation by the Actuary. Note 5: AVCs and added years Additional voluntary contributions are excluded from the accounts of the Pension Fund. However, where members of the scheme have brought added years within the scheme, these will be included in the Fund contributions. Note 6: Debtors and creditors The debtors and creditors for both years are amounts due to/from central government (balance of grant due to balance the account to nil). Other debtors and creditors for both years are the amounts due to or from Warwickshire County Council, the administering authority or tax not yet paid to HMRC. This year we have had less grant from the Home Office than we have needed, so they owe us more money. As the Firefighters’ Pension Fund does not have its own separate bank account this additional payment has been made by the County fund and is therefore owed to the Warwickshire County Council when this money comes in from the Home Office. All amounts are due within 1 year.

Section B - Page 78
Glossary
This section explains some of the more complicated terms that have been used in this document.
Accruals Cost of goods and services received in the year but not yet paid for, or income earned but not yet received. Actuarial gain (loss) For pension assets, actuarial gains or losses happen when the actual return on investments in the pension fund is different from the expected return. For pension liabilities, actuarial gains and losses happen when the actual liability is different from the expected liability. For assumptions, actuarial gains or losses happen as a result of changes to the population or financial assumptions the actuary uses to work out the liability. Liabilities are valued in terms of ‘today’s money’. Amortisation The drop-in value of intangible assets as they are used or become out of date. Asset An item which is purchased or created to be used by the Council. Benefits we have awarded for added years When a member of staff retires early because they are made redundant, we can give added years of scheme membership. We meet the costs of giving these added years, usually from the savings that will be made. Budget A statement of our spending plans for a financial year, which starts on 1 April and ends on 31 March. Business rates (National Non-Domestic Rates) Businesses pay these rates, set annually by government, to billing authorities instead of council tax. Business rates are shared between local authorities partly on the basis of need and partly on the basis of increased business rates generated locally. The amount each business is charged is based on multiplying the rateable value of each business property by the national rate in the pound. Capital Adjustment Account This account includes the value of capital charges to the Comprehensive Income and Expenditure Statement that do not directly affect the level of council tax. Capital programme Our plan of capital projects and future spending on buying land, buildings, vehicles and equipment. Capital receipts Income from selling assets that we would consider capital expenditure if we were the purchaser. Capital spending Spending on assets that have a lasting value, for example, land, buildings and large items of equipment such as computers or vehicles. CIPFA Chartered Institute of Public Finance and Accountancy Contingent asset A possible asset which may arise pending decisions that are not under our control. Contingent liability A possible liability which may arise when we know the outcome of outstanding claims made against us.

Section B - Page 79
Council tax A tax based on property which is retained by local authorities to fund their expenditure. In Warwickshire, the district or borough councils issue council tax bills and collect the council tax. Creditors People or organisations we owe money to for work, goods or services which have not been paid for by the end of the financial year. Current assets Short-term assets which constantly change in value such as stocks, debtors and bank balances. Current liabilities Short-term liabilities which are due to be paid in less than one year such as bank overdrafts and money owed to suppliers. Current service cost Officers employed during the year will have earned a year of pensionable service. The current service cost is the increase in the value of the pension scheme's liabilities arising from the employee service during the period. Debtors People who owe us money that is not paid by the end of the financial year. Depreciation The drop in the value of assets, for example, through wear and tear, age and becoming out of date. Disclosure Information we must show in the accounts under the Code. Earmarked reserves Money set aside for a specific purpose. Fair value The price that would be received to sell an asset or paid to transfer a liability in an orderly transaction between market participants at the measurement date. General reserves Money set aside to be used in the future. Historic cost The cost of initial acquisition of an asset. International Financial Reporting Standard (IFRS) Standards on the way we need to treat certain items in our accounts. Liabilities Money we will have to pay to people or organisations in the future. Material related-party transactions Two or more organisations are 'related parties' if, during the year, one of them has some form of control over the other. By ‘material’ we mean of ‘significant value’. Minimum revenue provision (MRP) The amount we must set aside to repay loans. Net book value The value of an asset after depreciation.

Section B - Page 80
Non-current asset An asset which is expected to be used for more than 12 months. Non-distributed costs Costs which are not allocated to specific services, according to the Service Expenditure Reporting Code of Practice. Past service costs The past service cost is the extra liability that arises when we grant extra retirement benefits that did not exist before, such as when we agree early retirement or extra years of service. Pensions interest cost and expected return on assets The pensions interest cost is the increase in the value of the liabilities that arise because those liabilities are one year closer to being paid. The return on assets is the value of the return expected to be achieved on the fund’s investments in the long term. Provisions Money set aside to meet specific service liabilities and to meet spending. Reserves Savings we have built up from surpluses or by not spending income which has conditions on its use. Return on assets The return on assets is the value of the return we expect to achieve on the Pension Fund’s investments in the long term. Revaluation Reserve This account contains the difference between the amount paid for assets and the amount that they are currently worth. Revenue spending Spending on the day-to-day running of services - mainly wages, running expenses of buildings and equipment, and debt charges. These costs are met from council tax, business rates, government grants and fees and charges. Revenue expenditure funded by capital under statute (REFCUS) Spending on assets that have a lasting value, for example land and buildings, but which we do not own. Revenue Support Grant The main government grant to support local authority services. Settlement costs
Settlement costs arise when we make a lump-sum payment to a scheme member in exchange for their rights to receive certain pension benefits. Specific grants Payments from external bodies to cover local authority spending on a particular service or project. TUPE - Transfer of Undertakings (Protection of Employment) Regulations to protect employees if the business in which they are employed changes hands. Its effect is to move employees and any liabilities associated with them from the old employer to the new employer by operation of law. Unrealised A change in the market value which does not actually take place until an asset is sold.

Section C - Page 1
Annual Governance Statement Year ended 31 March 2020

Section C - Page 2
Annual Governance Statement 2019/20
Contents
Page
1
What are we responsible for? 3
2
The aim of the Governance Framework 4
3
The Governance Framework 4
4
Review of Effectiveness 11
5
Governance Issues 12
6
Appendix 1
Certification 2020-21 Governance Action Plan
18

Section C - Page 3
1. What are we responsible for? We are responsible for carrying out our business in line with the law and proper accounting standards, and for using public money economically, efficiently and effectively, and accounting for it properly. We also have a duty under the Local Government Act 1999 to continually review and improve the way we work, while at the same time offering value for money and an efficient and effective service. To meet our responsibility, we have put in place proper governance arrangements for overseeing what we do. These arrangements are intended to make sure that we do the right things, in the right way, for the right people, in a timely, open and accountable manner. These arrangements consist of all the systems, processes, culture and values which direct and control the way in which we work and through which we account to, engage with and lead our communities. We have approved and adopted a Code of Corporate Governance, which is consistent with the principles of the CIPFA/SOLACE Framework Delivering Good Governance in Local Government (2016). Further information is on our website: http://www.warwickshire.gov.uk/corporategovernance This statement explains how the Council has complied with its Code of Corporate Governance and also meets the requirements of the Accounts and Audit Regulations 2015. It also covers the governance control and risk management arrangements of the Warwickshire Local Government Pension Scheme and Firefighters’ Pension Scheme.
Figure 1 CIPFA's Principles of Good Governance

Section C - Page 4
2. The aim of the governance framework The framework allows us to monitor how we are achieving our strategic aims and ambitions, and to consider whether they have helped us deliver appropriate services that demonstrate value for money. The system of internal control is an important part of the framework and is designed to minimise risk to a tolerable level. It cannot eliminate all risk of failing to achieve our policies, aims and objectives. The system of internal control is based on continuing processes designed to: ● identify and prioritise the risks that could either prevent us from
achieving our priority outcomes or missing opportunities to improve outcomes;
● assess how likely it is that the identified risks will happen, and what will be the result if they did; and
● manage the risks efficiently, effectively and economically. The governance framework has been in place at the Council for the year ended 31 March 2020 and up to the date of approval of the Annual Governance Statement and Statement of Accounts. Since March 2020, the COVID-19 pandemic and the unprecedented public health and economic impacts have required a significant on-going managed emergency response. The Council has had to vary a range of working practices, service responses and business-as-usual governance mechanisms at pace. Due process has been followed by applying the principles of the Governance Framework. Specific governance actions in response to the pandemic are captured in Section 3, as actions against the relevant governance principles and in Section 5, as governance challenges. There will be a full review of lessons learned from the response phase, to inform future governance and emergency responses.
3 The Governance framework Our code is aligned to the CIPFA/SOLACE Framework Delivering Good Governance in Local Government (2016). A description of the arrangements which we have put in place to secure robust corporate governance are summarised below. The full detail of these arrangements can be found in the Code of Corporate Governance. http://www.warwickshire.gov.uk/corporategovernance . Core Principle A. Behaving with integrity, demonstrating strong commitment to ethical values, and respecting the rule of law As part of our governance framework we apply six key behaviours (see Figure 2) which provide a clear framework on the behaviours we are demonstrating on a day to day basis to support the cultural change and transformation of the organisation. The behaviours are supported by the following values; high performing, collaborative, customer focused, accountable and trustworthy. The behaviours and values are integral to 1:1s and appraisal conversations as well as key to the way we recruit and develop our colleagues. We have arrangements in place to provide assurance that our behaviours are being upheld and that members and officers demonstrate high standards of conduct. These include: ● codes of conduct for officers and members (including gifts and
hospitality, registering interests, anti-fraud and whistleblowing); and ● inclusion of ethical values in policies and procedures for all areas
including procurement and partnership working. http://www.warwickshire.gov.uk/conduct
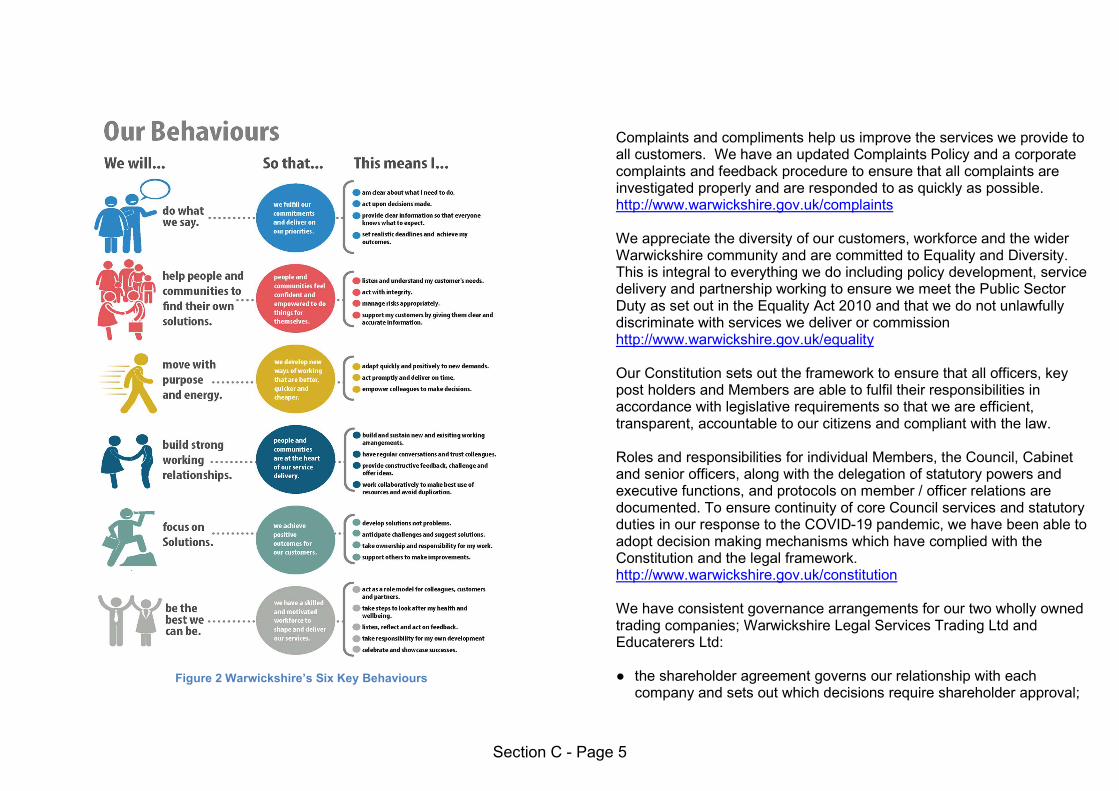
Section C - Page 5
Complaints and compliments help us improve the services we provide to all customers. We have an updated Complaints Policy and a corporate complaints and feedback procedure to ensure that all complaints are investigated properly and are responded to as quickly as possible. http://www.warwickshire.gov.uk/complaints We appreciate the diversity of our customers, workforce and the wider Warwickshire community and are committed to Equality and Diversity. This is integral to everything we do including policy development, service delivery and partnership working to ensure we meet the Public Sector Duty as set out in the Equality Act 2010 and that we do not unlawfully discriminate with services we deliver or commission http://www.warwickshire.gov.uk/equality Our Constitution sets out the framework to ensure that all officers, key post holders and Members are able to fulfil their responsibilities in accordance with legislative requirements so that we are efficient, transparent, accountable to our citizens and compliant with the law. Roles and responsibilities for individual Members, the Council, Cabinet and senior officers, along with the delegation of statutory powers and executive functions, and protocols on member / officer relations are documented. To ensure continuity of core Council services and statutory duties in our response to the COVID-19 pandemic, we have been able to adopt decision making mechanisms which have complied with the Constitution and the legal framework. http://www.warwickshire.gov.uk/constitution We have consistent governance arrangements for our two wholly owned trading companies; Warwickshire Legal Services Trading Ltd and Educaterers Ltd: ● the shareholder agreement governs our relationship with each
company and sets out which decisions require shareholder approval;
Figure 2 Warwickshire’s Six Key Behaviours
Section C - Page 6
● Annual General Meetings are held to ensure the Council is fully informed of the company’s performance; and
● Directors of each company have received “conflict of interest” awareness training and we actively monitor the risk of potential conflicts.
Also, in the case of Educaterers, the larger of the two companies, a shareholder representative attends company board meetings. The allows the Council, as a shareholder, to keep updated on company matters. Core Principle B. Ensuring openness and comprehensive stakeholder engagement We have a Consultation and Engagement Framework in place, owned by a lead officer, which provides staff with up to date guidance and tools for planning and conducting consultation activities. As part of our approach to consultation the Ask Warwickshire website is a portal for consultation exercises taking place within Warwickshire. We use a variety of methods to undertake consultation. www.warwickshire.gov.uk/ask We carried out extensive consultation on strategic objective proposals for the 2020-25 Council Plan, including a dedicated consultation web page, a multi media engagement questionnaire and 9 county wide roadshows which reached a large and diverse audience . Our response to the COVID-19 pandemic has seen our engagement with communities, employees, schools, partners and other stakeholders delivered and managed daily, through our external website home page and links to a dedicated suite of web pages and linked resources offering support and guidance. We have also extended our community engagement through a range of social media channels such as Twitter, Facebook, Snapchat and Instagram to achieve the maximum reach from our messaging during this critical time.
We value the contribution from our employees and have an Employee Engagement Strategy in place which sets out how we ensure employees have a voice, managers and leaders are focusing, coaching and developing their people and there is clear communication about where our authority is going. This is supported by regular staff surveys and pulse surveys which measure employee engagement and our direction of travel against a number of staff related measures. To support the unique challenges arising from COVID-19, we put in place staff check-in surveys to understand the impact of remote working and the pandemic on their well-being, as well as adoption of new technologies and ways of working. https://www.warwickshire.gov.uk/employeeengagement We actively contribute to and collaborate with partners to promote good governance and achieve the delivery of outcomes through increased joint working and economies of scale. We are members of a number of sub-regional partnerships and groups which have member and / or officer representation. Each partnership has its own governance arrangements in place. http://www.warwickshire.gov.uk/partnerships We are registered as a data controller under the Data Protection Act as we collect and process personal information and we have a named Data Protection officer. We have General Data Protection Regulation (GDPR) compliant procedures that explain how we use and share information and arrangements for members of the public to access information. We have also adopted the model publication scheme produced by the Information Commissioner’s Office (ICO), in accordance with the Freedom of Information Act 2000. https://www.warwickshire.gov.uk/Publications-scheme-and-transparency The Warwickshire Pension Fund engages with its employers and members through the Local Pension Board which has representatives from employers and members, and through direct communications for example directly sharing new policies such as the Funding Strategy Statement for comment. https://warwickshireintranet.moderngov.co.uk/mgCommitteeDetails

Section C - Page 7
Core Principle C. Defining outcomes in terms of sustainable economic, social, and environmental benefits 2019-20 is the final year of the Council’s One Organisational Plan (OOP 2020) and 3 year Medium Term Financial Strategy (MTFS). It set out our vision for Warwickshire and the journey the authority took to deliver this vision and outcomes over the life of the plan. Progress implementing the OOP 2020 has been reported to Cabinet and has been subject to annual review. https://www.warwickshire.gov.uk/OneOrganisationalPlan Going forward, the new Council Plan has been developed with members and in consultation with our stakeholders and communities and defines priority outcomes and key strategic objectives. https://www.warwickshire.gov.uk/strategies
Figure 3: Warwickshire’s Core Purpose and Priority Outcomes
Alongside the Council Plan, the Council has produced a rolling five-year Medium-Term Financial Strategy which is established on sound assumptions to deliver a sustainable balanced budget in the short and medium term. This will assist with forward planning and responding to variations in financial forecasts. In 2019 the Council declared a climate emergency. Climate Change adaptation task and finish groups were set up; one group considered mitigation strategies and a second group addressed possible adaptations. A single set of recommended priority actions and options for investment, informed by UK Climate Change data, were approved by Cabinet. A climate impact assessment for Warwickshire is also being prepared. The most significant impacts of the COVID-19 pandemic on the Council’s core purpose and outcomes are being assessed and acted upon, initially, by developing a whole council phased recovery and reform plan. Warwickshire Councils have issued a joint statement of intent on recovery and the recovery planning process aligns to the approach being taken across Warwickshire and the West Midlands through the Local Resilience Forum arrangements. Core Principle D. Determining the interventions necessary to optimise the achievement of the intended outcomes 2019-20 The One Organisational Plan (OOP) and the Council’s MTFS were aligned to ensure a joined up approach to delivering the OOP 2020 outcomes and agreed savings plans. Transformation Programme Boards were set up in 2018-19 and a Gateway Group, operating at strategic level, has also been meeting during 2019/20 to assess revenue project benefits and alignment with key outcomes. This provided the necessary framework to continue to deliver change and transformation and to ensure clear line of sight in the delivery of WCC’s Core Purpose and Outcomes at strategic, directorate and service level.

Section C - Page 8
The creation of a dedicated Commissioning Support Unit is supporting the establishment of a one-organisation approach to the way outcomes are achieved. Bringing together functions around change management, business intelligence, contract management and quality assurance means that a robust, consistent methodology is applied to informing and prioritising commissioning activity. The unit also provides corporate assurances through ongoing monitoring of delivery against outcomes and prompting actions to stay on track. 2020 and Beyond Our Commissioning Intentions Performance Framework, developed to support the delivery of the new Council Plan, includes the following mechanisms to assess progress and inform actions and interventions to achieve intended outcomes:
● progress against the Council‘s Key Business Measures (KBMs) to assess the delivery of outcomes for reporting to Overview & Scrutiny Committees and Cabinet on a quarterly basis. This information is also available electronically to members and officers via a series of Cabinet and OSC Dashboards using new business insight technology;
● a suite of reports and dashboards provides HR, finance and performance data to Strategic Directors, Assistant Directors and third tier managers for their areas of responsibility. This enables managers to interrogate information quickly and efficiently, making key business measures and supporting indicators easier to monitor;
● arrangements are in place to report critical management information on the key aspects of the delivery of the Council Plan, including finance, projects and performance to Corporate Board and on a quarterly basis to Cabinet and Overview & Scrutiny; and
● Each Directorate has arrangements in place for reporting performance to its Directorate Leadership Team and corporately as part of a Commissioning Intentions Performance.
The Commissioning Support Unit have the resources, tools and expertise to maintain these systems and processes and to support services to identify and monitor actions to stay on track and to escalate further where decisions are needed. All proposed and active projects are managed in the VERTO system, which includes change control and reporting functionality to reduce the risk of non delivery of intended outcomes. In March 2020, the Council paused, for a short period, corporate performance reporting and the planned change programme to redirect effort and resources to support the immediate emergency response to COVID-19. Specialist response cells have developed interventions to manage and mitigate the COVID-19 impact on the council's defined outcomes across all key services, including Adult Social Care, Children’s Services, Education Services, highways and waste management. Outturn and performance reporting resumed in Q1 2020-21.
Core Principle E. Developing the entity’s capacity, including the capability of its leadership and the individuals within it A People Strategy has been developed to ensure our workforce can deliver the organisation’s new Operating Model and stays aligned with our vision and outcomes. Priority actions to underpin the Strategy have been agreed with action plans in place, focusing on delivery. There is ongoing engagement with staff in this area and direction and progress continues to be governed and monitored by the How We Work Board. Our How We Work programme is designed to deliver the right technology and tools to work as efficiently and effectively as possible. Our investment in ways of working, remote working technology and infrastructure has greatly enhanced the ability of the organisation to respond effectively to an emergency event and has proven to be a robust part of our COVID-19 response. Structurally, the move to distinguish between Strategic Commissioning and Delivery roles has helped to build increased strategic capacity

Section C - Page 9
alongside functional operating models building capacity to deliver more effectively. The refreshed approach to our Flexible Working arrangements as a whole Council offer from January 2020 set out principles for employees to work flexibly as efficiently and productively as possible, whilst maintaining a priority focus on service needs. These principles significantly supported the Council’s ability to respond effectively and maintain service delivery during the initial response phase of COVID-19. To enable our employees to be the best they can be we have a corporate process for annual appraisals and Personal Development Plans for Tier 4 officers and above supported by regular 1:1 conversations. This provides the necessary clarity of expectations and behaviour, direction, support and opportunities for growth and development and allows employees and managers to have constructive discussions on performance, progress against outcomes, wellbeing and development. Our corporate appraisal process is aligned to the Behaviours Framework and our recruitment process for tiers 1 – 4 applied a behavioural assessment process, which includes leadership capability and identifies personal development areas. Our Senior Leadership Forum and planned events and workshops aim to share our strategic direction and Change plans more widely and build the skills and capabilities needed to successfully deliver those plans. A member development programme is arranged each year to ensure core development needs of members, aligned to their respective roles, are met and to take account of new and emerging issues. We have invested in the health & wellbeing of our employees with a Workplace Wellness Strategy, and supporting processes including those to manage sickness absence and return to work. The health & wellbeing of our employees during the COVID-19 pandemic and lockdown period has been a top priority. We have focused on:
maintaining wellbeing and HR policy information on the intranet home page with links to internal and external support networks, resources and check in surveys; and
regular live communication to staff from Corporate Board.
Core Principle F. Managing risks and performance through robust internal control and strong public financial management The One Organisational Plan and the new Council Plan are supported by the necessary performance and financial management framework to complete the delivery of transformation and realise the benefits of embedding and sustaining change. The performance framework ensures that Members and Officers have a clear picture of how well the Organisation is progressing against the outcomes set out in the Plan as well as the key business outcomes that support and underpin it. Strong financial management is assured by budget monitoring and variance reporting at service and corporate level, ensuring the Council is alert to emerging financial risks and can proactively manage those risks. These processes continued during the final year of OOP 2020. Internal audit provide advice to service areas and change projects to ensure the control environment remains strong. The impact of COVID-19 on the Council’s financial position is subject to continuous financial analysis and key indicators reported to Corporate Board alongside MHCLG COVID-19 financial impact returns. Financial Regulations set out our financial management framework for ensuring we make the best use of the money we have available to spend. They outline the financial roles and responsibilities for staff and Members and provide a framework for financial decision-making. S48 Agreements with maintained schools ensure we obtain annual assurances from

Section C - Page 10
schools about their financial management of delegated budgets. Where there are specific statutory powers and duties the Financial Regulations seek to ensure these are complied with, as well as reflecting best professional practice and decision-making. https://www.warwickshire.gov.uk/standingorders Our emergency response to COVID-19 included adapted physical asset and financial control measures with all audit trails assured. Our procurement function and processes ensured supplies of essential equipment and products were maintained and suppliers paid promptly and accurately. Pension Fund investments are governed by the Pension Fund Investments Sub Committee which is advised by external financial advisers and supported by two independent financial advisers. https://warwickshireintranet.moderngov.co.uk/mgCommitteeDetails.aspx?ID=168 Risk management is an integral part of good management and corporate governance and is therefore at the heart of what we do. It is essential to our ability to deliver public services and as a custodian of public funds. Our approach to managing risk is explained in the Risk Management Strategy. http://www.warwickshire.gov.uk/riskmanagementstrategy. An external Health Check of the Council’s risk management approach against a national good practice framework was completed in 2019. This resulted in an action plan to deliver improvements to our risk management approach and will inform an updated Risk Management Framework in 2020. This review will include setting a corporate risk appetite, standard corporate principles for the management of risk, and standard approaches to the management of risk in cross cutting functions including project management, procurement, and commercial activities. We have adopted the CIPFA Code of Practice for Managing the Risk of fraud and corruption and this is reflected in our anti-fraud policy. http://www.warwickshire.gov.uk/antifraud
Core Principle G. Implementing good practices in transparency, reporting, and audit to deliver effective accountability We endeavour to always be open and transparent. We have a forward plan which provides information about all of the decisions that the Council has scheduled. Formal agendas, reports and minutes for all committee meetings are published on our website which ensures that people know what decisions the Council is planning to take, and the decisions taken. http://www.warwickshire.gov.uk/democracy Overview and Scrutiny Committees act as a critical friend and hold Cabinet to account for its decisions. The terms of reference for all O&S Committees are defined in the Constitution. http://www.warwickshire.gov.uk/scrutiny The Audit and Standards Committee has oversight of internal and external audit matters, the Council’s arrangements for corporate governance and risk management and any other arrangements for the maintenance of probity. Each year we publish information on our website outlining how we spend Council Tax income. http://www.warwickshire.gov.uk/counciltaxspending Arrangements are in place to ensure that we fully comply with the requirements of the Public Sector Internal Audit Standards and CIPFA Statement on the Role of the Head of Internal Audit. The Internal Audit Manager is designated as the Head of Internal Audit and had regular formal meetings during the year with the Strategic Director for Resources, Assistant Director Finance and Assistant Director Governance and Policy. There is an Internal Audit Board which assists in facilitating the management and governance of the internal audit service. An External Quality Assessment of the Internal Audit service was completed in February 2018 resulting in positive feedback on the quality of internal audit provided to its clients. http://www.warwickshire.gov.uk/audit

Section C - Page 11
During the early stages of the COVID-19 response the Council made greater use of Leader decision making as set out in the Constitution. Arrangements were put in place to allow prior sharing of reports with Group Leaders for any representations to be taken into account and reports and minutes were published and made available to the public in the usual way. By mid-May we had re-introduced formal member meetings carried out virtually using Microsoft Teams functionality. 4. Review of effectiveness We have responsibility for conducting, at least annually, a review of the effectiveness of our governance framework including the system of internal control. The review of effectiveness is informed by the work of managers within the Authority who have responsibility for the development and maintenance of the governance environment, the Head of Internal Audit’s annual report, and also by comments made by external auditors and other review agencies and inspectorates. The review of effectiveness was co-ordinated by an evaluation panel consisting of representatives from each Directorate, Internal Audit and chaired by the Strategy & Commissioning Manager (Treasury, Pensions, Audit, Insurance and Risk). In carrying out their review, the evaluation panel: ● considered the approach of the Authority to establishing its principal
statutory obligations and organisational objectives; ● considered the approach of the Authority to identifying principal risks to
the achievement of those obligations and objectives; ● identified the key control frameworks that the Authority has in place to
manage its principal risks; ● obtained assurance from managers on the operation of key control
frameworks and on the results of relevant external or internal inspection; and
● evaluated the assurances provided and identified gaps.
The evaluation panel also considered the strategic risk register updated and agreed with Corporate Board in January 2020. The impact of the COVID-19 pandemic on strategic risk has been reviewed to inform recovery planning and key governance improvement actions for 2020-21 (Appendix A). In addition, Assistant Directors have confirmed that they have complied with the risk management framework throughout the year and have provided assurances at year end, including additional assurances about COVID-19 impacts in the final weeks of the financial year. Consideration was also given to the results of reviews carried out by external agencies during the year including the external audit of the accounts. The work of the evaluation panel was scrutinised by the Assistant Director Governance and Policy (Monitoring Officer),the Interim Assistant Director Finance, Strategic Director for Resources (Section 151 Officer) and Director of Adults and Children’s Services before being submitted to the Audit and Standards Committee for further scrutiny and reported to Cabinet and Council. The Council’s governance arrangements have been reviewed and improved throughout 2019/20 in a range of areas including: ● An approved Commercial Strategy with the Trading Board overseeing
the delivery of the strategy; ● A refreshed Complaints Policy and new electronic complaints system; ● The Council’s Integrated Capital Strategy has been reviewed by the
Capital Working Group and updated in line with the CIPFA code; ● Development of internal officer level governance arrangements under
the Making Better Use of Our Time project; ● The Gateway process is being extended to include Capital projects; ● The development of a new Treasury Management Strategy; ● A new Pension Fund website was launched in December 2019
improving transparency and access for employees; ● An independent review of pension fund administration governance was
undertaken, reported to the Local Pension Board, and progress has been made on the resulting action plan;

Section C - Page 12
● Pension Investment controls have been audited for the second year and improvements noted from 2018/19;
● Council meetings are web-streamed, improving transparency of decision making and public accessibility;
● Our new committee management system, Modern.Gov, has been implemented, strengthening consultation, review and sign off procedures as part of key decision making, at the same time as improving ownership and transparency in report writing;
● The Council’s move to the Cloud-based Microsoft 365 environment has improved communication and data security and has also enhanced the ability to work remotely, securely and collaboratively;
● Staff were consulted on the new Employer Value Proposition and Flexible Working arrangements;
● Staff consultation on new directorate and service structures was transparent and consistently applied across directorates and service areas;
● A programme of leadership forums and executive coaching offered to support leadership development;
● Our new Customer Experience Strategy gives a corporate focus on delivering positive outcomes for customers;
● A prior year HMICFRS review of Warwickshire Fire & Rescue service was largely positive and action has been taken to respond to any areas identified as requiring improvement; and
● Our Council Plan engagement and consultation activity resulted in a significantly increased public response rate compared with previous years, including 1,112 returned questionnaires and 826 shorter questionnaires completed at roadshows.
The results of Internal Audit work were reported to the Audit and Standards Committee throughout the year with the exception of the March 2020 meeting which was cancelled as a result of COVID-19. The individual reviews feed into the overall Internal Audit Annual Report. The Committee has also considered in greater detail areas where limited assurance opinions have been provided including; Pensions Investment, and Payroll. This report concludes that the Authority’s control environment provides moderate assurance that the significant risks facing
the Authority are addressed. The internal audit findings, including those with a limited assurance opinion, were duly considered in the preparation of this statement. 5. Governance issues We have not experienced any significant governance failures during the last year and our arrangements continue to be regarded as fit for purpose in accordance with the governance framework. However, the matters listed below have been identified as major challenges for the Authority. These governance challenges are reflected in the organisation’s strategic risk register and have accompanying actions. The risk register highlights the actions taken and successes achieved in addressing the challenges of the past twelve months. A primary purpose of the governance framework is to manage strategic risks proactively and to ensure that risks that can’t be tolerated are appropriately mitigated. We are satisfied that the challenges identified here are addressed by the Council Plan, the Target Operating Model and the COVID-19 recovery plan process. The following paragraphs summarise the risks contained in the strategic risk register and in the context of good governance. The 2020-21 Governance Action Plan (Appendix 1) presents, on an exception basis, additional actions that are already planned or being considered to inform future Council planning and strengthen governance. Government policies, new legislation, funding uncertainty and demographic pressures present challenges to sustainable service delivery. The outlook for Local Government remains demanding with uncertainty about post Brexit and future government policy changes and the very likely high impact economic and financial consequences of the COVID-19

Section C - Page 13
Pandemic. We will adopt a proactive approach to identifying the future direction of government policies which impact on local government and the implications for Warwickshire. Our new corporate policy function has the capability to support this work. We will also play an active role in regional and national groups, seeking to actively influence government policies and thinking around key issues, risks and future opportunities. We are actively managing the impact that the Government’s emergency COVID-19 response measures will have on the future levels of business rate income, tax base and cashflow management. We also await the outcome of the Treasury’s Fair Funding and Comprehensive Spending Review. Government proposals to remove the option for schools to write off Dedicated Schools Grant funds and the projected increase in demand for school places are included in financial scenario planning. Council Plan and MTFS proposals to save £33m over 5 years to 2025, create financial pressures meaning that the organisation faces significant challenges to meet its aims and objectives. The savings and transformation plans that have already been delivered during the previous OOP 2020 period were challenging but realistic. The potentially significant impact on services that we provide to the public is being actively managed through the Change Programme workstreams coordinated by the Programme Management Office. There is an overall risk to the delivery of savings plans in 2020/21 and possibly 2021/22, as a result of COVID-19 impacting practical progress on change during the first quarter of 2020/21. However, a Recovery Plan and approach is being developed to inform the refresh of the MTFS, redirect resources where required and reset our Change Programme. Our pension fund value is in excess of £2bn and we work closely with our Investment Committees, pooling partners and advisers to ensure we maximise the value of our assets and maintain effective governance and reporting arrangements.
The major focus for us in the coming year is to: ● Reassess the overall 2020/21 budget position and implement a
2021/22 and rolling MTFS refresh informed by COVID-19 impact assessments, financial evaluation of COVID-19 response expenditure and recovery planning;
● Deliver a governance and constitutional review, including development of the Financial Framework to improve overall financial management;
● Complete implementation of Functional Operating Models across the organisation to deliver effective and sustainable services;
● Continue to monitor the implementation of in year savings and project plans and ensure that revenue and capital budgets are managed in a clear and prudent manner, with a focus on the quality of in-year forecasting to inform timely resource allocation decisions;
● Continue to work closely with Border to Coast Pension Partnership; ● Continue to explore and engage in the debate around the implication of
national policy direction on local public service delivery and what it may mean for Warwickshire;
● Work with our key partners to engage proactively with the UK Government to manage any financial consequences of COVID-19 and our exit from the EU at the end of 2020; and
● Engage with options for conducting LGA led Peer Challenge activity in 2020.
Continuing pressure on Council-funded Social Care, Health and Special Educational Needs & Disability Services (SEND). There continue to be longer term pressures that have a fundamental impact on the funding and provision of adults and children's social care, SEND and disability services in Warwickshire. Demographic pressures and increase in referral numbers, combined with the impact of the national living wage, means that demand and costs for providing care and support continue to rise. In addition, market pressures on providers increases the risk that they either leave the market or that services provided fail to meet minimum statutory requirements.
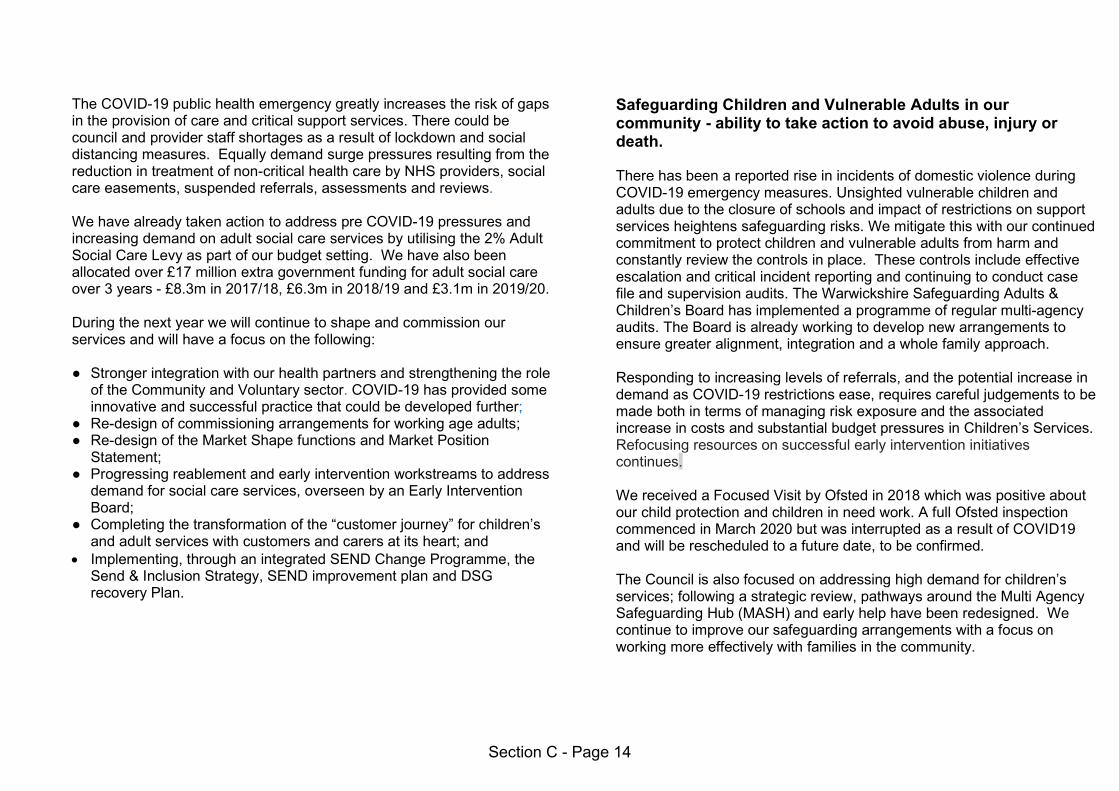
Section C - Page 14
The COVID-19 public health emergency greatly increases the risk of gaps in the provision of care and critical support services. There could be council and provider staff shortages as a result of lockdown and social distancing measures. Equally demand surge pressures resulting from the reduction in treatment of non-critical health care by NHS providers, social care easements, suspended referrals, assessments and reviews. We have already taken action to address pre COVID-19 pressures and increasing demand on adult social care services by utilising the 2% Adult Social Care Levy as part of our budget setting. We have also been allocated over £17 million extra government funding for adult social care over 3 years - £8.3m in 2017/18, £6.3m in 2018/19 and £3.1m in 2019/20. During the next year we will continue to shape and commission our services and will have a focus on the following: ● Stronger integration with our health partners and strengthening the role
of the Community and Voluntary sector. COVID-19 has provided some innovative and successful practice that could be developed further;
● Re-design of commissioning arrangements for working age adults; ● Re-design of the Market Shape functions and Market Position
Statement; ● Progressing reablement and early intervention workstreams to address
demand for social care services, overseen by an Early Intervention Board;
● Completing the transformation of the “customer journey” for children’s and adult services with customers and carers at its heart; and
Implementing, through an integrated SEND Change Programme, the Send & Inclusion Strategy, SEND improvement plan and DSG recovery Plan.
Safeguarding Children and Vulnerable Adults in our community - ability to take action to avoid abuse, injury or death. There has been a reported rise in incidents of domestic violence during COVID-19 emergency measures. Unsighted vulnerable children and adults due to the closure of schools and impact of restrictions on support services heightens safeguarding risks. We mitigate this with our continued commitment to protect children and vulnerable adults from harm and constantly review the controls in place. These controls include effective escalation and critical incident reporting and continuing to conduct case file and supervision audits. The Warwickshire Safeguarding Adults & Children’s Board has implemented a programme of regular multi-agency audits. The Board is already working to develop new arrangements to ensure greater alignment, integration and a whole family approach. Responding to increasing levels of referrals, and the potential increase in demand as COVID-19 restrictions ease, requires careful judgements to be made both in terms of managing risk exposure and the associated increase in costs and substantial budget pressures in Children’s Services. Refocusing resources on successful early intervention initiatives continues. We received a Focused Visit by Ofsted in 2018 which was positive about our child protection and children in need work. A full Ofsted inspection commenced in March 2020 but was interrupted as a result of COVID19 and will be rescheduled to a future date, to be confirmed. The Council is also focused on addressing high demand for children’s services; following a strategic review, pathways around the Multi Agency Safeguarding Hub (MASH) and early help have been redesigned. We continue to improve our safeguarding arrangements with a focus on working more effectively with families in the community.

Section C - Page 15
We also continue to quality assure commissioned services and ensure robust escalation and response plans are in place in the event of a market failure. Ability to maintain the security of personal or protected data and protect our systems from disruption as result of cybercrime. Information security is a key issue for all public sector organisations, in light of well publicised data losses and cyber security incidents affecting several public and private sector bodies. A robust process for investigating incidents is in place and we continue to protect our systems and data of our staff and customers. We ensure that data is stored securely, legally and in accordance with Council policy. In 2019 we released new Information Compliance Training and require staff to undertake e-learning and formally accept their data protection responsibilities. This increases overall awareness, and signposts staff to our more detailed advice and guidance. There is routine General Data Protection Regulation (GDPR) Compliance reporting to Corporate Board. We have strengthened the role of our Technical Design Authority to approve products on the basis of privacy and security controls and have processes built into our business intelligence work using the “data protection by default and design” principle. Along with all other organisations, we have seen an increase in the number of attacks on Warwickshire websites and systems arising from hacking, denial of service, ransomware and phishing. In response, we continue to review and develop our network and information security arrangements and invest in those resources, following an agreed ICT security roadmap. We are alert to the risks of cybercrime that may arise due to remote working during the COVID-19 pandemic lockdown and we continue to maintain prevention, control, testing and response regimes to mitigate this risk.
Ability to secure economic growth in Warwickshire. The COVID-19 pandemic will inevitably lead to a significant drop in economic activity and create significant uncertainty around future growth. The Council has worked closely with district and borough councils, Chamber of Commerce, Federation of Small Businesses (FSB) and Local Enterprise Partnership to co-ordinate our approach and support our businesses to access the emergency response funds made available by central government. A key theme of our COVID-19 Recovery and Reform planning, which will shape our refreshed change portfolio, is identified as “Place, Economy and Climate (including skills and education)”. We are implementing and co-ordinating a regional, sub-regional and local approach to economic recovery, helping support our businesses to safely and effectively re-open following lockdown, and exploring how they can adapt to the “new normal”. To support the re-opening of our economy and businesses within our town centres, we are working to redesign and reallocate road space within our key towns to enable social distancing and improved throughput of pedestrians in a safe way that provides confidence to visitors to come to our town centres. At a regional level the Council is a non-constituent member of the West Midlands Combined Authority (WMCA), with its objectives to create jobs, enhance skills, develop prosperity and drive economic growth. We continue to actively engage with WMCA with regards to transport, planning, housing and economic development. The leader of the Council is Chair of the WMCA Wellbeing Board. The County Council agreed a new Economic Growth Strategy for the period 2020-2025, which sets out our vision and approach to supporting our businesses and the wider economy. While the key priorities remain valid, clearly as a result of COVID-19 it does necessitate a refocusing of key actions and initiatives.

Section C - Page 16
Over the coming year, we will:
Work with the CWLEP and WMCA to develop our economic recovery plans, and a longer-term approach to economic growth within the county;
With our regional, sub regional and local partners and networks we will work to access future funding streams to support economic growth and the introduction of the proposed Shared Prosperity Fund to replace existing Growth Deal and European Funding streams;
Continue to work with the Coventry & Warwickshire Growth Hub, Chamber of Commerce, Federation of Small Businesses and other key partners to support our small and medium sized businesses (SMEs) to survive, grow and prosper;
Continue to work with our partners to develop the Skills for Employment programme to improve the employability skills and attributes of young people;
Enhance our approach to place-shaping and infrastructure investment, to both support economic recovery and to help deliver the key priorities set out in our Council Plan;
Develop a pipeline of transport infrastructure projects with associated funding strategies;
Continue to work with partners on the development of HS2 and maximising the economic benefits and managing the impacts on our communities; and
Coordinate the Council’s contingency planning for EU Exit and the management of risks including workforce, data handling and supply chain impacts, with lead officers identified from each Directorate.
Ability to keep our communities safe from harm. There are many challenges nationally and locally for the extensive services we provide that keep our communities safe, in normal times and in times of emergency. This includes the Fire and Rescue Service, Public Health, Trading Standards, Council owned highways maintenance, flood risk management, corporate arrangements for business continuity and our role in the Local Resilience Forum. We recognise that we need to become increasingly flexible if we are to meet our current and emerging challenges. As a specific response to COVID-19, working with district and borough councils and the voluntary sector we established Community Shielding Hubs to maintain food supplies and medicines, communication channels and information to support the most vulnerable members of the community. A central, seven-day telephone line provided advice and support to those extremely clinically vulnerable citizens who were shielding, and other vulnerable residents As an employer, we have applied Public Health England and government guidelines, requiring our staff to work at home wherever possible and ensuring adequate supplies of PPE for the continued safe delivery of frontline council services. We have also introduced regular meetings with Warwickshire Police executive team to engage and inform decision making at a strategic level. During the course of the next year we will have a focus on the following areas: Our ongoing public health role to deliver, in partnership with Central
Government, Clinical Commissioning Groups and Public Health England, Test and Trace, infection control and Local Outbreak Management plans will continue to be prioritised;

Section C - Page 17
Prioritising and safely reinstating our critical services that keep our communities, including the most vulnerable people, safe from harm;
● Develop a new WFRS Integrated Risk Management Plan to ensure our fire and rescue service has sufficient resources in the right locations to effectively manage the changing risk profile within the county;
● Continue to review and test all our business continuity and emergency plans and learn from our ongoing response to the COVID-19 pandemic;
● Engage with partners through the Warwickshire and West Midlands Local Resilience Fora, Safer Warwickshire Partnership, collaborating with Category 1 and 2 Responders on county wide emergency response and contingency planning;
● Develop an evidence based Asset Management regime for the efficient and effective maintenance of the Highway Network, targeting the most critical areas of the Network and aligned with the annual review of the Council’s Capital Programme; and
● Continue to direct Trading Standards resources to support a Rapid Response Unit, targeting criminal and other high-risk activity in the community.
Successfully delivering a refreshed Council Change Portfolio to drive recovery. Successfully delivering the Council’s change portfolio, and sustaining change, is critical to the Council’s longer-term strategy, achieving Council Plan outcomes, strategic objectives and maintaining our financial resilience. Our Commissioning Support Unit drives the development and delivery of the Change Portfolio, through the Portfolio Management Office and change and programme management specialists. Our Change Management Framework means all major change and capital investment projects going forward are given early consideration by a Gateway process before further development and any recommendations to
Corporate Board. A programme governance framework is in place with programme groups and accountabilities to cover all change activity. Progress is reported to Cabinet in quarterly monitoring reports. All Key Business Measures were updated in October 2019 as part of establishing the Commissioning Intentions Performance Framework. Corporate Board will maintain monthly control, oversight and assurances of the Change Portfolio and agree prioritisation of projects and how they align to the Council Plan and COVID-19 recovery planning. COVID-19 response and recovery activity is accelerating the pace of change and is directly influencing our Change Portfolio. Service Impact Assessments have been completed by all service areas to inform recovery planning and manage associated risks in a co-ordinated and coherent way across the Council, including application of the positive changes that emerged from the response phase. As a result, the change management process going forward is focused on four themes to drive recovery, linked to regional and sub regional recovery activity:
Place, Economy and Climate (including skills and education); Community; Health, Wellbeing and Social Care; and Organisation (including the reinstatement of services).

Section C - Page 18
6. Certification We will continue to manage the risks detailed above and further enhance our governance arrangements over the coming year as set out in the 2020-21 Governance Action Plan at Appendix 1. We are satisfied that the risks we have identified are addressed in our Council Plan, the strategic risk register and ongoing COVID-19 recovery and reform planning. We are satisfied that the actions identified will address the need for improvements that were highlighted in our review of effectiveness. These are monitored and reported to members and Corporate Board as part of the corporate performance management framework. We will monitor their implementation and operation as part of our next annual review.
………………………………………………. Councillor Izzi Seccombe OBE Leader of the Council

Section C - Page 19
Governance Action Plan 2020-21: Actions informed by Effectiveness Review and COVID-19 Learning Points
Governance Element/ Principle
Governance Improvement Actions Action Owner (Leadership Team)
Target Date
The Council’s Corporate Governance Framework (All Principles)
Our Local Code of Corporate Governance was last updated and approved in 2016. Our transformation journey, including organisational restructure and new ways of working, requires the governance code to be reviewed and revised to be fit for future purpose. Learning points from our COVID-19 response actions and recovery planning will also inform updates to the code.
Assistant Director Governance & Policy
December 2020
Constitution and Financial Regulations (Principle A)
Complete the review of the Council’s Constitution and Financial Regulations informed by recovery and reform planning improvement areas for decision making and governance,
Assistant Director Governance & Policy/ Assistant Director Finance
April 2021
System of Internal Control: Risk Management Framework (Principle F, Managing risks and performance).
A proposed Risk Management Framework project includes workstreams to revise the Council’s approach to:
strategic risk management; service risk management; integration of risk management with performance management
strategic and business planning and core business processes; to support innovation, change and maximising positive outcomes
by moving from being risk averse to being more risk aware.
Assistant Director Finance
December 2020
Corporate Assurance Framework (To inform Effectiveness of Governance reviews - All Principles)
To implement a Three Line of Defence model as part of a council wide assurance framework to manage risks and deliver ongoing internal control assurances to Corporate Board and members throughout the year.
Assistant Director Finance
March 2021
Service Re-instatement Plans (Principle D, interventions to optimise the achievement of intended outcomes)
Reinstatement Planning for all Council services are prioritised and risk-based and will focus on the following areas:
Keeping people safe; Managing risk successfully; Supporting staff with new ways of working; and Ensuring learning points are identified and followed up.
AD Enabling September 2020
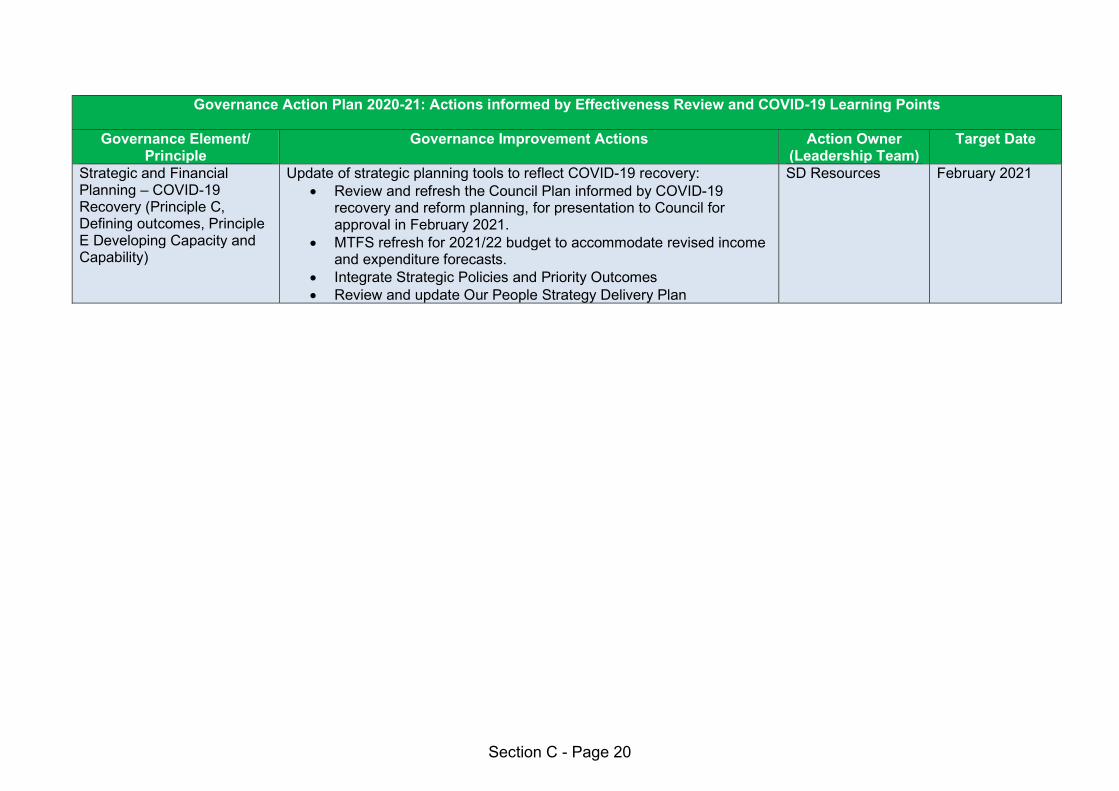
Section C - Page 20
Governance Action Plan 2020-21: Actions informed by Effectiveness Review and COVID-19 Learning Points
Governance Element/ Principle
Governance Improvement Actions Action Owner (Leadership Team)
Target Date
Strategic and Financial Planning – COVID-19 Recovery (Principle C, Defining outcomes, Principle E Developing Capacity and Capability)
Update of strategic planning tools to reflect COVID-19 recovery: Review and refresh the Council Plan informed by COVID-19
recovery and reform planning, for presentation to Council for approval in February 2021.
MTFS refresh for 2021/22 budget to accommodate revised income and expenditure forecasts.
Integrate Strategic Policies and Priority Outcomes Review and update Our People Strategy Delivery Plan
SD Resources February 2021

Warwickshire Pension Fund
Statement of Accounts
2019/20

Section D - Page 1
We would welcome any comments or suggestions you have about this publication. Please
send any comments or suggestions to [email protected]
If this information is difficult to understand, we can provide it in another format, for example,
in Braille, in large print, on audiotape, in another language or by talking with you.

Section D - Page 2
Contents
Independent Auditors’ Report………………………………………..……………...page 4
Statement of responsibilities for the statement of accounts…………………......page 8
Warwickshire Pension Fund Account………………………………………………page 9
Net Assets Statement……………………………………………………………......page 9
Notes to the Accounts:
Note 1: Description of fund……………………………………….…………….….page 10
Note 2: Basis of preparation…………………………………………..…………...page 12
Note 3: Summary of significant accounting policies…………….………..……..page 13
Note 4: Critical judgements in applying accounting policies……………………page 17
Note 5: Assumptions made about the future and other major sources of
estimation uncertainty………………………………………………………………page 18
Note 6: Events after the reporting date……………………………………………page 20
Note 7: Contributions receivable……………………………..……………………page 20
Note 8: Transfers in from other pension funds…………………………….….….page 21
Note 9: Benefits payable………………………………………………...…………page 21
Note 10: Payments to and on account of leavers……………………..…………page 21
Note 11: Management expenses………………………………………...………..page 21
Note 12: Investment management expenses…………………………………….page 22
Note 13: Investment income……..……………………………………….………..page 22
Note 14: Other fund account disclosures: external audit costs………..……….page 22
Note 15: Investments……….……..………………………………………………..page 23
Note 16: Reconciliation of movements in investments….……………..…...…..page 24
Note 17: Analysis of investments……….……………………..…………...……..page 25
Note 18: Investments analysed by fund manager…….……..…………………..page 26

Section D - Page 3
Note 19: Investments representing more than 5% net assets of the scheme
…………………………………………………………………………..…………….page 26
Note 20: Stock lending……………………………………..……………………….page 27
Note 21: Property holdings………………………………...……………………….page 27
Note 22: Classification of financial instruments………….………………………page 28
Note 23: Net gains and losses on financial instruments….……………………..page 29
Note 24: Valuation of financial instruments carried at fair value…….…………page 29
Note 25: Reconciliation of fair value measurements within Level 3…..…...…..page 32
Note 26: Nature and extent of risks arising from financial instruments………..page 33
Note 27: Funding arrangements…………………………………………….……..page 38
Note 28: Actuarial present value of promised retirement benefits……………..page 40
Note 29: Current assets………………………………………………………........page 43
Note 30: Current liabilities…………………………………………….……..……..page 43
Note 31: Additional voluntary contributions……………………….………..…….page 44
Note 32: Related party transactions……………………………….…….………..page 44
Note 33: Contingent Liabilities……………………………………………………..page 45
Glossary……………………………………………………………….……………..page 46
Note on rounding’s: individual tables presented within disclosures may not sum due to rounding’s. This does not reflect any inaccuracy or error.

Section D - Page 4
Independent auditor’s report to the members of Warwickshire County Council on the pension fund financial statements of Warwickshire Pension Fund
Opinion
We have audited the financial statements of Warwickshire Pension Fund (the ‘pension fund’) administered by Warwickshire County Council (the ‘Authority’) for the year ended 31 March 2020 which comprise the Warwickshire Pension Fund Account, the Net Assets Statement and Notes to the Warwickshire Pension Fund Accounts for the year ended 31 March 2020, including a summary of significant accounting policies. The financial reporting framework that has been applied in their preparation is applicable law and the CIPFA/LASAAC Code of Practice on Local Authority Accounting in the United Kingdom 2019/20.
In our opinion, the financial statements:
• give a true and fair view of the financial transactions of the pension fund during the year ended 31 March 2020 and of the amount and disposition at that date of the fund’s assets and liabilities
• have been properly prepared in accordance with the CIPFA/LASAAC Code of Practice on Local Authority Accounting in the United Kingdom 2019/20; and
• have been prepared in accordance with the requirements of the Local Audit and Accountability Act 2014.
Basis for opinion
We conducted our audit in accordance with International Standards on Auditing (UK) (ISAs (UK)) and applicable law. Our responsibilities under those standards are further described in the ‘Auditor’s responsibilities for the audit of the financial statements’ section of our report. We are independent of the Authority in accordance with the ethical requirements that are relevant to our audit of the pension fund’s financial statements in the UK, including the FRC’s Ethical Standard, and we have fulfilled our other ethical responsibilities in accordance with these requirements. We believe that the audit evidence we have obtained is sufficient and appropriate to provide a basis for our opinion.
The impact of macro-economic uncertainties on our audit
Our audit of the pension fund financial statements requires us to obtain an understanding of
all relevant uncertainties, including those arising as a consequence of the effects of macro-
economic uncertainties such as Covid-19 and Brexit. All audits assess and challenge the
reasonableness of estimates made by the Strategic Director for Resources and the related
disclosures and the appropriateness of the going concern basis of preparation of the financial
statements. All of these depend on assessments of the future economic environment.
Covid-19 and Brexit are amongst the most significant economic events currently faced by
the UK, and at the date of this report their effects are subject to unprecedented levels of
uncertainty, with the full range of possible outcomes and their impacts unknown. We applied
a standardised firm-wide approach in response to these uncertainties. However, no audit
should be expected to predict the unknowable factors or all possible future implications for a
fund associated with these particular events.

Section D - Page 5
Conclusions relating to going concern
We have nothing to report in respect of the following matters in relation to which the ISAs (UK) require us to report to you where:
• the Strategic Director for Resources use of the going concern basis of accounting in the preparation of the pension fund’s financial statements is not appropriate; or
• the Strategic Director for Resources has not disclosed in the pension fund’s financial statements any identified material uncertainties that may cast significant doubt about the Authority’s ability to continue to adopt the going concern basis of accounting for the pension fund for a period of at least twelve months from the date when the pension fund’s financial statements are authorised for issue.
In our evaluation of the Strategic Director for Resources conclusions, and in accordance with the expectation set out within the CIPFA/LASAAC Code of Practice on Local Authority Accounting in the United Kingdom 2019/20 that the pension fund financial statements shall be prepared on a going concern basis, we considered the risks associated with the pension fund's operating model, including effects arising from macro-economic uncertainties such as Covid-19 and Brexit, and analysed how those risks might affect the fund's financial resources or ability to continue operations over the period of at least twelve months from the date when the financial statements are authorised for issue. In accordance with the above, we have nothing to report in these respects.
However, as we cannot predict all future events or conditions and as subsequent events may result in outcomes that are inconsistent with judgements that were reasonable at the time they were made, the absence of reference to a material uncertainty in this auditor's report is not a guarantee that the fund will continue in operation.
Emphasis of Matter – effects of Covid-19 on the valuation of pooled property funds
We draw attention to Note 5: Assumptions made about the future and other major sources of
estimation uncertainty of the financial statements, which describes the effects of the Covid-19
pandemic on the valuation of the Fund’s two pooled property funds as at 31 March 2020. The
property funds’ valuers have stated that there is a material uncertainty about the valuations as
a result of Covid-19. The Fund has decided to use the valuer’s estimates as the best available
estimates of the values of the Fund’s assets as at 31 March 2020, but these estimates are
subject to greater uncertainty than in previous years. Our opinion is not modified in respect of
this matter.
Other information
The Strategic Director for Resources is responsible for the other information. The other information comprises the information included in the Statement of Accounts (sections B and D), the Narrative Report (section A) and the Annual Governance Statement (section C), other than the pension fund’s financial statements, our auditor’s report thereon and our auditor’s report on the Authority’s financial statements. Our opinion on the pension fund’s financial statements does not cover the other information and, except to the extent otherwise explicitly stated in our report, we do not express any form of assurance conclusion thereon.
In connection with our audit of the pension fund’s financial statements, our responsibility is to read the other information and, in doing so, consider whether the other information is materially inconsistent with the pension fund’s financial statements or our knowledge of the pension fund obtained in the audit or otherwise appears to be materially misstated. If we identify such material inconsistencies or apparent material misstatements, we are required to determine whether there is a material misstatement in the pension fund’s financial statements or a

Section D - Page 6
material misstatement of the other information. If, based on the work we have performed, we conclude that there is a material misstatement of this other information, we are required to report that fact.
We have nothing to report in this regard.
Opinion on other matter required by the Code of Audit Practice published by the National Audit Office on behalf of the Comptroller and Auditor General (the Code of Audit Practice)
In our opinion, based on the work undertaken in the course of the audit of the pension fund’s financial statements and our knowledge of the pension fund the other information published together with the pension fund’s financial statements in the Statement of Accounts (sections B and D), the Narrative Report (section A) and the Annual Governance Statement (section C) for the financial year for which the financial statements are prepared is consistent with the pension fund’s financial statements.
Matters on which we are required to report by exception
Under the Code of Audit Practice, we are required to report to you if:
• we issue a report in the public interest under section 24 of the Local Audit and Accountability Act 2014 in the course of, or at the conclusion of the audit; or
• we make a written recommendation to the Authority under section 24 of the Local Audit and Accountability Act 2014 in the course of, or at the conclusion of the audit; or
• we make an application to the court for a declaration that an item of account is contrary to law under Section 28 of the Local Audit and Accountability Act 2014 in the course of, or at the conclusion of the audit; or;
• we issue an advisory notice under Section 29 of the Local Audit and Accountability Act 2014 in the course of, or at the conclusion of the audit; or
• we make an application for judicial review under Section 31 of the Local Audit and Accountability Act 2014, in the course of, or at the conclusion of the audit.
We have nothing to report in respect of the above matters.
Responsibilities of the Authority, the Strategic Director for Resources and Those Charged with Governance for the financial statements
As explained more fully in the Statement of Responsibilities set out on page 8 in Section D, the Authority is required to make arrangements for the proper administration of its financial affairs and to secure that one of its officers has the responsibility for the administration of those affairs. In this Authority, that officer is the Strategic Director for Resources. The Strategic Director for Resources is responsible for the preparation of the Statement of Accounts, which includes the pension fund’s financial statements, in accordance with proper practices as set out in the CIPFA/LASAAC Code of Practice on Local Authority Accounting in the United Kingdom 2019/20, for being satisfied that they give a true and fair view, and for such internal control as the Strategic Director for Resources determines is necessary to enable the preparation of financial statements that are free from material misstatement, whether due to fraud or error.
In preparing the pension fund’s financial statements, the Strategic Director for Resources is responsible for assessing the pension fund’s ability to continue as a going concern, disclosing, as applicable, matters related to going concern and using the going concern basis of accounting unless there is an intention by government that the services provided by the pension fund will no longer be provided.

Section D - Page 7
The Authority is Those Charged with Governance. Those charged with governance are responsible for overseeing the Authority’s financial reporting process. In this authority the Audit & Standards Committee is charged with assisting it in meeting these responsibilities.
Auditor’s responsibilities for the audit of the financial statements
Our objectives are to obtain reasonable assurance about whether the pension fund’s financial statements as a whole are free from material misstatement, whether due to fraud or error, and to issue an auditor’s report that includes our opinion. Reasonable assurance is a high level of assurance, but is not a guarantee that an audit conducted in accordance with ISAs (UK) will always detect a material misstatement when it exists. Misstatements can arise from fraud or error and are considered material if, individually or in the aggregate, they could reasonably be expected to influence the economic decisions of users taken on the basis of these financial statements.
A further description of our responsibilities for the audit of the financial statements is located on the Financial Reporting Council’s website at: www.frc.org.uk/auditorsresponsibilities. This description forms part of our auditor’s report.
Use of our report
This report is made solely to the members of the Authority, as a body, in accordance with Part 5 of the Local Audit and Accountability Act 2014 and as set out in paragraph 43 of the Statement of Responsibilities of Auditors and Audited Bodies published by Public Sector Audit Appointments Limited. Our audit work has been undertaken so that we might state to the Authority’s members those matters we are required to state to them in an auditor's report and for no other purpose. To the fullest extent permitted by law, we do not accept or assume responsibility to anyone other than the Authority and the Authority's members as a body, for our audit work, for this report, or for the opinions we have formed.
Grant Patterson
Grant Patterson, Key Audit Partner for and on behalf of Grant Thornton UK LLP, Local Auditor Birmingham 27 October 2020

Section D - Page 8
Statement of responsibilities for the statement of accounts
This section explains our responsibilities for our financial affairs and how we ensure we carry
out these responsibilities properly in line with the Accounts and Audit (Coronavirus)
(Amendment) Regulations 2020 and the Accounts and Audit Regulations 2015.
Responsibilities of the Pension Fund
We do the following:
• make sure that one of our officers is responsible for managing our financial affairs.
For the Pension Fund, Warwickshire County Council’s Strategic Director for
Resources is responsible for this;
• manage our affairs to use our resources efficiently and effectively and to protect our
assets;
• comply with IFRS financial reporting framework; and
• approve the statement of accounts.
Responsibilities of the Strategic Director for Resources
As the Strategic Director for Resources, I am responsible for preparing our statement of
accounts. These accounts must present a true and fair view of our financial position,
including our income and spending for the year.
In preparing the Pension Fund accounts, I have:
• selected suitable accounting policies and applied them consistently;
• made reasonable and prudent judgements and estimates; and
• followed the Chartered Institute of Public Finance and Accountancy’s/LASAAC Code
of Practice on Local Authority Accounting in the United Kingdom (the Code).
I have also:
• kept proper accounting records which are up to date; and
• taken steps to prevent and detect fraud and other irregularities.
I certify that the Statement of Accounts presents a true and fair view of the financial position
as at the 31st March 2020 and the income and expenditure for the year ended 31st March
2020. The unaudited draft accounts were authorised for issue on 26th June 2020. These
were audited and were considered and approved at a meeting of the Council on 13th October
2020. The approved accounts were authorised for issue on that date.
Rob Powell
Strategic Director for Resources Date: 13th October 2020
Councillor Alan Cockburn
Chair of the Council Date: 13th October 2020

Section D - Page 9
Warwickshire Pension Fund Account 2018/2019 2019/2020
£ m Notes £ m
Dealings with members, employers and others directly involved in the Fund
(80.1) Contributions 7 (84.9)
(8.5) Transfers in from other schemes 8 (12.9)
(88.7) (97.8)
76.9 Benefits payable 9 80.7
7.9 Payments to and on account of leavers 10 12.0
84.8 92.7
(3.9) Net (additions)/withdrawals from dealing with members (5.1)
12.3 Management expenses 11 13.2
8.5 Net (additions)/withdrawals including fund management expenses 8.1
Returns on investments
(29.2) Investment income 13 (20.3)
0.5 Taxes on income (0.1)
(79.6) Profit and losses on disposal of investments 23 (306.7)
(33.7) Changes in the market value of investments 23 450.6
(141.9) Net return on investments 123.5
(133.4) Net (increase)/decrease in the net assets available for benefits during the year 131.6
(2,032.3) Opening net assets of the scheme (2,165.7)
(2,165.7) Closing net assets of the scheme (2,034.1)
Net Assets Statement 2018/2019 2019/2020
£ m Notes £ m
0.8 Long-term Assets 15 0.8 2,139.7 Investment assets 15/16/17 2,003.6
0.0 Investment liabilities 15 0.0
17.5 Cash deposits 15/16/17 20.9
2,158.0 Total net investments 2,025.4
11.5 Current assets 29 12.6 (3.8) Current liabilities 30 (3.8)
2,165.7 Net assets of the Fund available to fund benefits at the period end 2,034.1
The Fund’s financial statements do not take account of liabilities to pay pensions and other
benefits after the period end. The actuarial present value of promised retirement benefits is
disclosed in the Actuary Statement Note 28.

Section D - Page 10
Notes to the Warwickshire Pension Fund Accounts for the year ended
31 March 2020
Note 1: Description of fund
The Warwickshire Pension Fund (‘the Fund’) is part of the Local Government Pension
Scheme and is administered by Warwickshire County Council. The County Council is the
reporting entity for this pension fund.
The following description of the Fund is a summary only. For more detail, reference should
be made to the Warwickshire Pension Fund Annual Report 2019/20 and the underlying
statutory powers underpinning the scheme, namely the Public Service Pensions Act 2013
and The Local Government Pension Scheme (LGPS) Regulations.
a) General
The scheme is governed by the Public Service Pensions Act 2013. The Fund is
administered in accordance with the following secondary legislation:
- The Local Government Pension Scheme Regulations 2013 (as amended);
- The Local Government Pension Scheme (Transitional Provisions, Savings and
- Amendment) Regulations 2014 (as amended); and
- The Local Government Pension Scheme (Management and Investment of Funds)
Regulations 2016 (as amended).
It is a contributory defined benefit pension scheme administered by Warwickshire County
Council to provide pensions and other benefits for pensionable employees of
Warwickshire County Council, the district and borough councils in the county of
Warwickshire and a range of other scheduled and admitted bodies within the county
area. Teachers, police officers and firefighters are not included as they come within
other national pension schemes.
The Fund is overseen by the Warwickshire Pension Fund Investment Sub-Committee,
which is a Sub-Committee of Warwickshire County Council and is made up of five
County Councillors. Two independent specialists provide advice and guidance to the
Sub-Committee.
The Public Service Pensions Act 2013 included a requirement to establish a Local
Pension Board, with responsibility to assist the administering authority to:
• secure compliance with; the LGPS regulations; other legislation relating to the governance and administration of the LGPS and; the requirements imposed by the Pension Regulator in relation to the LGPS; and
• perform an oversight role to ensure the effective and efficient governance and administration of the LGPS.
A Local Pension Board has been in place since February 2015.

Section D - Page 11
b) Membership
Membership of the LGPS is automatic for entitled employees, but they are free to
choose whether to join the scheme, remain in the scheme or make their own personal
arrangements outside the scheme.
Organisations participating in the Warwickshire Pension Fund include:
- scheduled bodies, which are local authorities and similar bodies whose staff are
automatically entitled to be members of the Fund; and
- admitted bodies, which are other organisations that participate in the Fund under an
admission agreement between the Fund and the relevant organisation. Admitted
bodies include voluntary, charitable and similar bodies or private contractors
undertaking a local authority function following outsourcing to the private sector.
There are 190 employer organisations with active members within Warwickshire Pension
Fund including the county council itself, as detailed below.
Warwickshire Pension Fund 31 March 2019 31 March 2020
Number of employers with active members 192 190
Number of employees in scheme
County Council 8,303 7,930
Other employers 8,755 8,786
Total 17,058 16,716
Number of pensioners
County Council 7,706 8,039
Other employers 5,970 6,355
Total 13,676 14,394
Deferred pensioners
County Council 10,680 11,262
Other employers 7,128 7,659
Total 17,808 18,921
Total 48,542 50,031
c) Funding
Benefits are funded by contributions and investment earnings. Contributions are made
by active members of the Fund in accordance with The LGPS Regulations 2013 and
range from 5.5% to 12.5% of pensionable pay for the financial year ending 31 March
2020. Contributions are also made by employers which are set based on triennial
actuarial funding valuations. The last valuation was at 31 March 2019 and a revised
schedule of employer contribution rates became effective for the three years from 1 April
2020.

Section D - Page 12
d) Benefits
Prior to 1 April 2014, pension benefits under the LGPS were based on final pensionable
pay and length of pensionable service, summarised in the following table.
Service pre 1 April 2008 Service post 31 March 2008 Pension Each year worked is
worth 1/80 x final pensionable salary
Each year worked is worth 1/60 x final pensionable salary
Lump Sum Automatic lump sum of 3 x pension
No automatic lump sum
In addition, part of the annual pension can be exchanged for a one-off tax-free cash payment. A lump sum of £12 is paid for each £1 of pension given up.
Part of the annual pension can be exchanged for a one-off tax-free cash payment. A lump sum of £12 is paid for each £1 of pension given up.
From 1 April 2014, the scheme became a career average scheme, whereby members
accrue benefits based on their pensionable pay in that year at an accrual rate of 1/49th.
Accrued pension is updated annually in line with the Consumer Prices Index. The
changes also brought in a 50/50 option allowing members the opportunity to contribute
50% for 50% of the benefit entitlement.
Contributions to the LGPS prior to 1 April 2014 were assessed on full-time equivalent
pay and excluded non-contractual elements of pay such as overtime and bonus.
However, contributions since 1 April 2014 are assessed on all pensionable pay received
including non-contractual elements. In addition, the contribution bandings were extended
with many of the higher paid seeing an increase in contributions.
There are a range of other benefits provided under the scheme including early
retirement, disability pensions and death benefits.
Note 2: Basis of preparation
The Statement of Accounts summarises the Fund’s transactions for the 2019/20 financial
year and its position at year-end as at 31 March 2020. The accounts have been
prepared in accordance with the Code of Practice on Local Authority Accounting in the
United Kingdom 2019/20 which is based upon International Financial Reporting
Standards (IFRS), as amended for the UK public sector. They have been prepared on a
going concern basis in accordance with IAS1.
The accounts summarise the transactions of the Fund and report on the net assets
available to pay pension benefits. The accounts do not take account of obligations to
pay pensions and benefits which fall due after the end of the financial year. This is
addressed by the actuary’s triennial valuation.

Section D - Page 13
Note 3: Summary of significant accounting policies
a) Contribution income
Normal contributions, both from the members and from the employer, are accounted for
on an accruals basis at the percentage rate recommended by the fund actuary in the
period to which they relate.
Employer deficit, augmentation and pension strain contributions are accounted for in the
period in which the liability arises. Any amount due in year but unpaid will be classed as
a current financial asset.
b) Transfers to and from other schemes
Transfer values represent the amounts received and paid during the year for members
who have either joined or left the Fund during the financial year and are calculated in
accordance with The Local Government Pension Scheme Regulations (see notes 8 and
10). This is normally when the member liability is accepted or discharged.
c) Investment income
i) Interest Income
Interest income is recognised in the fund account as it accrues, using the effective
interest rate of the financial instrument as at the date of acquisition or origination.
Income includes the amortisation of any discount or premium, transaction costs
(where material) or other differences between the initial carrying amount of the
instrument and its amount at maturity calculated on an effective interest rate basis.
ii) Dividend income
Dividend income is recognised on the date the shares are quoted ex-dividend.
Any amount not received by the end of the reporting period is reflected within
investment assets in the Net Assets Statement. Investment income arising from
the underlying investments of the Pooled Investment Vehicles is either reinvested
within the Pooled Investment Vehicles and reflected in the unit price or taken as
dividends.
iii) Distributions from managed funds
Distributions from managed funds are recognised at the date of issue. Any
amount not received by the end of the reporting period is reflected within
investment assets in the Net Assets Statement.
iv) Profit and losses on disposal of investments
Profit and losses on the disposal of investments are recognised as income and
comprise all realised profits/losses during the year.
v) Movement in the market value of investments
Section D - Page 14
Changes in the market value of investments are recognised as income and
comprise all unrealised profits/losses during the year.
d) Benefits payable
Pensions and lump-sum benefits payable include all amounts known to be due as at the
end of the financial year. And amounts due but unpaid are disclosed in the Net Assets
Statement as current liabilities.
e) Taxation
The Fund is a registered public service scheme under section 1(1) of Schedule 36 of the
Finance Act 2004 and as such is exempt from UK income tax on interest received and
from capital gains tax on the proceeds of investments sold. Income from overseas
investments suffers withholding tax in the country of origin, unless exemption is
permitted. Irrecoverable tax is accounted for as a fund expense as it arises.
f) Management expenses
The Code does not require a breakdown of pension fund administration expenses.
However, in the interests of greater transparency, the council discloses its pension fund
management expenses in accordance with the CIPFA guidance Accounting for Local
Government Pension Scheme Management Costs.
Administrative expenses
All administrative expenses are accounted for on an accrual basis. All staff costs of the
pension’s administration team and associated accounting, management, accommodation
and other overheads are apportioned and charged as expenses to the Fund.
Oversight and governance costs
All oversight and governance expenses are accounted for on an accrual basis. All costs
associated with governance and oversight are charged direct to the Fund. Associated
management, accommodation and other overheads are apportioned to this activity and
charged as expenses to the Fund.
Investment management expenses
All investment management expenses are accounted for on an accrual basis.
Fees of the external investment managers and custodian are agreed in the respective
mandates governing their appointments. Broadly, these are based on the market value
of the investments under their management and therefore increase or reduce as the
value of these investments change. Where these are deducted at source (as opposed
to being charged via an invoice) the fee is identified and a journal posted to record the
investment management fee and increase the investment income.
g) Investment assets
Investment in the LGPS asset pool, Border to Coast Pensions Partnership, is valued
at transaction price i.e. cost. The pool’s main trading company, Border to Coast

Section D - Page 15
Pensions Partnership Limited, became licensed to trade in July 2018 and does not
have established trading results or profit forecasts available yet.
The Pension Fund’s view is that the market value of investments in the Border to
Coast Pension Partnership at 31 March 2020 cannot be reasonably assessed and that
cost is therefore an appropriate estimate of fair value.
All other investment assets are included in the net assets statement on a fair value
basis as at the reporting date. An investment asset is recognised in the net asset
statement on the date the Fund becomes party to the contractual acquisition of the
asset. From this date, any gains or losses arising from changes in the fair value of the
asset are recognised in the Fund.
The values of investments as shown in the net assets statement have been
determined at fair value in accordance with the requirements of the Code and IFRS13
(see Pension Fund Note 24).For the purposes of disclosing levels of fair value
hierarchy, the Fund has adopted the classification guidelines recommended in
Practical Guidance on Investment Disclosures(PRAG/Investment Association, 2016).
The values of investments as shown in the Net Assets Statement have been determined
as follows:
i) Market-quoted investments
The value of an investment for which there is a readily available market price is
determined by the bid market price on the final day of the accounting period.
ii) Fixed interest securities Are recorded at net market value based on their current yields.
iii) Unquoted investments
The fair value of investments for which market quotations are not readily available is
determined as follows:
- directly held investments include investments in limited partnerships, shares in
unlisted companies, trusts and bonds. Other unquoted securities typically include
pooled investments in property, infrastructure, debt securities and private equity.
The valuation of these is undertaken by the investment manager or responsible
entity and advised as a unit or security price. The valuation standards followed in
these valuations adhere to industry guidelines or to standards set by the
constituent documents of the pool or to the management agreement;
- investments in unquoted property and infrastructure pooled funds are valued at
the net asset value or a single price advised by the fund manager; and
- investments in private equity funds and unquoted listed partnerships are valued
based on the fund’s share of the net assets in the private equity fund or limited
partnership using the latest financial statements published by the respective fund

Section D - Page 16
managers in accordance with the International Private Equity and Venture Capital
Valuation Guidelines 2018.
iv) Limited partnerships
Fair value is based on the net asset value ascertained from periodic valuations
provided by those controlling the partnership.
v) Pooled investment vehicles
Pooled investment vehicles are valued at closing bid price if both bid and offer
prices are published; if single priced, at the closing single price.
In the case of pooled investment vehicles that are accumulation funds, change in
market value also includes income, which is reinvested in the Fund net of
applicable withholding tax.
h) Foreign currency transactions
Dividends, interest and purchases and sales of investments in foreign currencies have
been accounted for at the spot market rates at the date of transaction. End-of-year spot
market exchange rates are used to value cash balances held in foreign currency bank
accounts, market values of overseas investments and purchases and sales outstanding
at the end of the reporting period.
i) Cash and cash equivalents
Cash comprises cash in hand and on demand deposits and includes amounts held by
the fund’s external managers.
Cash equivalents are short-term, highly liquid investments that are readily convertible to
known amounts of cash and that are subject to minimal risk of changes in value.
j) Investment Liabilities
The Fund recognises investment liabilities at fair value as at the reporting date. An
investment liability is recognised on the date the Fund becomes party to the liability and
are summarised in Note 15. From this date any gains or losses arising from changes in
the fair value of the liability are recognised by the Fund.
k) Actuarial present value of promised retirement benefits
The actuarial present value of promised retirement benefits is assessed on a triennial
basis by the scheme actuary in accordance with the requirements of IAS19 and relevant
actuarial standards. The last triennial valuation was carried out as at 31st March 2019.
As permitted under the Code, the Fund has opted to disclose the actuarial present value
of promised retirement benefits by way of a note to the Net Assets Statement (Note 28).
l) Additional Voluntary Contributions
Section D - Page 17
Warwickshire Pension Fund provides an additional voluntary contributions (AVCs)
scheme for its members, the assets of which are invested separately from those of the
pension fund. The Fund has appointed Equitable Life and Standard Life as its AVC
providers. AVCs are paid to the AVC provider by employers and are specifically for
providing additional benefits for individual contributors. Each AVC contributor receives
an annual statement showing the amount held in their account and movements in the
year.
AVCs are not included in the accounts in accordance with section 4(1)(b) of The Local
Government Pension Scheme (Management and Investment of Funds) Regulations
2016 but are disclosed as a note only (Note 31).
j) Financial Instruments
A financial instrument is any contract that gives rise to a financial asset of one entity and
a financial liability or equity instrument of another. The term, 'financial instrument' covers
both financial assets and financial liabilities and includes financial assets and liabilities
such as trade receivables and trade payables.
IFRS 13 Fair Value Measurement - The standard provides a consistent definition of fair
value and enhanced disclosure requirements. It is designed to apply to assets and
liabilities covered by those IFRS standards that currently permit or require measurement
at fair value (with some exceptions). The Fund currently complies with this standard.
Note 4: Critical judgements in applying accounting policies
Pension fund liability
The pension fund liability is calculated every three years by the appointed actuary, with
annual updates in the intervening years. The methodology used is in line with accepted
guidelines and in accordance with IAS 19. Assumptions underpinning the valuations are
agreed with the actuary and are summarised in Note 27. This estimate is subject to
significant variances based on changes to the underlying assumptions.
The McCloud and Sargeant judgements upheld the claimant’s cases that the method of
implementation of the new public sector pension schemes discriminated against younger
members. No allowance has been made for this in the accounts as the remedy to
resolve the age discrimination has yet to be agreed and the financial impact remains
uncertain. However, the fund actuary has included an allowance for the impact of
McCloud in Note 28 within the fund liabilities.
Investment in Border to Coast Pensions Partnership
This investment has been valued at cost on the basis that fair value as at 31 March 2020
cannot be reasonably assessed as set out under Note 3.

Section D - Page 18
Impact of COVID-19
The impact of COVID-19 has been felt throughout the Fund. The Fund has exposure to
several Property and Infrastructure funds which have experienced some uncertainty
surrounding their valuations. The Fund has decided to use the investment managers'
valuations as the most reasonable available estimates of the values of these assets as at
31 March 2020, but these estimates are subject to greater uncertainty than in previous
years. Transactions in the market have been limited due to the lockdown therefore
valuers have not been able to rely on previous market experience. Most Property funds
have suspended trading to protect the interest of investors during this time. As a result,
the valuations presented in the accounts as at 31 March 20 are based on less certainty.
Note 5: Assumptions made about the future and other major sources of
estimation uncertainty
The preparation of financial statements requires management to make judgements,
estimates and assumptions that affect the amounts reported for assets and liabilities at
the Balance Sheet date and the amounts reported for the revenues and expenses during
the year. Estimates and assumptions are made taking into account historical
experience, current trends and other relevant factors. However, the nature of estimation
means that the actual outcomes could differ from the assumptions and estimates.
The items in the accounts as at 31 March 2020 for which there is a significant
risk of material adjustment in the forthcoming financial year are as follows:

Section D - Page 19
Uncertainties Effect if actual results differ from assumptions
Actuarial present value of promised retirement benefits
Estimation of the net liability to pay pensions depends on a number of complex judgements relating to the discount rate used, the rate at which salaries are projected to increase, changes in retirement ages, mortality rates and expected returns on pension fund assets. A firm of consulting actuaries is engaged to provide the Fund with expert advice about the assumptions to be applied.
The effects on the net pension liability of changes in individual assumptions can be measured. For instance: - a 0.5% decrease in the discount rate assumption would result in an increase in the pension liability of £294m - a 0.5% increase in assumed earnings inflation would increase the value of liabilities by approximately £27m, and - a one-year increase in assumed life expectancy would increase the liability by approximately 3-5%.
Private equity, Infrastructure and Private Debt
These investments are valued at fair value in accordance with International Private Equity and Venture Capital Valuation Guidelines 2018 and US GAAP. These investments are not publicly listed and as such there is a degree of estimation involved in the valuation. Due to the current Coronavirus pandemic, there is a risk that the valuation of these investments may have an increased level of uncertainty. There are a wide range of possible outcomes, resulting in a high degree of uncertainty.
The total value of Level 3 investments stand at £271.7m. There is a risk that this investment may be under or overstated in the accounts. The custodian reports a tolerance of +/- 2% around the net asset values on which the valuation is based. This equates to a tolerance of +/- £5.4m.
Pooled property funds
Valuation techniques are used to determine the carrying amount of pooled property funds and directly held freehold and leasehold property. Where possible these valuation techniques are based on observable data but where this is not possible management uses the best available data. As a result of the coronavirus pandemic, the valuation of these funds have therefore been reported on the basis of “material valuation uncertainty” as set out in Valuation Practice Guidance Application (VGPA) 10 of the Royal Institute of Chartered Surveyors’ Global Valuation Standards. Therefore the value of units may vary somewhat from the valuations in the accounts. Both property funds (Threadneedle and Schroders) suspended trading in March 2020. Threadneedle lifted some sector specific property trading suspensions in September 2020.
The Fund holds two property mandates managed by Schroders and Threadneedle. These are classified as Level 2 investments in the accounts. The materiality limit for the Fund accounts is £20m. The estimated value of these property funds at the balance sheet date was £217.4m. Therefore, for a material issue to be caused by the valuation of these funds, a movement of over 9.2% in their value would need to occur. Updated valuations have been received up to August 2020 and these do not show material differences in valuation from March 2020.

Section D - Page 20
Note 6: Events after the reporting date
Events from the balance sheet date to the date of authorisation for issue would be
reflected as an adjustment to The Statement of Accounts whether favourable or
adverse. This would occur where there was provision of evidence that these
conditions were in place by the end of the reporting period and that these events
were significant to the fair value of the Fund’s net assets. Those events taking
place after the date of authorisation for issue will not be reflected in the statement
of accounts.
In June 2020, Northumberland Pension Fund and Tyne and Wear Pension
Fund, two of the twelve partners in the Border to Coast Pension Partnership,
merged into a single fund. This merger reduced the number of partners within the
partnership from 12 to 11 and required a redistribution of share capital to reflect the
new arrangements, with Northumberland being repaid its £866k capital and the
other 11 partners making equal contributions of £76k each to replace this.
There has been significant volatility in markets since the 31st March 2020. Although
markets fell significantly before the end of the financial year they have since
recovered to some degree. The total Fund asset valuation reported as at Quarter 1
2020/21 to the Pension Fund Investment Sub Committee having risen by £203m
due to returns on investments.
Note 7: Contributions receivable
By category
2018/2019 2019/2020
£ m £ m
17.2 Employees' contributions 18.2
Employer's contributions:
58.0 Normal contributions 60.3
4.8 Deficit Recovery contributions 6.5
62.9 Total employer's contributions 66.8
80.1 84.9
By authority
2018/2019 2019/2020
£ m £ m
36.9 Administering authority 39.3
39.7 Scheduled bodies 42.8
3.4 Admitted bodies 2.7
0.1 Bodies no longer contributing 0.1
80.1 84.9

Section D - Page 21
Note 8: Transfers in from other pension funds
2018/2019 2019/2020
£ m £ m
0.7 Group transfers 0.7
7.8 Individual transfers 12.2
8.5 12.9
Note 9: Benefits payable
By category
2018/2019 2019/2020
£ m £ m
62.1 Pensions 65.6
13.3 Commutation and lump sum retirement benefits 13.3
1.5 Lump sum death benefits 1.8
76.9 80.7
By authority
2018/2019 2019/2020
£ m £ m
41.8 Administering authority 43.2
30.7 Scheduled bodies 32.7
3.7 Admitted bodies 4.0
0.8 Bodies no longer contributing 0.9
76.9 80.7
Note 10: Payments to and on account of leavers
2018/2019 2019/2020
£ m £ m
0.3 Refunds 0.4
0.0 Group transfers 0.0
7.7 Individual transfers 11.7
7.9 12.0
Note 11: Management expenses
2018/2019 2019/2020
£ m £ m
1.3 Administration costs 1.6
10.0 Investment management expenses 10.6
1.0 Oversight and governance costs 1.0
12.3 13.2
This analysis of the costs of managing the Warwickshire Pension Fund during the period has
been prepared in accordance with CIPFA guidance.
Indirect costs are incurred through the bid-offer spread on investment sales and purchases.
These are reflected in the cost of investment acquisitions and in the proceeds from the sale
of investments (Note 16 and Note 25).
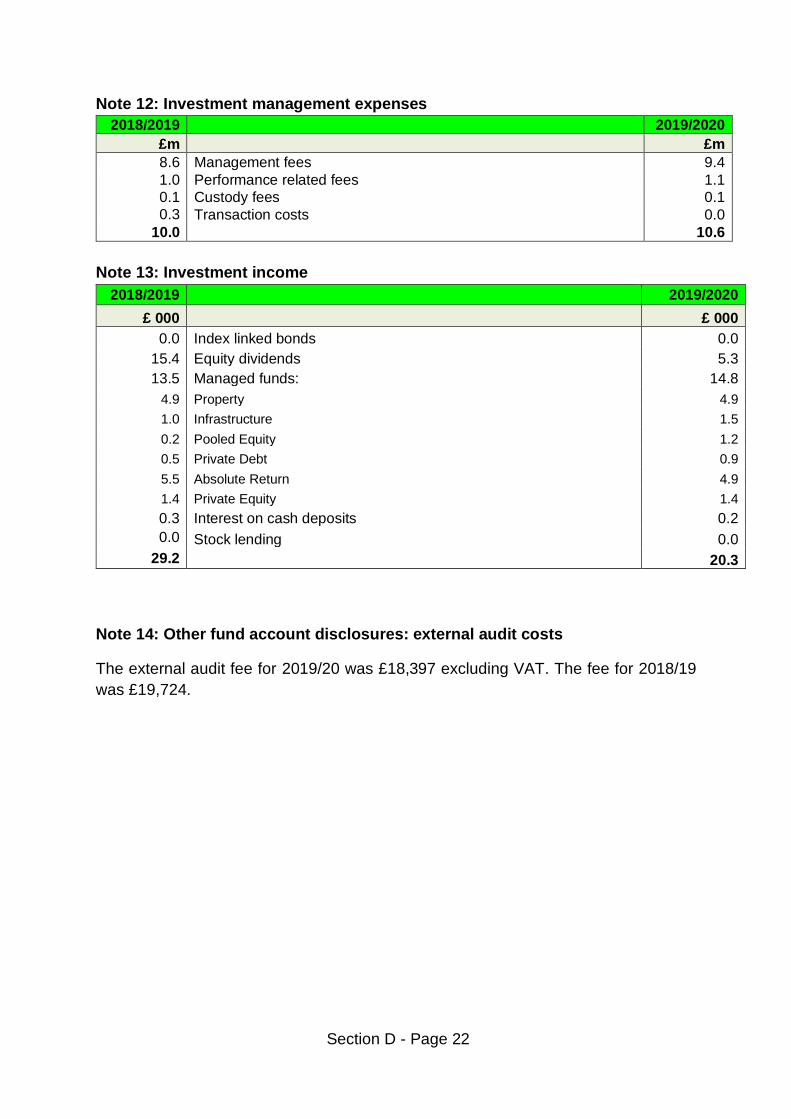
Section D - Page 22
Note 12: Investment management expenses
2018/2019 2019/2020
£m £m
8.6 Management fees 9.4
1.0 Performance related fees 1.1
0.1 Custody fees 0.1
0.3 Transaction costs 0.0
10.0 10.6
Note 13: Investment income
2018/2019 2019/2020
£ 000 £ 000
0.0 Index linked bonds 0.0
15.4 Equity dividends 5.3
13.5 Managed funds: 14.8
4.9 Property 4.9
1.0 Infrastructure 1.5
0.2 Pooled Equity 1.2
0.5 Private Debt 0.9
5.5 Absolute Return 4.9
1.4 Private Equity 1.4
0.3 Interest on cash deposits 0.2
0.0 Stock lending 0.0
29.2 20.3
Note 14: Other fund account disclosures: external audit costs
The external audit fee for 2019/20 was £18,397 excluding VAT. The fee for 2018/19
was £19,724.
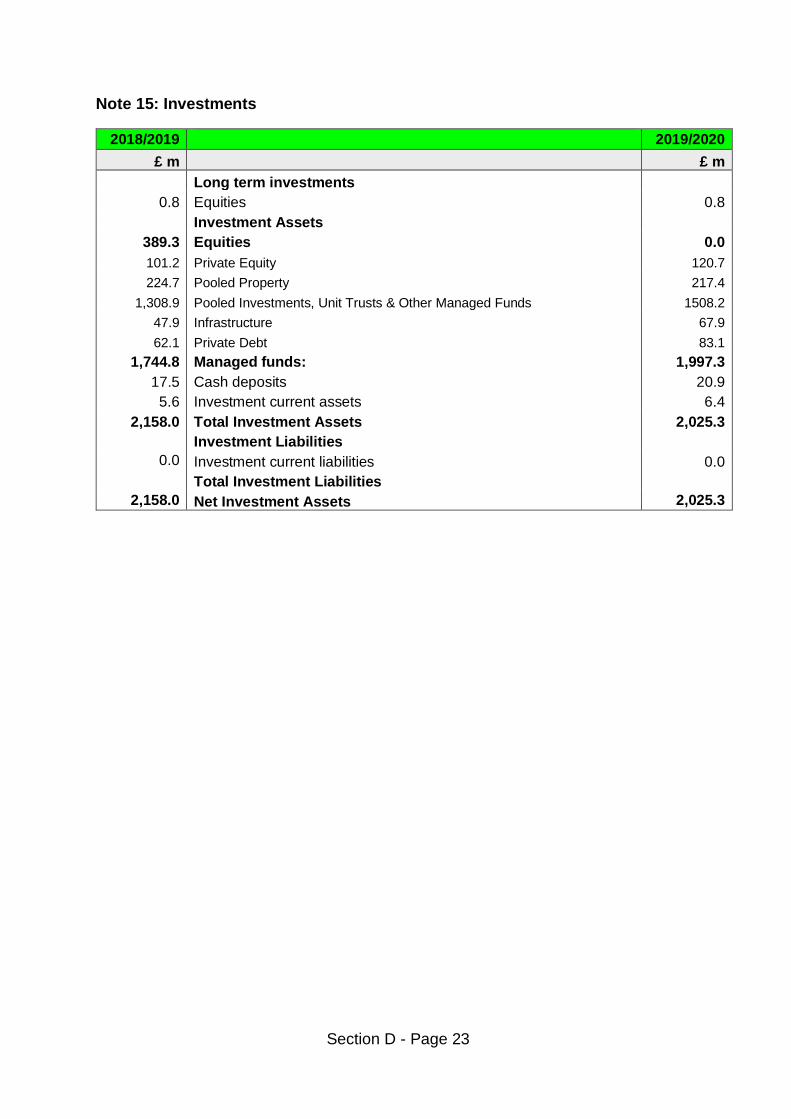
Section D - Page 23
Note 15: Investments
2018/2019 2019/2020
£ m £ m
Long term investments
0.8 Equities 0.8
Investment Assets
389.3 Equities 0.0
101.2 Private Equity 120.7
224.7 Pooled Property 217.4
1,308.9 Pooled Investments, Unit Trusts & Other Managed Funds 1508.2
47.9 Infrastructure 67.9
62.1 Private Debt 83.1
1,744.8 Managed funds: 1,997.3
17.5 Cash deposits 20.9
5.6 Investment current assets 6.4
2,158.0 Total Investment Assets 2,025.3
Investment Liabilities
0.0 Investment current liabilities 0.0
Total Investment Liabilities
2,158.0 Net Investment Assets 2,025.3

Section D - Page 24
Note 16: Reconciliation of movements in investments
Market
value 31 March
2019
Purchases during the
year
Sales during the
year
Change in market
value during the
year
Market value
31 March 2020
£ m £ m £ m £ m £ m
Investment Assets
Equities 390.1 13.8 -446.6 43.5 0.8
Private Equity 101.2 14.8 -17.7 22.3 120.7
Pooled Property 224.7 12.8 -10.3 -9.8 217.4
Pooled Investments, Unit Trusts & Other Managed Funds 1,308.9 874.5 -463.0 -212.3 1508.2
Infrastructure 47.9 14.5 -0.7 6.3 67.9
Private Debt 62.1 22.8 -5.7 3.8 83.1
Managed funds: 1,744.8 939.5 -497.4 -189.7 1,997.3
Other Investment Balances
Cash deposits 17.5 59.9 -56.9 0.4 20.9
Net investment current assets 5.6 0.5 0.0 0.3 6.4
Net Investment Assets 2,158.0 1,013.7 -1,000.8 -145.5 2,025.3
Market value
31 March 2018
Purchases during the
year
Sales during the
year
Change in market
value during the
year
Market value
31 March 2019
£ m £ m £ m £ m £ m
Investment Assets
Equities 638.3 78.8 -361.4 34.5 390.1
Private Equity 78.1 17.1 -15.9 21.9 101.2
Pooled Property 207.8 13.3 -3.7 7.3 224.7
Pooled Investments, Unit Trusts & Other Managed Funds 996.3 574.4 -305.3 43.5 1308.9
Infrastructure 31.9 16.1 -2.5 2.5 47.9
Private Debt 0.0 60.2 -0.2 2.1 62.1
Managed funds: 1,314.1 681.0 -327.6 77.4 1,744.8
Other Investment Balances 0.0 0.0
Cash deposits 73.7 80.3 -137.0 0.4 17.5
Net investment current assets 11.2 0.1 -5.8 0.1 5.6
Net Investment Assets 2,037.3 840.2 -831.9 112.4 2,158.0

Section D - Page 25
Note 17: Analysis of investments
31 March 2019
31 March 2020
£ m £ m
Equities
0.8 UK 0.8
389.3 Overseas 0.0
390.1 0.8
Managed funds
224.4 Pooled Property 217.4
1,308.9 Pooled Investments, Unit Trusts & Other Managed Funds 1508.2
17.7 Infrastructure 24.0
1,551.0 UK: 1,749.5
62.1 Private Debt 83.1
101.2 Private Equity 120.7
0.3 Pooled Property 0.1
30.2 Infrastructure 44.0
193.8 Overseas: 247.8
1,744.8 1,997.3
Cash deposits
11.2 UK Sterling 20.4
6.3 Foreign currency 0.5
17.5 20.9
5.6 Net investment current assets/(liabilities) 6.4
2,158.0 Net Investment Assets 2,025.3
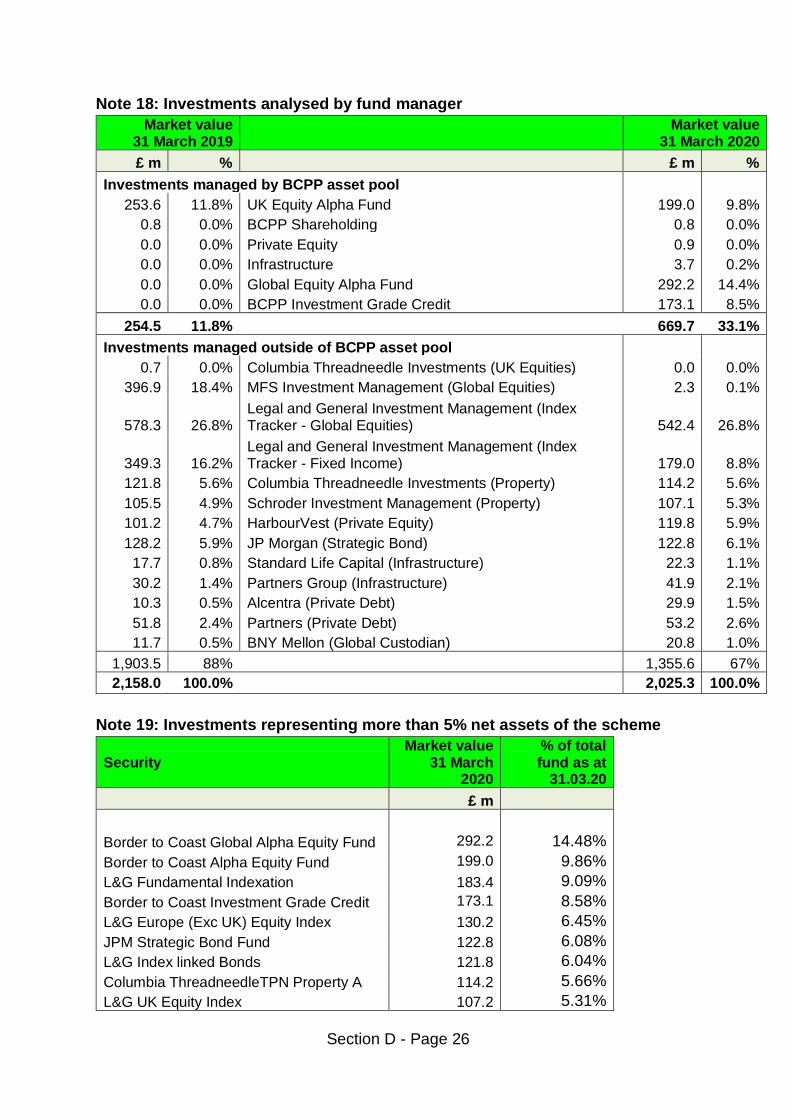
Section D - Page 26
Note 18: Investments analysed by fund manager
Market value 31 March 2019
Market value 31 March 2020
£ m % £ m %
Investments managed by BCPP asset pool
253.6 11.8% UK Equity Alpha Fund 199.0 9.8%
0.8 0.0% BCPP Shareholding 0.8 0.0%
0.0 0.0% Private Equity 0.9 0.0%
0.0 0.0% Infrastructure 3.7 0.2%
0.0 0.0% Global Equity Alpha Fund 292.2 14.4%
0.0 0.0% BCPP Investment Grade Credit 173.1 8.5%
254.5 11.8% 669.7 33.1%
Investments managed outside of BCPP asset pool
0.7 0.0% Columbia Threadneedle Investments (UK Equities) 0.0 0.0%
396.9 18.4% MFS Investment Management (Global Equities) 2.3 0.1%
578.3 26.8% Legal and General Investment Management (Index Tracker - Global Equities) 542.4 26.8%
349.3 16.2% Legal and General Investment Management (Index Tracker - Fixed Income) 179.0 8.8%
121.8 5.6% Columbia Threadneedle Investments (Property) 114.2 5.6%
105.5 4.9% Schroder Investment Management (Property) 107.1 5.3%
101.2 4.7% HarbourVest (Private Equity) 119.8 5.9%
128.2 5.9% JP Morgan (Strategic Bond) 122.8 6.1%
17.7 0.8% Standard Life Capital (Infrastructure) 22.3 1.1%
30.2 1.4% Partners Group (Infrastructure) 41.9 2.1%
10.3 0.5% Alcentra (Private Debt) 29.9 1.5%
51.8 2.4% Partners (Private Debt) 53.2 2.6%
11.7 0.5% BNY Mellon (Global Custodian) 20.8 1.0%
1,903.5 88% 1,355.6 67%
2,158.0 100.0% 2,025.3 100.0%
Note 19: Investments representing more than 5% net assets of the scheme
Security Market value
31 March 2020
% of total fund as at
31.03.20
£ m
Border to Coast Global Alpha Equity Fund 292.2 14.48%
Border to Coast Alpha Equity Fund 199.0 9.86%
L&G Fundamental Indexation 183.4 9.09%
Border to Coast Investment Grade Credit 173.1 8.58%
L&G Europe (Exc UK) Equity Index 130.2 6.45%
JPM Strategic Bond Fund 122.8 6.08%
L&G Index linked Bonds 121.8 6.04%
Columbia ThreadneedleTPN Property A 114.2 5.66%
L&G UK Equity Index 107.2 5.31%
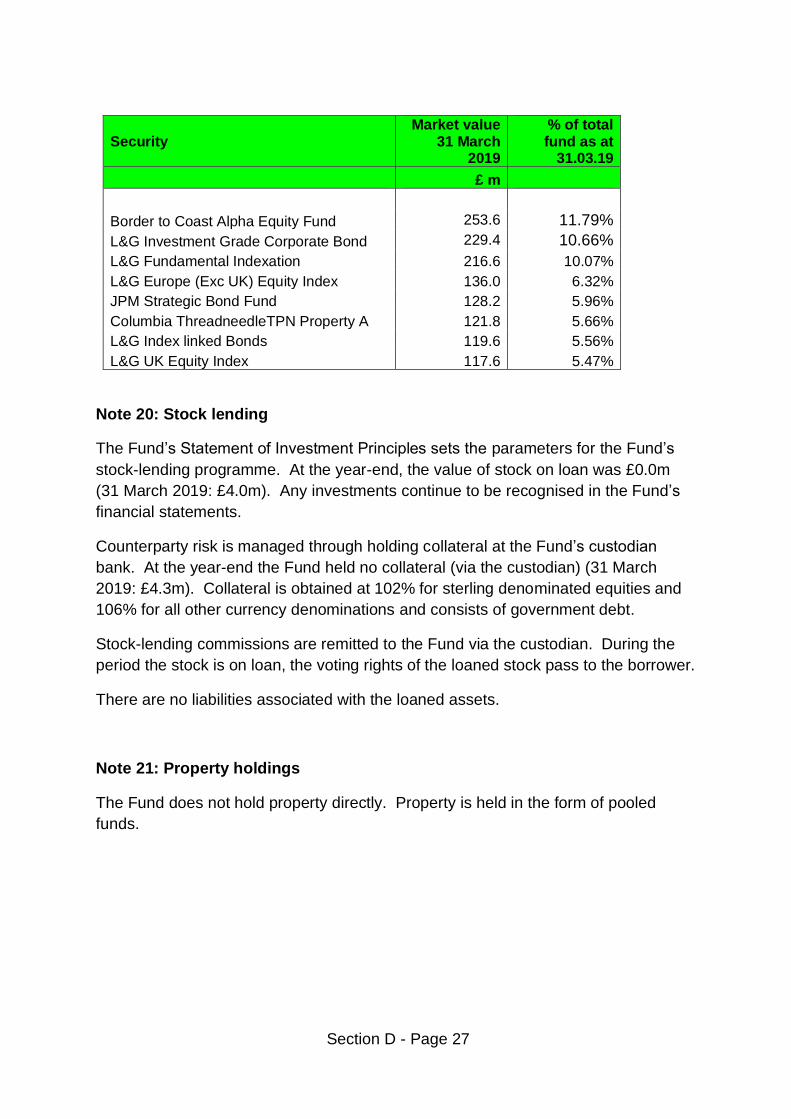
Section D - Page 27
Security Market value
31 March 2019
% of total fund as at
31.03.19
£ m
Border to Coast Alpha Equity Fund 253.6 11.79%
L&G Investment Grade Corporate Bond 229.4 10.66%
L&G Fundamental Indexation 216.6 10.07%
L&G Europe (Exc UK) Equity Index 136.0 6.32%
JPM Strategic Bond Fund 128.2 5.96%
Columbia ThreadneedleTPN Property A 121.8 5.66%
L&G Index linked Bonds 119.6 5.56%
L&G UK Equity Index 117.6 5.47%
Note 20: Stock lending
The Fund’s Statement of Investment Principles sets the parameters for the Fund’s
stock-lending programme. At the year-end, the value of stock on loan was £0.0m
(31 March 2019: £4.0m). Any investments continue to be recognised in the Fund’s
financial statements.
Counterparty risk is managed through holding collateral at the Fund’s custodian
bank. At the year-end the Fund held no collateral (via the custodian) (31 March
2019: £4.3m). Collateral is obtained at 102% for sterling denominated equities and
106% for all other currency denominations and consists of government debt.
Stock-lending commissions are remitted to the Fund via the custodian. During the
period the stock is on loan, the voting rights of the loaned stock pass to the borrower.
There are no liabilities associated with the loaned assets.
Note 21: Property holdings
The Fund does not hold property directly. Property is held in the form of pooled
funds.

Section D - Page 28
Note 22: Classification of financial instruments
Accounting policies describe how different asset classes of financial instruments are
measured, and how income and expenses, including fair value gains and losses, are
recognised. The following table analyses the carrying amounts of financial assets
and liabilities (excluding cash) by category and Net Assets Statement heading. No
financial assets were reclassified during the accounting period.
Fair value through
profit and loss
Financial assets at amortised
cost
Financial liabilities
at amortised
cost
Fair value through
profit and loss
Financial assets at amortised
cost
Financial liabilities
at amortised
cost
31 March 2019 31 March 2020
£ m £ m £ m £ m £ m £ m
Investment Assets
390.1 Equities 0.8
101.2 Private Equity 120.7
224.7 Pooled Property 217.4
1,308.9
Pooled Investments, Unit Trusts & Other Managed Funds 1,508.2
47.9 Infrastructure 67.9
62.1 Private Debt 83.1
1,744.8 Managed funds: 1,997.3
17.5 Cash deposits 20.9
5.6 Investment current assets 6.4
9.8 Debtors 9.0
1.7 Cash balances 3.6
2,134.9 34.5 0.0 1,998.1 39.8 0.0
Liabilities
0.0 Investment current liabilities 0.0
-3.8 Creditors -3.8
0.0 0.0 -3.8 0.0 0.0 -3.8
2,134.9 34.5 -3.8 1,998.1 39.8 -3.8

Section D - Page 29
Note 23: Net gains and losses on financial instruments
31 March 2019
31 March 2020
£ m £ m
Financial Assets
113.2 Fair value through profit and loss 306.7
0.0 Loans and receivables 0.0
Financial liabilities
0.0 Fair value through profit and loss -450.6
0.0 Loans and receivables 0.0
113.2 Total -143.9
The authority has not entered into any financial guarantees that are required to be
accounted for as financial instruments.
Note 24: Valuation of financial instruments carried at fair value
The Unquoted equities holding in Border to Coast Pensions Partnership is valued at
cost (i.e. transaction price), as an appropriate estimate of fair value. A fair value
cannot be otherwise established for these assets as at 31 March 2020 because the
main trading vehicle of Border to Coast Pensions Partnership only became licenced
to trade in July 2018 and the reliability of any observable or unobservable inputs
used to calculate fair value cannot as yet be assessed with certainty.
All other investments are held at fair value in accordance with the requirements of
the Code and IFRS13. The basis of the valuation of each class of investment asset
is set out below. There has been no change in the valuation techniques used during
the year.
All assets have been valued using fair value techniques based on the characteristics
of each instrument, with the overall objective of maximising the use of market-based
information.
The valuation of financial instruments has been classified into three levels, according
to the quality and reliability of information used to determine fair values.
Level 1
Financial instruments at level 1 are those where the fair values are derived from
unadjusted quoted prices in active markets for identical assets or liabilities. Products
classified as level 1 comprise quoted equities, quoted fixed securities, quoted index
linked securities and unit trusts.
Listed investments are shown at bid prices. The bid value of the investment is based
on the bid market quotation of the relevant stock exchange

Section D - Page 30
Level 2
Financial instruments at level 2 are those where quoted market prices are not
available; for example, where an instrument is traded in a market that is not
considered to be active, or where valuation techniques are used to determine fair
value, these inputs are observable. Products classified as level 2 include unquoted
bonds and overseas unit trusts and property funds.
Level 3
Financial instruments at level 3 are those where at least one input that could have a
significant effect on the instrument’s valuation is not based on observable market
data.
Such instruments would include unquoted equity and debt investments, which are
valued using various valuation techniques that require significant judgement in
determining appropriate assumptions.
The values of the investment in private equity, infrastructure and private debt are
based on valuations provided by the general partners to the funds in which
Warwickshire Pension Fund has invested.
These valuations are prepared in accordance with the International Private Equity
and Venture Capital Valuation Guidelines, which follow the valuation principles of
IFRS and US GAAP. Valuations are undertaken quarterly and an adjustment is
made to roll forward the latest available valuation to 31 March as appropriate.
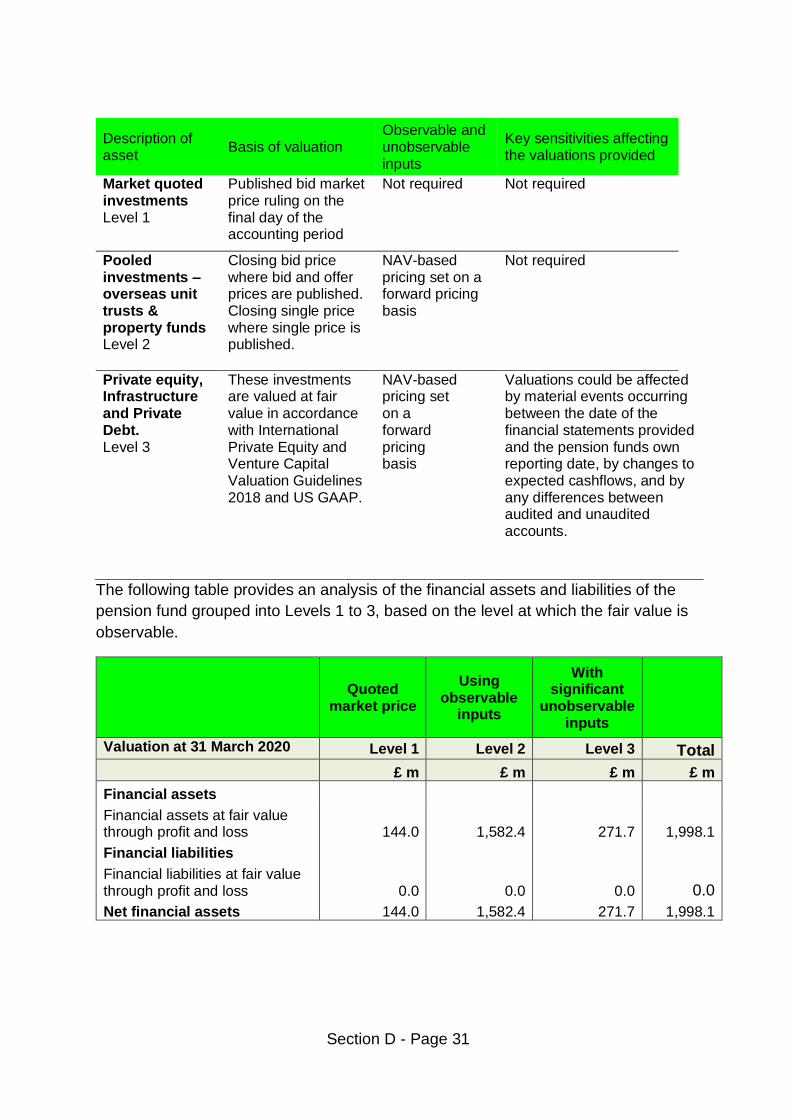
Section D - Page 31
The following table provides an analysis of the financial assets and liabilities of the
pension fund grouped into Levels 1 to 3, based on the level at which the fair value is
observable.
Quoted market price
Using observable
inputs
With significant
unobservable inputs
Valuation at 31 March 2020 Level 1 Level 2 Level 3 Total
£ m £ m £ m £ m
Financial assets
Financial assets at fair value through profit and loss 144.0 1,582.4 271.7 1,998.1
Financial liabilities
Financial liabilities at fair value through profit and loss 0.0 0.0 0.0 0.0
Net financial assets 144.0 1,582.4 271.7 1,998.1
Description of asset
Basis of valuation Observable and unobservable inputs
Key sensitivities affecting the valuations provided
Market quoted investments Level 1
Published bid market price ruling on the final day of the accounting period
Not required Not required
Pooled investments – overseas unit trusts & property funds Level 2
Closing bid price where bid and offer prices are published. Closing single price where single price is published.
NAV-based pricing set on a forward pricing basis
Not required
Private equity, Infrastructure and Private Debt. Level 3
These investments are valued at fair value in accordance with International Private Equity and Venture Capital Valuation Guidelines 2018 and US GAAP.
NAV-based pricing set on a forward pricing basis
Valuations could be affected by material events occurring between the date of the financial statements provided and the pension funds own reporting date, by changes to expected cashflows, and by any differences between audited and unaudited accounts.

Section D - Page 32
Quoted market price
Using observable
inputs
With significant
unobservable inputs
Valuation at 31 March 2019 Level 1 Level 2 Level 3 Total
£ m £ m £ m £ m
Financial assets
Financial assets at fair value through profit and loss 528.7 1,394.2 211.2 2,134.1
Financial liabilities
Financial liabilities at fair value through profit and loss 0.0 0.0 0.0 0.0
Net financial assets 528.7 1,394.2 211.2 2,134.1
The following assets have been carried at cost:
Quoted market price
Using observable
inputs
With significant
unobservable inputs
Valuation at 31 March 2020 Level 1 Level 2 Level 3 Total
£ m £ m £ m £ m
Investment in Border to Coast
Pensions Partnership 0.8 0.8
Investments held at cost
Note 25 Reconciliation of fair value measurements within Level 3
Market value
31 March 2019
Purchases during the
year
Sales during the
year
Change in market value
during the year
Realised profit or loss (-)
during the year
Market value
31 March 2020
£ m £ m £ m £ m £ m £ m
Private Debt 62.1 22.8 -5.7 4.8 -1.0 83.1
Private Equity 101.2 14.8 -17.7 13.4 9.0 120.7
Infrastructure 47.9 14.5 -0.7 1.3 5.0 67.9
211.2 52.2 -24.2 19.5 13.0 271.7

Section D - Page 33
Note 26: Nature and extent of risks arising from financial instruments
Risk and risk management
The Fund’s primary long-term risk is that the Fund’s assets will fall short of its
liabilities (i.e. promised benefits payable to members). Therefore, the aim of
investment risk management is to minimise the risk of an overall reduction in the
value of the Fund and to maximise the opportunity for gains across the whole fund
portfolio. The Fund achieves this through asset diversification to reduce exposure to
market risk (price risk, currency risk and interest rate risk) and credit risk to an
acceptable level. In addition, the Fund manages its liquidity risk to ensure there is
sufficient liquidity to meet the Fund’s forecast cash flows. The Council manages
these investment risks as part of its overall pension fund risk management
programme.
Responsibility for the Fund’s risk management strategy rests with the Pension Fund
Investment Sub-Committee. Risk management policies are established to identify
and analyse the risks faced by the Council’s pensions operations. Policies are
reviewed regularly to reflect changes in activity and in market conditions.
Market risk
Market risk is the risk of loss from fluctuations in equity and commodity prices,
interest and foreign exchange rates and credit spreads. The Fund is exposed to
market risk from its investment activities, particularly through its equity holdings. The
level of risk exposure depends on market conditions, expectations of future price and
yield movements and the asset mix.
The objective of the Fund’s risk management strategy is to identify, manage and
control market risk exposure within acceptable parameters, whilst optimising the
return on risk.
In general, excessive volatility in market risk is managed through the diversification
of the portfolio in terms of geographical and industry sectors and individual
securities. To mitigate market risk, the council and its investment advisors undertake
appropriate monitoring of market conditions and benchmark analysis.
The Fund manages these risks in two ways:
• the exposure of the Fund to market risk is monitored through a factor risk
analysis, to ensure that risk remains within tolerable levels; and
• specific risk exposure is limited by applying risk-weighted maximum
exposures to individual investments.
It is possible for over-the-counter equity derivative contracts to be used in
exceptional circumstances to manage specific aspects of market risk.

Section D - Page 34
Other price risk
Other price risk represents the risk that the value of a financial instrument will
fluctuate as a result of changes in market prices (other than those arising from
interest rate risk or foreign exchange risk), whether those changes are caused by
factors specific to the individual instrument or its issuer or factors affecting all such
instruments in the market.
The Fund is exposed to share price risk. This arises from investments held by the
Fund for which the future price is uncertain. All securities investments present a risk
of loss of capital.
The Fund’s investment managers mitigate this price risk through diversification and
the selection of securities and other financial instruments is monitored to ensure it is
within limits specified in the Fund’s investment strategy.
Following analysis of historical data and expected investment return movement, the
Fund has determined that the following movements in market price risk were
reasonably possible for the 2019/20 reporting period. This analysis assumes that all
other variables, in particular foreign currency exchange rates and interest rates,
remain the same.
Asset Type 2019/20 Potential market movement
%
UK Pooled Funds 27%
Overseas Pooled Funds 28%
Total Bonds, Index Linked & Pooled Managed Funds 10%
Cash 0%
Property 14%
Alternatives 11%
The potential price changes disclosed above are broadly consistent with a one-year
dispersion in the value of the assets and are based on observed historical volatility of
the returns of the asset class.
Had the market price of the Fund investments increased/decreased in line with the
above, the change in the net assets available to pay benefits would have been as
follows (the prior year comparator is shown below):
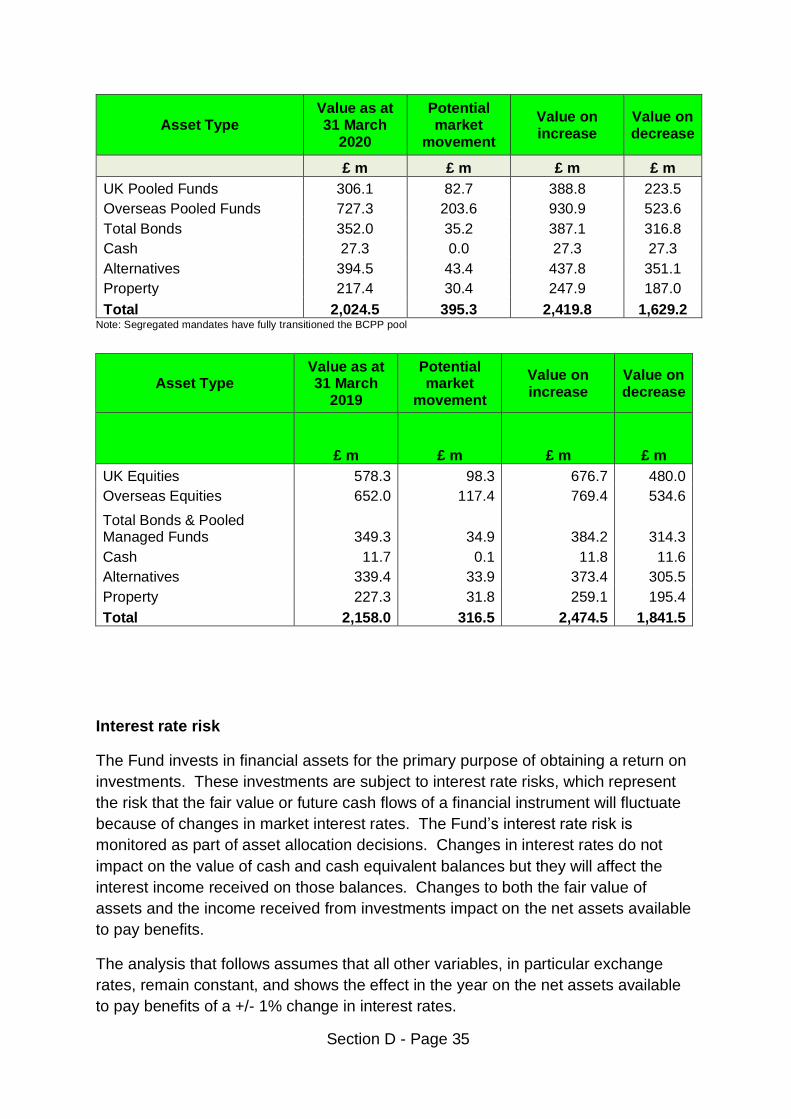
Section D - Page 35
Asset Type Value as at 31 March
2020
Potential market
movement
Value on increase
Value on decrease
£ m £ m £ m £ m
UK Pooled Funds 306.1 82.7 388.8 223.5
Overseas Pooled Funds 727.3 203.6 930.9 523.6
Total Bonds 352.0 35.2 387.1 316.8
Cash 27.3 0.0 27.3 27.3
Alternatives 394.5 43.4 437.8 351.1
Property 217.4 30.4 247.9 187.0
Total 2,024.5 395.3 2,419.8 1,629.2 Note: Segregated mandates have fully transitioned the BCPP pool
Asset Type Value as at 31 March
2019
Potential market
movement
Value on increase
Value on decrease
£ m £ m £ m £ m
UK Equities 578.3 98.3 676.7 480.0
Overseas Equities 652.0 117.4 769.4 534.6
Total Bonds & Pooled Managed Funds 349.3 34.9 384.2 314.3
Cash 11.7 0.1 11.8 11.6
Alternatives 339.4 33.9 373.4 305.5
Property 227.3 31.8 259.1 195.4
Total 2,158.0 316.5 2,474.5 1,841.5
Interest rate risk
The Fund invests in financial assets for the primary purpose of obtaining a return on
investments. These investments are subject to interest rate risks, which represent
the risk that the fair value or future cash flows of a financial instrument will fluctuate
because of changes in market interest rates. The Fund’s interest rate risk is
monitored as part of asset allocation decisions. Changes in interest rates do not
impact on the value of cash and cash equivalent balances but they will affect the
interest income received on those balances. Changes to both the fair value of
assets and the income received from investments impact on the net assets available
to pay benefits.
The analysis that follows assumes that all other variables, in particular exchange
rates, remain constant, and shows the effect in the year on the net assets available
to pay benefits of a +/- 1% change in interest rates.

Section D - Page 36
Asset Type Duration Value as at 31 March
2020
Value on 1%
increase
Value on 1% decrease
Years £ m £ m £ m
LGIM UK Corporate Bonds 7.6 57.1 52.7 61.4 LGIM UK Index Linked 21.4 121.8 95.7 147.9
JPM Absolute Return Bonds 8.5 122.8 112.4 133.2 BCPP IGC 3.1 173.1 167.7 178.4 Total 474.7 428.5 521.0
Asset Type Duration Value as at 31 March
2019
Value on 1%
increase
Value on 1% decrease
Years £ m £ m £ m
LGIM UK Corporate Bonds 7.9 229.4 211.2 247.5
LGIM UK Index Linked 22.1 119.6 93.1 146.0 JPM Absolute Return Bonds 1.5 128.2 126.3 130.1
Total 477.1 430.7 523.6
Currency risk
Currency risk represents the risk that the fair value of future cash flows of a financial
instrument will fluctuate because of changes in foreign exchange rates. The Fund is
exposed to currency risk on financial instruments that are denominated in any
currency other than the functional currency of the Fund (£UK). The Fund holds both
monetary and non-monetary assets denominated in currencies other than £UK. Our
investment adviser has provided an estimate of 10% volatility for a pooled overseas
fund.
A strengthening/weakening of the pound against the various currencies in which the
Fund holds investments would increase/decrease the net assets available to pay
benefits as follows. This analysis assumes that all other variables, in particular
interest rates, remain constant. The prior year comparator is shown below and based
7on the Funds segregated overseas mandate which has now transitioned to the
BCPP pool:
Value as at
31 March 2020
Potential market
movement
Value on increase
Value on decrease
£ m £ m £ m £ m
Overseas Pooled Funds 727.3 72.7 800.0 654.6
Total 727.3 72.7 800.0 654.6 Note: Segregated mandates have fully transitioned the BCPP pool

Section D - Page 37
Currency Value as at
31 March 2019
Potential market
movement
Value on increase
Value on decrease
£ m £ m £ m £ m
Czech Republic Koruna 0.0 0.0 0.0 0.0
Danish Krone 2.7 0.2 3.0 2.5
Euro 136.4 12.3 148.6 124.1
Japanese Yen 10.8 1.4 12.2 9.4
Mexican Peso 1.0 0.1 1.2 0.9
Swedish Krona 9.2 0.9 10.0 8.3
Swiss Franc 30.2 3.4 33.6 26.8
Thai Baht 0.8 0.1 0.9 0.7
US Dollar 307.0 30.1 337.1 276.9
Hong Kong Dollar 0.7 0.1 0.8 0.7
Total 498.8 48.6 547.4 450.3
Credit risk
Credit risk represents the risk that the counterparty to a transaction will fail to
discharge an obligation and cause the Fund to incur a financial loss. The market
values of investments generally reflect an assessment of credit in their pricing and
consequently the risk of loss is implicitly provided for in the carrying value of the
Fund’s financial assets and liabilities.
In essence the Fund’s entire investment portfolio is exposed to some form of credit
risk. However, the selection of high-quality counterparties and financial institutions
minimises credit risk that may occur through the failure to settle a transaction in a
timely manner.
The Pension Fund is exposed to credit risk through the stock lending programme.
This is managed by the custodian who monitors the counterparty and collateral risk.
The level of collateral for stock on loan is assessed daily to ensure it takes account
of market movements. To mitigate risk, stock lending is restricted to 25% of the total
market value of the stock held, in accordance with investment regulations.
Liquidity risk
Liquidity risk represents the risk that the Fund will not be able to meet its financial
obligations as they fall due. The Pension Fund therefore takes steps to ensure that it
has adequate cash resources to meet its commitments, particularly cash to meet
pensioner payroll and other benefit costs, and cash to meet investment
commitments.

Section D - Page 38
The Pension Fund has immediate access to its cash holdings and has had a long-
term positive cash flow. Cash flow surpluses are invested with fund managers. The
Pension Fund is authorised to borrow on a short-term basis to fund cash flow
deficits.
The actuary to the Pension Fund produces regular cash flow forecasts which are
presented to the Investment Sub-Committee.
All financial liabilities as at 31 March 2020 are due within one year.
Note 27: Funding arrangements
In line with The Local Government Pension Scheme Regulations 2013, the Fund’s
actuary undertakes a funding valuation every three years for the purpose of setting
employer contribution rates for the forthcoming triennial period. The last such
valuation took place as at 31 March 2019 and set contribution rates for the three
years commencing 1 April 2020.
The key elements of the funding policy are:
▪ to ensure the long-term solvency of the Fund, i.e. that sufficient funds are
available to meet all pension liabilities as they fall due for payment;
▪ to ensure that employer contribution rates are as stable as possible;
▪ to minimise the long-term cost of the scheme by recognising the link between
assets and liabilities and adopting an investment strategy that balances risk
and return;
▪ to reflect the different characteristics of employing bodies in determining
contribution rates where the administering authority considers it reasonable to
do so; and
▪ to use reasonable measures to reduce the risk to other employers and
ultimately to the council taxpayer from an employer defaulting on its pension
obligations.
The aim is to achieve 100% solvency over a period of 19 years and to provide
stability in contribution rates by spreading any increases in rates over a period of
time. Normally this is three years but, in some cases, an extended period can be
granted. Solvency is achieved when the funds held, plus future expected investment
returns and future contributions are sufficient to meet expected future pension
benefits payable. When an employer’s funding level falls significantly short of the
100% funding target, then a deficit recovery plan will be put in place requiring
additional contributions from the employer to meet the shortfall.
At the 2019 actuarial valuation, the Fund was assessed as 92% funded. This
corresponded to a deficit of £180m.

Section D - Page 39
Contribution increases were phased in over the three-year period ending 31 March
2023. The common contribution rate (i.e. the rate which all employers in the Fund
pay) is as follows.
Valuation Date 31-Mar-19
Total contribution rate
Primary Rate (% of pay) 20.1%
2018/19 Secondary Rate £000 60.71
2018/19 Secondary Rate £000 62.51
2019/20 Secondary Rate £000 64.36
Individual employer rates will vary from the common contribution rate depending on
the demographic and actuarial factors particular to each employer. Full details of the
contribution rates payable can be found in the 2019 actuarial valuation report and the
funding strategy statement on the Fund’s website.
The valuation of the Fund has been undertaken using the projected unit method
under which the salary increase for each member is assumed to increase until they
leave active service by death, retirement or withdrawal from service. The principal
assumptions are as follows:
Financial assumptions
Financial assumptions Nominal Real
% %
Post Retirement Discount Rate 3.7% 1.4%
Pre Retirement Discount Rate 3.7% 1.4%
Salary Increases 3.1% 0.8%
Price Inflation/Pension Increases 2.3% -
Demographic assumptions
Assumed life expectancy from age 65 is as follows.
Demographic assumptions 31 March 2019
Assumed life expectancy at age 65 Male Female
Pensioners 21.6 23.8
Non-pensioners 22.5 25.4
Commutation assumptions
It is assumed that future retirees will take 50% of the maximum additional tax-free
lump sum up to HMRC limits for pre-April 2008 service and 75% of the maximum for
post-April 2008 service.
50:50 Option
1.0% of members (uniformly distributed across the age, service and salary range) will choose the 50:50 option.

Section D - Page 40
Note 28: Actuarial present value of promised retirement benefits
28.1 Report from Fund Actuaries
In addition to the triennial funding valuation, the fund’s actuary also undertakes a
valuation of the pension fund liabilities, on an IAS19 basis, every year using the
same base data as the funding valuation rolled forward to the current financial year,
taking account of changes in membership numbers and updating assumptions to the
current year. This valuation is not carried out on the same basis as that used for
setting fund contribution rates and the Fund accounts do not take account of
liabilities to pay pensions and other benefits in the future.
In order to assess the value of the benefits on this basis, the actuary has updated
the actuarial assumptions (set out below) from those used for funding purposes (see
Note 24). The following is the full Pension Fund Accounts Reporting Requirement
provided by the fund actuary.
Introduction
CIPFA's Code of Practice on Local Authority Accounting 2019/20 requires Administering Authorities of LGPS funds that prepare pension fund accounts to disclose what IAS26 refers to as the actuarial present value of promised retirement benefits. I have been instructed by the Administering Authority to provide the necessary information for the Warwickshire Pension Fund (“the Fund”). The actuarial present value of promised retirement benefits is to be calculated similarly to the Defined Benefit Obligation under IAS19. There are three options for its disclosure in the pension fund accounts: • showing the figure in the Net Assets Statement, in which case it requires the statement to disclose the resulting surplus or deficit;
• as a note to the accounts; or
• by reference to this information in an accompanying actuarial report. If an actuarial valuation has not been prepared at the date of the financial
statements, IAS26 requires the most recent valuation to be used as a base and the
date of the valuation disclosed. The valuation should be carried out using
assumptions in line with IAS19 and not the Fund’s funding assumptions.

Section D - Page 41
31 March 2019
31 March 2020
£m £m
1,593 Active members 1,167
670 Deferred pensioners 651
948 Pensioners 1089
(3,211) Present value of promised retirement benefits (£m) (2,907)
2,166 Fair Value if scheme assets (bid value) (£m) 2,025
(1,045) Net Liability (882)
The fair value of scheme assets (bid value) figure as at 31 March 2020 has been provided by the Administering Authority and is as disclosed in the Fund’s 2019/20 accounts.
The promised retirement benefits at 31 March 2020 have been projected using a roll forward approximation from the latest formal funding valuation as at 31 March 2019. The approximation involved in the roll forward model means that the split of benefits between the three classes of member may not be reliable. However, I am satisfied that the total figure is a reasonable estimate of the actuarial present value of benefit promises. Note that the above figures at 31 March 2020 include an allowance for the “McCloud ruling”, i.e. an estimate of the potential increase in past service benefits arising from this case affecting public service pension schemes. The figures include both vested and non-vested benefits, although the latter is assumed to have a negligible value. Further, I have not made any allowance for unfunded benefits. It should be noted the above figures are appropriate for the Administering Authority only for preparation of the pension fund accounts. They should not be used for any other purpose (i.e. comparing against liability measures on a funding basis or a cessation basis). Assumptions The assumptions used are those adopted for the Administering Authority’s IAS19
report and are different as at 31 March 2020 and 31 March 2019. I estimate that the
impact of the change in financial assumptions to 31 March 2020 is to decrease the
actuarial present value by £275m. I estimate that the impact of the change in
demographic and longevity assumptions is to decrease the actuarial present value
by £90m.
Financial assumptions
Year ended (% p.a.) 31 March 20 31 March 19
% %
Inflation/pensions increase rate 1.9% 2.5%
Salary increase rate 2.7% 3.1%
Discount rate 2.3% 2.4%

Section D - Page 42
Longevity assumptions
Life expectancy is based on the Fund's VitaCurves with improvements in line with
the CMI 2018 model, an allowance for smoothing of recent mortality experience and
a long-term rate of 1.25% p.a.. Based on these assumptions, the average future life
expectancies at age 65 are summarised below:
Males Females
Current pensioners 21.6 years 23.8 years
Future pensioners (assumed to be aged 45 at the latest formal valuation) 22.5 years 25.4 years
Please note that the longevity assumptions have changed since the previous IAS26
disclosure for the Fund.
Commutation assumptions
An allowance is included for future retirements to elect to take 50% of the maximum
additional tax-free cash up to HMRC limits for pre-April 2008 service and 75% of the
maximum tax-free cash for post-April 2008 service.
Sensitivity analysis
CIPFA guidance requires the disclosure of the sensitivity of the results to the
methods and assumptions used. The sensitivities regarding the principal
assumptions used to measure the liabilities are set out below:
Sensitivity to the assumptions for the year ended 31 March 2020
Approximate % increase to
liabilities
Approximate monetary
amount (£m)
0.5% p.a. increase in the Pension Increase Rate 9% 275
0.5% p.a. increase in the Salary Increase Rate 1% 27
0.5% p.a. decrease in the Real Discount Rate 10% 294
The principal demographic assumption is the longevity assumption. For sensitivity
purposes, I estimate that a 1-year increase in life expectancy would approximately
increase the liabilities by around 3-5%.
Professional notes
This paper accompanies my covering report titled ‘Actuarial Valuation as at 31 March
2020 for accounting purposes’. The covering report identifies the appropriate
reliance’s and limitations for the use of the figures in this paper, together with further
details regarding the professional requirements and assumptions.

Section D - Page 43
Prepared by:-
Robert Bilton
23 April 2020
For and on behalf of Hymans Robertson LLP
28.2 Other Notes
In July 2020 a consultation on the remedy to a legal ruling (“McCloud”) that
transitional protections introduced when the Local Government Pension Scheme
was changed in 2014 were unlawful on the ground of age discrimination was
launched. The impact of this is uncertain both in terms of future changes to benefits
payable to individuals and the resulting financial impact for the authority. Initial high
level estimates indicate this is unlikely to be a material figure.
In June 2020 a tribunal ruled that amendments to the Teachers Pension Scheme
were discriminatory against survivors of female members. There is a likelihood that
any remedy would eventually also impact upon the LGPS. The issue would impact
on a small scale, impacting survivors or female members who were in the scheme
prior to 1998 who died after 2005. The detailed financial impact and the timing are
currently uncertain.
Note 29: Current assets
31 March 2019
31 March 2020
£m £m
Debtors:
1.4 Contributions due: Employees 1.2
6.1 Contributions due: Employers 5.7
1.7 Invoiced debtors 1.6
0.6 Sundry debtors 0.6
1.7 Cash balances 3.6
11.5 Total 12.6
Note 30: Current liabilities
31 March 2019
31 March 2020
£m £m
Liabilities:
1.0 Owed to administering authority 1.5
1.6 Sundry Creditors 1.5
1.1 Benefits Payable 0.9
3.8 Total 3.8

Section D - Page 44
Note 31: Additional Voluntary Contributions
31 March 2019
31 March 2020
£m £m
2.6 Standard Life 2.4
0.2 Utmost Life and Pensions* 0.2
2.8 Total 2.7
*AVCs previously held with Equitable Life now managed by Utmost Life and Pensions
31 March 2018
31 March 2019
£m £m
2.5 Standard Life 2.6
0.2 Equitable Life 0.2
2.8 Total 2.8
AVC contributions of £2.4m were paid directly to Standard Life and £0.2m was paid
directly to Utmost Life and Pensions during the year (2018/19: £2.5m to Standard
Life and £0.2m to Equitable Life).
Note 32: Related Party Transactions
Warwickshire County Council
The Warwickshire Pension Fund is administered by Warwickshire County Council.
Consequently, there is a strong relationship between the council and the pension
fund.
During the reporting period, the council incurred costs of £1,244,413 (2018/19:
£892,212) in relation to the administration of the Fund and was subsequently
reimbursed by the Fund for these expenses. The council is also the single largest
employer of members of the pension fund. Employee and employer contributions
from the council amounted to £39.9m in 2019/20 (£36.9m in 2018/19).
Border to Coast Pensions Partnership
The Warwickshire Pension Fund, through Warwickshire County as the Administering
Authority, is a shareholder in the Border to Coast Pension Partnership Limited. The
Partnership is a wholly owned private limited company registered in England and
Wales founded to carry out pension fund asset pooling obligations set out by the
Government. The company provides the facility to pool the pension fund investments
of 12 local authorities in order to gain the benefits of economies of scale,
concentration of expertise and improved ability to reduce investment costs. The
company was incorporated in 2017/18 and the first transfers of investment assets

Section D - Page 45
into the pool occurred in 2018/19. As at the balance sheet date all 12 partners own
an equal 1/12th share of the company.
The Border to Coast Pension Partnership is a joint venture that brings risks as well as benefits. The partnership has grown significantly, for example in terms of the value of assets under management and the number of personnel employed. Pooling and membership of the Border to Coast Pension Partnership is a regular and high profile feature of reporting to the Pension Fund Investment Sub Committee and the Fund's risk register has regard to key pooling risks.
Governance
There are two members of the Pension Fund Investment Sub-Committee who are in
receipt of pension benefits from the Warwickshire Pension Fund
Each member of the Pension Fund Investment Sub-Committee is required to declare
their interests at each meeting.
There are three members of the Local Pension Board who are active members of the
Warwickshire Pension Fund.
Key management personnel
Several employees of Warwickshire County Council hold key positions in the
financial management of the Warwickshire Pension Fund, alongside responsibilities
for Warwickshire County Council directly. The posts of Head of Resources,
Assistant Director, Finance Manager and Technical Specialist are considered to be
key management personnel. These employees and their financial relationship with
the Fund are set out below.
2019/20 2018/19
£000 £000
Short-term benefits 108.0 109.5
Post-employment benefits 103 -298
Note: Post-employment benefits have been calculated on an IAS19 basis.
18/19 figures have been restated to reflect this. Year 18/19
shows a fall in post retirement benefits following departure of two KMP in year
who were not replaced until 19/20 and 20/21.
Note 33: Contingent Liabilities and Contractual Commitments
Outstanding capital commitments at 31 March 2020 totalled £302.6m. Of this,
£108.7 related to Private Equity, £135.9 related to Infrastructure, £23m related to
Private Debt and £35m related to Private Credit.

Section D - Page 46
Glossary
A
Actuarial valuation
A review of the assets and liabilities of a pension fund to determine the surplus or deficit, and
the future rate of contributions required.
Alternative investments
Investments other than the mainstream asset classes of equities and bonds. Alternatives
include hedge funds, private equity, infrastructure and commodities. Property is also
sometimes described as an alternative.
Asset allocation
The apportionment of a fund’s assets between different asset classes.
B
Benchmark
A yardstick against which the investment policy or performance of a fund manager can be
compared.
C
Currency risk
Investing in any securities not denominated in the investor’s own base currency introduces
currency risk due to the volatility of foreign exchange rates.
D
Defined benefit scheme
A type of pension scheme where the pension that will ultimately be paid to the employee is
fixed, usually as a percentage of final salary. It is the responsibility of the sponsoring
organisation to ensure that sufficient assets are set aside to meet the pension promised.
Compare with defined contribution scheme.
Diversification
The spreading of investment funds among different types of assets, markets and
geographical areas in order to reduce risk.
H
Hedge Funds
A hedge fund is a capital pool that has the ability to use leverage and to take both long and
short positions with the aim of achieving an absolute return. A large variety of hedge fund
strategies exist, and the level of risk taken will vary. Investors looking for a diversified
exposure to hedge funds will normally opt for a fund of hedge funds – a fund with underlying
investments in several hedge funds covering different strategies and geographical areas.

Section D - Page 47
I
IAS19 (International Accounting Standards)
An accounting standard which requires organisations to incorporate their pension funds into
their balance sheets and specifically that all pension fund liabilities should be valued
using an AA corporate bond yield. Any mismatch between assets and liabilities is effectively
brought on to the organisation’s balance sheet.
IAS1
An accounting standard that sets out overall requirements for the presentation of financial
statements, guidelines for their structure and minimum requirements for their content.
P
Private equity
Funds put up by investors to finance new and growing businesses. Also known as venture
capital
Private Debt
Private debt comprises mezzanine and other forms of debt financing that comes mainly from
institutional investors such as funds and insurance companies – but not from banks.
R
Risk
In its simplest sense, risk is the variability of returns. Investments with greater inherent risk
must promise higher expected returns if investors are to invest in them. Risk management is
an important aspect of portfolio management and involves the use of complex statistical
models.
S
Stocklending
The lending of a security by the registered owner, to an authorised third party, for a fixed or
open period of time, for an agreed consideration secured by collateral. The demand to
borrow securities comes mainly from market makers to cover short positions or take
arbitrage opportunities.
T
Transaction costs
Those costs associated with trading on a portfolio, notably stamp duty and commissions.