Embed Size (px)
Citation preview
1
WASH IN HEALTH CARE FACILITIES UNICEF Scoping Study in Eastern and Southern Africa
WASH in Health Care Facilities UNICEF Scoping Study in Eastern and Southern Africa
August 2019
© United Nations Children’s Fund
UNICEF Eastern and Southern Africa Regional Office (ESARO)Nairobi, Kenya
Author: Magdalene Matthews Ofori-Kuma, UNICEF ESARO
Co-Author: Tsion Gebreyesus, UNICEF Ethiopia Country Office
Cover Image: ©UNICEF/UN0318391/RamasomananaMother and newborn baby, Moramanga Hospital, Madagascar
Reviewers and Contributors: Samuel Godfrey, Bernard Keraita, Gabriele Fontana, Fatima Gohar, Lara Burger and Shem Okiomeri.
The ESARO Team extends its gratitude to the governments, line ministries, technical resource persons and dedicated UNICEF WASH and health colleagues working to advance WASH in health care facilities in the 21 UNICEF programming countries in Eastern and Southern Africa Region for their valuable contributions, insights and inputs to the study.
Special acknowledgements to the following UNICEF staff for their contributions of time, content, knowledge and experience to the enrichment of the final publication:
Angola Tomas Lopez de Bufala, Edson Monteiro
Burundi Daniel Spalthoff, Yves Shaka, Remegie Nzeyimana
Comoros Sylvain Bertrand, Maarouf Mohamed
Eritrea David Tsetse, Hanna Berhe, Yirgalem Solomon
Eswatini Boniswa Dladla
Ethiopia Kitka Goyal, Jane Bevan, Netsanet Kassa, Getachew Hailemichael
Kenya Andrew Trevett, Maya Igarashi Wood, Agnes Makanyi
Lesotho Nadia AlHarithi, Ubong Ekanem, Anthony Asije
Madagascar Brigitte Pedro, Bodovoahangy Andriamaroson, Tata Venance (Ministry of Public Health), Ranarison Volahanta Malala (WHO)
Malawi Michele Paba, Blessius Tauzie, Chimwemwe Nyimba
Mozambique Chris Cormency, Mayza Tricamegy, Jesus Trelles
Namibia Matheus Shuuya
Rwanda Cindy Kushner, Jean Marie Vianney Rutaganda
Somalia Mahboob Ahmed Bajwa, Charles Mutai
South Sudan Victor Kinyanjui, Robert Taban Lominsuk, Prakash Raj Lamsal
Uganda Shiva Narain Singh, Mary Nawembe
United Republic of Tanzania Amour Seleman, John Mfungo, Francis Odhiambo
Zambia Murtaza Malik, Lavuun Verstraete
Zimbabwe Aidan Cronin, Shelly Chitsungo, Moreblessing Munyaka, Jennifer Barak, Mitsuaki Hirai
WASH IN HEALTH CARE FACILITIES UNICEF Scoping Study in Eastern and Southern Africa
4
© U
NIC
EF/U
N03
0639
9/A
bdul
v
Table of Contents
LIST OF FIGURES & TABLES VI
ABBREVIATIONS AND ACRONYMS VII
INTRODUCTION 1
1. WASH AND HEALTH: CURRENT CONTEXT 41.1 GLOBAL FRAMEWORK FOR WASH IN HEALTH CARE FACILITIES 41.2 UNICEF’S VISION FOR WASH IN HEALTH CARE FACILITIES 61.3 WASH IN HEALTH IN EASTERN AND SOUTHERN AFRICA 8
2. WASH COVERAGE IN HEALTH FACILITIES 92.1 JOINT MONITORING PROGRAMME SERVICE LADDERS FOR WASH IN HEALTH 92.2. GLOBAL BASELINE FOR WASH IN HEALTH CARE FACILITIES 102.3 WASH IN HEALTH COVERAGE IN EASTERN AND SOUTHERN AFRICA 12
3. THE ENABLING ENVIRONMENT FOR WASH IN HEALTH CARE FACILITIES IN EASTERN AND SOUTHERN AFRICA 143.1 DEFINITION AND SCOPE 143.2 METHODOLOGY 153.2.1 REGIONAL SURVEY AND ANALYSIS 153.2.2 CASE STUDIES 163.3 SOURCES OF INFORMATION 173.4 SPECIAL ACKNOWLEDGEMENT 17
4. FINDINGS 204.1 REGIONAL ENABLING ENVIRONMENT FOR WINHCF IN ESAR 204.2 SECTOR POLICY/STRATEGY 224.3 INSTITUTIONAL ARRANGEMENTS 244.4 SECTOR FINANCING 254.5 PLANNING, MONITORING AND REVIEW 274.6 BUILDING CAPACITY FOR WASH IN HEALTH CARE FACILITIES 29
5. CROSS-CUTTING & EMERGING ISSUES 325.1 WASH AND MATERNAL, NEWBORN AND CHILD HEALTH (MNCH) 325.2 GENDER INCLUSIVITY AND MENSTRUAL HEALTH AND HYGIENE 325.3 DISABILITY INCLUSION IN WINHCF POLICY FRAMEWORKS 335.4 ANTIMICROBIAL RESISTANCE 335.5 CLIMATE-RESILIENCE PROGRAMMING FOR WASH IN HEALTH CARE FACILITIES 335.6 COUNTRY PERSPECTIVES 34
6. DESCRIPTIVE CASE STUDIES 35UGANDA 35KENYA 39ERITREA 42
7. RECOMMENDATIONS 45
REFERENCES 48
ANNEX 1: SUMMARY OF WHO PUBLICATIONS ON HEALTH CARE AND WASTE 50ANNEX 2: SDG CORE QUESTIONS FOR MONITORING WINHCF 52ANNEX 3: INDICATORS IN REGIONAL ENABLING ENVIRONMENT SURVEY 53ANNEX 4: A CLOSER LOOK AT ETHIOPIA’S ENABLING ENVIRONMENT FOR WASH IN HEALTH CARE FACILITIES 54ANNEX 5: STAKEHOLDER PERSPECTIVES ON BOTTLENECKS AND RECOMMENDED ACTIONS FOR WINHCF SCALE-UP 56ADDITIONAL WASH IN HEALTH CARE FACILITIES RESOURCES 59
vi
List of Figures and Tables
Figure 1: Map of the 21 Countries in Eastern and Southern Africa 3
Figure 2: Multiple benefits of adequate WASH in health care facilities 4
Figure 3: WASH FIT five step process for improving facility-level WASH Servicess 6
Figure 4: Causes of newborn deaths in the region 7
Figure 5: New JMP service ladders for global monitoring of WASH in health care facilities 9
Figure 6: Water services in health care facilities by SDG region 10
Figure 7: Proportion of health care facilities in sub-Saharan Africa with basic water supply 11
Figure 8: Sanitation coverage in health facilities in select countries in ESAR 11
Figure 9: UNICEF’s Strategy for WASH (2016-2030): A Snapshot 12
Figure 10: Water coverage in health facilities in selected countries in Eastern and Southern Africa 13
Figure 11: Sanitation coverage in health facilities in selected countries in Eastern and Southern Africa 13
Figure 12: UNICEF’s Strategy for WASH (2016-2030): A snapshot 14
Figure 13: WASH sector-strengthening building blocks and expected results 15
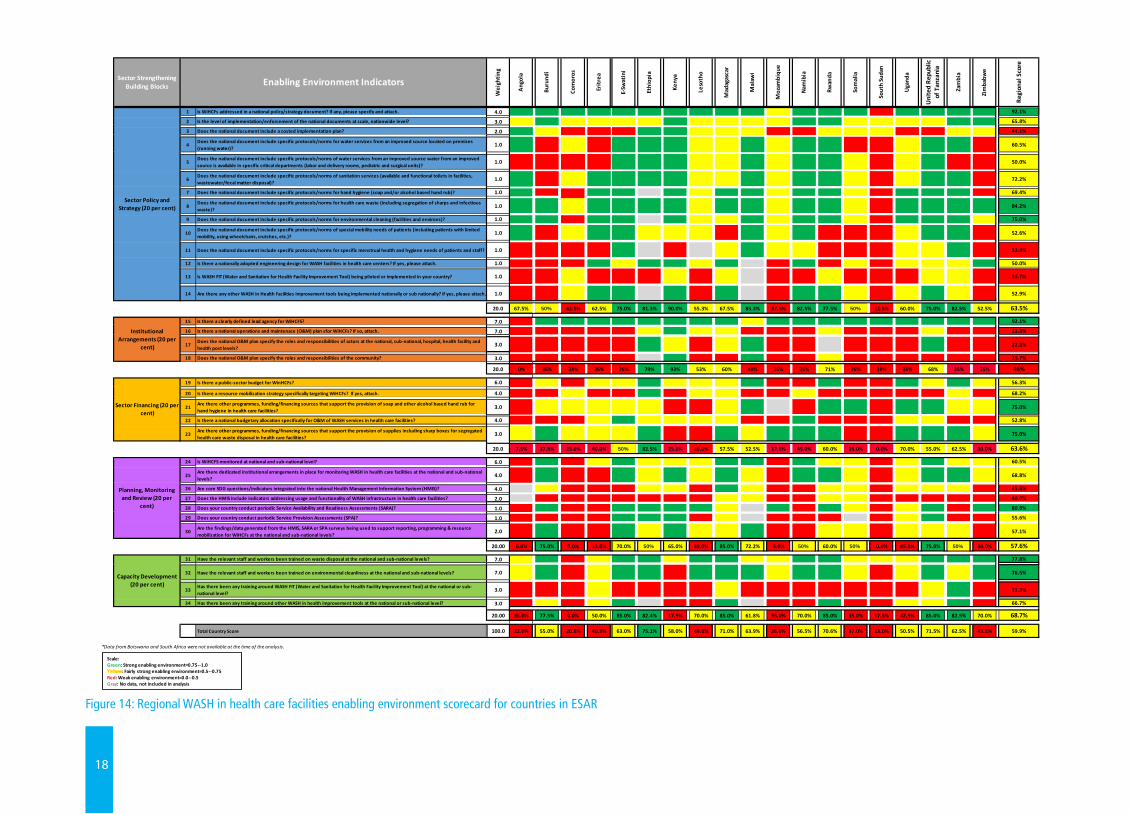
Figure 14: Regional WASH in health care facilities enabling environment scorecard for countries in ESAR 18
Figure 15: Regional enabling environment scorecard for WASH in health care facilities 19
Figure 16: Map of country performance for overall enabling environment indicators for WinHCF in ESAR 20
Figure 17: Country performance for enabling environment indicators on sector policy and strategy in ESAR 22
Figure 18: Proportion of countries with policy instruments and frameworks addressing WinHCF in ESAR 23
Figure 19: Country performance for enabling environment indicators on institutional arrangements in ESAR 24
Figure 20: Country performance for enabling environment indicators on sector financing in ESAR 26
Figure 21: Country performance for enabling environment indicators on planning, monitoring and review 27
Figure 22: Proportion of countries in ESAR with HMIS indicators on usage and functionality for WinHCF 28
Figure 23: Country performance for enabling environment indicators on capacity development in ESAR 29
Figure 24: JMP service ladders for water services in health care facilities in Uganda 36
Figure 25: KJMP service ladders for sanitation services in health care facilities in Uganda 36
Figure 26: JMP service ladders for waste disposal in health care facilities in Uganda 36
Figure 27: Kenya Essential Package for Health (KEPH) Health Service levels, Source: Kenya HRH Strategy 39
Figure 28: JMP service ladders for water services in health care facilities in Kenya 40
Figure 29: Country scores for enabling environment indicators for WASH in healthcare facilities in Eritrea 42
Figure 30: WHO/UNICEF practical steps to achieve universal access to quality care 46
Figure 31: SDG core questions for monitoring WinHCF 51
Table 1: Essential Environmental Health Standards in Health Care Facilities 5
Table 2: Enabling environment survey response, score and colour-coding guideline 16
Table 3: Regional WinHCF Enabling Environment Scores by Sector Strengthening Building Blocks 21
Table 4: Uganda’s referral health care system based on level and services provided 35
vii
DHS Demographic and Health Survey
DHIS District Health Information Software
ESAR Eastern and Southern Africa Region
ESARO Eastern and Southern Africa Regional Office
HCWM Healthcare Waste Management
HMIS Health Management Information System
IPC Infection Prevention and Control
JMP Joint Monitoring Programme
MDGs Millennium Development Goals
MHH Menstrual Health and Hygiene
MICS Multiple Indicator Cluster Surveys
M&E Monitoring and Evaluation
MoH Ministry of Health
MoW Ministry of Water
O&M Operations & Maintenance
RO Regional Office
SDGs Sustainable Development Goals
UNICEF United Nations Children’s Fund
WASH Water, Sanitation and Hygiene
WHO World Health Organization
WinHCF WASH in Health Care Facilities
List of Abbreviations and Acronyms
8
© U
NIC
EF/U
N03
0643
9/A
bdul
1
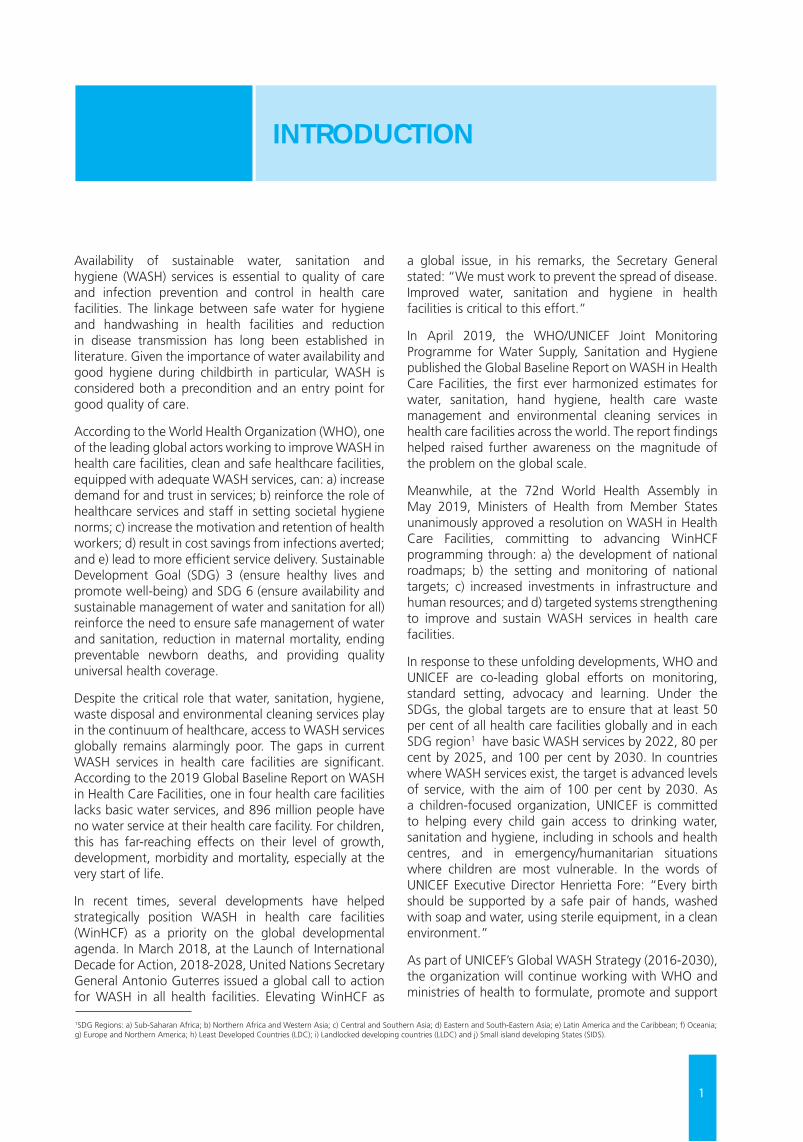
Availability of sustainable water, sanitation and hygiene (WASH) services is essential to quality of care and infection prevention and control in health care facilities. The linkage between safe water for hygiene and handwashing in health facilities and reduction in disease transmission has long been established in literature. Given the importance of water availability and good hygiene during childbirth in particular, WASH is considered both a precondition and an entry point for good quality of care.
According to the World Health Organization (WHO), one of the leading global actors working to improve WASH in health care facilities, clean and safe healthcare facilities, equipped with adequate WASH services, can: a) increase demand for and trust in services; b) reinforce the role of healthcare services and staff in setting societal hygiene norms; c) increase the motivation and retention of health workers; d) result in cost savings from infections averted; and e) lead to more efficient service delivery. Sustainable Development Goal (SDG) 3 (ensure healthy lives and promote well-being) and SDG 6 (ensure availability and sustainable management of water and sanitation for all) reinforce the need to ensure safe management of water and sanitation, reduction in maternal mortality, ending preventable newborn deaths, and providing quality universal health coverage.
Despite the critical role that water, sanitation, hygiene, waste disposal and environmental cleaning services play in the continuum of healthcare, access to WASH services globally remains alarmingly poor. The gaps in current WASH services in health care facilities are significant. According to the 2019 Global Baseline Report on WASH in Health Care Facilities, one in four health care facilities lacks basic water services, and 896 million people have no water service at their health care facility. For children, this has far-reaching effects on their level of growth, development, morbidity and mortality, especially at the very start of life.
In recent times, several developments have helped strategically position WASH in health care facilities (WinHCF) as a priority on the global developmental agenda. In March 2018, at the Launch of International Decade for Action, 2018-2028, United Nations Secretary General Antonio Guterres issued a global call to action for WASH in all health facilities. Elevating WinHCF as
a global issue, in his remarks, the Secretary General stated: “We must work to prevent the spread of disease. Improved water, sanitation and hygiene in health facilities is critical to this effort.”
In April 2019, the WHO/UNICEF Joint Monitoring Programme for Water Supply, Sanitation and Hygiene published the Global Baseline Report on WASH in Health Care Facilities, the first ever harmonized estimates for water, sanitation, hand hygiene, health care waste management and environmental cleaning services in health care facilities across the world. The report findings helped raised further awareness on the magnitude of the problem on the global scale.
Meanwhile, at the 72nd World Health Assembly in May 2019, Ministers of Health from Member States unanimously approved a resolution on WASH in Health Care Facilities, committing to advancing WinHCF programming through: a) the development of national roadmaps; b) the setting and monitoring of national targets; c) increased investments in infrastructure and human resources; and d) targeted systems strengthening to improve and sustain WASH services in health care facilities.
In response to these unfolding developments, WHO and UNICEF are co-leading global efforts on monitoring, standard setting, advocacy and learning. Under the SDGs, the global targets are to ensure that at least 50 per cent of all health care facilities globally and in each SDG region1 have basic WASH services by 2022, 80 per cent by 2025, and 100 per cent by 2030. In countries where WASH services exist, the target is advanced levels of service, with the aim of 100 per cent by 2030. As a children-focused organization, UNICEF is committed to helping every child gain access to drinking water, sanitation and hygiene, including in schools and health centres, and in emergency/humanitarian situations where children are most vulnerable. In the words of UNICEF Executive Director Henrietta Fore: “Every birth should be supported by a safe pair of hands, washed with soap and water, using sterile equipment, in a clean environment.”
As part of UNICEF’s Global WASH Strategy (2016-2030), the organization will continue working with WHO and ministries of health to formulate, promote and support
INTRODUCTION
1SDG Regions: a) Sub-Saharan Africa; b) Northern Africa and Western Asia; c) Central and Southern Asia; d) Eastern and South-Eastern Asia; e) Latin America and the Caribbean; f) Oceania; g) Europe and Northern America; h) Least Developed Countries (LDC); i) Landlocked developing countries (LLDC) and j) Small island developing States (SIDS).
2
viable approaches for ensuring adequate WASH in health care facilities, with a focus on facilities providing maternal and newborn health services. UNICEF’s initiatives to improve water, sanitation and hygiene practices in health care facilities will focus on improving the safety and dignity of childbirth, with provisions made to sponsor targeted research to improve the knowledge base in the area for enhanced programme design and more effective advocacy.
On this premise, UNICEF Eastern and Southern Africa Regional Office conducted a regional scoping study and deep dive on the Enabling Environment for WASH services in Health Care Facilities across its 21 programming countries in Eastern and Southern Africa Region. The aim was to assess the status of the enabling environment for WASH services in health facilities, identify related gaps and explore avenues to enhance programming in the region. The objectives of the study were:
1. To assess the status of the enabling environment for WinHCFs programming in the region;
2. To document best practices on WinHCFs programming from selected countries for further learning, and knowledge-sharing in the region; and
3. To increase awareness of WinHCFs programming through evidence generation for enhanced programming and targeted advocacy.
The study consisted of an online survey completed through multi-stakeholder consultations in countries in the region, followed by visits to health care facilities in rural and urban settings in selected countries in the
region (Eritrea, Uganda and Kenya). Assessment was based on UNICEF’s Enabling Environment Framework, using the five sector strengthening building blocks: a) Sector policy/strategy; b) Institutional arrangements; c) Sector financing; d) Planning, monitoring and review; and e) Capacity development.
The study forms part of evidence generation and knowledge sharing within the region and contributes to UNICEF’s global strategic focus (2016-2030) as well as to the 2018-2021 Regional Priorities for Eastern and Southern Africa Region which call for the institutionalization of WinHCFs programming, the prioritization of health facilities that provide maternal, neonatal and child health services; and the establishment and enforcement of national standards for WASH services in health care facilities.
This report summarizes the findings of the study and consists of five main parts:
1. A literature review of the current global, organizational and regional frameworks for WinHCF programming;
2. A summary of regional WASH coverage in health care facilities based on the 2019 Joint Monitoring Programme global baseline findings;
3. An analysis of the enabling environment for WinHCF derived from an administered online survey;
4. Descriptive case studies of selected countries within the region; and
5. Strategic recommendations for advancing sustainable WinHCFs programming in the region.
3
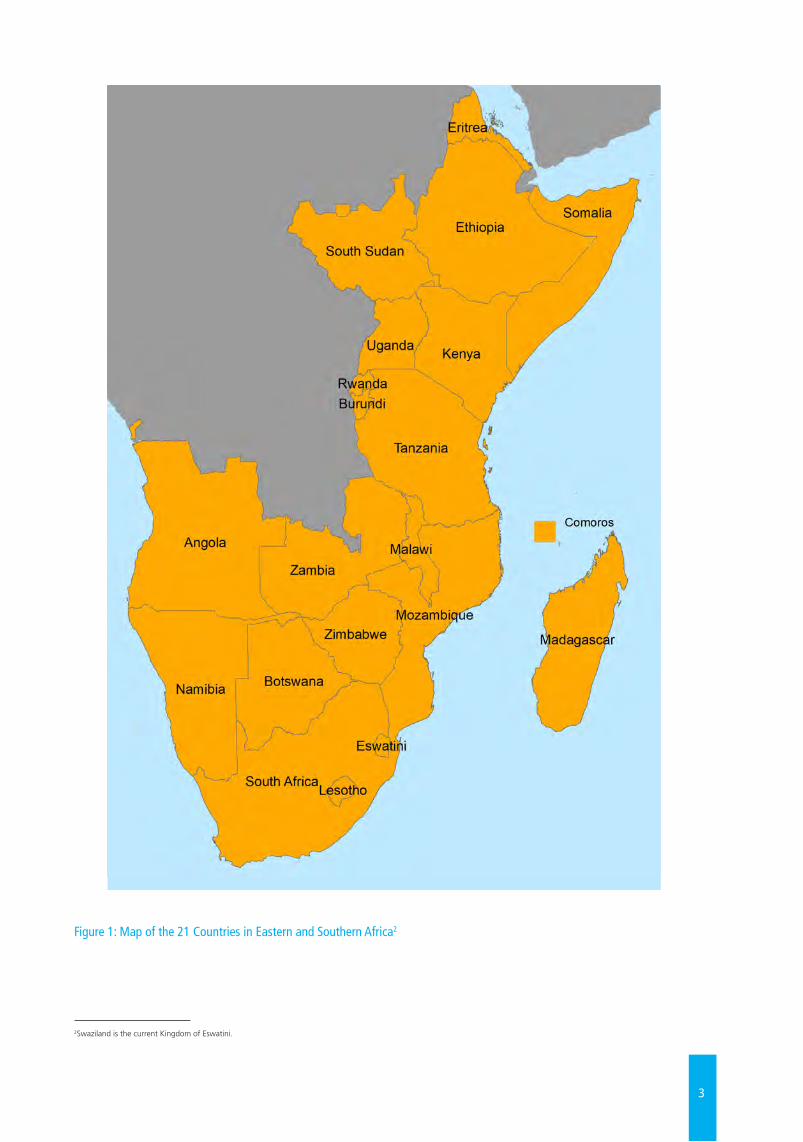
Figure 1: Map of the 21 Countries in Eastern and Southern Africa2
2Swaziland is the current Kingdom of Eswatini.
4
1.1 GLOBAL FRAMEWORK FOR WASH IN HEALTH CARE FACILITIESAs defined by the World Health Organization (WHO),3
the term ‘health care facilities’ refers to “all formally recognized facilities that provide health care, including primary (health posts and clinics), secondary, and tertiary (district or national hospitals), public and private (including faith-run), and temporary structures designed for emergency contexts (e.g., cholera treatment centers).” ‘WASH in health care facilities’ is defined as
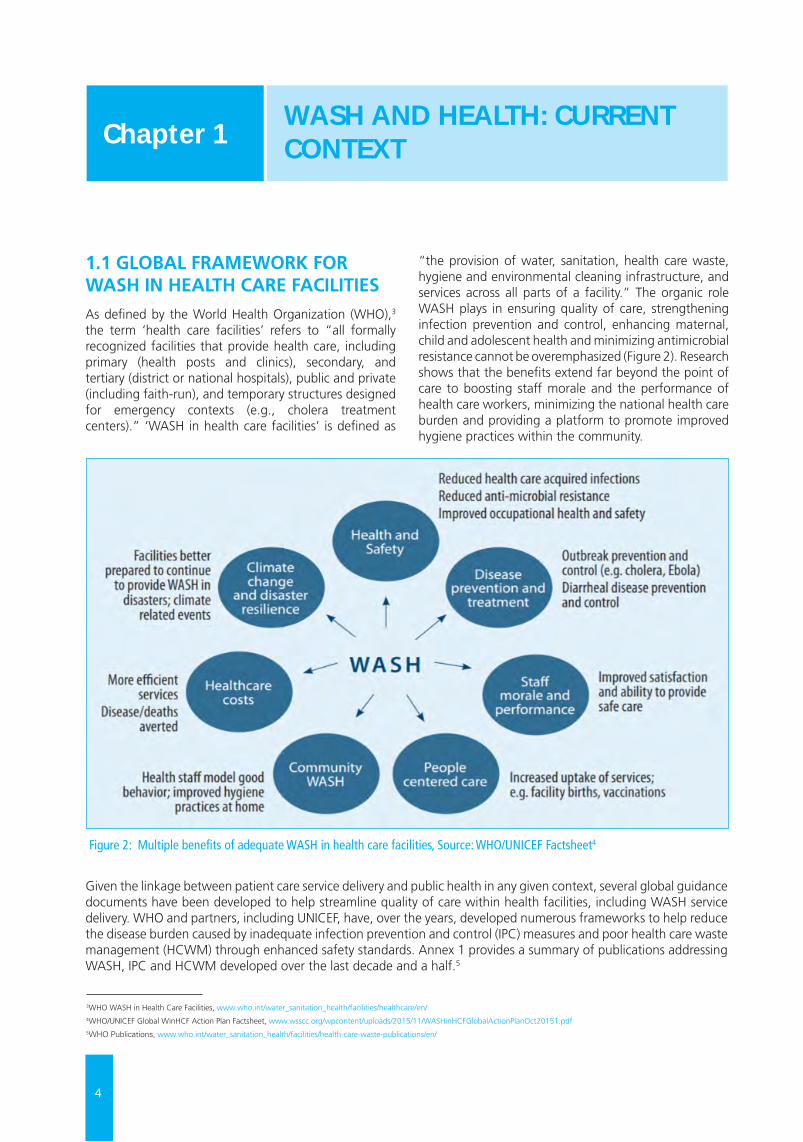
“the provision of water, sanitation, health care waste, hygiene and environmental cleaning infrastructure, and services across all parts of a facility.” The organic role WASH plays in ensuring quality of care, strengthening infection prevention and control, enhancing maternal, child and adolescent health and minimizing antimicrobial resistance cannot be overemphasized (Figure 2). Research shows that the benefits extend far beyond the point of care to boosting staff morale and the performance of health care workers, minimizing the national health care burden and providing a platform to promote improved hygiene practices within the community.
WASH AND HEALTH: CURRENT CONTEXTChapter 1
Figure 2: Multiple benefits of adequate WASH in health care facilities, Source: WHO/UNICEF Factsheet4
Given the linkage between patient care service delivery and public health in any given context, several global guidance documents have been developed to help streamline quality of care within health facilities, including WASH service delivery. WHO and partners, including UNICEF, have, over the years, developed numerous frameworks to help reduce the disease burden caused by inadequate infection prevention and control (IPC) measures and poor health care waste management (HCWM) through enhanced safety standards. Annex 1 provides a summary of publications addressing WASH, IPC and HCWM developed over the last decade and a half.5
3WHO WASH in Health Care Facilities, www.who.int/water_sanitation_health/facilities/healthcare/en/4WHO/UNICEF Global WinHCF Action Plan Factsheet, www.wsscc.org/wpcontent/uploads/2015/11/WASHinHCFGlobalActionPlanOct20151.pdf5WHO Publications, www.who.int/water_sanitation_health/facilities/health-care-waste-publications/en/
5
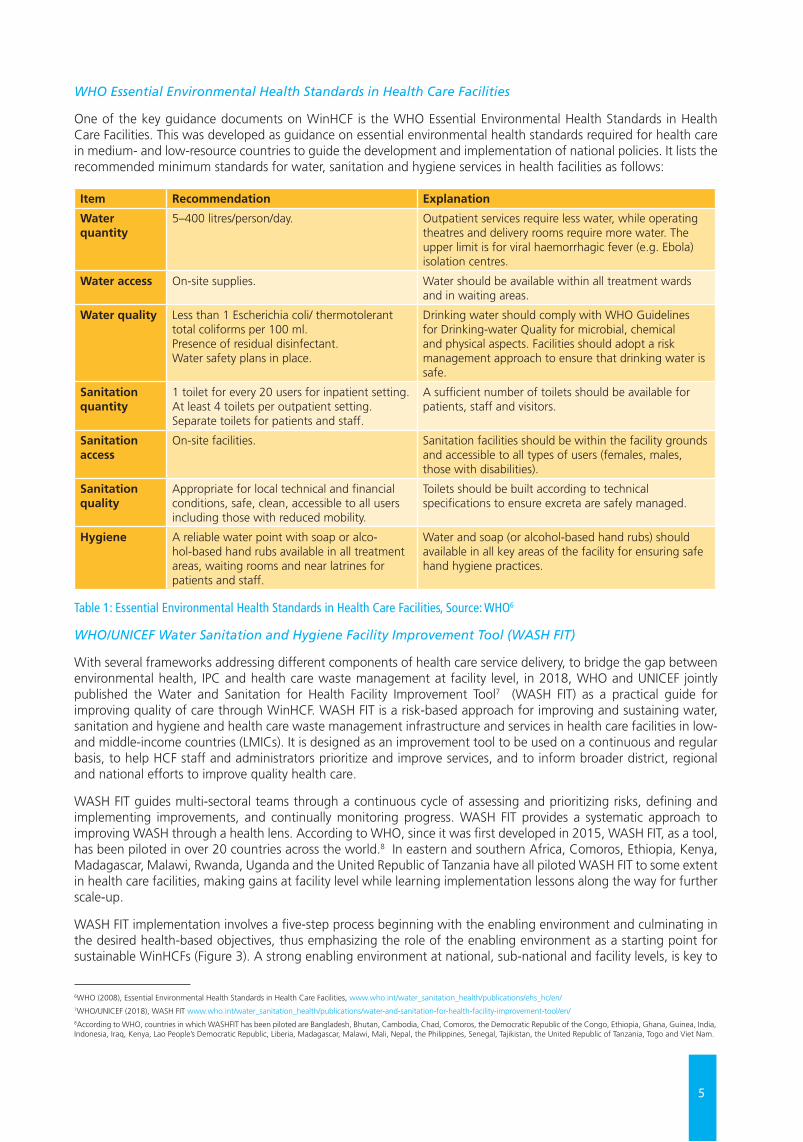
WHO Essential Environmental Health Standards in Health Care Facilities
One of the key guidance documents on WinHCF is the WHO Essential Environmental Health Standards in Health Care Facilities. This was developed as guidance on essential environmental health standards required for health care in medium- and low-resource countries to guide the development and implementation of national policies. It lists the recommended minimum standards for water, sanitation and hygiene services in health facilities as follows:
Item Recommendation Explanation
Water quantity
5–400 litres/person/day. Outpatient services require less water, while operating theatres and delivery rooms require more water. The upper limit is for viral haemorrhagic fever (e.g. Ebola) isolation centres.
Water access On-site supplies. Water should be available within all treatment wards and in waiting areas.
Water quality Less than 1 Escherichia coli/ thermotolerant total coliforms per 100 ml. Presence of residual disinfectant. Water safety plans in place.
Drinking water should comply with WHO Guidelines for Drinking-water Quality for microbial, chemical and physical aspects. Facilities should adopt a risk management approach to ensure that drinking water is safe.
Sanitation quantity
1 toilet for every 20 users for inpatient setting. At least 4 toilets per outpatient setting. Separate toilets for patients and staff.
A sufficient number of toilets should be available for patients, staff and visitors.
Sanitation access
On-site facilities. Sanitation facilities should be within the facility grounds and accessible to all types of users (females, males, those with disabilities).
Sanitation quality
Appropriate for local technical and financial conditions, safe, clean, accessible to all users including those with reduced mobility.
Toilets should be built according to technical specifications to ensure excreta are safely managed.
Hygiene A reliable water point with soap or alco-hol-based hand rubs available in all treatment areas, waiting rooms and near latrines for patients and staff.
Water and soap (or alcohol-based hand rubs) should available in all key areas of the facility for ensuring safe hand hygiene practices.
Table 1: Essential Environmental Health Standards in Health Care Facilities, Source: WHO6
WHO/UNICEF Water Sanitation and Hygiene Facility Improvement Tool (WASH FIT)
With several frameworks addressing different components of health care service delivery, to bridge the gap between environmental health, IPC and health care waste management at facility level, in 2018, WHO and UNICEF jointly published the Water and Sanitation for Health Facility Improvement Tool7 (WASH FIT) as a practical guide for improving quality of care through WinHCF. WASH FIT is a risk-based approach for improving and sustaining water, sanitation and hygiene and health care waste management infrastructure and services in health care facilities in low- and middle-income countries (LMICs). It is designed as an improvement tool to be used on a continuous and regular basis, to help HCF staff and administrators prioritize and improve services, and to inform broader district, regional and national efforts to improve quality health care.
WASH FIT guides multi-sectoral teams through a continuous cycle of assessing and prioritizing risks, defining and implementing improvements, and continually monitoring progress. WASH FIT provides a systematic approach to improving WASH through a health lens. According to WHO, since it was first developed in 2015, WASH FIT, as a tool, has been piloted in over 20 countries across the world.8 In eastern and southern Africa, Comoros, Ethiopia, Kenya, Madagascar, Malawi, Rwanda, Uganda and the United Republic of Tanzania have all piloted WASH FIT to some extent in health care facilities, making gains at facility level while learning implementation lessons along the way for further scale-up.
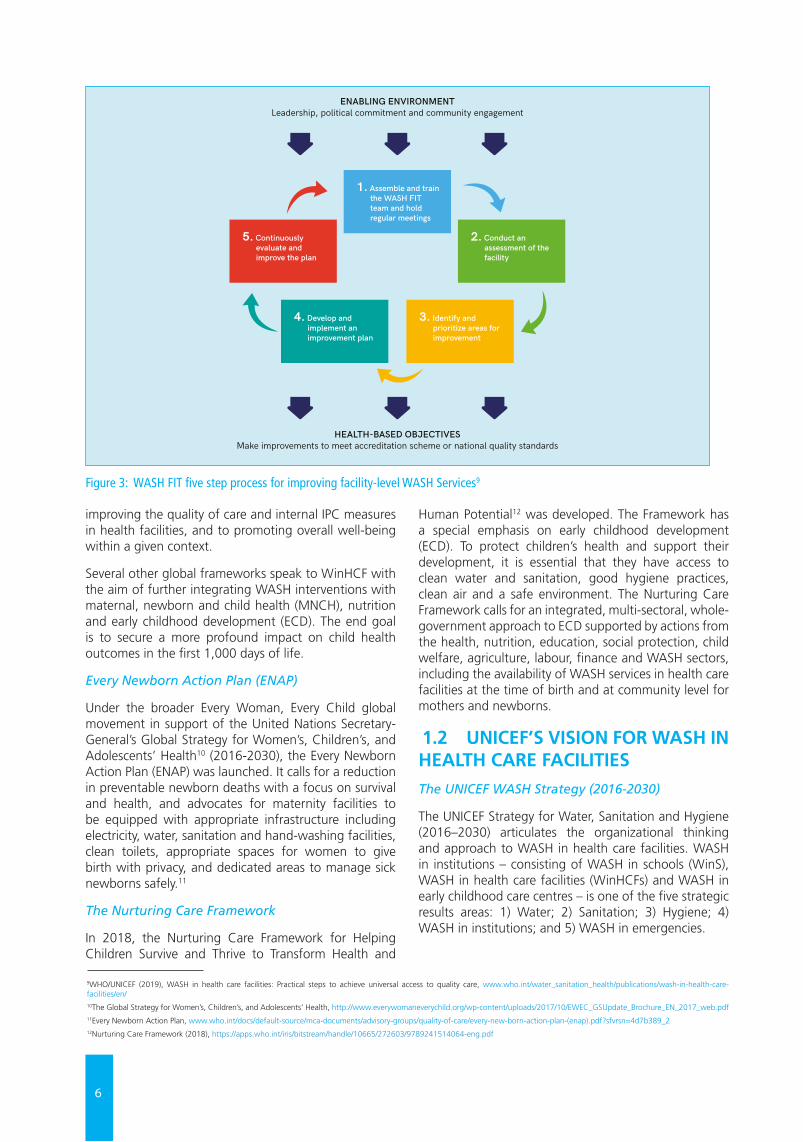
WASH FIT implementation involves a five-step process beginning with the enabling environment and culminating in the desired health-based objectives, thus emphasizing the role of the enabling environment as a starting point for sustainable WinHCFs (Figure 3). A strong enabling environment at national, sub-national and facility levels, is key to
6WHO (2008), Essential Environmental Health Standards in Health Care Facilities, www.who.int/water_sanitation_health/publications/ehs_hc/en/ 7WHO/UNICEF (2018), WASH FIT www.who.int/water_sanitation_health/publications/water-and-sanitation-for-health-facility-improvement-tool/en/ 8According to WHO, countries in which WASHFIT has been piloted are Bangladesh, Bhutan, Cambodia, Chad, Comoros, the Democratic Republic of the Congo, Ethiopia, Ghana, Guinea, India, Indonesia, Iraq, Kenya, Lao People’s Democratic Republic, Liberia, Madagascar, Malawi, Mali, Nepal, the Philippines, Senegal, Tajikistan, the United Republic of Tanzania, Togo and Viet Nam.
6
improving the quality of care and internal IPC measures in health facilities, and to promoting overall well-being within a given context.
Several other global frameworks speak to WinHCF with the aim of further integrating WASH interventions with maternal, newborn and child health (MNCH), nutrition and early childhood development (ECD). The end goal is to secure a more profound impact on child health outcomes in the first 1,000 days of life.
Every Newborn Action Plan (ENAP)
Under the broader Every Woman, Every Child global movement in support of the United Nations Secretary-General’s Global Strategy for Women’s, Children’s, and Adolescents’ Health10 (2016-2030), the Every Newborn Action Plan (ENAP) was launched. It calls for a reduction in preventable newborn deaths with a focus on survival and health, and advocates for maternity facilities to be equipped with appropriate infrastructure including electricity, water, sanitation and hand-washing facilities, clean toilets, appropriate spaces for women to give birth with privacy, and dedicated areas to manage sick newborns safely.11
The Nurturing Care Framework
In 2018, the Nurturing Care Framework for Helping Children Survive and Thrive to Transform Health and
Human Potential12 was developed. The Framework has a special emphasis on early childhood development (ECD). To protect children’s health and support their development, it is essential that they have access to clean water and sanitation, good hygiene practices, clean air and a safe environment. The Nurturing Care Framework calls for an integrated, multi-sectoral, whole-government approach to ECD supported by actions from the health, nutrition, education, social protection, child welfare, agriculture, labour, finance and WASH sectors, including the availability of WASH services in health care facilities at the time of birth and at community level for mothers and newborns.
1.2 UNICEF’S VISION FOR WASH IN HEALTH CARE FACILITIES The UNICEF WASH Strategy (2016-2030)
The UNICEF Strategy for Water, Sanitation and Hygiene (2016–2030) articulates the organizational thinking and approach to WASH in health care facilities. WASH in institutions – consisting of WASH in schools (WinS), WASH in health care facilities (WinHCFs) and WASH in early childhood care centres – is one of the five strategic results areas: 1) Water; 2) Sanitation; 3) Hygiene; 4) WASH in institutions; and 5) WASH in emergencies.
9WHO/UNICEF (2019), WASH in health care facilities: Practical steps to achieve universal access to quality care, www.who.int/water_sanitation_health/publications/wash-in-health-care-facilities/en/ 10The Global Strategy for Women’s, Children’s, and Adolescents’ Health, http://www.everywomaneverychild.org/wp-content/uploads/2017/10/EWEC_GSUpdate_Brochure_EN_2017_web.pdf 11Every Newborn Action Plan, www.who.int/docs/default-source/mca-documents/advisory-groups/quality-of-care/every-new-born-action-plan-(enap).pdf?sfvrsn=4d7b389_212Nurturing Care Framework (2018), https://apps.who.int/iris/bitstream/handle/10665/272603/9789241514064-eng.pdf
47
PRACTIC
AL STEPS TO
ACH
IEVE U
NIV
ERSAL AC
CESS TO
QU
ALIT
Y C
ARE
ENABLING ENVIRONMENTLeadership, political commitment and community engagement
HEALTH-BASED OBJECTIVESMake improvements to meet accreditation scheme or national quality standards
2. Conduct an assessment of the facility
3. Identify and prioritize areas for improvement
4. Develop and implement an improvement plan
5. Continuously evaluate and improve the plan
1. Assemble and train the WASH FIT team and hold regular meetings
Figure 3. WASH FIT five-step process
every six months) visits to the facility by local or national government or supporting partners can help guide and encourage facilities through the WASH FIT process. These visits are also important for data collection and evaluation of WASH FIT (see Practical Step 3, Liberia case study) (47).
WASH FIT training
A set of training modules is available online in English, French and Russian. The training modules are provided as a guide and should be adapted to the local context, for example swapping photos with more relevant examples from the region and replacing technical guidance with local standards, where applicable. The training package also includes an overview of the WASH FIT methodology and a module for each of the WHO Essential Environmental Health Standards (e.g., water, sanitation, environmental cleaning, health care waste). Materials for running a training, including sample agendas, evaluation sheets, and a pre- and post-test quiz are also available. For technical assistance or to share experiences of using the tool, please contact [email protected] and visit www. washinhcf.org.
AN
NEX 3
Mobile application
A mobile application of WASH FIT is available and free to download (www.washfit.org). The application allows facility teams to track more easily and rapidly and follow up on actions and government and partners to provide real-time support. In addition, it can be used by facility teams to share approaches on overcoming challenges or engage in friendly competitions.
Related reading:
Water and Sanitation for Health Facility Improvement Tool (WASH FIT): A practical guide for improving quality of care through water, sanitation and hygiene in health care facilities [Internet]. Geneva, World Health Organization and UNICEF, 2018 [cited 1 March 2019]. Available from: http://www.who.int/water_sanitation_health/publications/water-and-sanitation-for-health-facility-improvement-tool/en/
Figure 3: WASH FIT five step process for improving facility-level WASH Services9
7
To advance the global agenda on WinHCF programming, UNICEF commits to:
• Encouraging the institutionalization of WinHCF within the national health sector;
• Advocating for and supporting the inclusion of WASH in health sector baseline studies and national surveys;
• Supporting the development of national standards for WinHCFs and evidence-based models for scaling up with quality; while promoting cost-effective approaches; and
• Encouraging the implementation of hygiene protocols, including hygiene practices of health workers.
The UNICEF Health Strategy (2016-2030)
UNICEF’s Strategy for Health (2016-2030), in turn, stresses the importance of an integrated approach to early child health care, drawing on the diversity of the organization’s programmatic scope (nutrition, education, early childhood development (ECD), HIV, child protection, and WASH) and calls for nutrition screening and intervention, improved community-level health literacy, support to community-level interventions related to early child development, and appropriate support to community-level and health facility WASH services and practices.13
Every Child Alive
In addition, as part of its efforts on reproductive, maternal, newborn, child and adolescent health (RMNCAH), UNICEF recently launched, Every Child Alive, a priority organizational integrated campaign aimed at significantly reducing morbidity and mortality at the very start of life. Global statistics show that children face the highest risk of dying in their first month of life. In 2016, there were 2.6 million newborn deaths, mostly within the first week. About 1 million died on the first day and close to another million within the next six days.14 Globally, while under-five mortality has fallen remarkably in recent decades newborn mortality remains a critical global challenge, predominantly in southern Asia and sub-Saharan Africa.
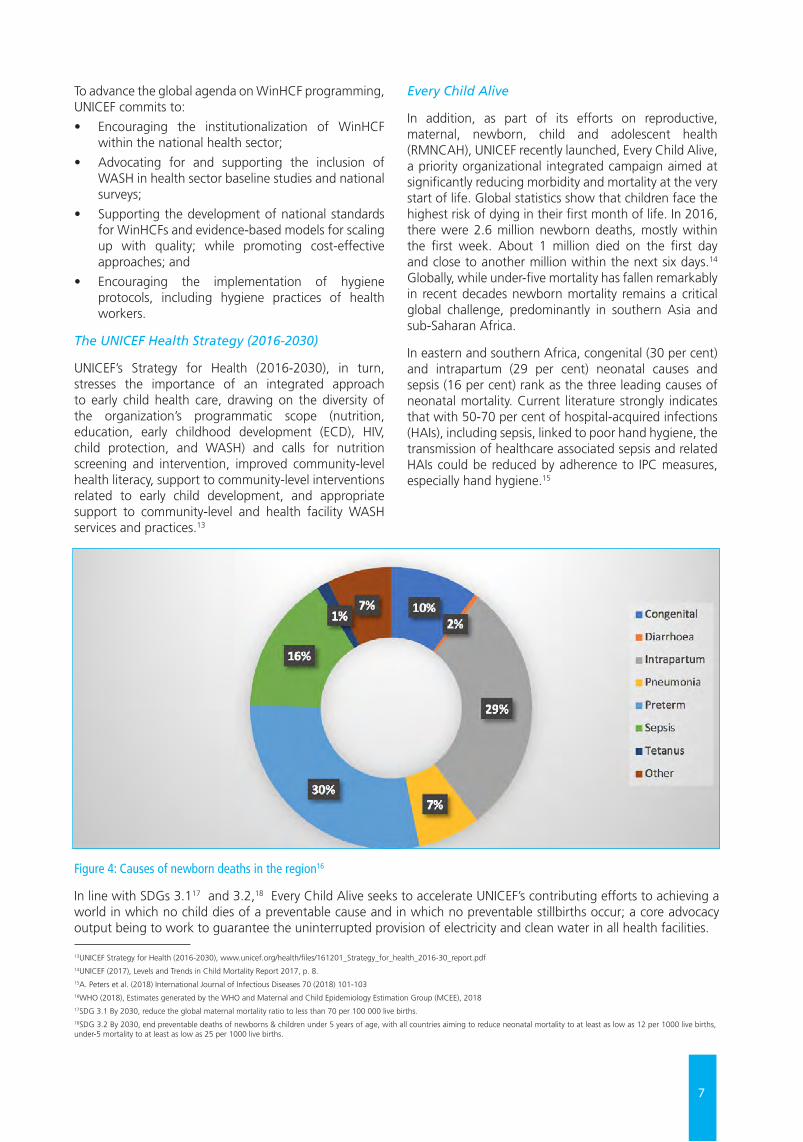
In eastern and southern Africa, congenital (30 per cent) and intrapartum (29 per cent) neonatal causes and sepsis (16 per cent) rank as the three leading causes of neonatal mortality. Current literature strongly indicates that with 50-70 per cent of hospital-acquired infections (HAIs), including sepsis, linked to poor hand hygiene, the transmission of healthcare associated sepsis and related HAIs could be reduced by adherence to IPC measures, especially hand hygiene.15
Figure 4: Causes of newborn deaths in the region16
In line with SDGs 3.117 and 3.2,18 Every Child Alive seeks to accelerate UNICEF’s contributing efforts to achieving a world in which no child dies of a preventable cause and in which no preventable stillbirths occur; a core advocacy output being to work to guarantee the uninterrupted provision of electricity and clean water in all health facilities.
13UNICEF Strategy for Health (2016-2030), www.unicef.org/health/files/161201_Strategy_for_health_2016-30_report.pdf14UNICEF (2017), Levels and Trends in Child Mortality Report 2017, p. 8. 15A. Peters et al. (2018) International Journal of Infectious Diseases 70 (2018) 101-10316WHO (2018), Estimates generated by the WHO and Maternal and Child Epidemiology Estimation Group (MCEE), 2018 17SDG 3.1 By 2030, reduce the global maternal mortality ratio to less than 70 per 100 000 live births.18SDG 3.2 By 2030, end preventable deaths of newborns & children under 5 years of age, with all countries aiming to reduce neonatal mortality to at least as low as 12 per 1000 live births, under-5 mortality to at least as low as 25 per 1000 live births.
8
UNICEF Health Systems Strengthening Approach
Under its Health Systems Strengthening Approach, UNICEF also envisions contributing to evidence-based and equitable national strategic plans and policies for children’s and women’s health; leveraging national and international resources, while linking with other UNICEF programming sectors including WASH. The aim is to establish strong health systems which include preventive and promotive services, curative care, family practices and produces equitable health, nutrition and development outcomes for infants, children, adolescents and women of reproductive age.19
1.3 WASH IN HEALTH IN EASTERN AND SOUTHERN AFRICAAs stated in the 2018-2022 Regional Priorities, in Eastern and Southern Africa Region (ESAR), UNICEF’s commitment is to support countries in the region to improve access to basic service levels of drinking water and sanitation, reduce open defecation and promote good hygiene practices, including menstrual health and hygiene (MHH), especially for the most vulnerable populations, in emergency/humanitarian settings, urban/rural households, communities, schools and health facilities.
The 21 UNICEF programming countries in ESAR are: Angola, Botswana, Burundi, Comoros, Eritrea, Eswatini, Ethiopia, Kenya, Lesotho, Madagascar, Malawi, Mozambique, Namibia, Rwanda, Somalia, South Africa, South Sudan, Uganda, the United Republic of Tanzania, Zambia and Zimbabwe. WASH programming, with the presence of WASH staff, occurs in all these countries except Botswana and South Africa.
UNICEF Eastern and Southern Africa Regional Office (ESARO) will continue to support country offices (COs) to develop enhanced models and partnerships for evidence-based WASH in institutions programming at scale. Regarding WASH in health care facilities, the focus areas and critical actions are:
• To design, implement and monitor synergistic WASH models20 that promote cost-effective approaches and allow the health and WASH sectors to work together efficiently and effectively to undertake comprehensive, facility-based risk assessments and implement context-specific critical actions to improve WASH in health facilities and promote behaviour change through community health worker outreach;
• To develop policies for institutionalizing WASH in healthcare facilities, prioritizing those health facilities that provide maternal, neonatal and child health services; and establish and enforce national standards for WASH in healthcare facilities, accompanied by adequate funding, human resources and institutional arrangements to ensure that standards are implemented;
• To support the development of national WASH targets that prioritize the most vulnerable (areas with high maternal and newborn mortality rates, cholera outbreaks and so on) and take into account human, financial and technological capabilities;
• To advocate for including WASH indicators in key health sector studies and national surveys and health sector real-time monitoring systems, and strengthen joint monitoring for WASH in health facilities, through the WHO–UNICEF Joint Monitoring Programme.
• To promote implementation of hygiene protocols, including hygiene practices for health workers in health facilities and in the community, and strengthen the capacity of medical staff and community health workers to adopt and promote good hygiene behaviours.21
The indicator of success is the number of countries in which 80 per cent of health centres and facilities have basic WASH services by 2022. Given that this is programmed as a regional priority for 2018-2022, judging from the current JMP findings significant efforts will have to be made by all countries within the next two years to meet the 80 per cent target.
19The UNICEF Health Systems Strengthening Approach (2016), https://www.unicef.org/health/files/UNICEF_HSS_Approach.pdf 20Synergistic programming models maximize the potential for synergy between different sectors’ activities. Synergistic models achieve this by securing a common vision and agreement to work together, joint planning and aligned financing and monitoring; and strengthened accountability and capacity. Emphasis is placed on removing bottlenecks in the enabling environment to minimize the practice of delivering sector-based interventions and services in silos.21UNICEF Eastern and Southern Africa Regional Priorities (2018-2022)
9
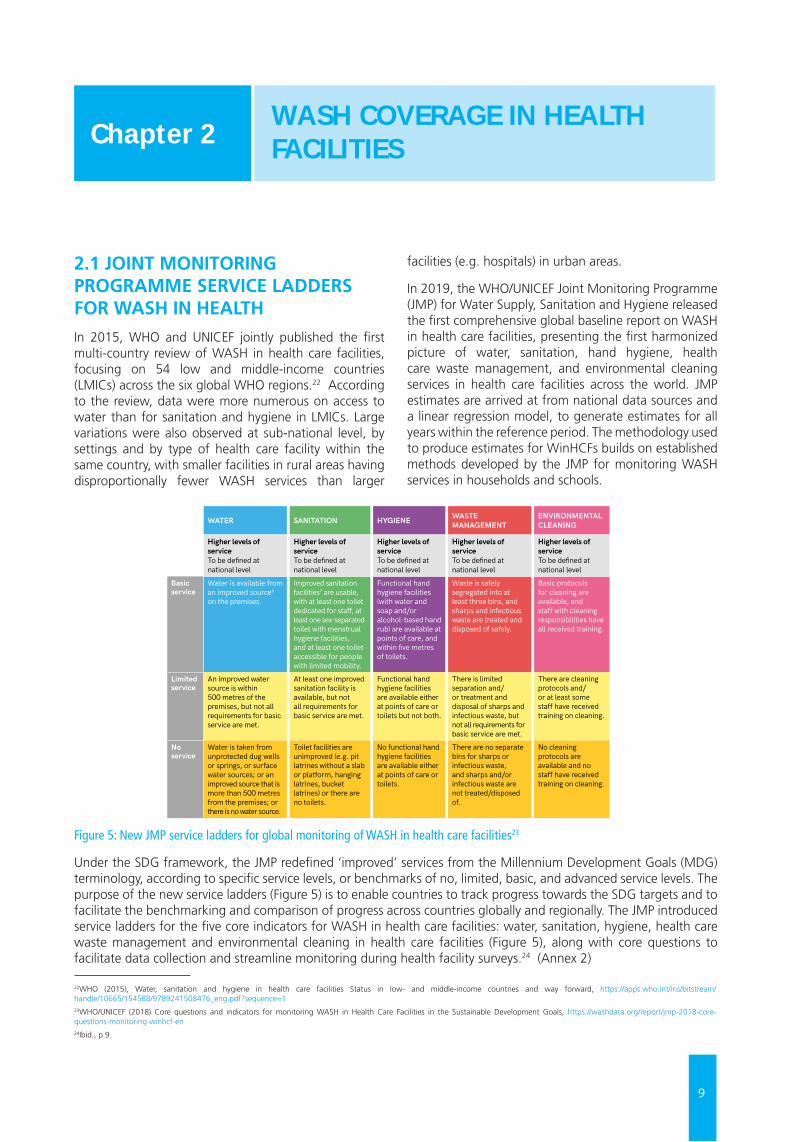
2.1 JOINT MONITORING PROGRAMME SERVICE LADDERS FOR WASH IN HEALTHIn 2015, WHO and UNICEF jointly published the first multi-country review of WASH in health care facilities, focusing on 54 low and middle-income countries (LMICs) across the six global WHO regions.22 According to the review, data were more numerous on access to water than for sanitation and hygiene in LMICs. Large variations were also observed at sub-national level, by settings and by type of health care facility within the same country, with smaller facilities in rural areas having disproportionally fewer WASH services than larger
facilities (e.g. hospitals) in urban areas.
In 2019, the WHO/UNICEF Joint Monitoring Programme (JMP) for Water Supply, Sanitation and Hygiene released the first comprehensive global baseline report on WASH in health care facilities, presenting the first harmonized picture of water, sanitation, hand hygiene, health care waste management, and environmental cleaning services in health care facilities across the world. JMP estimates are arrived at from national data sources and a linear regression model, to generate estimates for all years within the reference period. The methodology used to produce estimates for WinHCFs builds on established methods developed by the JMP for monitoring WASH services in households and schools.
WASH COVERAGE IN HEALTH FACILITIESChapter 2
Figure 5: New JMP service ladders for global monitoring of WASH in health care facilities23
Under the SDG framework, the JMP redefined ‘improved’ services from the Millennium Development Goals (MDG) terminology, according to specific service levels, or benchmarks of no, limited, basic, and advanced service levels. The purpose of the new service ladders (Figure 5) is to enable countries to track progress towards the SDG targets and to facilitate the benchmarking and comparison of progress across countries globally and regionally. The JMP introduced service ladders for the five core indicators for WASH in health care facilities: water, sanitation, hygiene, health care waste management and environmental cleaning in health care facilities (Figure 5), along with core questions to facilitate data collection and streamline monitoring during health facility surveys.24 (Annex 2)
41
PRACTIC
AL STEPS TO
ACH
IEVE U
NIV
ERSAL AC
CESS TO
QU
ALIT
Y C
ARE
Annex 1 . Key Definitions
Basic WASH services in health care facilitiesWHO has developed a set of minimum, global standards for environmental health in health care facilities (38). Deriving from this standards, a “basic” level of service has been defined and is achieved when key conditions are met in five areas: water, sanitation, hygiene, waste management and environmental cleaning.
To allow for inter-country comparability and global monitoring WHO and UNICEF have created set of questions that classify facilities in relation to “service ladders” (see Figure 2). For more information on how the service ladders are defined and measured, refer to
the JMP “Core questions and indicators for monitoring WASH in health care facilities in the Sustainable Development Goals” (39) and the 2019 JMP SDG Baseline report for WASH in health care facilities (1).
At the national level, countries are encouraged to define more ambitious, higher levels of service and to set and monitor corresponding indicators. Higher levels of service may consider further important aspects, including water quality (e.g. legionella, pseudomonas), including medical-grade water, water efficiency, safe plumbing, climate resilience of water and sanitation services, sustainability (including non-burn waste destruction methods), and safe collection, transport and treatment and the quality of disposed wastewater.
AN
NEX 1WATER SANITATION HYGIENE WASTE
MANAGEMENTENVIRONMENTAL CLEANING
Higher levels of service To be defined at national level
Higher levels of service To be defined at national level
Higher levels of service To be defined at national level
Higher levels of service To be defined at national level
Higher levels of service To be defined at national level
Basic service
Water is available from an improved source6 on the premises.
Improved sanitation facilities7 are usable, with at least one toilet dedicated for staff, at least one sex-separated toilet with menstrual hygiene facilities, and at least one toilet accessible for people with limited mobility.
Functional hand hygiene facilities (with water and soap and/or alcohol-based hand rub) are available at points of care, and within five metres of toilets.
Waste is safely segregated into at least three bins, and sharps and infectious waste are treated and disposed of safely.
Basic protocols for cleaning are available, and staff with cleaning responsibilities have all received training.
Limited service
An improved water source is within 500 metres of the premises, but not all requirements for basic service are met.
At least one improved sanitation facility is available, but not all requirements for basic service are met.
Functional hand hygiene facilities are available either at points of care or toilets but not both.
There is limited separation and/or treatment and disposal of sharps and infectious waste, but not all requirements for basic service are met.
There are cleaning protocols and/or at least some staff have received training on cleaning.
No service
Water is taken from unprotected dug wells or springs, or surface water sources; or an improved source that is more than 500 metres from the premises; or there is no water source.
Toilet facilities are unimproved (e.g. pit latrines without a slab or platform, hanging latrines, bucket latrines) or there are no toilets.
No functional hand hygiene facilities are available either at points of care or toilets.
There are no separate bins for sharps or infectious waste, and sharps and/or infectious waste are not treated/disposed of.
No cleaning protocols are available and no staff have received training on cleaning.
Figure 2. Service ladders for WASH in health care facilities
6 Improved water sources are those which by nature of their design and construction have the potential to deliver safe water. These include piped water, boreholes or tubewells, protected dug wells, protected springs, rainwater, and packaged or delivered water.
7 Improved sanitation facilities are those designed to hygienically separate human excreta from human contact. These include wet sanitation technologies – such as flush and pour flush toilets connecting to sewers, septic tanks or pit latrines – and dry sanitation technologies – such as dry pit latrines with slabs, and composting toilets.
22WHO (2015), Water, sanitation and hygiene in health care facilities Status in low- and middle-income countries and way forward, https://apps.who.int/iris/bitstream/handle/10665/154588/9789241508476_eng.pdf?sequence=123WHO/UNICEF (2018) Core questions and indicators for monitoring WASH in Health Care Facilities in the Sustainable Development Goals, https://washdata.org/report/jmp-2018-core-questions-monitoring-winhcf-en 24Ibid., p.9
10
Given the critical need for water for hand hygiene and infection prevention and control in administering care, for a health facility to classify as having met the ‘basic; service ladder for water, water had to be available from an improved source on the premise of the facility. As defined by the JMP, ‘improved water sources’ are sources which, by nature of design and construction, have the potential to deliver safe water, i.e. piped water, boreholes or tube wells, protected dug wells, protected springs, rainwater, and packaged or delivered water. ‘Unimproved sources’ refer to unprotected dug wells or springs and surface water (e.g. lakes, rivers, streams, ponds, canals and irrigation ditches). A basic sanitation service is one in which improved sanitation facilities are usable with at least one toilet dedicated for staff, at least one sex-separated toilet with menstrual hygiene facilities, and at least one toilet accessible for people with limited mobility.
Basic hygiene refers to functional hand hygiene facilities (with water and soap and/or alcohol-based hand rub) which are available at points of care, and within five metres of toilets. The health care facility is said to have basic waste disposal only if waste is safely segregated into at least three bins, and sharps and infectious waste are treated and disposed of safely. A basic service for environmental cleaning is one in which basic protocols for cleaning are available, and staff with cleaning responsibilities have all received training.
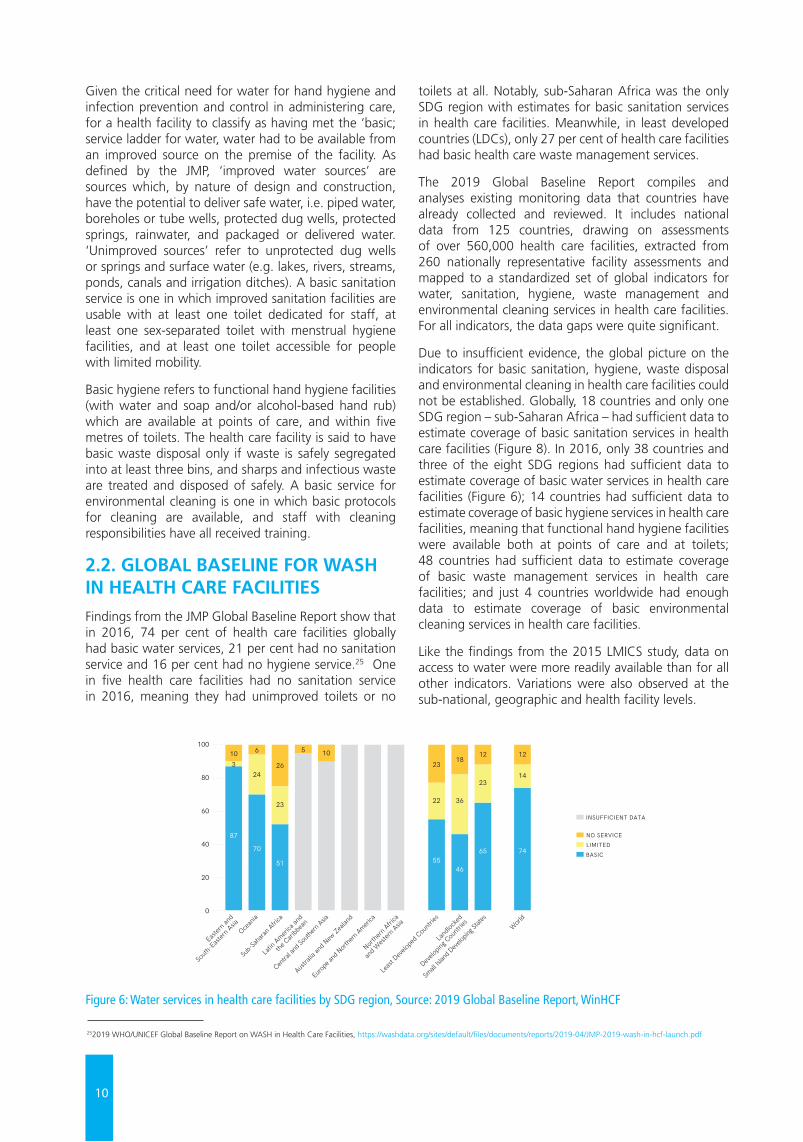
2.2. GLOBAL BASELINE FOR WASH IN HEALTH CARE FACILITIESFindings from the JMP Global Baseline Report show that in 2016, 74 per cent of health care facilities globally had basic water services, 21 per cent had no sanitation service and 16 per cent had no hygiene service.25 One in five health care facilities had no sanitation service in 2016, meaning they had unimproved toilets or no
toilets at all. Notably, sub-Saharan Africa was the only SDG region with estimates for basic sanitation services in health care facilities. Meanwhile, in least developed countries (LDCs), only 27 per cent of health care facilities had basic health care waste management services.
The 2019 Global Baseline Report compiles and analyses existing monitoring data that countries have already collected and reviewed. It includes national data from 125 countries, drawing on assessments of over 560,000 health care facilities, extracted from 260 nationally representative facility assessments and mapped to a standardized set of global indicators for water, sanitation, hygiene, waste management and environmental cleaning services in health care facilities. For all indicators, the data gaps were quite significant.
Due to insufficient evidence, the global picture on the indicators for basic sanitation, hygiene, waste disposal and environmental cleaning in health care facilities could not be established. Globally, 18 countries and only one SDG region – sub-Saharan Africa – had sufficient data to estimate coverage of basic sanitation services in health care facilities (Figure 8). In 2016, only 38 countries and three of the eight SDG regions had sufficient data to estimate coverage of basic water services in health care facilities (Figure 6); 14 countries had sufficient data to estimate coverage of basic hygiene services in health care facilities, meaning that functional hand hygiene facilities were available both at points of care and at toilets; 48 countries had sufficient data to estimate coverage of basic waste management services in health care facilities; and just 4 countries worldwide had enough data to estimate coverage of basic environmental cleaning services in health care facilities.
Like the findings from the 2015 LMICS study, data on access to water were more readily available than for all other indicators. Variations were also observed at the sub-national, geographic and health facility levels.
Figure 6: Water services in health care facilities by SDG region, Source: 2019 Global Baseline Report, WinHCF
16
WA
SH I
N H
EALT
H C
ARE
FAC
ILIT
IES
WAT
ER S
ERV
ICES
IN
HEA
LTH
CA
RE F
ACIL
ITIE
S
Globally, 38 countries, with a combined population of 2.6 billion people, had enough data to make nationally representative estimates for basic water services in health care facilities in 2016 (Figure 15). More countries had data on other indicators, with 69 countries, representing 61% of the global population, able to report on the proportion of health care facilities with no water service. The JMP produces regional and global estimates21 for new indicators, provided data are available for at least 30% of the relevant population.22
Globally, in 2016, 74% of health care facilities had basic water services (Figure 16). One in eight (12%) health care facilities had no water service, and the remaining 14% of health care facilities had limited services, meaning they either had access to an improved water source that was off the premises (but within 500 metres) or from which water was not available at the time of the assessment. Regional values for basic water services ranged from 51% in sub-Saharan Africa to 87% in Eastern and South-Eastern Asia (see Annex 2 for lists of the countries making up the eight SDG regions).
21 To prevent countries in a single region from having a disproportionate impact on global estimates, global estimates are calculated from regional estimates. See Annex 1: JMP Methods for more details. 22 Since the global population in 2016 was 7.47 billion, global estimates can be made provided data are available for countries representing at least 2.24 billion people. Note that regional
and global estimates are produced using national (or urban and rural) populations as weights, rather than the number of health care facilities (which would be more appropriate), because population data are more readily available than data on numbers of different types of health care facilities. For further details see Annex 1: JMP Methods.
87
70
51 5546
65
10 6 5 1023
23
22 36
1812
26
23
243
Least
Deve
loped
Countr
ies
Land
locke
d
Develop
ing Cou
ntries
Austra
lia an
d New
Zealan
d
Eastern
and
South
-East
ern Asia
Ocean
ia
Northe
rn Afric
a
and W
estern
Asia
Europe
and N
orthe
rn Ameri
ca
Latin
America
and
the Cari
bbea
n
Centra
l and S
outhe
rn Asia
Sub-S
ahara
n Afric
a
Small
Island
Develop
ing St
ates
100
80
60
40
20
0
74
14
12
World
■ LIMITED ■ NO SERVICE
■ BASIC
INSUFFICIENT DATA■
Globally, one quarter of health care facilities lacked basic water services in 2016
FIGURE 16 Regional water service coverage in health care facilities, 2016 (%)
In 2016, estimates of basic water services in health care facilities were available for 38 countries, representing 2.6 billion people
FIGURE 15
Data coverage for water services in health care facilities, by indicator (and number of countries with data available) and population with data available (billions), 2016
Basic services (n=38)
Improved and available (n=40)
Improved and on premises (n=53)
No services (n=69)
Any data (n=73)
2.6
2.6
3.1
4.6
4.6
252019 WHO/UNICEF Global Baseline Report on WASH in Health Care Facilities, https://washdata.org/sites/default/files/documents/reports/2019-04/JMP-2019-wash-in-hcf-launch.pdf
11
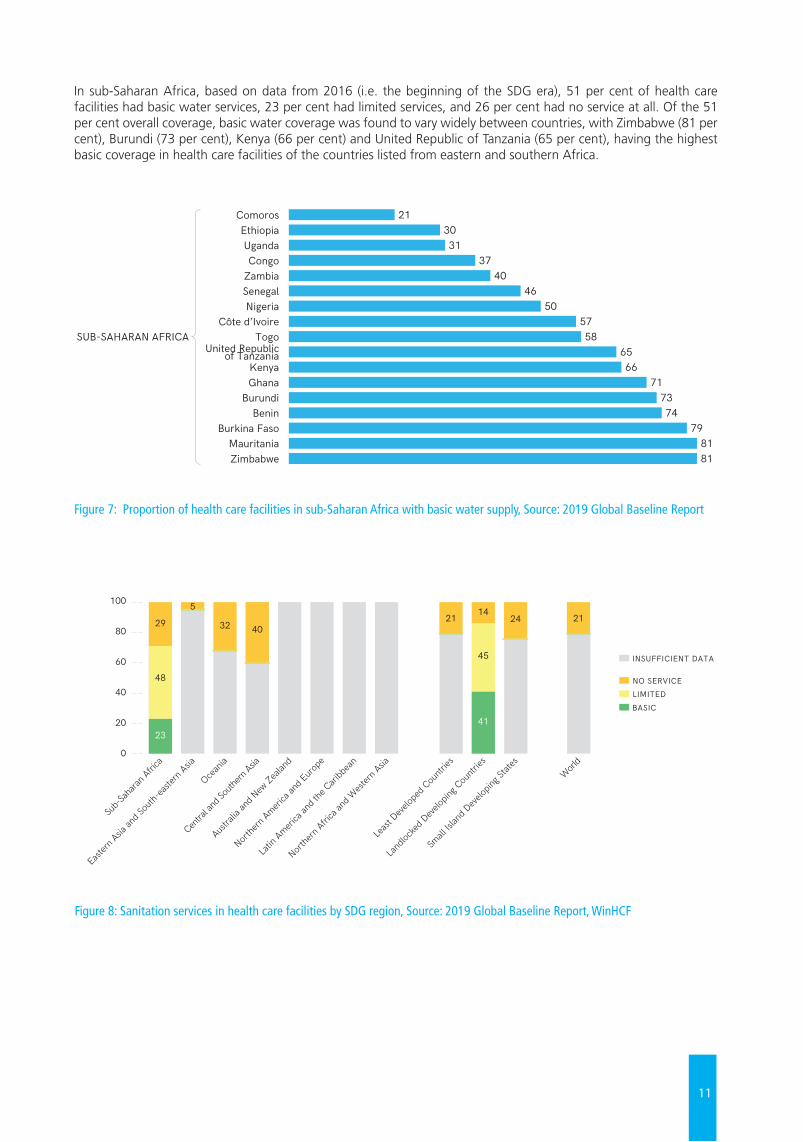
Figure 8: Sanitation services in health care facilities by SDG region, Source: 2019 Global Baseline Report, WinHCF
In sub-Saharan Africa, based on data from 2016 (i.e. the beginning of the SDG era), 51 per cent of health care facilities had basic water services, 23 per cent had limited services, and 26 per cent had no service at all. Of the 51 per cent overall coverage, basic water coverage was found to vary widely between countries, with Zimbabwe (81 per cent), Burundi (73 per cent), Kenya (66 per cent) and United Republic of Tanzania (65 per cent), having the highest basic coverage in health care facilities of the countries listed from eastern and southern Africa.
Figure 7: Proportion of health care facilities in sub-Saharan Africa with basic water supply, Source: 2019 Global Baseline Report
21
GLO
BAL BA
SELINE REPO
RT 2019W
ATER SERVIC
ES IN H
EALTH
CA
RE FACILITIES
Basic water coverage varies widely between countries
FIGURE 19 Proportion of health care facilities with basic water services, by country and SDG region, 2016 (%)
ComorosEthiopiaUgandaCongo
ZambiaSenegalNigeria
Côte d’IvoireTogo
United Republicof Tanzania
KenyaGhana
BurundiBenin
Burkina FasoMauritaniaZimbabwe
PeruHondurasParaguay
PapuaNew Guinea
Viet NamIndonesia
China
MaldivesBangladesh
Sri Lanka
ArmeniaLebanon
AzerbaijanKuwait
SerbiaAndorraCzechiaEstonia
LithuaniaMontenegroSan Marino
0 20 40 60 80 100
3021
3137
4046
505758
6566
717374
798181
4658
85
70
5180
91
5570
99
3961
100100
96100100100100100100
SUB-SAHARAN AFRICA
LATIN AMERICAAND THE
CARIBBEAN
EUROPE ANDNORTHERN
AMERICA
NORTHERN AFRICAAND WESTERN ASIA
CENTRAL ANDSOUTHERN ASIA
EASTERN ANDSOUTH-EASTERN ASIA
OCEANIA
29
GLO
BAL BA
SELINE REPO
RT 2019SA
NITATIO
N SERV
ICES IN
HEA
LTH C
ARE FAC
ILITIES
Four SDG regions had estimates of no sanitation service, ranging from 5% in Eastern and South-Eastern Asia to 40% in Central and Southern Asia. In sub-Saharan Africa (the only SDG region to have an estimate for basic services) less than one in four health care facilities (23%) had basic services. Insufficient data were available to generate any regional estimates for the other four SDG regions.
Coverage of basic sanitation services varied widely among the 18 countries with estimates available in 2016 (Figure 29). In 10 of these countries, fewer than one in four health care facilities had basic sanitation services.
Globally, 21% of health care facilities had no sanitation service in 2016
FIGURE 28 Regional sanitation services in health care facilities, 2016 (%)
2341
29
5
4021 21
45
1424
32
48
Least
Deve
loped
Countr
ies
Land
locke
d Deve
loping
Countr
ies
Austra
lia an
d New
Zealan
d
Eastern
Asia an
d Sou
th-ea
stern
Asia
Ocean
ia
Northe
rn Afric
a and
West
ern Asia
Northe
rn Ameri
ca an
d Euro
pe
Latin
America
and t
he Cari
bbea
n
Centra
l and S
outhe
rn Asia
Sub-S
ahara
n Afric
a
Small
Islan
d Deve
loping
State
sWorl
d
100
80
60
40
20
0
■ LIMITED ■ NO SERVICE
■ BASIC
INSUFFICIENT DATA■
Estimates of basic sanitation services were available for 18 countries in 2016
FIGURE 29 Sanitation services in health care facilities among countries with estimates for basic services in 2016 (%)
■ NO SERVICE■ LIMITED■ BASIC
Kuw
ait
Cze
chia
Mon
tene
gro
Serb
ia
Ethi
opia
Azer
baija
n
Arm
enia
Para
guay
Zim
babw
e
Leba
non
Mal
dive
s
Nig
eria
Ugan
da
Peru
Unite
d Re
publ
icof
Tan
zani
a
Libe
ria
Com
oros
Hon
dura
s
100
80
60
40
20
0
100 9585
7359
4841
2616 15 12 12 7 5
173 2 1
515
27 24
17
52
19
4062
12 18
6685
41
47
79
9 10
83
49
46
83
24
73
49
49
95
4
12
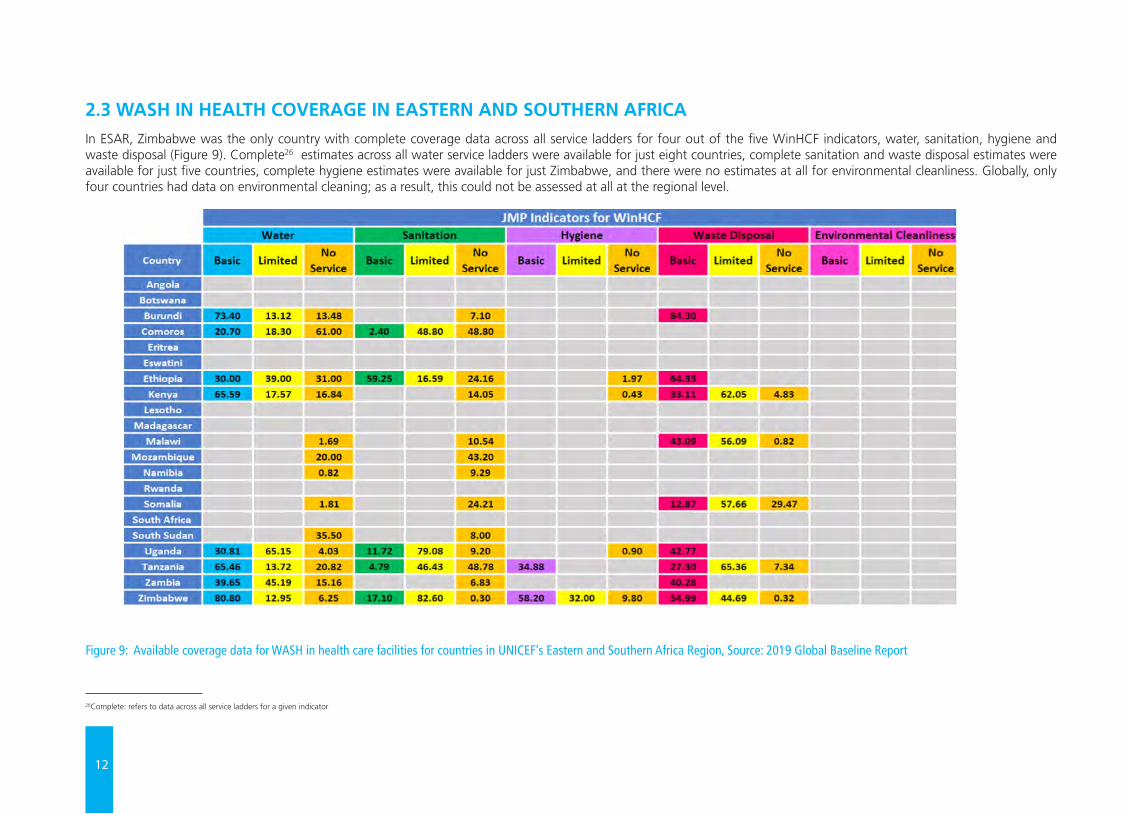
2.3 WASH IN HEALTH COVERAGE IN EASTERN AND SOUTHERN AFRICAIn ESAR, Zimbabwe was the only country with complete coverage data across all service ladders for four out of the five WinHCF indicators, water, sanitation, hygiene and waste disposal (Figure 9). Complete26 estimates across all water service ladders were available for just eight countries, complete sanitation and waste disposal estimates were available for just five countries, complete hygiene estimates were available for just Zimbabwe, and there were no estimates at all for environmental cleanliness. Globally, only four countries had data on environmental cleaning; as a result, this could not be assessed at all at the regional level.
Figure 9: Available coverage data for WASH in health care facilities for countries in UNICEF’s Eastern and Southern Africa Region, Source: 2019 Global Baseline Report
26Complete: refers to data across all service ladders for a given indicator
13
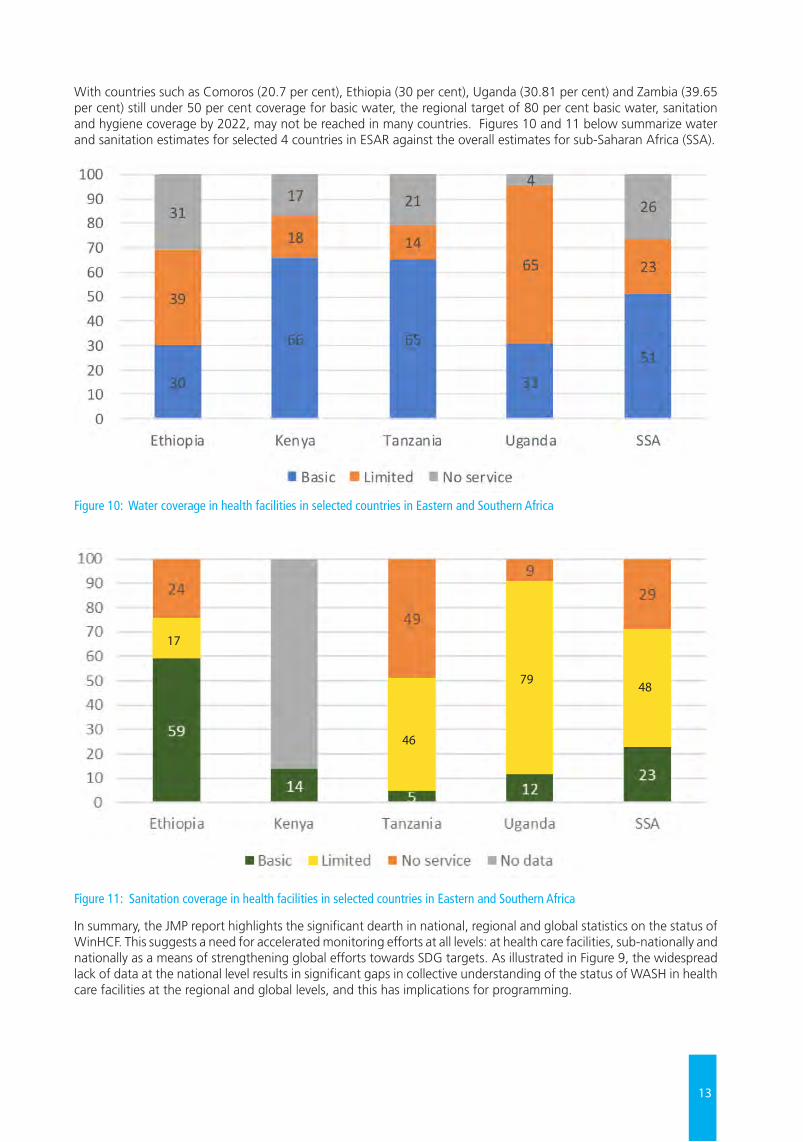
With countries such as Comoros (20.7 per cent), Ethiopia (30 per cent), Uganda (30.81 per cent) and Zambia (39.65 per cent) still under 50 per cent coverage for basic water, the regional target of 80 per cent basic water, sanitation and hygiene coverage by 2022, may not be reached in many countries. Figures 10 and 11 below summarize water and sanitation estimates for selected 4 countries in ESAR against the overall estimates for sub-Saharan Africa (SSA).
Figure 10: Water coverage in health facilities in selected countries in Eastern and Southern Africa
Figure 11: Sanitation coverage in health facilities in selected countries in Eastern and Southern Africa
In summary, the JMP report highlights the significant dearth in national, regional and global statistics on the status of WinHCF. This suggests a need for accelerated monitoring efforts at all levels: at health care facilities, sub-nationally and nationally as a means of strengthening global efforts towards SDG targets. As illustrated in Figure 9, the widespread lack of data at the national level results in significant gaps in collective understanding of the status of WASH in health care facilities at the regional and global levels, and this has implications for programming.
17
46
79 48
14
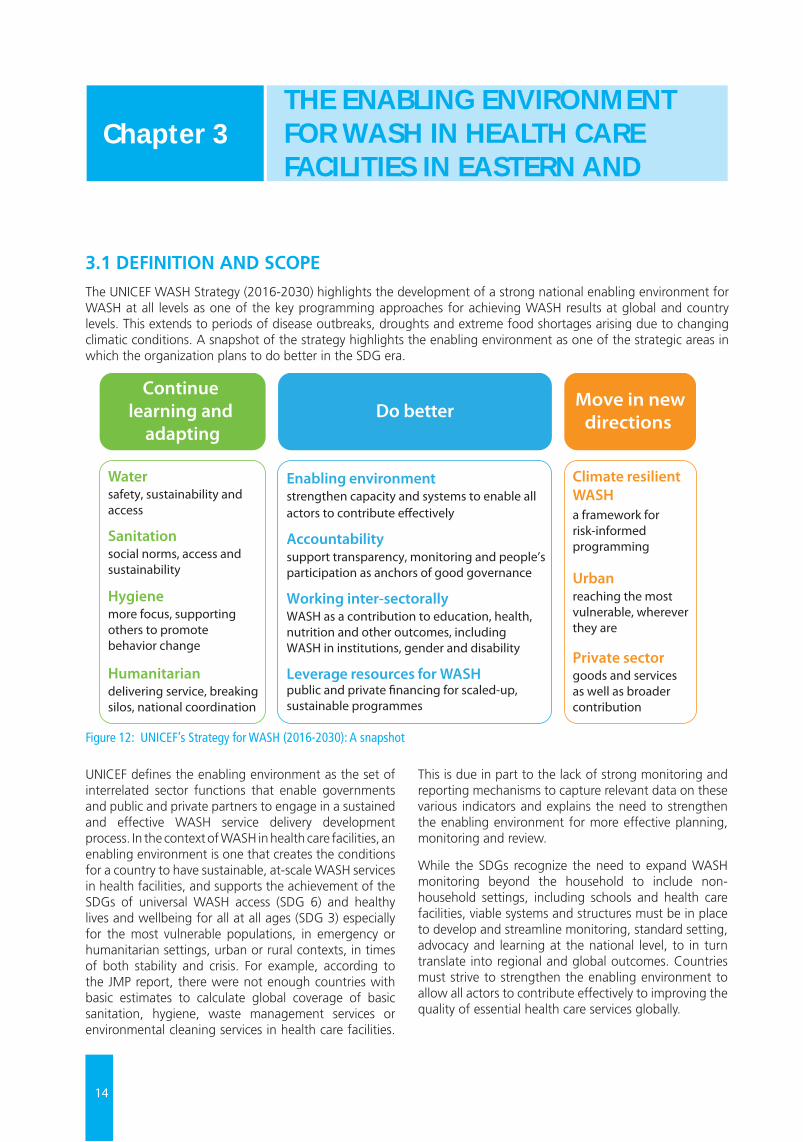
3.1 DEFINITION AND SCOPEThe UNICEF WASH Strategy (2016-2030) highlights the development of a strong national enabling environment for WASH at all levels as one of the key programming approaches for achieving WASH results at global and country levels. This extends to periods of disease outbreaks, droughts and extreme food shortages arising due to changing climatic conditions. A snapshot of the strategy highlights the enabling environment as one of the strategic areas in which the organization plans to do better in the SDG era.
Figure 12: UNICEF’s Strategy for WASH (2016-2030): A snapshot
THE ENABLING ENVIRONMENT FOR WASH IN HEALTH CARE FACILITIES IN EASTERN AND
Chapter 3
Hygienemore focus, supporting others to promotebehavior change
Humanitariandelivering service, breaking silos, national coordination
Watersafety, sustainability and access
Sanitationsocial norms, access and sustainability
Continue learning and
adapting
Private sectorgoods and services as well as broader contribution
Climate resilient WASHa framework for risk-informed programming
Urbanreaching the most vulnerable, wherever they are
Move in newdirections
Do better
Working inter-sectorallyWASH as a contribution to education, health, nutrition and other outcomes, including WASH in institutions, gender and disability
Enabling environmentstrengthen capacity and systems to enable all actors to contribute e�ectively
Accountabilitysupport transparency, monitoring and people’s participation as anchors of good governance
Leverage resources for WASHpublic and private �nancing for scaled-up, sustainable programmes
UNICEF defines the enabling environment as the set of interrelated sector functions that enable governments and public and private partners to engage in a sustained and effective WASH service delivery development process. In the context of WASH in health care facilities, an enabling environment is one that creates the conditions for a country to have sustainable, at-scale WASH services in health facilities, and supports the achievement of the SDGs of universal WASH access (SDG 6) and healthy lives and wellbeing for all at all ages (SDG 3) especially for the most vulnerable populations, in emergency or humanitarian settings, urban or rural contexts, in times of both stability and crisis. For example, according to the JMP report, there were not enough countries with basic estimates to calculate global coverage of basic sanitation, hygiene, waste management services or environmental cleaning services in health care facilities.
This is due in part to the lack of strong monitoring and reporting mechanisms to capture relevant data on these various indicators and explains the need to strengthen the enabling environment for more effective planning, monitoring and review.
While the SDGs recognize the need to expand WASH monitoring beyond the household to include non-household settings, including schools and health care facilities, viable systems and structures must be in place to develop and streamline monitoring, standard setting, advocacy and learning at the national level, to in turn translate into regional and global outcomes. Countries must strive to strengthen the enabling environment to allow all actors to contribute effectively to improving the quality of essential health care services globally.
15
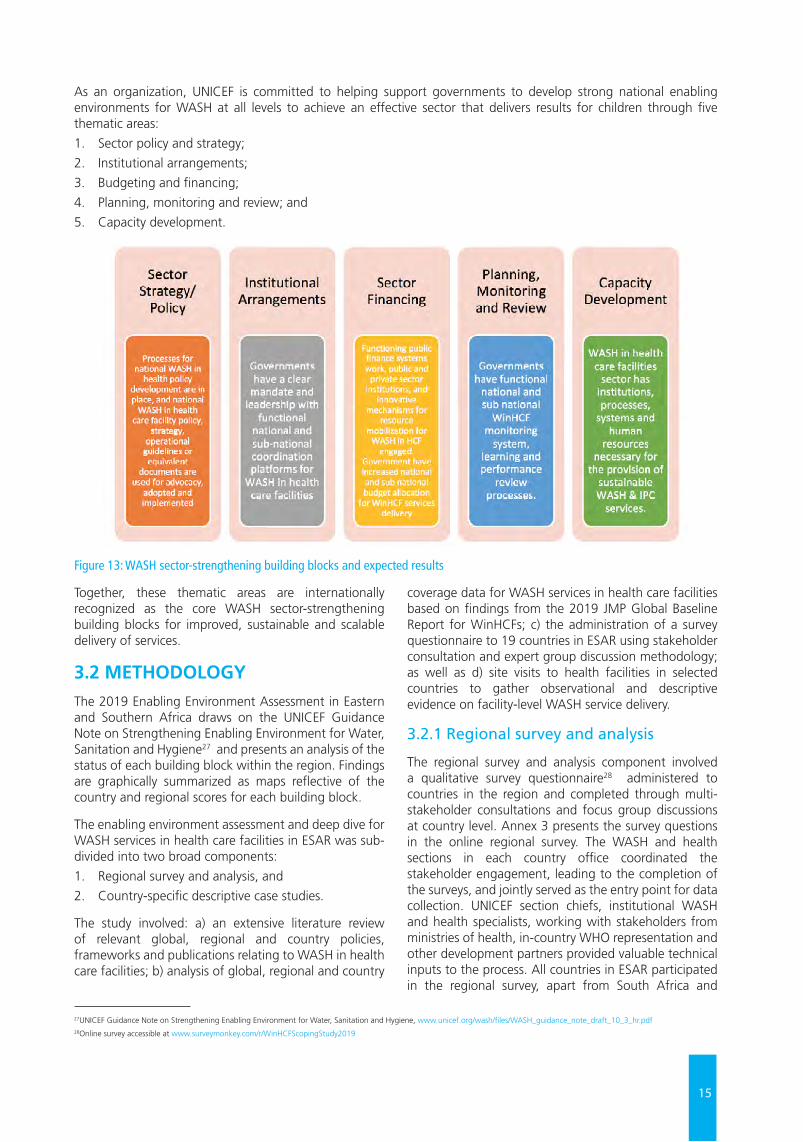
As an organization, UNICEF is committed to helping support governments to develop strong national enabling environments for WASH at all levels to achieve an effective sector that delivers results for children through five thematic areas:
1. Sector policy and strategy;
2. Institutional arrangements;
3. Budgeting and financing;
4. Planning, monitoring and review; and
5. Capacity development.
Figure 13: WASH sector-strengthening building blocks and expected results
Together, these thematic areas are internationally recognized as the core WASH sector-strengthening building blocks for improved, sustainable and scalable delivery of services.
3.2 METHODOLOGYThe 2019 Enabling Environment Assessment in Eastern and Southern Africa draws on the UNICEF Guidance Note on Strengthening Enabling Environment for Water, Sanitation and Hygiene27 and presents an analysis of the status of each building block within the region. Findings are graphically summarized as maps reflective of the country and regional scores for each building block.
The enabling environment assessment and deep dive for WASH services in health care facilities in ESAR was sub-divided into two broad components:
1. Regional survey and analysis, and
2. Country-specific descriptive case studies.
The study involved: a) an extensive literature review of relevant global, regional and country policies, frameworks and publications relating to WASH in health care facilities; b) analysis of global, regional and country
coverage data for WASH services in health care facilities based on findings from the 2019 JMP Global Baseline Report for WinHCFs; c) the administration of a survey questionnaire to 19 countries in ESAR using stakeholder consultation and expert group discussion methodology; as well as d) site visits to health facilities in selected countries to gather observational and descriptive evidence on facility-level WASH service delivery.
3.2.1 Regional survey and analysis
The regional survey and analysis component involved a qualitative survey questionnaire28 administered to countries in the region and completed through multi-stakeholder consultations and focus group discussions at country level. Annex 3 presents the survey questions in the online regional survey. The WASH and health sections in each country office coordinated the stakeholder engagement, leading to the completion of the surveys, and jointly served as the entry point for data collection. UNICEF section chiefs, institutional WASH and health specialists, working with stakeholders from ministries of health, in-country WHO representation and other development partners provided valuable technical inputs to the process. All countries in ESAR participated in the regional survey, apart from South Africa and
27UNICEF Guidance Note on Strengthening Enabling Environment for Water, Sanitation and Hygiene, www.unicef.org/wash/files/WASH_guidance_note_draft_10_3_hr.pdf28Online survey accessible at www.surveymonkey.com/r/WinHCFScopingStudy2019
16
Botswana, which have no UNICEF WASH programming/staffing, making data collection within the timeframe in those two countries quite challenging.29
As captured in UNICEF’s global programming approach, the regional survey focused on the five enabling environment sector-strengthening building blocks/thematic areas: Sector policy/strategy; Institutional arrangements; Sector financing; Planning, monitoring and review; and Capacity development. The survey questionnaire (Annex 3), containing 36 questions, subdivided across the five building blocks, was administered to 19 out of the 21 UNICEF programming countries in the region, with the aim of assessing the status of the enabling environment for WASH services in health care facilities in the region. The questionnaire consisted largely of multiple-choice questions, with responses:
• Yes;
• No;
• Now Being Developed/To A Limited Extent, and
• I Don’t Know.
Each UNICEF country office (CO) team was tasked with engaging with the relevant national partners and stakeholders, compiling relevant documentary evidence and completing the administered self-reporting survey questionnaire within a 45-day period. For specific policy questions, COs were expected to attach supporting documentary evidence to validate the responses provided. This enabled data triangulation through desk review, and further engagement with COs and partners to clarify responses and validate survey results.
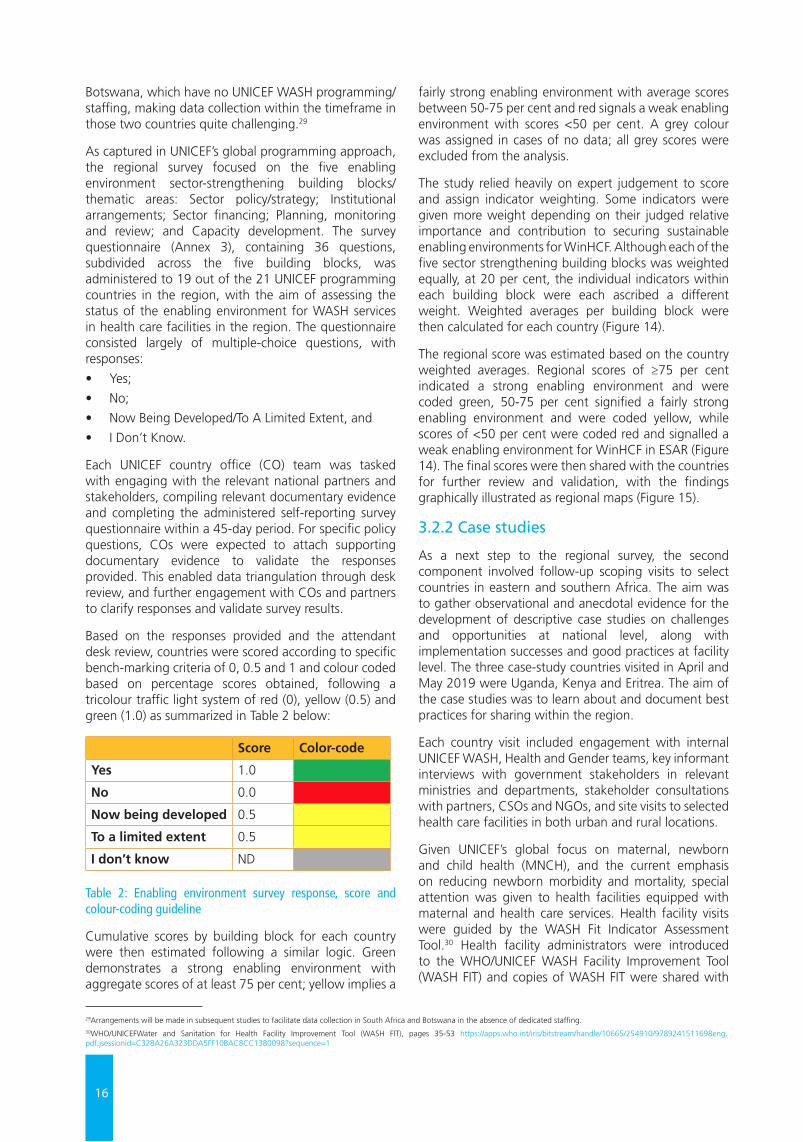
Based on the responses provided and the attendant desk review, countries were scored according to specific bench-marking criteria of 0, 0.5 and 1 and colour coded based on percentage scores obtained, following a tricolour traffic light system of red (0), yellow (0.5) and green (1.0) as summarized in Table 2 below:
Score Color-code
Yes 1.0
No 0.0
Now being developed 0.5
To a limited extent 0.5
I don’t know ND Table 2: Enabling environment survey response, score and colour-coding guideline
Cumulative scores by building block for each country were then estimated following a similar logic. Green demonstrates a strong enabling environment with aggregate scores of at least 75 per cent; yellow implies a
fairly strong enabling environment with average scores between 50-75 per cent and red signals a weak enabling environment with scores <50 per cent. A grey colour was assigned in cases of no data; all grey scores were excluded from the analysis.
The study relied heavily on expert judgement to score and assign indicator weighting. Some indicators were given more weight depending on their judged relative importance and contribution to securing sustainable enabling environments for WinHCF. Although each of the five sector strengthening building blocks was weighted equally, at 20 per cent, the individual indicators within each building block were each ascribed a different weight. Weighted averages per building block were then calculated for each country (Figure 14).
The regional score was estimated based on the country weighted averages. Regional scores of ≥75 per cent indicated a strong enabling environment and were coded green, 50-75 per cent signified a fairly strong enabling environment and were coded yellow, while scores of <50 per cent were coded red and signalled a weak enabling environment for WinHCF in ESAR (Figure 14). The final scores were then shared with the countries for further review and validation, with the findings graphically illustrated as regional maps (Figure 15).
3.2.2 Case studies
As a next step to the regional survey, the second component involved follow-up scoping visits to select countries in eastern and southern Africa. The aim was to gather observational and anecdotal evidence for the development of descriptive case studies on challenges and opportunities at national level, along with implementation successes and good practices at facility level. The three case-study countries visited in April and May 2019 were Uganda, Kenya and Eritrea. The aim of the case studies was to learn about and document best practices for sharing within the region.
Each country visit included engagement with internal UNICEF WASH, Health and Gender teams, key informant interviews with government stakeholders in relevant ministries and departments, stakeholder consultations with partners, CSOs and NGOs, and site visits to selected health care facilities in both urban and rural locations.
Given UNICEF’s global focus on maternal, newborn and child health (MNCH), and the current emphasis on reducing newborn morbidity and mortality, special attention was given to health facilities equipped with maternal and health care services. Health facility visits were guided by the WASH Fit Indicator Assessment Tool.30 Health facility administrators were introduced to the WHO/UNICEF WASH Facility Improvement Tool (WASH FIT) and copies of WASH FIT were shared with
29Arrangements will be made in subsequent studies to facilitate data collection in South Africa and Botswana in the absence of dedicated staffing. 30WHO/UNICEFWater and Sanitation for Health Facility Improvement Tool (WASH FIT), pages 35-53 https://apps.who.int/iris/bitstream/handle/10665/254910/9789241511698eng.pdf;jsessionid=C328A26A323DDA5FF10BAC8CC1380098?sequence=1
17
each facility’s administration as a means of familiarizing them with current global approaches, a gesture which was well received and appreciated by the health workers.
The Uganda mission included visits to 5 health care facilities, Kenya, 4 and Eritrea, 8, totalling 17 health facilities across the three countries. Each case study followed a strengths and weaknesses, opportunities and threats/barriers (SWOT) analysis approach to WinHCF programming at scale. The scoping visits were intended to gather in-depth understanding of the processes and drivers of success in each country; and to compile game-changing strategic approaches to accelerate progress towards meeting SDG targets and regional priorities for WASH services in health care facilities in ESAR.
3.3 SOURCES OF INFORMATIONFor both components of the study, the sources of information consisted of:
• An administered online survey questionnaire;
• Engagement with UNICEF WASH and health specialists and related programme staff;
• Stakeholder consultations with national resource persons, focal points, line ministries and WHO representation;
• Focus group discussions with civil society and development partners;
• Key informant interviews with relevant resource persons;
• A desk review of documentary evidence; and
• Direct observation through site visits to health facilities, line ministries, and district/provincial offices.
3.4 SPECIAL ACKNOWLEDGEMENT UNICEF CO WASH and health section staff played key roles in engaging stakeholders; coordinating data collection; completing the enabling environment survey questionnaire; compiling and submitting supporting documents/reports for review; planning and organizing country missions in the selected countries; and facilitating site visits to the health care facilities. Their valuable support and inputs to enriching regional understanding of this emerging issue as part of the enabling environment study is duly acknowledged and appreciated.
© U
NIC
EF/U
N03
0632
1/A
bdul
18
Figure 14: Regional WASH in health care facilities enabling environment scorecard for countries in ESAR
2019 Scoping Study of WASH in Health Care Facilities in Eastern and Southern Africa
Sector Strengthening Building Blocks
Wei
ghti
ng
Ang
ola
Buru
ndi
Com
oros
Erit
rea
E-Sw
atin
i
Ethi
opia
Keny
a
Leso
tho
Mad
agas
car
Mal
awi
Moz
ambi
que
Nam
ibia
Rwan
da
Som
alia
Sout
h Su
dan
Uga
nda
Uni
ted
Repu
blic
of
Tan
zani
a
Zam
bia
Zim
babw
e
Regi
onal
Sco
re
Enabling Environment Indicators
1 Is WiHCFs addressed in a national policy/strategy document? If any, please specify and attach. 4.0 1 1.0 1.0 1.0 1.0 1.0 1.0 1.0 1.0 1.0 0.5 1.0 1.0 1.0 0.0 1.0 1.0 1.0 1.0 92.1%
Sector Policy and Strategy (20 per cent)
Sector Policy and Strategy (20 per cent)
2 Is the level of implementation/enforcement of the national documents at scale, nationwide level? 3.0 0.5 1.0 0.5 0.5 0.5 0.5 1.0 0.5 0.5 0.5 0.5 1.0 1.0 0.5 0.5 0.5 0.5 1.0 1.0 65.8%
Sector Policy and Strategy (20 per cent)
Sector Policy and Strategy (20 per cent)
3 Does the national document include a costed implementation plan? 2.0 1.0 0.5 0.0 0.0 1.0 1.0 0.5 0.5 0.5 0.0 0.5 0.5 0.5 0.0 0.0 0.5 0.5 44.1%
Sector Policy and Strategy (20 per cent)
Sector Policy and Strategy (20 per cent)
4Does the national document include specific protocols/norms for water services from an improved source located on premises (running water)?
1.0 1.0 0.0 0.5 0.0 1.0 1.0 1.0 0.5 0.5 1.0 0.5 1.0 1.0 0.0 0.0 0.5 1.0 1.0 0.0 60.5%
Sector Policy and Strategy (20 per cent)
5Does the national document include specific protocols/norms of water services from an improved source water from an improved source is available in specific critical departments (labor and delivery rooms, pediatric and surgical units)?
1.0 0 0 0 0 1 1 1 0.5
0.5 1 0.5 1 1 0.5 0 0.5 1 0 0 50.0%
Sector Policy and Strategy (20 per cent)
6Does the national document include specific protocols/norms of sanitation services (available and functional toilets in facilities, wastewater/fecal matter disposal)?
1.0 1.0 0.0 0.5 1.0 1.0 1.0 1.0 0.5 0.5 1.0 0.5 1.0 1.0 0.5 0.0 0.5 1.0 1.0 72.2%
Sector Policy and Strategy (20 per cent)
7 Does the national document include specific protocols/norms for hand hygiene (soap and/or alcohol based hand rub)? 1.0 1 0 0 1 1 ND 1 0.5 1 1 0.5 1 1 0.5 0 1 1 1 0 69.4%
0
8Does the national document include specific protocols/norms for health care waste (including segregation of sharps and infectious waste)?
1.0 1 1 0.5 1 1 1 1 0.5 1 1 0.5 1 1 0.5 0 1 1 1 1 84.2%
9 Does the national document include specific protocols/norms for environmental cleaning (facilities and environs)? 1.0 1 1 0 1 1 ND 1 0.5
0.5 1 0.5 1 1 0.5 0 1 1 1 0.5 75.0%
10Does the national document include specific protocols/norms of special mobility needs of patients (including patients with limited mobility, using wheelchairs, crutches, etc.)?
1.0 1 0 0.5 1 1 0.5
0.5
0.5 0 1 0.5 1 0 0 0 0.5 1 1 0 52.6%
11 Does the national document include specific protocols/norms for specific menstrual health and hygiene needs of patients and staff? 1.0 0 0 0 0 1 ND 0 ND
0.5 1 0.5
0.5 0 0 0 0.5
0.5 1 0 32.4%
12 Is there a nationally adopted engineering design for WASH facilities in health care centers? If yes, please attach. 1.0 0 0 0 1 0.5 1 1 0.5 1 ND 0 1 0 0.5 0 0.5
0.5
0.5 1 50.0%
13 Is WASH FIT (Water and Sanitation for Health Facility Improvement Tool) being piloted or implemented in your country? 1.0 0 0 0.5 0 0 0 0.5 0 0.5
ND 0 0 0.5 0 0 0 0.5
0.5 0 16.7%
14 Are there any other WASH in Health Facilities improvement tools being implemented nationally or sub nationally? If yes, please attach. 1.0 0 0 0.5 1 1 ND 1 0 1 ND 0 1 1 0.5 0 0.5 1 0.5 0 52.9%
20.0 67.5% 50.0% 42.5% 62.5% 75.0% 81.3% 90.0% 55.3% 67.5% 85.3% 37.5% 82.5% 77.5% 50.0% 12.5% 60.0% 75.0% 82.5% 52.5% 63.5%
Sector Policy and Strategy (20 per cent)
15 Is there a clearly defined lead agency for WiHCFS? 7.0 0.0 1.0 1.0 1.0 1.0 1.0 1.0 1.0 1.0 0.5 1.0 1.0 1.0 1.0 1.0 1.0 1.0 1.0 1.0 92.1%
Institutional Arrangements (20 per
cent)
Institutional Arrangements (20 per
cent)
16 Is there a national operations and maintenace (O&M) plan sfor WiHCFs? If so, attach. 7.0 0.0 0.0 0.0 0.0 0.0 0.5 1.0 0.5 0.5 0.0 0.0 0.0 0.5 0.0 0.5 23.3%Institutional Arrangements (20 per
cent) 17Does the national O&M plan specify the roles and responsibilities of actors at the national, sub-national, hospital, health facility and health post levels?
3.0 0.0 0.0 0.0 0.0 0.0 1.0 0.5 0.0 0.5 1.0 0.0 0.0 ND 0.0 0.0 0.0 1.0 0.0 0.0 22.2%
18 Does the national O&M plan specify the roles and responsibilities of the community? 3.0 0.0 0.0 0.0 0.0 0.0 ND 1.0 0.0 0.0 1.0 0.0 0.0 0.5 0.0 0.0 0.0 16.7%
20.0 0% 35% 35% 35% 35% 79% 93% 53% 60% 48% 35% 35% 71% 35% 35% 35% 68% 35% 35% 46%
Institutional Arrangements (20 per
cent)
19 Is there a public-sector budget for WinHCFs? 6.0 0.0 0.5 0.0 0.5 0.5 1.0 0.5 0.5 0.5 1.0 1.0 0.0 1.0 0.5 1.0 0.5 56.3%
Sector Financing (20 per cent)
Sector Financing (20 per cent)
20 Is there a resource mobilization strategy specifically targeting WiHCFs? If yes, attach. 4.0 0.0 0.0 0.5 0.0 1.0 0.5 0.5 0.5 0.0 0.5 68.2%
Sector Financing (20 per cent)
Sector Financing (20 per cent)
21Are there other programmes, funding/financing sources that support the provision of soap and other alcohol based hand rub for hand hygiene in health care facilities?
3.0 0.0 0.5 0.5 0.5 0.5 0.5 0.5 1.0 ND 1.0 1.0 0.0 1.0 1.0 0.5 0.5 75.0%Sector Financing (20 per cent)
Sector Financing (20 per cent)
22 Is there a national budgetary allocation specifically for O&M of WASH services in health care facilities? 4.0 0.0 0.0 0.0 0.5 1.0 0.5 0.5 0.5 0.5 0.0 0.0 1.0 0.0 0.0 0.0 0.5 0.5 52.8%
23Are there other programmes, funding/financing sources that support the provision of supplies including sharp boxes for segregated health care waste disposal in health care facilities?
3.0 0.5 1.0 0.5 0.5 0.5 1.0 0.0 0.0 1.0 0.5 1.0 1.0 1.0 0.0 0.0 1.0 1.0 1.0 0.5 75.0%
Sector Financing (20 per cent)
20.0 7.5% 37.5% 25.0% 40.0% 50.0% 82.5% 25.0% 35.0% 57.5% 52.5% 17.6% 45.0% 60.0% 15.0% 0.0% 70.0% 55.0% 62.5% 30.0% 63.6%
24 Is WiHCFS monitored at national and sub-national level? 6.0 0.0 1.00 0.5 1.0 0.5 0.5 0.5 1.0 1.0 0.0 1.0 0.5 0.5 0.0 0.5 1.0 0.5 0.5 60.5%
Planning, Monitoring and Review (20 per
cent)
Planning, Monitoring and Review (20 per
cent)
25Are there dedicated institutional arrangements in place for monitoring WASH in health care facilities at the national and sub-national levels?
4.0 0.0 1.0 1.0 0.5 1.0 0.5 1.0 0.5 1.0 1.0 0.5 0.0 0.5 1.0 1.0 0.5 68.8%
Planning, Monitoring and Review (20 per
cent)
Planning, Monitoring and Review (20 per
cent)
26 Are core SDG questions/indicators integrated into the national Health Management Information System (HMIS)? 4.0 ND 0.5 0.0 0.5 0.5 1.0 0.5 0.5 0.5 0.0 0.5 0.5 0.5 45.8%Planning, Monitoring and Review (20 per
cent)
Planning, Monitoring and Review (20 per
cent)27 Does the HMIS include indicators addressing usage and functionality of WASH infrastructure in health care facilities? 2.0 ND 0.0 0.5 0.5 0.5 0.5 40.0%
28 Does your country conduct periodic Service Availability and Readiness Assessments (SARA)? 1.0 0.0 1.0 1.0 1.0 1.0 1.0 0.5 ND 1.0 1.0 0.5 0.5 1.0 1.0 80.8%
Planning, Monitoring and Review (20 per
cent)
Planning, Monitoring and Review (20 per
cent)
29 Does your country conduct periodic Service Provision Assessments (SPA)? 1.0 0.0 0.0 1.0 1.0 1.0 0.5 ND ND 0.0 0.5 1.0 55.6%
30Are the findings/data generated from the HMIS, SARA or SPA surveys being used to support reporting, programming & resource mobilization for WiHCFs at the national and sub-national levels?
2.0 0.0 1.0 1.0 0.5 1.0 0.5 0.5 1.0 0.5 0.5 0.5 0.5 0.5 0.0 57.1%
Planning, Monitoring and Review (20 per
cent)
20.00 0.0% 75.0% 0.0% 15.0% 70.0% 50.0% 65.0% 35.0% 85.0% 72.2% 5.0% 50.0% 60.0% 50.0% 0.0% 45.0% 75.0% 50.0% 30.0% 57.6%
31 Have the relevant staff and workers been trained on waste disposal at the national and sub-national levels? 7.0 0.5 1.00 0.5 1.0 1.0 0.5 1.0 1.0 0.5 0.5 1.0 1.0 0.5 0.5 0.5 1.0 1.0 1.0 77.8%
Capacity Development (20 per cent)
Capacity Development (20 per cent)
32 Have the relevant staff and workers been trained on environmental cleanliness at the national and sub-national levels? 7.0 0.5 1.0 0.5 1.0 1.0 1.0 1.0 1.0 0.5 1.0 1.0 0.5 0.0 0.5 1.0 0.5 1.0 76.5%Capacity Development
(20 per cent)33
Has there been any training around WASH FIT (Water and Sanitation for Health Facility Improvement Tool) at the national or sub-national level?
3.0 0.0 0.5 0.0 0.0 0.5 0.0 0.5 1.0 31.3%
34 Has there been any training around other WASH in health improvement tools at the national or sub-national level? 3.0 0.5 0.5 1.0 ND 0.0 1.0 ND 1.0 0.5 0.5 1.0 66.7%
20.00 35.0% 77.5% 0.0% 50.0% 85.0% 82.4% 17.5% 70.0% 85.0% 61.8% 35.0% 70.0% 85.0% 35.0% 17.5% 42.5% 85.0% 82.5% 70.0% 68.7%
Total Country Score 100.0 22.0% 55.0% 20.5% 40.5% 63.0% 75.1% 58.0% 49.6% 71.0% 63.9% 26.0% 56.5% 70.6% 37.0% 13.0% 50.5% 71.5% 62.5% 43.5% 59.9%
*Data from Botswana and South Africa were not available at the time of the analysis.
Capacity Development (20 per cent)
Scale:Green: Strong enabling environment=0.75--1.0
: Fairly strong enabling environment=0.5--0.75 Red: Weak enabling environment=0.0--0.5 Gray: No data, not included in analysis
50% 50%
50%50%
50%
50% 50%
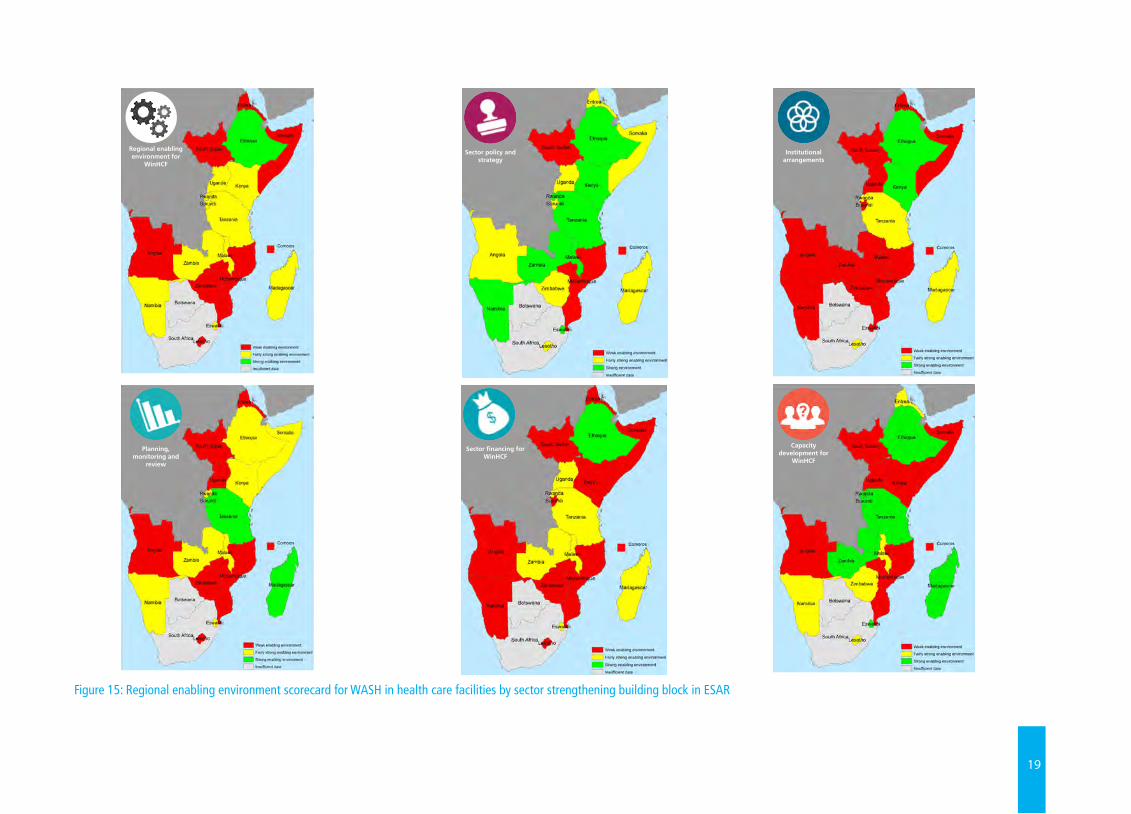
19
Figure 15: Regional enabling environment scorecard for WASH in health care facilities by sector strengthening building block in ESAR
Sector policy and strategy
Sector financing for WinHCF
Institutional arrangements
Planning, monitoring and
review
Capacity development for
WinHCF
Regional enabling environment for
WinHCF
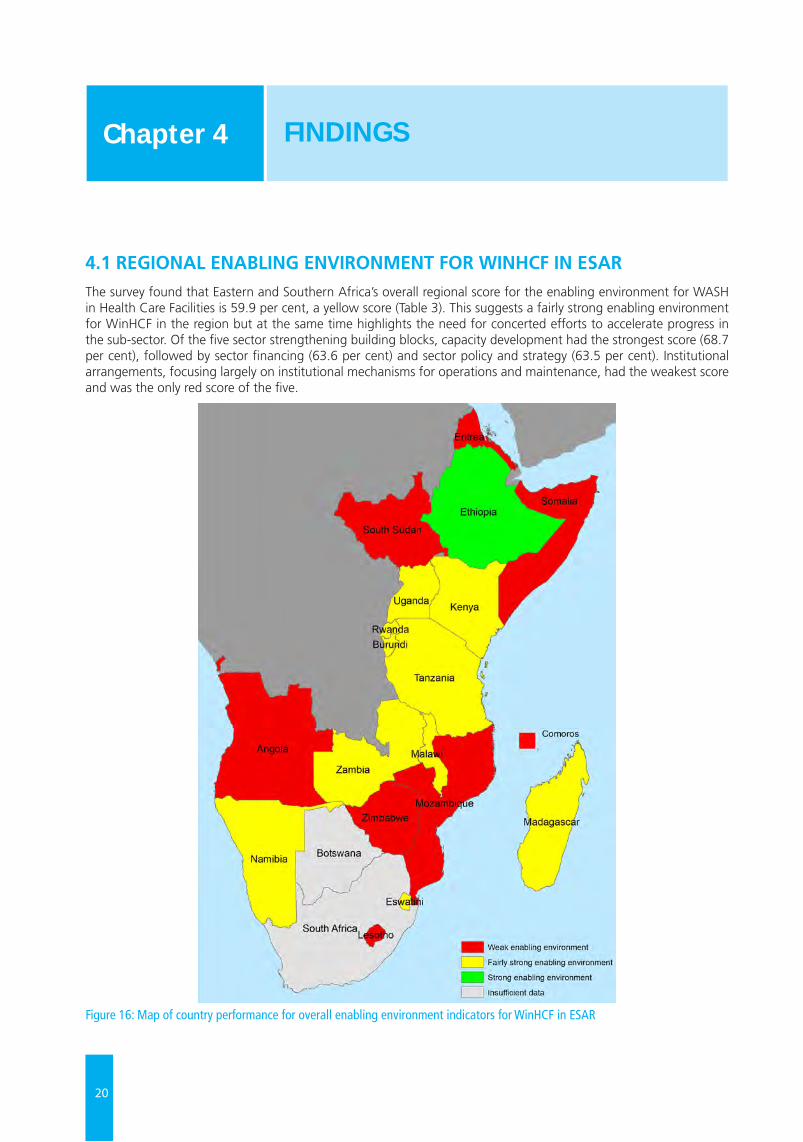
20
4.1 REGIONAL ENABLING ENVIRONMENT FOR WINHCF IN ESARThe survey found that Eastern and Southern Africa’s overall regional score for the enabling environment for WASH in Health Care Facilities is 59.9 per cent, a yellow score (Table 3). This suggests a fairly strong enabling environment for WinHCF in the region but at the same time highlights the need for concerted efforts to accelerate progress in the sub-sector. Of the five sector strengthening building blocks, capacity development had the strongest score (68.7 per cent), followed by sector financing (63.6 per cent) and sector policy and strategy (63.5 per cent). Institutional arrangements, focusing largely on institutional mechanisms for operations and maintenance, had the weakest score and was the only red score of the five.
Figure 16: Map of country performance for overall enabling environment indicators for WinHCF in ESAR
FINDINGS Chapter 4
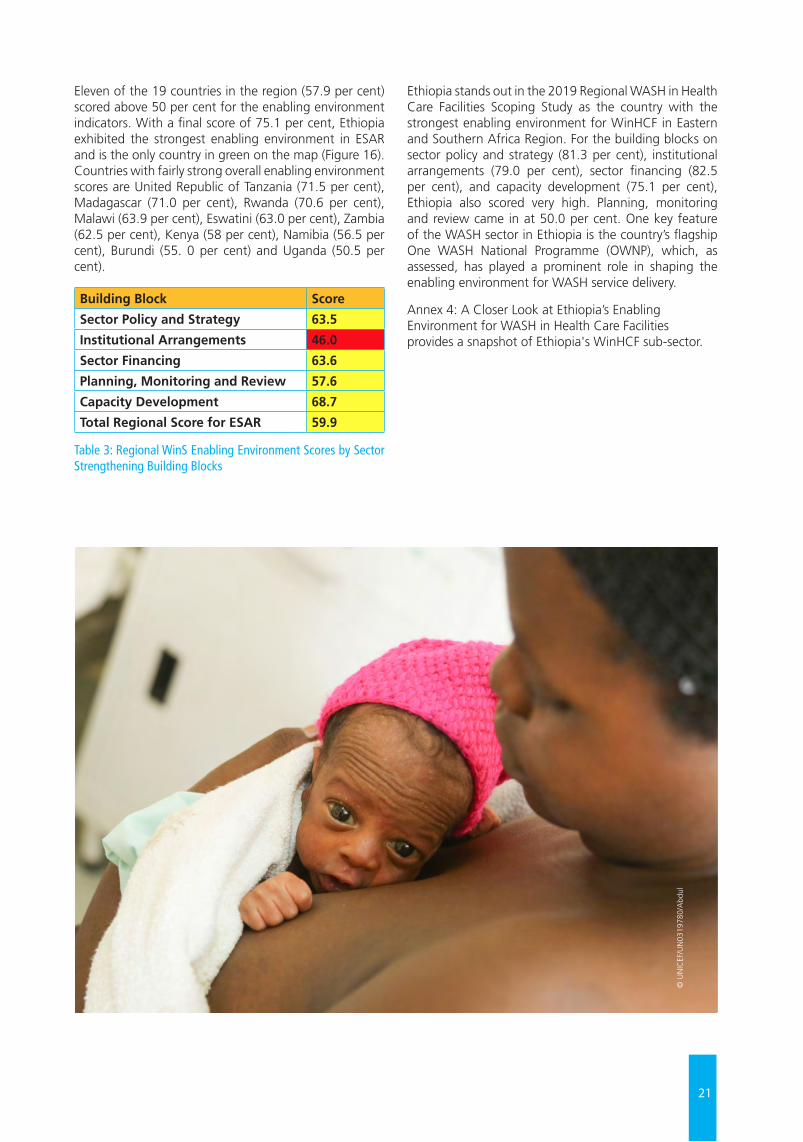
21
Eleven of the 19 countries in the region (57.9 per cent) scored above 50 per cent for the enabling environment indicators. With a final score of 75.1 per cent, Ethiopia exhibited the strongest enabling environment in ESAR and is the only country in green on the map (Figure 16). Countries with fairly strong overall enabling environment scores are United Republic of Tanzania (71.5 per cent), Madagascar (71.0 per cent), Rwanda (70.6 per cent), Malawi (63.9 per cent), Eswatini (63.0 per cent), Zambia (62.5 per cent), Kenya (58 per cent), Namibia (56.5 per cent), Burundi (55. 0 per cent) and Uganda (50.5 per cent).
Building Block Score
Sector Policy and Strategy 63.5
Institutional Arrangements 46.0
Sector Financing 63.6
Planning, Monitoring and Review 57.6
Capacity Development 68.7
Total Regional Score for ESAR 59.9
Table 3: Regional WinS Enabling Environment Scores by Sector Strengthening Building Blocks
Ethiopia stands out in the 2019 Regional WASH in Health Care Facilities Scoping Study as the country with the strongest enabling environment for WinHCF in Eastern and Southern Africa Region. For the building blocks on sector policy and strategy (81.3 per cent), institutional arrangements (79.0 per cent), sector financing (82.5 per cent), and capacity development (75.1 per cent), Ethiopia also scored very high. Planning, monitoring and review came in at 50.0 per cent. One key feature of the WASH sector in Ethiopia is the country’s flagship One WASH National Programme (OWNP), which, as assessed, has played a prominent role in shaping the enabling environment for WASH service delivery.
Annex 4: A Closer Look at Ethiopia’s Enabling Environment for WASH in Health Care Facilities provides a snapshot of Ethiopia's WinHCF sub-sector.
© U
NIC
EF/U
N03
1978
0/A
bdul
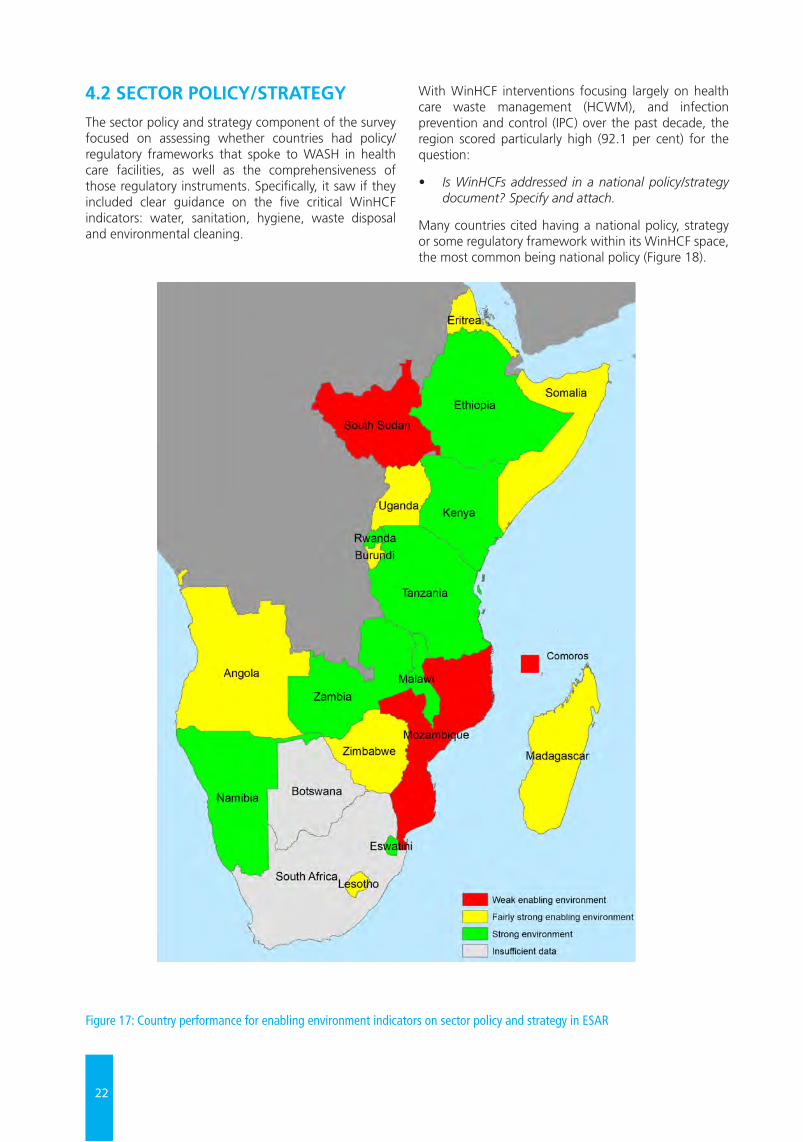
22
4.2 SECTOR POLICY/STRATEGYThe sector policy and strategy component of the survey focused on assessing whether countries had policy/regulatory frameworks that spoke to WASH in health care facilities, as well as the comprehensiveness of those regulatory instruments. Specifically, it saw if they included clear guidance on the five critical WinHCF indicators: water, sanitation, hygiene, waste disposal and environmental cleaning.
With WinHCF interventions focusing largely on health care waste management (HCWM), and infection prevention and control (IPC) over the past decade, the region scored particularly high (92.1 per cent) for the question:
• Is WinHCFs addressed in a national policy/strategy document? Specify and attach.
Many countries cited having a national policy, strategy or some regulatory framework within its WinHCF space, the most common being national policy (Figure 18).
Figure 17: Country performance for enabling environment indicators on sector policy and strategy in ESAR
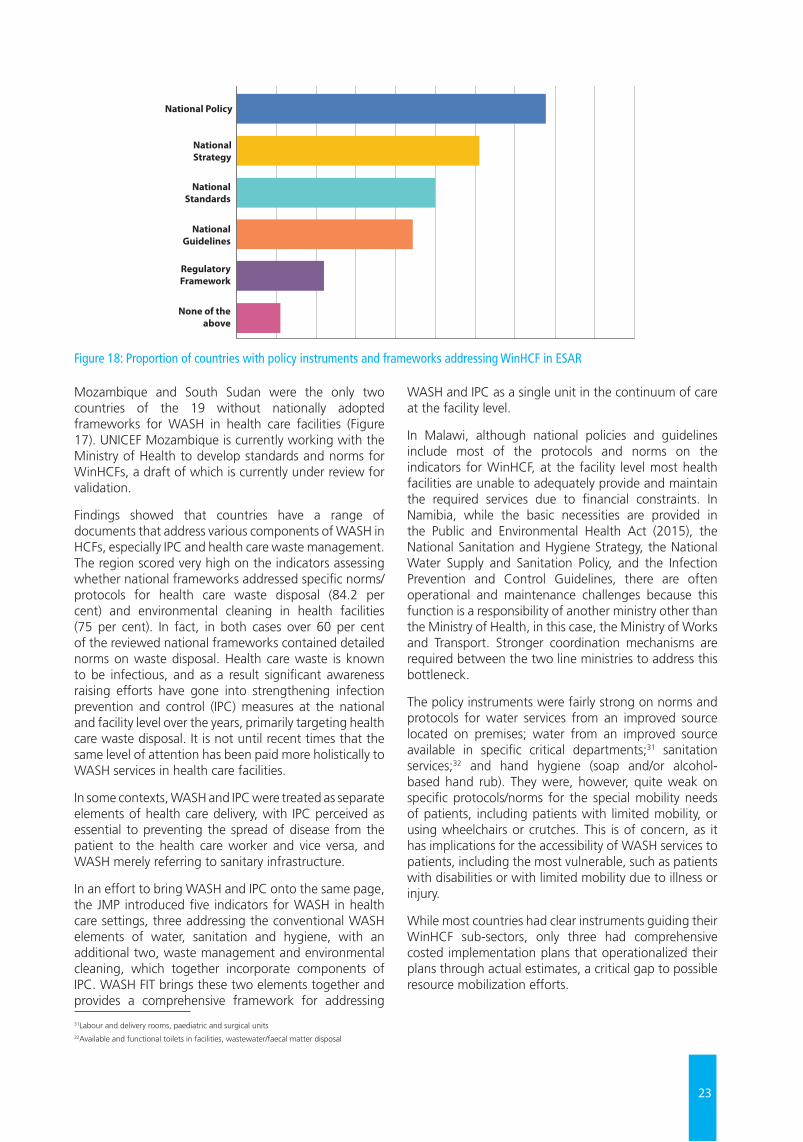
23
Mozambique and South Sudan were the only two countries of the 19 without nationally adopted frameworks for WASH in health care facilities (Figure 17). UNICEF Mozambique is currently working with the Ministry of Health to develop standards and norms for WinHCFs, a draft of which is currently under review for validation.
Findings showed that countries have a range of documents that address various components of WASH in HCFs, especially IPC and health care waste management. The region scored very high on the indicators assessing whether national frameworks addressed specific norms/protocols for health care waste disposal (84.2 per cent) and environmental cleaning in health facilities (75 per cent). In fact, in both cases over 60 per cent of the reviewed national frameworks contained detailed norms on waste disposal. Health care waste is known to be infectious, and as a result significant awareness raising efforts have gone into strengthening infection prevention and control (IPC) measures at the national and facility level over the years, primarily targeting health care waste disposal. It is not until recent times that the same level of attention has been paid more holistically to WASH services in health care facilities.
In some contexts, WASH and IPC were treated as separate elements of health care delivery, with IPC perceived as essential to preventing the spread of disease from the patient to the health care worker and vice versa, and WASH merely referring to sanitary infrastructure.
In an effort to bring WASH and IPC onto the same page, the JMP introduced five indicators for WASH in health care settings, three addressing the conventional WASH elements of water, sanitation and hygiene, with an additional two, waste management and environmental cleaning, which together incorporate components of IPC. WASH FIT brings these two elements together and provides a comprehensive framework for addressing
WASH and IPC as a single unit in the continuum of care at the facility level.
In Malawi, although national policies and guidelines include most of the protocols and norms on the indicators for WinHCF, at the facility level most health facilities are unable to adequately provide and maintain the required services due to financial constraints. In Namibia, while the basic necessities are provided in the Public and Environmental Health Act (2015), the National Sanitation and Hygiene Strategy, the National Water Supply and Sanitation Policy, and the Infection Prevention and Control Guidelines, there are often operational and maintenance challenges because this function is a responsibility of another ministry other than the Ministry of Health, in this case, the Ministry of Works and Transport. Stronger coordination mechanisms are required between the two line ministries to address this bottleneck.
The policy instruments were fairly strong on norms and protocols for water services from an improved source located on premises; water from an improved source available in specific critical departments;31 sanitation services;32 and hand hygiene (soap and/or alcohol-based hand rub). They were, however, quite weak on specific protocols/norms for the special mobility needs of patients, including patients with limited mobility, or using wheelchairs or crutches. This is of concern, as it has implications for the accessibility of WASH services to patients, including the most vulnerable, such as patients with disabilities or with limited mobility due to illness or injury.
While most countries had clear instruments guiding their WinHCF sub-sectors, only three had comprehensive costed implementation plans that operationalized their plans through actual estimates, a critical gap to possible resource mobilization efforts.
National Policy
National Strategy
NationalStandards
NationalGuidelines
RegulatoryFramework
None of theabove
0% 10% 20% 30% 40% 50% 60% 70% 80% 90% 100%
31Labour and delivery rooms, paediatric and surgical units32Available and functional toilets in facilities, wastewater/faecal matter disposal
Figure 18: Proportion of countries with policy instruments and frameworks addressing WinHCF in ESAR
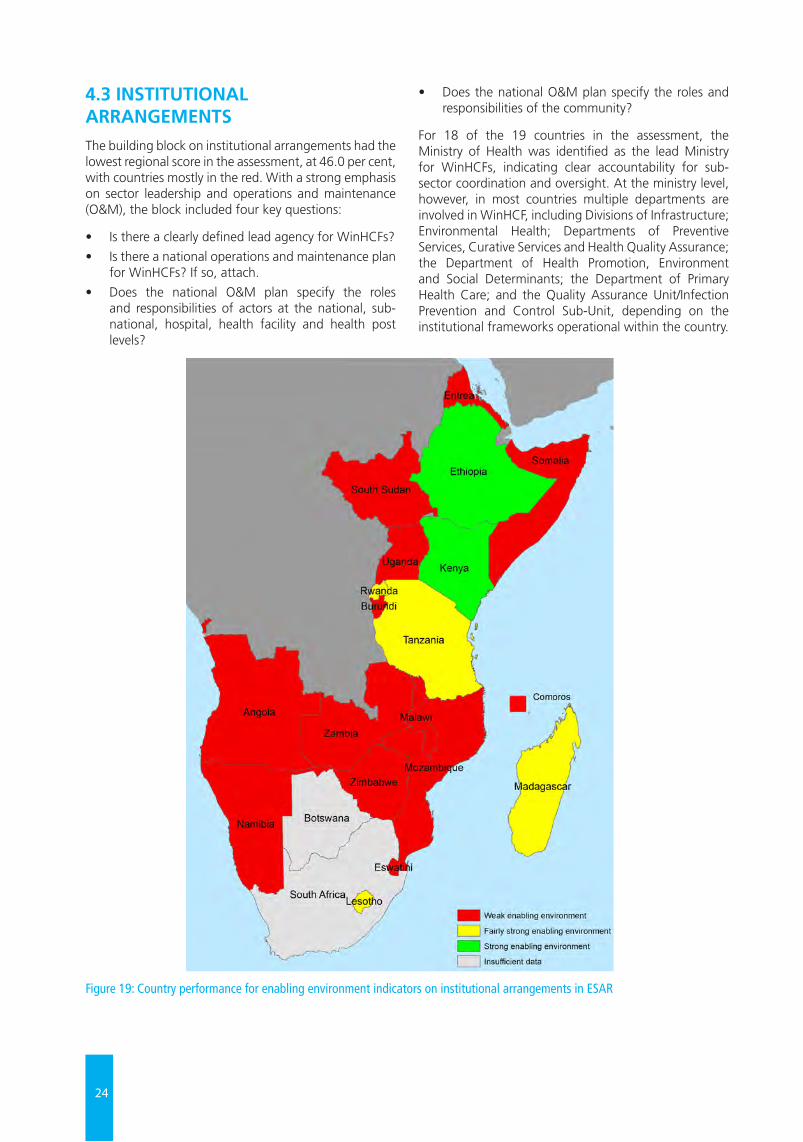
24
4.3 INSTITUTIONAL ARRANGEMENTSThe building block on institutional arrangements had the lowest regional score in the assessment, at 46.0 per cent, with countries mostly in the red. With a strong emphasis on sector leadership and operations and maintenance (O&M), the block included four key questions:
• Is there a clearly defined lead agency for WinHCFs?
• Is there a national operations and maintenance plan for WinHCFs? If so, attach.
• Does the national O&M plan specify the roles and responsibilities of actors at the national, sub-national, hospital, health facility and health post levels?
• Does the national O&M plan specify the roles and responsibilities of the community?
For 18 of the 19 countries in the assessment, the Ministry of Health was identified as the lead Ministry for WinHCFs, indicating clear accountability for sub-sector coordination and oversight. At the ministry level, however, in most countries multiple departments are involved in WinHCF, including Divisions of Infrastructure; Environmental Health; Departments of Preventive Services, Curative Services and Health Quality Assurance; the Department of Health Promotion, Environment and Social Determinants; the Department of Primary Health Care; and the Quality Assurance Unit/Infection Prevention and Control Sub-Unit, depending on the institutional frameworks operational within the country.
Figure 19: Country performance for enabling environment indicators on institutional arrangements in ESAR
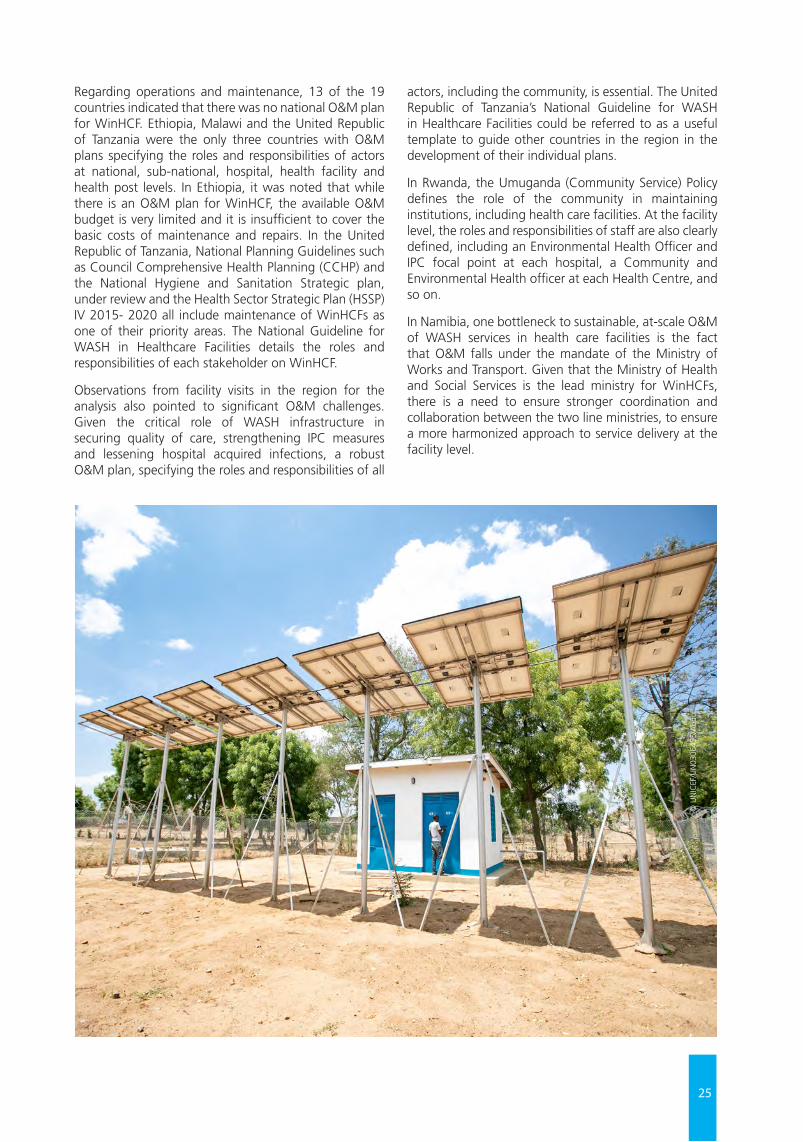
25
Regarding operations and maintenance, 13 of the 19 countries indicated that there was no national O&M plan for WinHCF. Ethiopia, Malawi and the United Republic of Tanzania were the only three countries with O&M plans specifying the roles and responsibilities of actors at national, sub-national, hospital, health facility and health post levels. In Ethiopia, it was noted that while there is an O&M plan for WinHCF, the available O&M budget is very limited and it is insufficient to cover the basic costs of maintenance and repairs. In the United Republic of Tanzania, National Planning Guidelines such as Council Comprehensive Health Planning (CCHP) and the National Hygiene and Sanitation Strategic plan, under review and the Health Sector Strategic Plan (HSSP) IV 2015- 2020 all include maintenance of WinHCFs as one of their priority areas. The National Guideline for WASH in Healthcare Facilities details the roles and responsibilities of each stakeholder on WinHCF.
Observations from facility visits in the region for the analysis also pointed to significant O&M challenges. Given the critical role of WASH infrastructure in securing quality of care, strengthening IPC measures and lessening hospital acquired infections, a robust O&M plan, specifying the roles and responsibilities of all
actors, including the community, is essential. The United Republic of Tanzania’s National Guideline for WASH in Healthcare Facilities could be referred to as a useful template to guide other countries in the region in the development of their individual plans.
In Rwanda, the Umuganda (Community Service) Policy defines the role of the community in maintaining institutions, including health care facilities. At the facility level, the roles and responsibilities of staff are also clearly defined, including an Environmental Health Officer and IPC focal point at each hospital, a Community and Environmental Health officer at each Health Centre, and so on.
In Namibia, one bottleneck to sustainable, at-scale O&M of WASH services in health care facilities is the fact that O&M falls under the mandate of the Ministry of Works and Transport. Given that the Ministry of Health and Social Services is the lead ministry for WinHCFs, there is a need to ensure stronger coordination and collaboration between the two line ministries, to ensure a more harmonized approach to service delivery at the facility level.
© U
NIC
EF/U
N03
0645
5/A
bdul
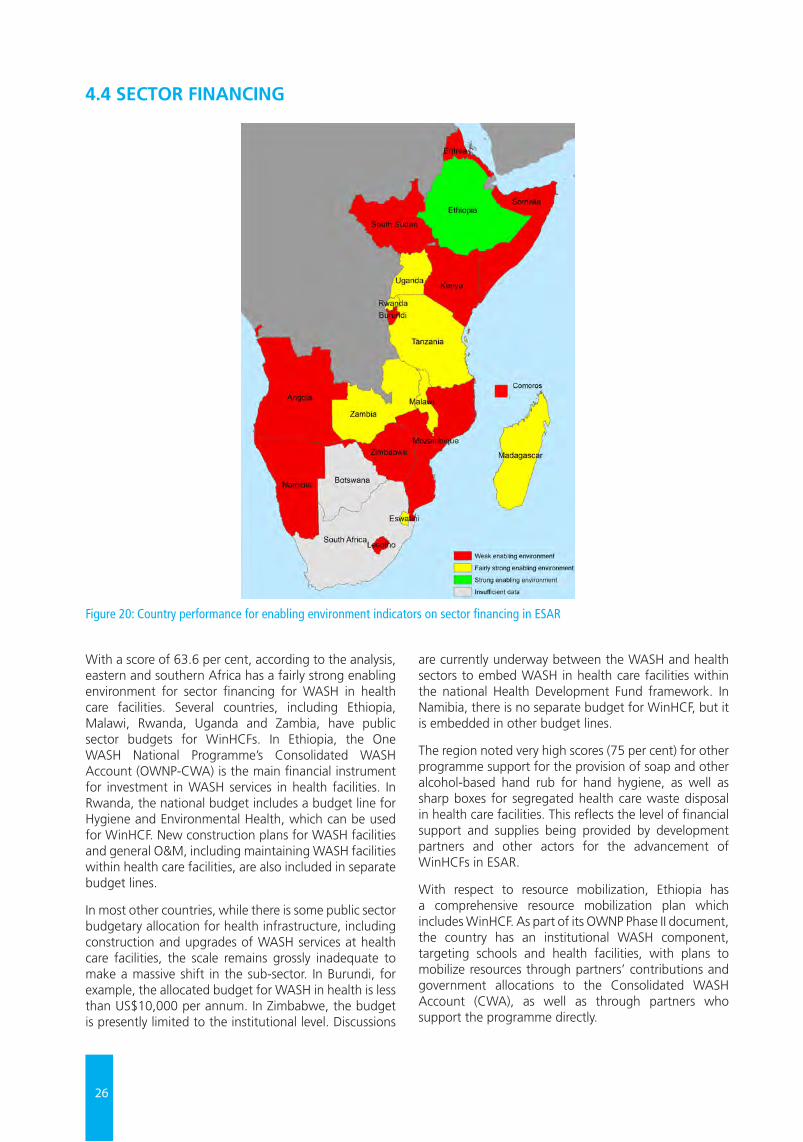
26
With a score of 63.6 per cent, according to the analysis, eastern and southern Africa has a fairly strong enabling environment for sector financing for WASH in health care facilities. Several countries, including Ethiopia, Malawi, Rwanda, Uganda and Zambia, have public sector budgets for WinHCFs. In Ethiopia, the One WASH National Programme’s Consolidated WASH Account (OWNP-CWA) is the main financial instrument for investment in WASH services in health facilities. In Rwanda, the national budget includes a budget line for Hygiene and Environmental Health, which can be used for WinHCF. New construction plans for WASH facilities and general O&M, including maintaining WASH facilities within health care facilities, are also included in separate budget lines.
In most other countries, while there is some public sector budgetary allocation for health infrastructure, including construction and upgrades of WASH services at health care facilities, the scale remains grossly inadequate to make a massive shift in the sub-sector. In Burundi, for example, the allocated budget for WASH in health is less than US$10,000 per annum. In Zimbabwe, the budget is presently limited to the institutional level. Discussions
are currently underway between the WASH and health sectors to embed WASH in health care facilities within the national Health Development Fund framework. In Namibia, there is no separate budget for WinHCF, but it is embedded in other budget lines.
The region noted very high scores (75 per cent) for other programme support for the provision of soap and other alcohol-based hand rub for hand hygiene, as well as sharp boxes for segregated health care waste disposal in health care facilities. This reflects the level of financial support and supplies being provided by development partners and other actors for the advancement of WinHCFs in ESAR.
With respect to resource mobilization, Ethiopia has a comprehensive resource mobilization plan which includes WinHCF. As part of its OWNP Phase II document, the country has an institutional WASH component, targeting schools and health facilities, with plans to mobilize resources through partners’ contributions and government allocations to the Consolidated WASH Account (CWA), as well as through partners who support the programme directly.
4.4 SECTOR FINANCING
Figure 20: Country performance for enabling environment indicators on sector financing in ESAR
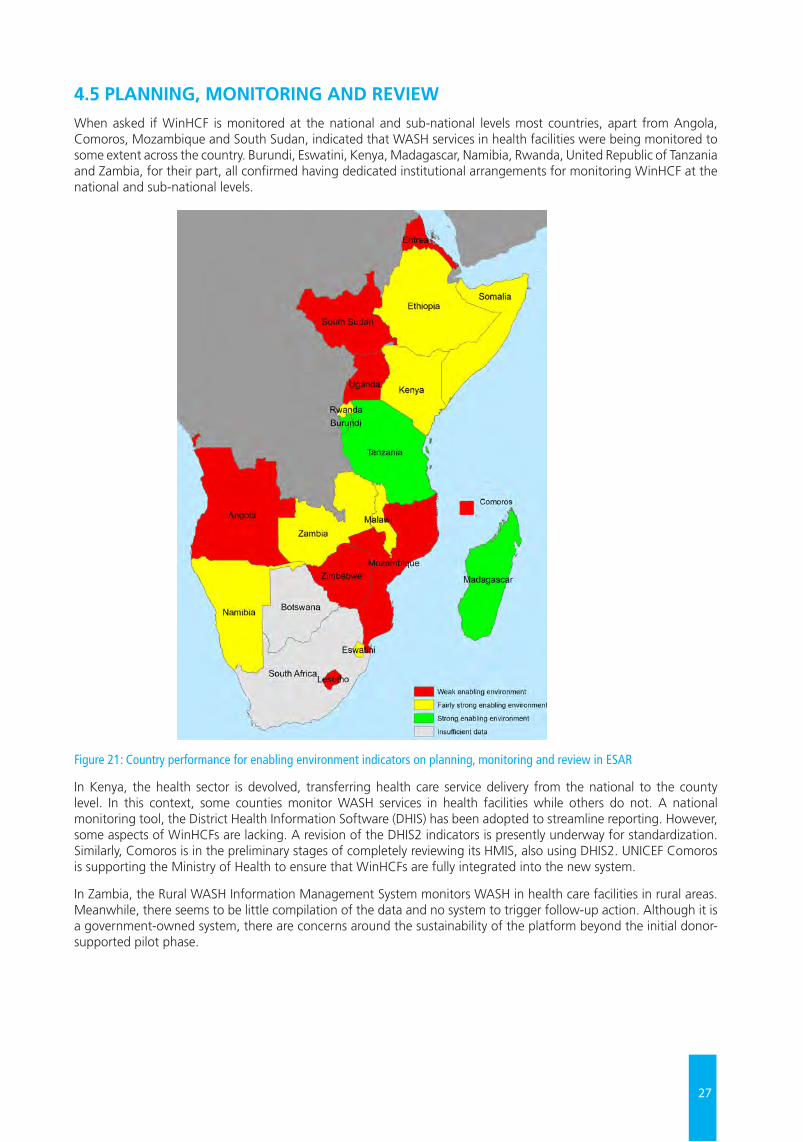
27
4.5 PLANNING, MONITORING AND REVIEWWhen asked if WinHCF is monitored at the national and sub-national levels most countries, apart from Angola, Comoros, Mozambique and South Sudan, indicated that WASH services in health facilities were being monitored to some extent across the country. Burundi, Eswatini, Kenya, Madagascar, Namibia, Rwanda, United Republic of Tanzania and Zambia, for their part, all confirmed having dedicated institutional arrangements for monitoring WinHCF at the national and sub-national levels.
Figure 21: Country performance for enabling environment indicators on planning, monitoring and review in ESAR
In Kenya, the health sector is devolved, transferring health care service delivery from the national to the county level. In this context, some counties monitor WASH services in health facilities while others do not. A national monitoring tool, the District Health Information Software (DHIS) has been adopted to streamline reporting. However, some aspects of WinHCFs are lacking. A revision of the DHIS2 indicators is presently underway for standardization. Similarly, Comoros is in the preliminary stages of completely reviewing its HMIS, also using DHIS2. UNICEF Comoros is supporting the Ministry of Health to ensure that WinHCFs are fully integrated into the new system.
In Zambia, the Rural WASH Information Management System monitors WASH in health care facilities in rural areas. Meanwhile, there seems to be little compilation of the data and no system to trigger follow-up action. Although it is a government-owned system, there are concerns around the sustainability of the platform beyond the initial donor-supported pilot phase.
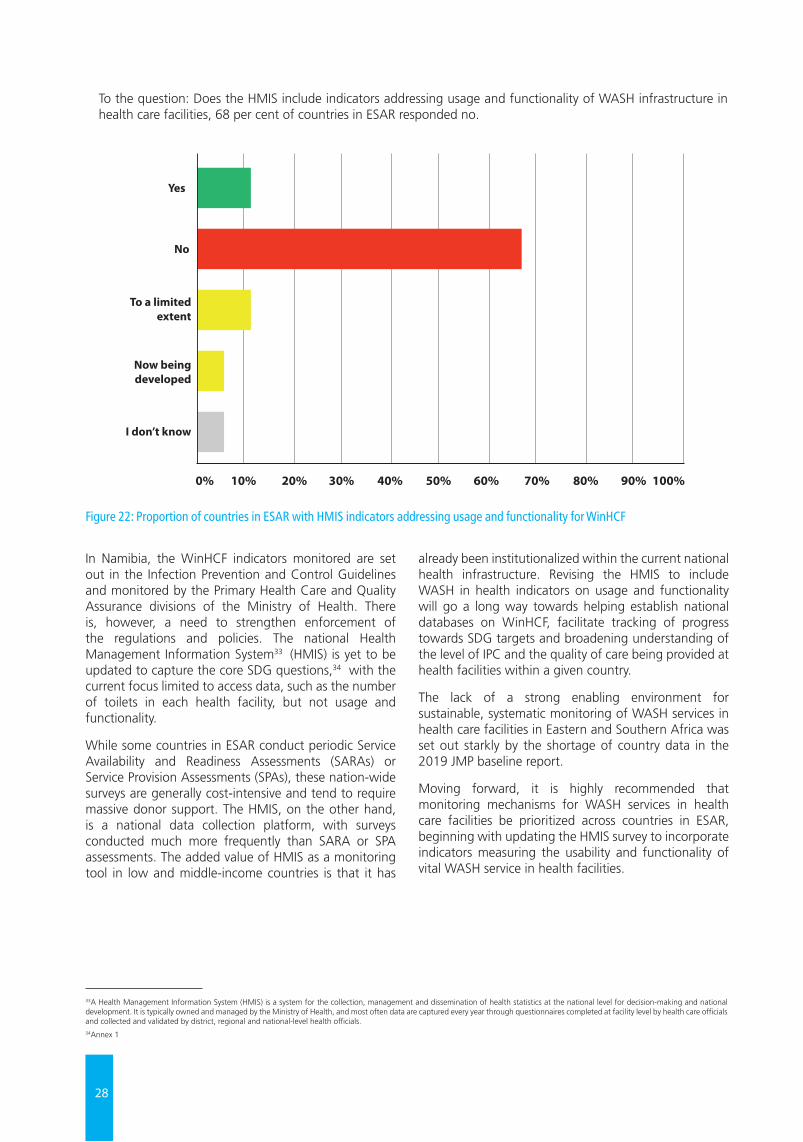
28
In Namibia, the WinHCF indicators monitored are set out in the Infection Prevention and Control Guidelines and monitored by the Primary Health Care and Quality Assurance divisions of the Ministry of Health. There is, however, a need to strengthen enforcement of the regulations and policies. The national Health Management Information System33 (HMIS) is yet to be updated to capture the core SDG questions,34 with the current focus limited to access data, such as the number of toilets in each health facility, but not usage and functionality.
While some countries in ESAR conduct periodic Service Availability and Readiness Assessments (SARAs) or Service Provision Assessments (SPAs), these nation-wide surveys are generally cost-intensive and tend to require massive donor support. The HMIS, on the other hand, is a national data collection platform, with surveys conducted much more frequently than SARA or SPA assessments. The added value of HMIS as a monitoring tool in low and middle-income countries is that it has
already been institutionalized within the current national health infrastructure. Revising the HMIS to include WASH in health indicators on usage and functionality will go a long way towards helping establish national databases on WinHCF, facilitate tracking of progress towards SDG targets and broadening understanding of the level of IPC and the quality of care being provided at health facilities within a given country.
The lack of a strong enabling environment for sustainable, systematic monitoring of WASH services in health care facilities in Eastern and Southern Africa was set out starkly by the shortage of country data in the 2019 JMP baseline report.
Moving forward, it is highly recommended that monitoring mechanisms for WASH services in health care facilities be prioritized across countries in ESAR, beginning with updating the HMIS survey to incorporate indicators measuring the usability and functionality of vital WASH service in health facilities.
33A Health Management Information System (HMIS) is a system for the collection, management and dissemination of health statistics at the national level for decision-making and national development. It is typically owned and managed by the Ministry of Health, and most often data are captured every year through questionnaires completed at facility level by health care officials and collected and validated by district, regional and national-level health officials. 34Annex 1
0% 10% 20% 30% 40% 50% 60% 70% 80% 90% 100%
Yes
No
To a limitedextent
Now beingdeveloped
I don’t know
Figure 22: Proportion of countries in ESAR with HMIS indicators addressing usage and functionality for WinHCF
To the question: Does the HMIS include indicators addressing usage and functionality of WASH infrastructure in health care facilities, 68 per cent of countries in ESAR responded no.
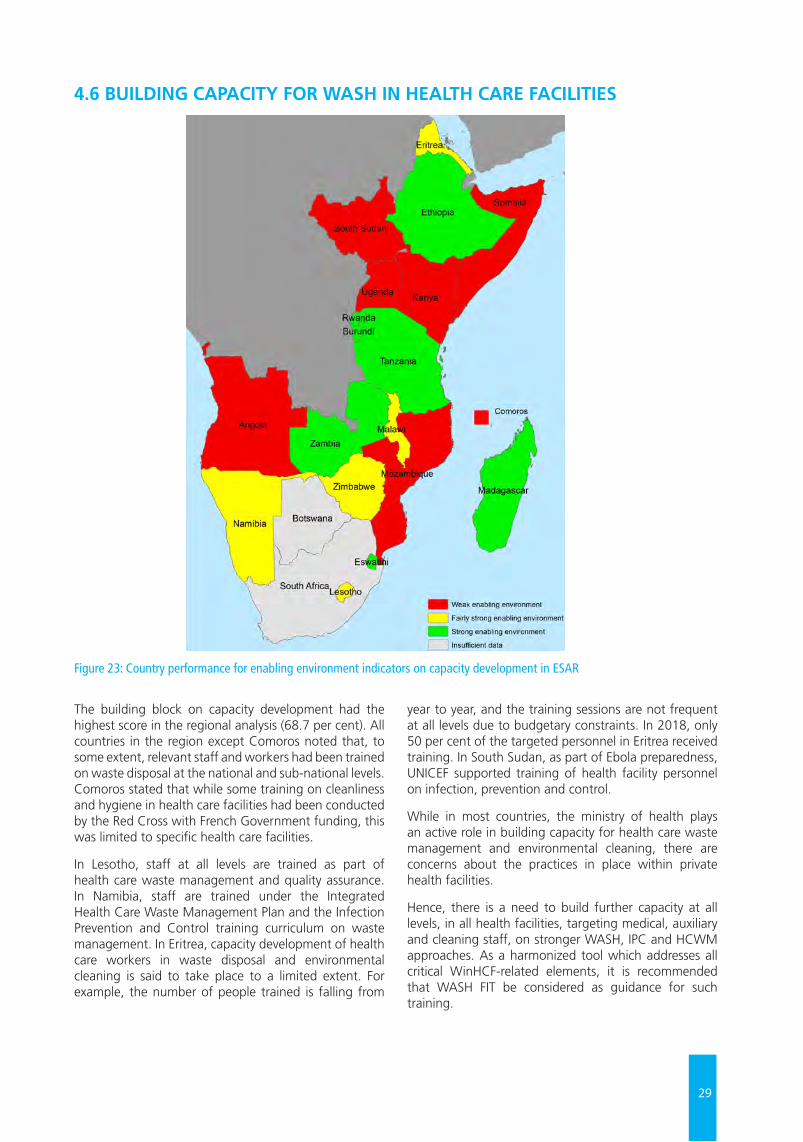
29
4.6 BUILDING CAPACITY FOR WASH IN HEALTH CARE FACILITIES
Figure 23: Country performance for enabling environment indicators on capacity development in ESAR
The building block on capacity development had the highest score in the regional analysis (68.7 per cent). All countries in the region except Comoros noted that, to some extent, relevant staff and workers had been trained on waste disposal at the national and sub-national levels. Comoros stated that while some training on cleanliness and hygiene in health care facilities had been conducted by the Red Cross with French Government funding, this was limited to specific health care facilities.
In Lesotho, staff at all levels are trained as part of health care waste management and quality assurance. In Namibia, staff are trained under the Integrated Health Care Waste Management Plan and the Infection Prevention and Control training curriculum on waste management. In Eritrea, capacity development of health care workers in waste disposal and environmental cleaning is said to take place to a limited extent. For example, the number of people trained is falling from
year to year, and the training sessions are not frequent at all levels due to budgetary constraints. In 2018, only 50 per cent of the targeted personnel in Eritrea received training. In South Sudan, as part of Ebola preparedness, UNICEF supported training of health facility personnel on infection, prevention and control.
While in most countries, the ministry of health plays an active role in building capacity for health care waste management and environmental cleaning, there are concerns about the practices in place within private health facilities.
Hence, there is a need to build further capacity at all levels, in all health facilities, targeting medical, auxiliary and cleaning staff, on stronger WASH, IPC and HCWM approaches. As a harmonized tool which addresses all critical WinHCF-related elements, it is recommended that WASH FIT be considered as guidance for such training.
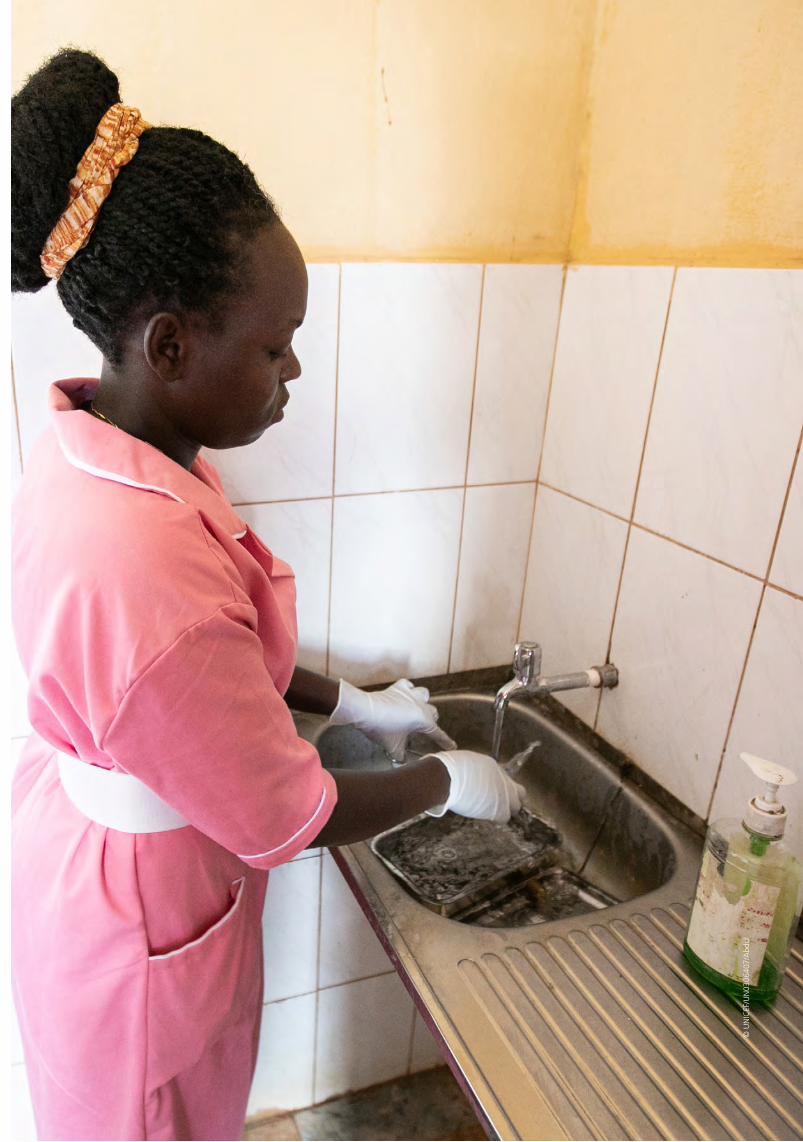
38
© U
NIC
EF/U
N03
0640
7/A
bdul
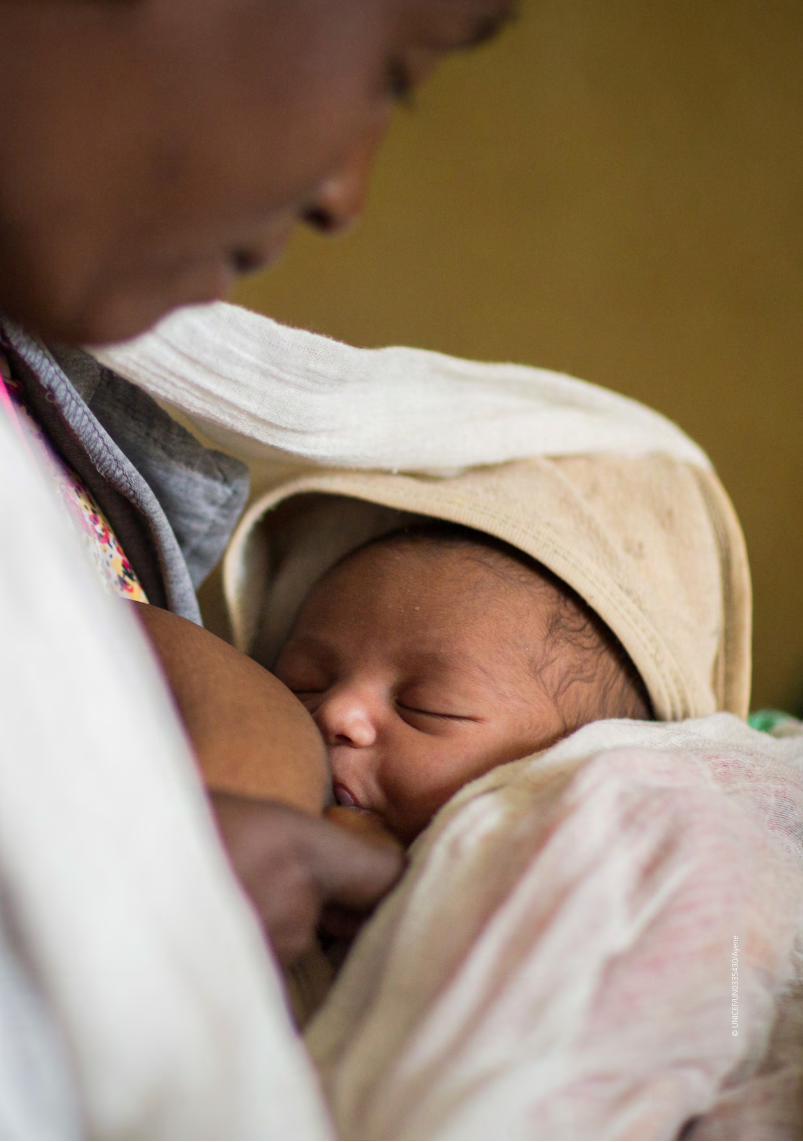
39
© U
NIC
EF/U
N03
3543
0/A
yene
32
CROSS-CUTTING & EMERGING ISSUESChapter 5
5.1 WASH AND MATERNAL, NEWBORN AND CHILD HEALTH (MNCH) In keeping with UNICEF’s commitment to support governments to institutionalize WASH in healthcare facilities, prioritizing health facilities that provide maternal, neonatal and child health services, health facility visits during country missions for the 2019 Assessment focused largely on facilities equipped with MNCH services. Delivery rooms and labour and maternity wards were visited at 17 health facilities in 3 countries.
UNICEF Uganda, for example, is supporting several health facilities to boost maternal and newborn care in districts in north-eastern Uganda where UNICEF operates. Women’s responsiveness to in-facility deliveries increased with the availability of consistent water supply. Women were previously asked to bring water along when arriving at the health centre during labour; but thanks to UNICEF support for the upgrade of the facility’s water supply system, average annual deliveries in the unit increased from 24.3 pre-intervention in December 2015 to 38.4 at the close of 2018 in one HCF assessed.
At the health care facilities visited, the delivery rooms were all quite clean and sanitary. In higher-level facilities, the newborn unit was also assessed. Hand hygiene and other IPC measures were being followed. Staff on duty were very knowledgeable of hand hygiene, the sensitivities of handling newborns and other IPC measures, including segregation of waste. In lower-level health facilities in rural settings, the available energy source on hand to facilitate maternal and newborn care in the delivery room overnight was the preinstalled solar suitcase. The solar suitcase is a portable, self-contained solar power generation and lighting system suitable for medical settings, 35 usually mounted on the wall. The suitcase comes equipped with two medical LED lamps, a mobile phone charger, an AA battery charger and outlets for other equipment, and is ideal for situations where smaller amounts of electricity are needed immediately.
In one rural health facility, placenta disposal proved quite challenging, due to prevailing cultural beliefs and norms. As such, mothers who sought in-facility delivery
insisted on taking their placenta home to be disposed of following the cultural norms. The crowdedness of the maternity ward of one of the health facilities was of specific concern, in terms of disease transmission and hospital acquired infections (HAI).
Globally, there has been a substantial increase in the proportion of women who give birth at health care facilities. In 2000, just 51 per cent of women globally gave birth in a health care facility, while in 2017, 76 per cent of women did so.36 Strengthening national linkages between WASH services, IPC measures and MNCH at the facility level is crucial for improving delivery outcomes and the quality of maternal and newborn care. With one in five births globally taking place in least developed countries (LDCs), and with 17 million women in these countries giving birth each year in health care facilities with inadequate water, sanitation and hygiene, there is an urgent need to ensure that health facilities in ESAR are equipped with delivery rooms with tailored WASH services to ensure safe and dignified childbirth.
5.2 GENDER INCLUSIVITY AND MENSTRUAL HEALTH AND HYGIENEExisting policy frameworks do not incorporate specific protocols and norms for the menstrual health and hygiene (MHH) needs of patients and staff. The regional score was 32.4 per cent for this indicator. Eswatini, Madagascar and Zambia were the only three countries in the region with a strong emphasis on MHH in their national WinHCF policy frameworks. Beyond menstrual health and hygiene, for patients and health care workers of reproductive age, MNCH care, postpartum, may involve managing other issues and complications including incontinence, fistula and associated vaginal bleeding. It is essential that the reproductive, menstrual health and hygiene needs of women and girls are factored into waste disposal plans in health facilities. Strengthening the enabling environment for gender-sensitive programming leading to at-scale WinHCFs will require stronger integration of MHH and other gender-related concerns into national policies and plans, as well as day-to-day O&M of health care facilities.
35Solar suitcase, We Care Solar, www.techxlab.org/solutions/we-care-solar-suitcase362019 JMP Global Baseline Report
33
5.3 DISABILITY INCLUSION IN WINHCF POLICY FRAMEWORKSThe region scored 52.6 per cent for the indicator:
• Does the national document include specific protocols/norms of special mobility needs of patients (including patients with limited mobility, using wheelchairs, crutches, etc).
Six countries in ESAR (Burundi, Madagascar, Rwanda, Somalia, South Sudan and Zimbabwe) responded that patient mobility was not captured in their national frameworks. With SDG 3.8 calling for universal health coverage, including financial risk protection, access to quality essential health care services and access to safe, effective, quality and affordable essential medicines and vaccines for all, given the nature of health care facilities and the broad spectrum of the population within their care, it is imperative not only that disability inclusion and patient mobility needs are factored into national policy instruments, but also that measures such as ramp installation and wheelchair access are implemented at facility level.
5.4 ANTIMICROBIAL RESISTANCE Another emerging global concern assessed during the study was whether countries in Eastern and Southern Africa had policy instruments detailing specific protocols and norms around antimicrobial resistance (AMR) and use of antibiotics. AMR – an umbrella term that includes resistance to antimalarials, antiviral drugs, fungicides and antibiotics – affects individual, community and global health. It leads to reduced effectiveness of treatment, prolonged illness, higher treatment costs, and increased risk of disease spread and patient death. While resistance to all antimicrobial drugs is a serious threat to global health, resistance to antibiotics in particular requires urgent attention.
Antibiotic resistance is aggravated by the over-prescription of antibiotics, use of sub-standard antibiotics, patients not finishing the full course of antibiotics, and overuse of antibiotics in livestock and fish farming.37 AMR is a severe threat to child survival, growth and development. In 2016, the first estimate of neonatal deaths attributable to antimicrobial resistance was published, with multidrug-resistant pathogens approximated to account for 30 per cent of all global neonatal sepsis mortality.38
Multidrug-resistant pathogens are a challenge in high-income countries but are even more so in low-income and middle-income countries because of insufficient access to antibiotics, higher burden of infectious diseases, weak health care systems, and resource limitations. AMR has the potential to undo the gains UNICEF and the global health community have achieved in recent years. Children are particularly vulnerable as their immune systems are not fully developed and are
therefore more susceptible to diseases caused by drug-resistant microbes present in their environment and the people, animals, and food to which they are exposed.
To address this growing global crisis, in 2015, WHO developed the Global Action Plan on Antimicrobial Resistance. The five strategic objectives of the plan are:
1. To improve awareness and understanding of antimicrobial resistance through effective communication, education and training;
2. To strengthen the knowledge and evidence base through surveillance and research;
3. To reduce the incidence of infection through effective sanitation, hygiene and infection prevention measures;
4. To optimize the use of antimicrobial medicines in human and animal health;
5. To develop the economic case for sustainable investment that takes account of the needs of all countries, and increase investment in new medicines, diagnostic tools, vaccines and other interventions39 .
Several countries in ESAR, including Eritrea, Eswatini, Madagascar and the United Republic of Tanzania have developed national plans addressing AMR.
5.5 CLIMATE-RESILIENCE PROGRAMMING FOR WASH IN HEALTH CARE FACILITIESIn the snapshot diagram in UNICEF’s WASH Strategy (Figure 12), climate-resilient WASH is identified as one of the new directions in which UNICEF plans to move. The UNICEF Eastern and Southern Africa WASH programme identified WASH and Climate as one of the principal drivers of migration and disease outbreaks. Increased risk of drought, floods and water-borne diseases is placing additional strain on health care facilities. WASH in health care facilities therefore needs to explore appropriate renewable energy systems for appropriate lighting and access to sanitation facilities, consistency of water pumping and provision of power for complete health centre operations. Additionally, UNICEF is promoting and advocating for wisewater management within health care facilities, to ensure the maximum conservation and use of rainwater, groundwater, greywater and piped water supplies.
In Ethiopia, for example, as part of Phase II of its One WASH National Programme (OWNP-II) structure, in addition to the four components covered under OWNP-I, a new fifth component was introduced on climate-resilient WASH. The focus was on creating climate-resilient water supply systems that provide safe and sustainable access to water to communities, schools and health facilities in drought-prone areas, despite the anticipated negative impact of climate change in the region.
37Laxminarayan R, Matsoso P, Pant S, et al. Access to effective antimicrobials: a worldwide challenge. Lancet 2016; 387: 168–75.38Ibid, pg 33.39WHO AMR Action Plan, https://apps.who.int/iris/bitstream/handle/10665/193736/9789241509763_eng.pdf?sequence=1
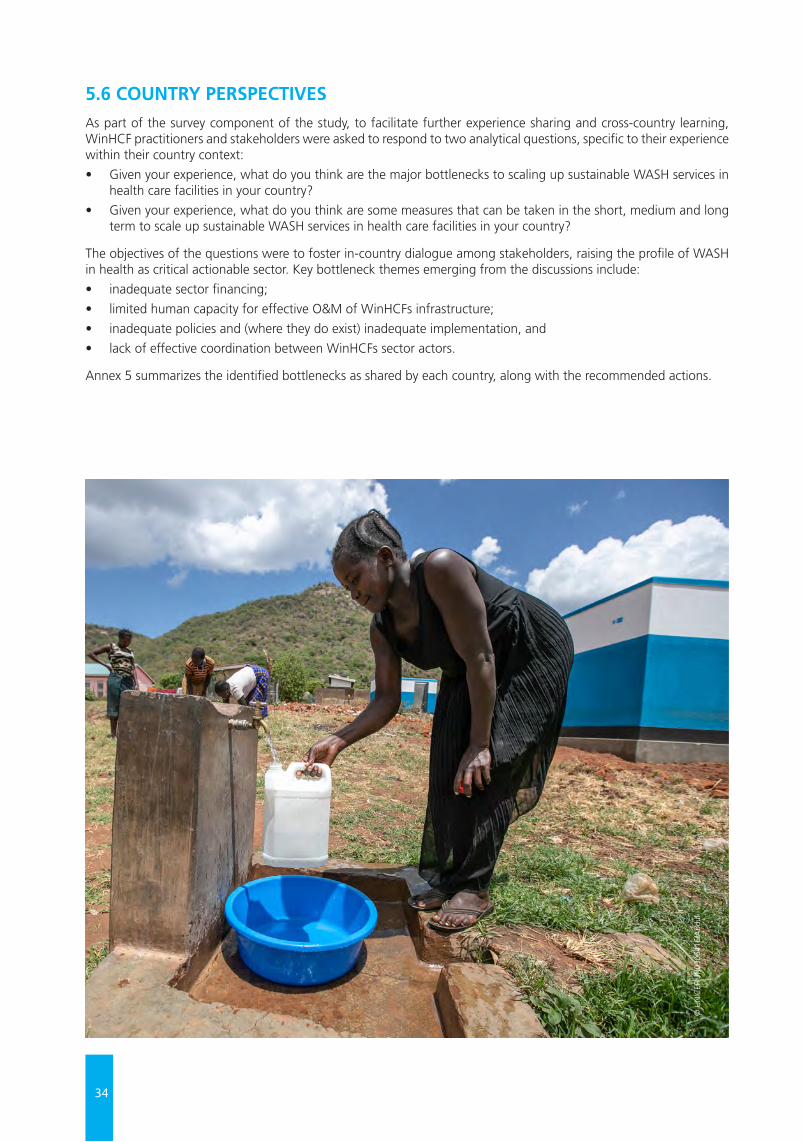
34
5.6 COUNTRY PERSPECTIVESAs part of the survey component of the study, to facilitate further experience sharing and cross-country learning, WinHCF practitioners and stakeholders were asked to respond to two analytical questions, specific to their experience within their country context:
• Given your experience, what do you think are the major bottlenecks to scaling up sustainable WASH services in health care facilities in your country?
• Given your experience, what do you think are some measures that can be taken in the short, medium and long term to scale up sustainable WASH services in health care facilities in your country?
The objectives of the questions were to foster in-country dialogue among stakeholders, raising the profile of WASH in health as critical actionable sector. Key bottleneck themes emerging from the discussions include:
• inadequate sector financing;
• limited human capacity for effective O&M of WinHCFs infrastructure;
• inadequate policies and (where they do exist) inadequate implementation, and
• lack of effective coordination between WinHCFs sector actors.
Annex 5 summarizes the identified bottlenecks as shared by each country, along with the recommended actions.
© U
NIC
EF/U
N03
0641
6/A
bdul
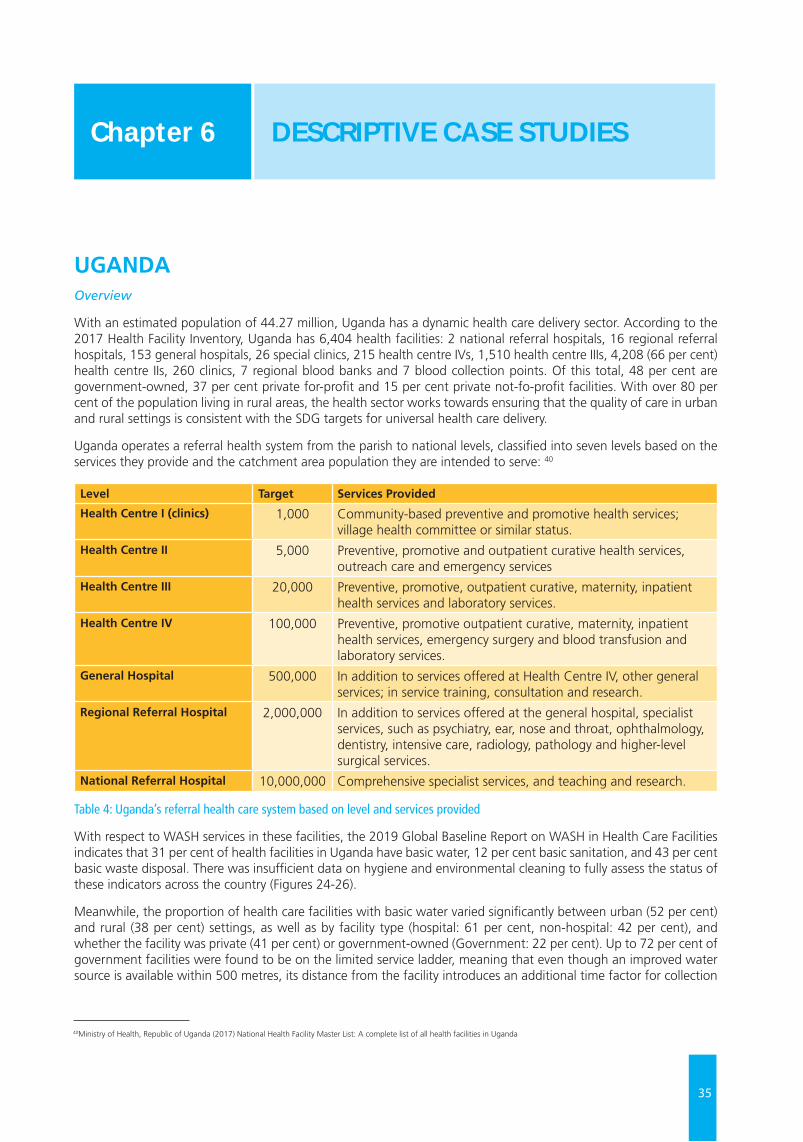
35
UGANDAOverview
With an estimated population of 44.27 million, Uganda has a dynamic health care delivery sector. According to the 2017 Health Facility Inventory, Uganda has 6,404 health facilities: 2 national referral hospitals, 16 regional referral hospitals, 153 general hospitals, 26 special clinics, 215 health centre IVs, 1,510 health centre IIIs, 4,208 (66 per cent) health centre IIs, 260 clinics, 7 regional blood banks and 7 blood collection points. Of this total, 48 per cent are government-owned, 37 per cent private for-profit and 15 per cent private not-fo-profit facilities. With over 80 per cent of the population living in rural areas, the health sector works towards ensuring that the quality of care in urban and rural settings is consistent with the SDG targets for universal health care delivery.
Uganda operates a referral health system from the parish to national levels, classified into seven levels based on the services they provide and the catchment area population they are intended to serve: 40
Level Target Services Provided
Health Centre I (clinics) 1,000 Community-based preventive and promotive health services; village health committee or similar status.
Health Centre II 5,000 Preventive, promotive and outpatient curative health services, outreach care and emergency services
Health Centre III 20,000 Preventive, promotive, outpatient curative, maternity, inpatient health services and laboratory services.
Health Centre IV 100,000 Preventive, promotive outpatient curative, maternity, inpatient health services, emergency surgery and blood transfusion and laboratory services.
General Hospital 500,000 In addition to services offered at Health Centre IV, other general services; in service training, consultation and research.
Regional Referral Hospital 2,000,000 In addition to services offered at the general hospital, specialist services, such as psychiatry, ear, nose and throat, ophthalmology, dentistry, intensive care, radiology, pathology and higher-level surgical services.
National Referral Hospital 10,000,000 Comprehensive specialist services, and teaching and research.
Table 4: Uganda’s referral health care system based on level and services provided
With respect to WASH services in these facilities, the 2019 Global Baseline Report on WASH in Health Care Facilities indicates that 31 per cent of health facilities in Uganda have basic water, 12 per cent basic sanitation, and 43 per cent basic waste disposal. There was insufficient data on hygiene and environmental cleaning to fully assess the status of these indicators across the country (Figures 24-26).
Meanwhile, the proportion of health care facilities with basic water varied significantly between urban (52 per cent) and rural (38 per cent) settings, as well as by facility type (hospital: 61 per cent, non-hospital: 42 per cent), and whether the facility was private (41 per cent) or government-owned (Government: 22 per cent). Up to 72 per cent of government facilities were found to be on the limited service ladder, meaning that even though an improved water source is available within 500 metres, its distance from the facility introduces an additional time factor for collection
DESCRIPTIVE CASE STUDIES Chapter 6
40Ministry of Health, Republic of Uganda (2017) National Health Facility Master List: A complete list of all health facilities in Uganda
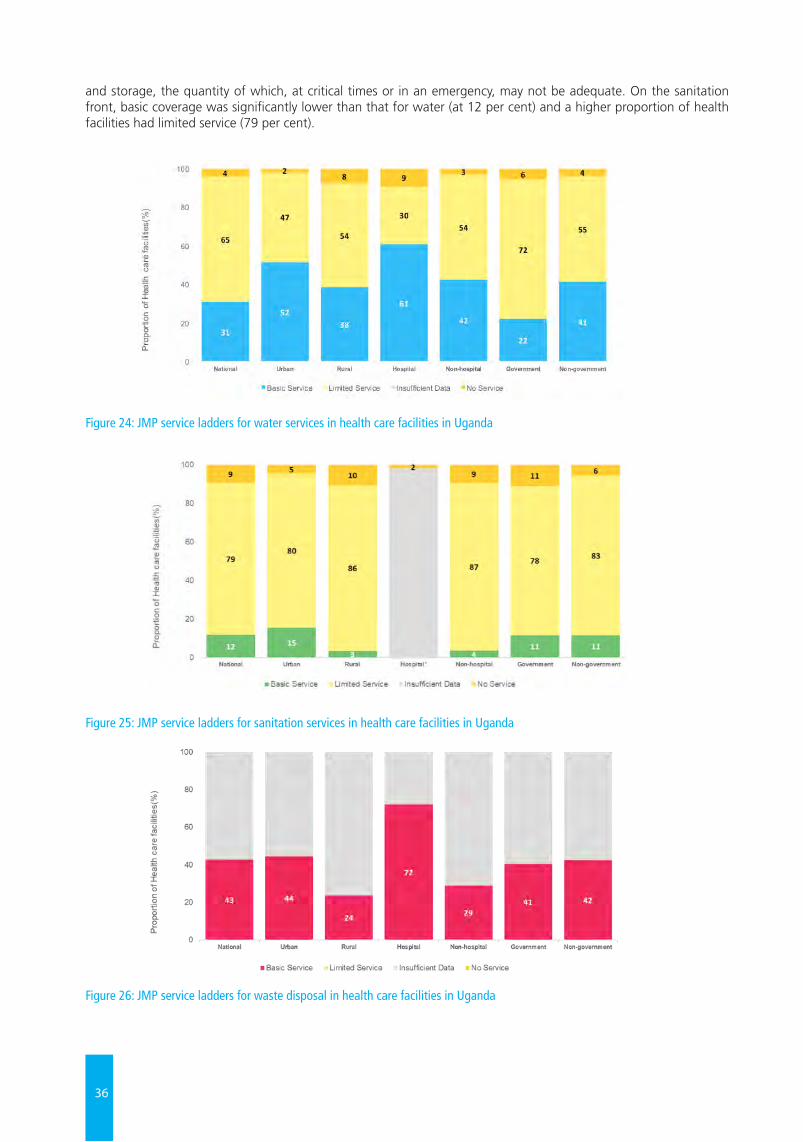
36
and storage, the quantity of which, at critical times or in an emergency, may not be adequate. On the sanitation front, basic coverage was significantly lower than that for water (at 12 per cent) and a higher proportion of health facilities had limited service (79 per cent).
Figure 24: JMP service ladders for water services in health care facilities in Uganda
Figure 25: JMP service ladders for sanitation services in health care facilities in Uganda
Figure 26: JMP service ladders for waste disposal in health care facilities in Uganda
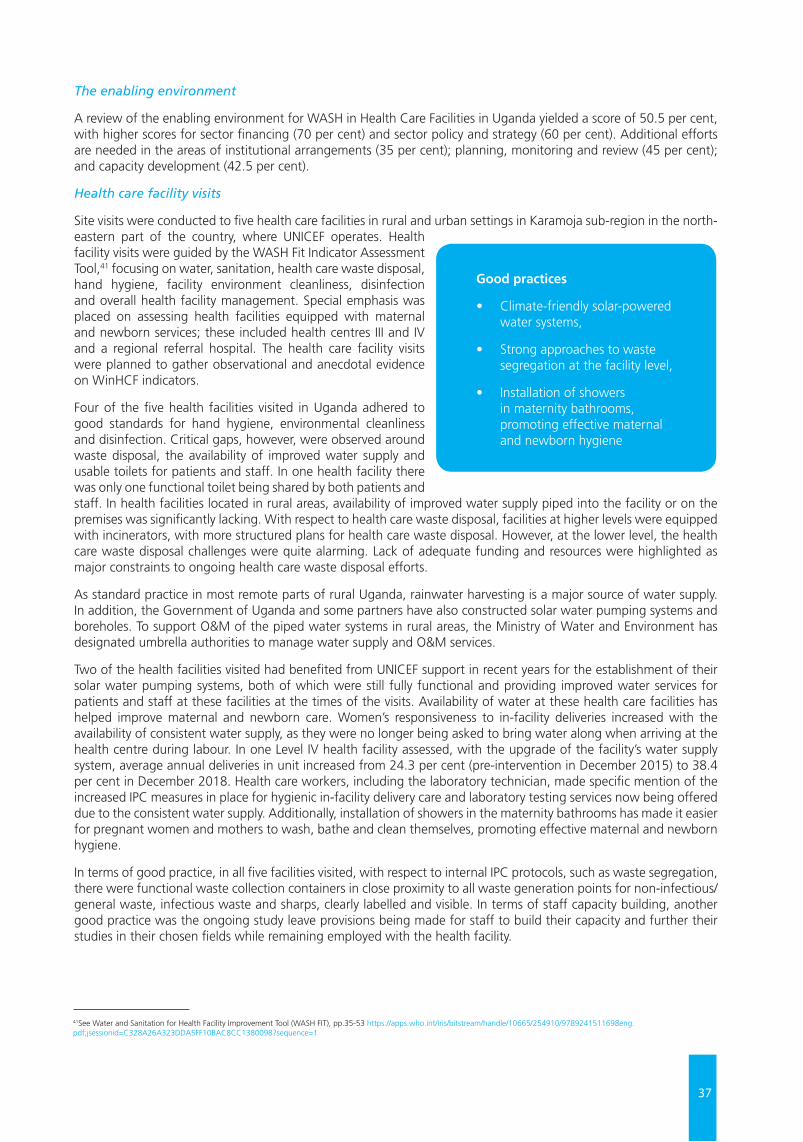
37
The enabling environment
A review of the enabling environment for WASH in Health Care Facilities in Uganda yielded a score of 50.5 per cent, with higher scores for sector financing (70 per cent) and sector policy and strategy (60 per cent). Additional efforts are needed in the areas of institutional arrangements (35 per cent); planning, monitoring and review (45 per cent); and capacity development (42.5 per cent).
Health care facility visits
Site visits were conducted to five health care facilities in rural and urban settings in Karamoja sub-region in the north-eastern part of the country, where UNICEF operates. Health facility visits were guided by the WASH Fit Indicator Assessment Tool,41 focusing on water, sanitation, health care waste disposal, hand hygiene, facility environment cleanliness, disinfection and overall health facility management. Special emphasis was placed on assessing health facilities equipped with maternal and newborn services; these included health centres III and IV and a regional referral hospital. The health care facility visits were planned to gather observational and anecdotal evidence on WinHCF indicators.
Four of the five health facilities visited in Uganda adhered to good standards for hand hygiene, environmental cleanliness and disinfection. Critical gaps, however, were observed around waste disposal, the availability of improved water supply and usable toilets for patients and staff. In one health facility there was only one functional toilet being shared by both patients and staff. In health facilities located in rural areas, availability of improved water supply piped into the facility or on the premises was significantly lacking. With respect to health care waste disposal, facilities at higher levels were equipped with incinerators, with more structured plans for health care waste disposal. However, at the lower level, the health care waste disposal challenges were quite alarming. Lack of adequate funding and resources were highlighted as major constraints to ongoing health care waste disposal efforts.
As standard practice in most remote parts of rural Uganda, rainwater harvesting is a major source of water supply. In addition, the Government of Uganda and some partners have also constructed solar water pumping systems and boreholes. To support O&M of the piped water systems in rural areas, the Ministry of Water and Environment has designated umbrella authorities to manage water supply and O&M services.
Two of the health facilities visited had benefited from UNICEF support in recent years for the establishment of their solar water pumping systems, both of which were still fully functional and providing improved water services for patients and staff at these facilities at the times of the visits. Availability of water at these health care facilities has helped improve maternal and newborn care. Women’s responsiveness to in-facility deliveries increased with the availability of consistent water supply, as they were no longer being asked to bring water along when arriving at the health centre during labour. In one Level IV health facility assessed, with the upgrade of the facility’s water supply system, average annual deliveries in unit increased from 24.3 per cent (pre-intervention in December 2015) to 38.4 per cent in December 2018. Health care workers, including the laboratory technician, made specific mention of the increased IPC measures in place for hygienic in-facility delivery care and laboratory testing services now being offered due to the consistent water supply. Additionally, installation of showers in the maternity bathrooms has made it easier for pregnant women and mothers to wash, bathe and clean themselves, promoting effective maternal and newborn hygiene.
In terms of good practice, in all five facilities visited, with respect to internal IPC protocols, such as waste segregation, there were functional waste collection containers in close proximity to all waste generation points for non-infectious/general waste, infectious waste and sharps, clearly labelled and visible. In terms of staff capacity building, another good practice was the ongoing study leave provisions being made for staff to build their capacity and further their studies in their chosen fields while remaining employed with the health facility.
Good practices
• Climate-friendly solar-powered water systems,
• Strong approaches to waste segregation at the facility level,
• Installation of showers in maternity bathrooms, promoting effective maternal and newborn hygiene
41See Water and Sanitation for Health Facility Improvement Tool (WASH FIT), pp.35-53 https://apps.who.int/iris/bitstream/handle/10665/254910/9789241511698eng.pdf;jsessionid=C328A26A323DDA5FF10BAC8CC1380098?sequence=1
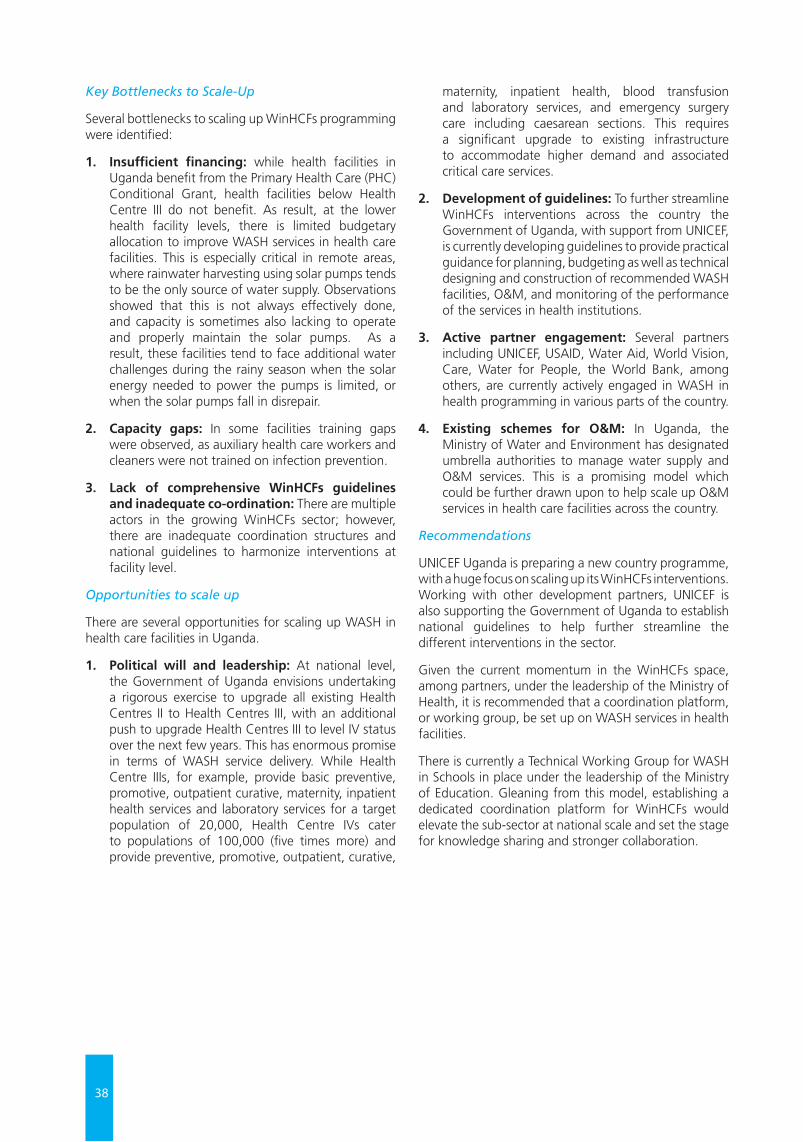
38
Key Bottlenecks to Scale-Up
Several bottlenecks to scaling up WinHCFs programming were identified:
1. Insufficient financing: while health facilities in Uganda benefit from the Primary Health Care (PHC) Conditional Grant, health facilities below Health Centre III do not benefit. As result, at the lower health facility levels, there is limited budgetary allocation to improve WASH services in health care facilities. This is especially critical in remote areas, where rainwater harvesting using solar pumps tends to be the only source of water supply. Observations showed that this is not always effectively done, and capacity is sometimes also lacking to operate and properly maintain the solar pumps. As a result, these facilities tend to face additional water challenges during the rainy season when the solar energy needed to power the pumps is limited, or when the solar pumps fall in disrepair.
2. Capacity gaps: In some facilities training gaps were observed, as auxiliary health care workers and cleaners were not trained on infection prevention.
3. Lack of comprehensive WinHCFs guidelines and inadequate co-ordination: There are multiple actors in the growing WinHCFs sector; however, there are inadequate coordination structures and national guidelines to harmonize interventions at facility level.
Opportunities to scale up
There are several opportunities for scaling up WASH in health care facilities in Uganda.
1. Political will and leadership: At national level, the Government of Uganda envisions undertaking a rigorous exercise to upgrade all existing Health Centres II to Health Centres III, with an additional push to upgrade Health Centres III to level IV status over the next few years. This has enormous promise in terms of WASH service delivery. While Health Centre IIIs, for example, provide basic preventive, promotive, outpatient curative, maternity, inpatient health services and laboratory services for a target population of 20,000, Health Centre IVs cater to populations of 100,000 (five times more) and provide preventive, promotive, outpatient, curative,
maternity, inpatient health, blood transfusion and laboratory services, and emergency surgery care including caesarean sections. This requires a significant upgrade to existing infrastructure to accommodate higher demand and associated critical care services.
2. Development of guidelines: To further streamline WinHCFs interventions across the country the Government of Uganda, with support from UNICEF, is currently developing guidelines to provide practical guidance for planning, budgeting as well as technical designing and construction of recommended WASH facilities, O&M, and monitoring of the performance of the services in health institutions.
3. Active partner engagement: Several partners including UNICEF, USAID, Water Aid, World Vision, Care, Water for People, the World Bank, among others, are currently actively engaged in WASH in health programming in various parts of the country.
4. Existing schemes for O&M: In Uganda, the Ministry of Water and Environment has designated umbrella authorities to manage water supply and O&M services. This is a promising model which could be further drawn upon to help scale up O&M services in health care facilities across the country.
Recommendations
UNICEF Uganda is preparing a new country programme, with a huge focus on scaling up its WinHCFs interventions. Working with other development partners, UNICEF is also supporting the Government of Uganda to establish national guidelines to help further streamline the different interventions in the sector.
Given the current momentum in the WinHCFs space, among partners, under the leadership of the Ministry of Health, it is recommended that a coordination platform, or working group, be set up on WASH services in health facilities.
There is currently a Technical Working Group for WASH in Schools in place under the leadership of the Ministry of Education. Gleaning from this model, establishing a dedicated coordination platform for WinHCFs would elevate the sub-sector at national scale and set the stage for knowledge sharing and stronger collaboration.
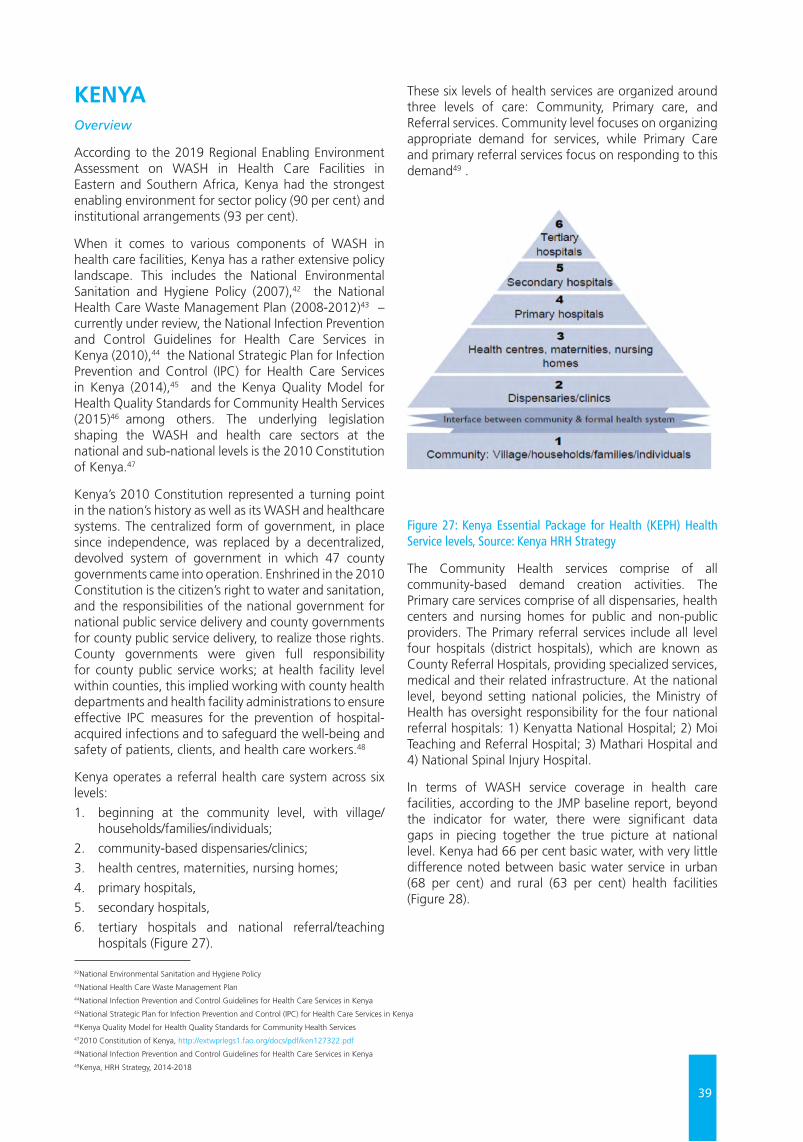
39
KENYA Overview
According to the 2019 Regional Enabling Environment Assessment on WASH in Health Care Facilities in Eastern and Southern Africa, Kenya had the strongest enabling environment for sector policy (90 per cent) and institutional arrangements (93 per cent).
When it comes to various components of WASH in health care facilities, Kenya has a rather extensive policy landscape. This includes the National Environmental Sanitation and Hygiene Policy (2007),42 the National Health Care Waste Management Plan (2008-2012)43 – currently under review, the National Infection Prevention and Control Guidelines for Health Care Services in Kenya (2010),44 the National Strategic Plan for Infection Prevention and Control (IPC) for Health Care Services in Kenya (2014),45 and the Kenya Quality Model for Health Quality Standards for Community Health Services (2015)46 among others. The underlying legislation shaping the WASH and health care sectors at the national and sub-national levels is the 2010 Constitution of Kenya.47
Kenya’s 2010 Constitution represented a turning point in the nation’s history as well as its WASH and healthcare systems. The centralized form of government, in place since independence, was replaced by a decentralized, devolved system of government in which 47 county governments came into operation. Enshrined in the 2010 Constitution is the citizen’s right to water and sanitation, and the responsibilities of the national government for national public service delivery and county governments for county public service delivery, to realize those rights. County governments were given full responsibility for county public service works; at health facility level within counties, this implied working with county health departments and health facility administrations to ensure effective IPC measures for the prevention of hospital-acquired infections and to safeguard the well-being and safety of patients, clients, and health care workers.48
Kenya operates a referral health care system across six levels:
1. beginning at the community level, with village/households/families/individuals;
2. community-based dispensaries/clinics;
3. health centres, maternities, nursing homes;
4. primary hospitals,
5. secondary hospitals,
6. tertiary hospitals and national referral/teaching hospitals (Figure 27).
These six levels of health services are organized around three levels of care: Community, Primary care, and Referral services. Community level focuses on organizing appropriate demand for services, while Primary Care and primary referral services focus on responding to this demand49 .
Figure 27: Kenya Essential Package for Health (KEPH) Health Service levels, Source: Kenya HRH Strategy
The Community Health services comprise of all community-based demand creation activities. The Primary care services comprise of all dispensaries, health centers and nursing homes for public and non-public providers. The Primary referral services include all level four hospitals (district hospitals), which are known as County Referral Hospitals, providing specialized services, medical and their related infrastructure. At the national level, beyond setting national policies, the Ministry of Health has oversight responsibility for the four national referral hospitals: 1) Kenyatta National Hospital; 2) Moi Teaching and Referral Hospital; 3) Mathari Hospital and 4) National Spinal Injury Hospital.
In terms of WASH service coverage in health care facilities, according to the JMP baseline report, beyond the indicator for water, there were significant data gaps in piecing together the true picture at national level. Kenya had 66 per cent basic water, with very little difference noted between basic water service in urban (68 per cent) and rural (63 per cent) health facilities (Figure 28).
42National Environmental Sanitation and Hygiene Policy43National Health Care Waste Management Plan44National Infection Prevention and Control Guidelines for Health Care Services in Kenya45National Strategic Plan for Infection Prevention and Control (IPC) for Health Care Services in Kenya46Kenya Quality Model for Health Quality Standards for Community Health Services472010 Constitution of Kenya, http://extwprlegs1.fao.org/docs/pdf/ken127322.pdf48National Infection Prevention and Control Guidelines for Health Care Services in Kenya49Kenya, HRH Strategy, 2014-2018
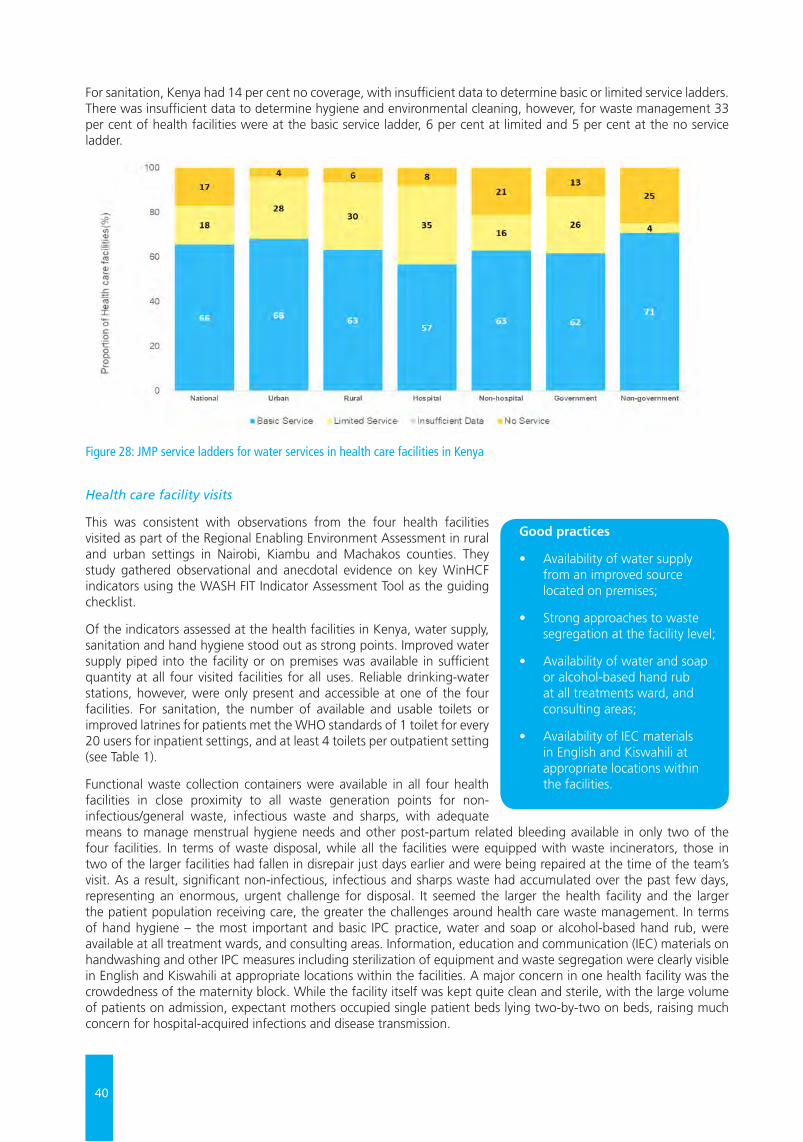
40
For sanitation, Kenya had 14 per cent no coverage, with insufficient data to determine basic or limited service ladders. There was insufficient data to determine hygiene and environmental cleaning, however, for waste management 33 per cent of health facilities were at the basic service ladder, 6 per cent at limited and 5 per cent at the no service ladder.
Health care facility visits
This was consistent with observations from the four health facilities visited as part of the Regional Enabling Environment Assessment in rural and urban settings in Nairobi, Kiambu and Machakos counties. They study gathered observational and anecdotal evidence on key WinHCF indicators using the WASH FIT Indicator Assessment Tool as the guiding checklist.
Of the indicators assessed at the health facilities in Kenya, water supply, sanitation and hand hygiene stood out as strong points. Improved water supply piped into the facility or on premises was available in sufficient quantity at all four visited facilities for all uses. Reliable drinking-water stations, however, were only present and accessible at one of the four facilities. For sanitation, the number of available and usable toilets or improved latrines for patients met the WHO standards of 1 toilet for every 20 users for inpatient settings, and at least 4 toilets per outpatient setting (see Table 1).
Functional waste collection containers were available in all four health facilities in close proximity to all waste generation points for non-infectious/general waste, infectious waste and sharps, with adequate means to manage menstrual hygiene needs and other post-partum related bleeding available in only two of the four facilities. In terms of waste disposal, while all the facilities were equipped with waste incinerators, those in two of the larger facilities had fallen in disrepair just days earlier and were being repaired at the time of the team’s visit. As a result, significant non-infectious, infectious and sharps waste had accumulated over the past few days, representing an enormous, urgent challenge for disposal. It seemed the larger the health facility and the larger the patient population receiving care, the greater the challenges around health care waste management. In terms of hand hygiene – the most important and basic IPC practice, water and soap or alcohol-based hand rub, were available at all treatment wards, and consulting areas. Information, education and communication (IEC) materials on handwashing and other IPC measures including sterilization of equipment and waste segregation were clearly visible in English and Kiswahili at appropriate locations within the facilities. A major concern in one health facility was the crowdedness of the maternity block. While the facility itself was kept quite clean and sterile, with the large volume of patients on admission, expectant mothers occupied single patient beds lying two-by-two on beds, raising much concern for hospital-acquired infections and disease transmission.
Figure 28: JMP service ladders for water services in health care facilities in Kenya
Good practices
• Availability of water supply from an improved source located on premises;
• Strong approaches to waste segregation at the facility level;
• Availability of water and soap or alcohol-based hand rub at all treatments ward, and consulting areas;
• Availability of IEC materials in English and Kiswahili at appropriate locations within the facilities.
41
Key Bottlenecks to Scale-Up
In Kenya, key bottlenecks to scaling up of WinHCFs include:
1. Inadequate co-ordination for WinHCFs: With a devolved health care system, WASH services in health facilities are managed at the county level, with various levels of prioritization for the sector. There are currently inadequate coordination structures at the national and county level to harmonize WinHCF interventions at facility level.
2. Inadequate sector financing: while there are existing funding mechanisms for financing WinHCF interventions in Kenya, there is a need to further strengthen budgetary allocation for operations and maintenance for more effective service delivery beyond the initial infrastructure construction.
3. Waste disposal challenges: the inconsistent implementation of health care waste management protocols at facility level, in part due to the attendant O&M challenges associated with waste disposal in larger health facilities;
4. Inadequate capacity development efforts: while training sessions for HCWs are conducted regularly, the content is often limited to medical waste management, mainly targeting medical staff and not support staff working in the HCFs.
Opportunities to scale-up
As part of the stakeholder consultations held during the regional study, health care actors, under the leadership of the Ministry of Health, made a renewed commitment to strengthening the enabling environment for WinHCFs in Kenya by taking several strategic steps:
1. Sector Policy/ Strategy: Establish clear standards for comprehensive WASH services in HCFs by reviewing and finalizing the initial standards developed in 2016;
2. Institutional arrangements: Establish a WinHCFs national technical working group, expanding the scope of the existing technical working group on medical waste management, coordinated by the Ministry of Health;
3. Sector financing: Explore new/innovative funding sources (e.g. green climate funds, carbon credits) with the energy (solarization of HCFs) and overall health sector major funding channels;
4. Planning, monitoring and review: Align the WASH indicators in DHIS2 with the SDG indicators;
5. Capacity development: Identify the gaps in existing guidelines, curriculums, training packages around WinHCF.
Recommendations
Although Kenya has a promising policy landscape for WASH in health care facilities programming, facility-level implementation remains a major challenge. Additional efforts with adequate funding allocation – such as the establishment of national and county-level coordination platforms, more effective operations and maintenance and robust monitoring approaches – are needed to transform existing frameworks into tangible implementation gains at facility level.
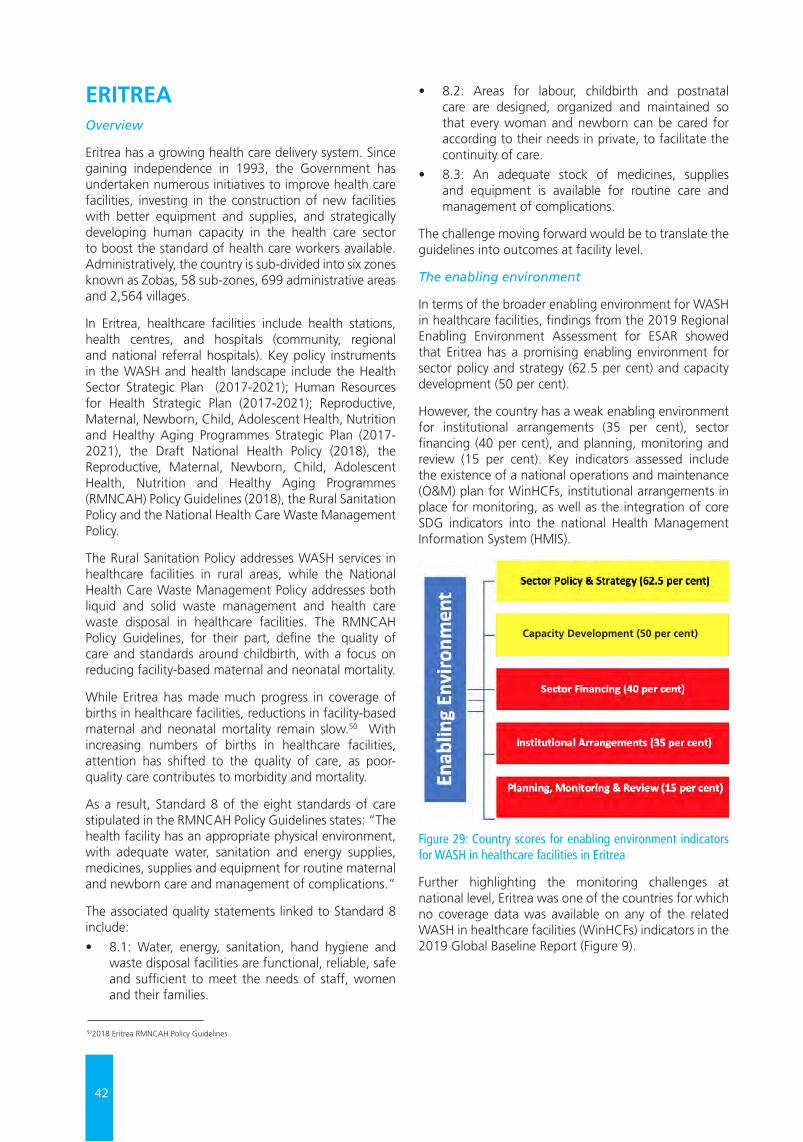
42
ERITREA Overview
Eritrea has a growing health care delivery system. Since gaining independence in 1993, the Government has undertaken numerous initiatives to improve health care facilities, investing in the construction of new facilities with better equipment and supplies, and strategically developing human capacity in the health care sector to boost the standard of health care workers available. Administratively, the country is sub-divided into six zones known as Zobas, 58 sub-zones, 699 administrative areas and 2,564 villages.
In Eritrea, healthcare facilities include health stations, health centres, and hospitals (community, regional and national referral hospitals). Key policy instruments in the WASH and health landscape include the Health Sector Strategic Plan (2017-2021); Human Resources for Health Strategic Plan (2017-2021); Reproductive, Maternal, Newborn, Child, Adolescent Health, Nutrition and Healthy Aging Programmes Strategic Plan (2017-2021), the Draft National Health Policy (2018), the Reproductive, Maternal, Newborn, Child, Adolescent Health, Nutrition and Healthy Aging Programmes (RMNCAH) Policy Guidelines (2018), the Rural Sanitation Policy and the National Health Care Waste Management Policy.
The Rural Sanitation Policy addresses WASH services in healthcare facilities in rural areas, while the National Health Care Waste Management Policy addresses both liquid and solid waste management and health care waste disposal in healthcare facilities. The RMNCAH Policy Guidelines, for their part, define the quality of care and standards around childbirth, with a focus on reducing facility-based maternal and neonatal mortality.
While Eritrea has made much progress in coverage of births in healthcare facilities, reductions in facility-based maternal and neonatal mortality remain slow.50 With increasing numbers of births in healthcare facilities, attention has shifted to the quality of care, as poor-quality care contributes to morbidity and mortality.
As a result, Standard 8 of the eight standards of care stipulated in the RMNCAH Policy Guidelines states: “The health facility has an appropriate physical environment, with adequate water, sanitation and energy supplies, medicines, supplies and equipment for routine maternal and newborn care and management of complications.”
The associated quality statements linked to Standard 8 include:
• 8.1: Water, energy, sanitation, hand hygiene and waste disposal facilities are functional, reliable, safe and sufficient to meet the needs of staff, women and their families.
• 8.2: Areas for labour, childbirth and postnatal care are designed, organized and maintained so that every woman and newborn can be cared for according to their needs in private, to facilitate the continuity of care.
• 8.3: An adequate stock of medicines, supplies and equipment is available for routine care and management of complications.
The challenge moving forward would be to translate the guidelines into outcomes at facility level.
The enabling environment
In terms of the broader enabling environment for WASH in healthcare facilities, findings from the 2019 Regional Enabling Environment Assessment for ESAR showed that Eritrea has a promising enabling environment for sector policy and strategy (62.5 per cent) and capacity development (50 per cent).
However, the country has a weak enabling environment for institutional arrangements (35 per cent), sector financing (40 per cent), and planning, monitoring and review (15 per cent). Key indicators assessed include the existence of a national operations and maintenance (O&M) plan for WinHCFs, institutional arrangements in place for monitoring, as well as the integration of core SDG indicators into the national Health Management Information System (HMIS).
Figure 29: Country scores for enabling environment indicators for WASH in healthcare facilities in Eritrea
Further highlighting the monitoring challenges at national level, Eritrea was one of the countries for which no coverage data was available on any of the related WASH in healthcare facilities (WinHCFs) indicators in the 2019 Global Baseline Report (Figure 9).
502018 Eritrea RMNCAH Policy Guidelines
Capacity Development (50 per cent)
43
Health care facility visits
As part of the Regional Assessment, site visits were conducted to eight healthcare facilities in Eritrea, the highest number of health care facilities in any of the three countries visited. While improved water supply was available piped into the facility or on premises in five of the eight healthcare facilities visited, water service availability was limited and not of sufficient quantity for all uses. Only half the facilities had reliable drinking-water stations with drinking water safely stored in a clean bucket/tank with a cover and tap.
On the sanitation front, half of the healthcare facilities had several toilets/improved latrines available and usable for patients and staff. However, very few provided any means to manage menstrual and childbirth-related hygiene. Only one of the eight healthcare facilities visited had a WASH facility that catered to the needs of persons with reduced mobility, once again raising concerns for disability- and gender-inclusive access to WASH services in health care settings.
With regard to hand hygiene, facility environment, cleanliness and disinfection, lower-level healthcare facilities serving smaller target populations were found to have stronger internal IPC measures than larger healthcare facilities. Functioning hand hygiene stations were only available at all points of care in two of the facilities assessed, with visible hand hygiene promotion materials only displayed in one of the eight facilities.
Concerning facility environment and general cleanliness, floors and horizontal work surfaces appeared clean in nearly all the facilities. The annual planned budgets of the facilities that were assessed did not address the specific requirements for the critical indicators of water, sanitation, hygiene, waste disposal and environmental cleaning. This implied numerous challenges for the O&M of infrastructure, as well as sustainable IPC and health care waste disposal measures.
Key Bottlenecks to scale-up
The bottlenecks identified were:
1. Limited sector financing for WinHCF: at the facility level, it was observed that there were no planned budget/funds allocated to improve the health facility service, especially the WASH component. This hampers the attainment of proposed targets to provide services to the unserved as well as to maintain existing services.
2. Insufficient data on WinHCF: Eritrea was one of the countries for which there was inadequate data in the Global Baseline Report for all five WinHCF indicators, water, sanitation, hygiene, waste disposal and environmental cleaning, with implications for programming.
3. Inadequate sanitation services: Sanitation challenges including unclean latrines and long queues create discomfort for both patients and health workers. The latrines available were inadequate to meet the demands of both patients and health care workers.
Opportunities and recommendations
With an emerging WASH in Health global landscape and a growing national focus on saving the maximum number of maternal and newborn lives and preventing stillbirths, this presents a strategic opportunity to elevate WASH services in health care facilities and draw further attention on the need for WASH in the continuum of care.
With additional awareness and advocacy, comes stronger political will, which will, in turn, revive weaker components of the enabling environment such as sector financing and capacity development. Dedicated sector budgets at the facility level are needed to enhance operations and maintenance of existing infrastructure.
Another critical step would be to introduce the WHO/UNICEF WASH Facility Improvement Tool (WASH FIT) or other appropriate quality improvement tool to further strengthen facility-level management, as well as operation and maintenance of WASH services.
Good practices
• Good internal infection prevention and control (IPC) measures in lower level healthcare facilities;
• General environmental cleanliness observed in all health facilities.
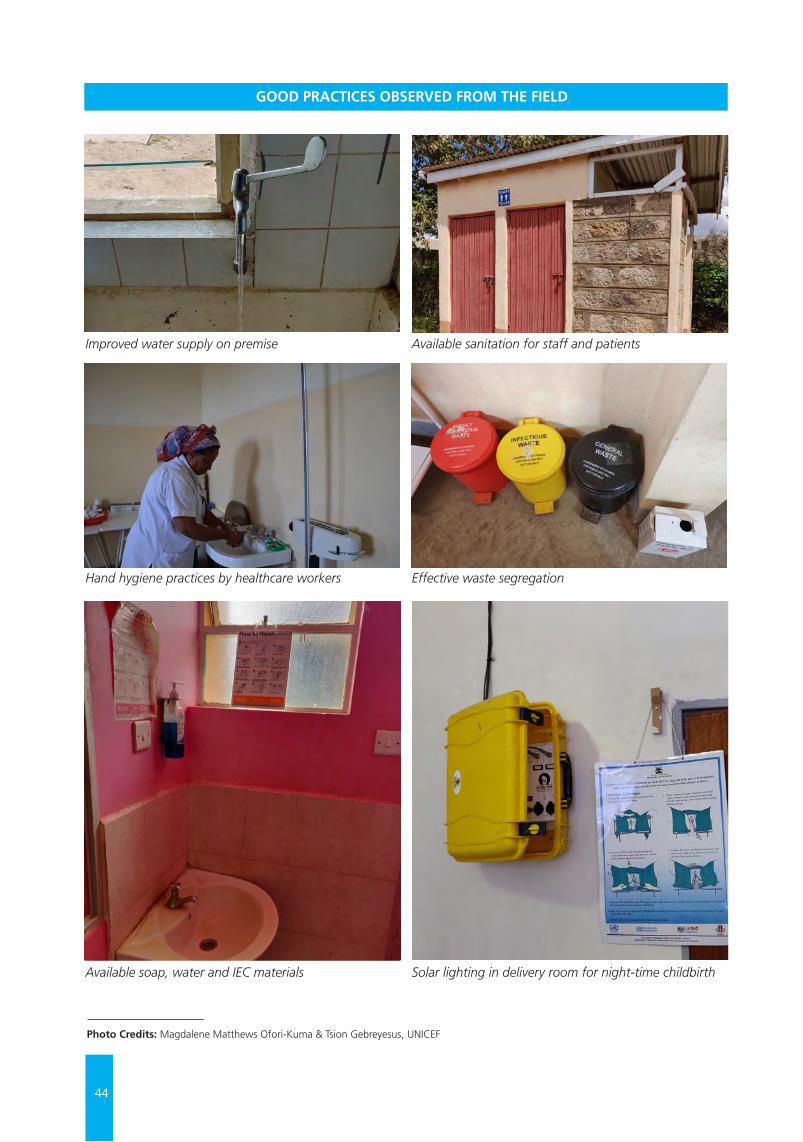
44
© U
NIC
EF/U
N03
0639
9/A
bdul
GOOD PRACTICES OBSERVED FROM THE FIELD
Improved water supply on premise
Hand hygiene practices by healthcare workers
Available soap, water and IEC materials
Available sanitation for staff and patients
Effective waste segregation
Solar lighting in delivery room for night-time childbirth
Photo Credits: Magdalene Matthews Ofori-Kuma & Tsion Gebreyesus, UNICEF
45
GOOD PRACTICES OBSERVED FROM THE FIELD
RECOMMENDATIONSChapter 7
Given the level of progress achieved so far in the sector, each country faced different challenges requiring contextualized action to scale up in-country programming for WinHCFs. In April 2019, with the release of the Global Baseline Report on WASH in Health Care Facilities, the WHO/UNICEF Joint Monitoring Programme on Water and Sanitation also published a companion guidance document entitled: ‘Practical Steps to Achieve Universal Access to Quality Care’.
The objectives of the Practical Steps are:
(a) To present eight practical steps that Member States can take at the national and sub-national level to improve WASH in health care facilities, and
(b) To summarize the global response to the United Nations Secretary-General’s Call to Action.
The Practical Steps represent a ‘back-to-basics’ approach to addressing WASH services in health care facilities as follows:
1. Situation analysis and assessment
2. Set targets and define roadmap
3. Establish national standards and accountability mechanisms
4. Improve infrastructure and maintenance
5. Monitor and review data
6. Develop health workforce
7. Engage communities
8. Conduct operational research and share learning (Figure 30)
Findings from the 2019 Enabling Environment Assessment for WASH in Health Care Facilities in Eastern and Southern Africa point to a regional enabling environment that needs much strengthening. Observational evidence from site visits to 17 health facilities in 3 countries further highlighted the need for facility-level interventions in parallel with enabling environment efforts. In view of these findings and the feedback gathered from countries (Annex 5), it is recommended that the WHO/UNICEF Practical Steps reference document be adopted as the guiding framework for scaling up WinHCFs programming in ESAR.
Based on their current context, countries are encouraged to assess where they are in relation to the steps, and to identify areas for short, medium and long-term action. For countries lacking coherent standards and coverage data for WinHCFs – which includes all countries in ESAR except Zimbabwe – Step 1 Conduct situation analysis and assessment, may be the starting point.
For countries seeking to accelerate WinHCFs and improve the quality of care at facility level for better health outcomes, Step 2 Set targets and define roadmap is essential. Without clear national targets and a strategic plan of action, interventions will continue to be ad hoc and poorly coordinated, resulting in dismal outcomes at national level.
As community residents are the primary users of WASH infrastructure in health care facilities, findings showed the need for Step 7 Engage communities as a strategic move towards securing Step 4 Improve infrastructure and maintenance. Step 5 Monitor and Review Data is critical for all countries in ESAR, beginning with the review of the health monitoring information system to incorporate critical WASH indicators on usability and functionality.
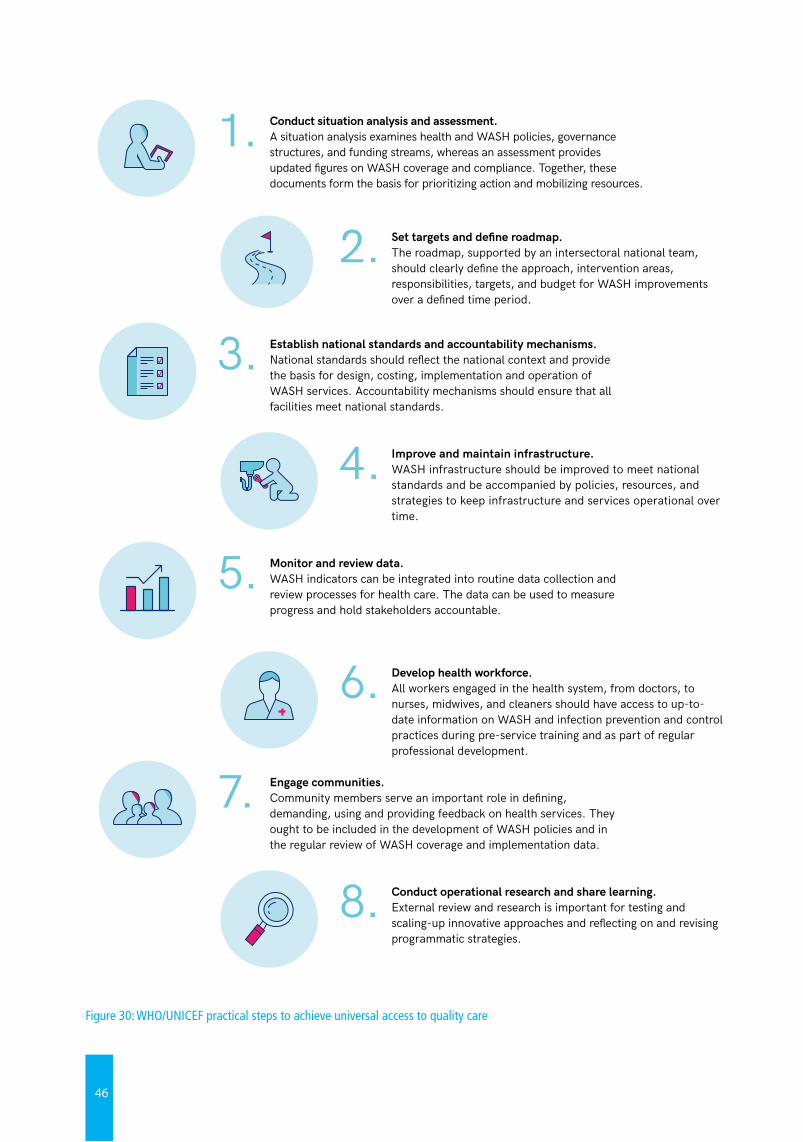
46
ix
PRACTIC
AL STEPS TO
ACH
IEVE U
NIV
ERSAL AC
CESS TO
QU
ALIT
Y C
ARE
BOX 1:
Eight practical steps to improve WASH in health care facilities
EXECU
TIV
E SUM
MA
RY
1. Conduct situation analysis and assessment. A situation analysis examines health and WASH policies, governance structures, and funding streams, whereas an assessment provides updated figures on WASH coverage and compliance. Together, these documents form the basis for prioritizing action and mobilizing resources.
3. Establish national standards and accountability mechanisms. National standards should reflect the national context and provide the basis for design, costing, implementation and operation of WASH services. Accountability mechanisms should ensure that all facilities meet national standards.
5. Monitor and review data. WASH indicators can be integrated into routine data collection and review processes for health care. The data can be used to measure progress and hold stakeholders accountable.
7. Engage communities. Community members serve an important role in defining, demanding, using and providing feedback on health services. They ought to be included in the development of WASH policies and in the regular review of WASH coverage and implementation data.
2. Set targets and define roadmap. The roadmap, supported by an intersectoral national team, should clearly define the approach, intervention areas, responsibilities, targets, and budget for WASH improvements over a defined time period.
4. Improve and maintain infrastructure. WASH infrastructure should be improved to meet national standards and be accompanied by policies, resources, and strategies to keep infrastructure and services operational over time.
6. Develop health workforce. All workers engaged in the health system, from doctors, to nurses, midwives, and cleaners should have access to up-to-date information on WASH and infection prevention and control practices during pre-service training and as part of regular professional development.
8. Conduct operational research and share learning. External review and research is important for testing and scaling-up innovative approaches and reflecting on and revising programmatic strategies.
Figure 30: WHO/UNICEF practical steps to achieve universal access to quality care
47
At the World Health Assembly in May 2019, Member States, including countries in ESAR, unanimously adopted a global resolution to advance WinHCF programming through:
a) the development of national roadmaps;
b) the setting and monitoring of national targets;
c) increased investments in infrastructure and human resources; and
d) targeted systems strengthening to improve and sustain WASH services in health care facilities.
In view of the commitments of the global resolution and findings from the regional scoping study, the following recommendations are proposed:
1. Countries are encouraged to assess where they are in relation to the WHO/UNICEF practical steps (Figure 30), situate the country context and identify critical areas for strategic short, medium and long-term action;
2. Explore avenues to strategically utilize UNICEF’s convening power to strengthen coordination platforms and advocacy for WinHCF at sub-national, national and regional levels;
3. Support SDG monitoring by strengthening national and sub-national monitoring mechanisms, beginning with revising the existing Health Management Information System (HMIS) indicators to include WinHCF indicators on usage and functionality;
4. Reinforce national linkages between WASH services, IPC measures and MNCH at facility level to help improve delivery outcomes and the quality of maternal and newborn care.
5. Strengthen the enabling environment for gender-sensitive WinHCF programming through stronger integration of Menstrual Health and Hygiene (MHH) and other gender-related concerns into national policies and plans, and daily operations and maintenance (O&M) of health care facilities.
6. Explore options for innovative financing and climate resilient WinHCF programming, specifically considering the recurring climatic shocks and public health emergencies within the region.
In conclusion, WASH in health care facilities is a dynamic sector currently gaining much high-level attention and momentum. Addressing the bottlenecks and opportunities to at-scale programming in eastern and southern Africa will require context-specific approaches, appropriate to each country based on the strength of the prevailing enabling environment, existing capacity and available implementation strategies at national and sub-national levels.
48
Bartram, J., K. Lewis, R. Lenton, and A. Wright, ‘Focusing on improved water and sanitation for health’, The Lancet, vol. 365, no. 9461, pp. 810–812, 2005.
Prüss-Üstün, A., R. Bos, F. Gore, and J. Bartram, Safer Water, Better Health: Costs, Benefits and Sustainability of Interventions to Protect and Promote Health, WHO, Geneva, Switzerland, 2008.
World Health Organization and United Nations Children’s Fund Water, sanitation and hygiene (WASH) in health care facilities: Joint action for universal access and improved quality of care, https://www.wsscc.org/wpcontent/uploads/2015/11/WASH_Health_SectorCollaboration_Oct20151.pdf
World Health Organization and United Nations Children’s Fund Joint Monitoring Programme, WASH in health care facilities: Global baseline report https://washdata.org/report/jmp-2019-wash-hcf
United Nations Secretary-General, ‘Remarks at Launch of International Decade for Action “Water for Sustainable Development” 2018-2028’, 22 March 2018, https://www.un.org/sg/en/content/sg/statement/2018-03-22/secretary-generals-remarks-launch-international-decade-action-water
United Nations Children’s Fund, ‘Global WASH Strategy (2016-2030)’
United Nations Children’s Fund, ‘2018-2022 Regional Priorities for Eastern and Southern Africa’
World Health Organization, WASH in Health Care Facilities, https://www.who.int/water_sanitation_health/facilities/healthcare/en/
World Health Organization and United Nations Children’s Fund, ‘Global WinHCF Action Plan Factsheet’, https://www.wsscc.org/wpcontent/uploads/2015/11/WASHinHCFGlobalActionPlanOct20151.pdf
World Health Organization (2008), Essential Environmental Health Standards in Health Care Facilities, https://www.who.int/water_sanitation_health/publications/ehs_hc/en/
World Health Organization and United Nations Children’s Fund (2018), Water, sanitation and hygiene: Facility improvement tool, https://www.who.int/water_sanitation_health/publications/water-and-sanitation-for-health-facility-improvement-tool/en/
World Health Organization and United Nations Children’s Fund (2019), WASH in health care facilities: Practical steps to achieve universal access to quality care, https://www.who.int/water_sanitation_health/publications/wash-in-health-care-facilities/en/
World Health Organization, Every Newborn Action Plan: https://www.who.int/docs/default-source/mca-documents/advisory-groups/quality-of-care/every-new-born-action-plan-(enap).pdf?sfvrsn=4d7b389_2
World Health Organization, Nurturing Care Framework (2018), https://apps.who.int/iris/bitstream/handle/10665/272603/9789241514064-eng.pdf
United Nations Children’s Fund, ‘Strategy for Health (2016-2030)’, https://www.unicef.org/health/files/161201_Strategy_for_health_2016-30_report.pdf
United Nations Children’s Fund (2017), Levels and Trends in Child Mortality Report, 2017
United Nations Children’s Fund (2016), The UNICEF Health Systems Strengthening Approach (2016), https://www.unicef.org/health/files/UNICEF_HSS_Approach.pdf
REFERENCES
49
World Health Organization (2015), Water, sanitation and hygiene in health care facilities: Status in low- and middle-income countries and way forward, https://apps.who.int/iris/bitstream/handle/10665/154588/9789241508476_eng.pdf?sequence=1
World Health Organization and United Nations Children’s Fund (2018), Core questions and indicators for monitoring WASH in Health Care Facilities in the Sustainable Development Goals, https://washdata.org/report/jmp-2018-core-questions-monitoring-winhcf-en
United Nations Children’s Fund, ‘Guidance Note on Strengthening Enabling Environment for Water, Sanitation and Hygiene’, https://www.unicef.org/wash/files/WASH_guidance_note_draft_10_3_hr.pdf
World Health Organization and United Nations Children’s Fund, Water and Sanitation for Health Facility Improvement Tool (WASH FIT), https://apps.who.int/iris/bitstream/handle/10665/254910/9789241511698eng.pdf;jsessionid=C328A26A323DDA5FF10BAC8CC1380098?sequence=1
Technology Exchange Lab, Solar suitcase, We Care Solar, https://www.techxlab.org/solutions/we-care-solar-suitcase
World Health Organization, ‘AMR Action Plan’, https://apps.who.int/iris/bitstream/handle/10665/193736/9789241509763_eng.pdf?sequence=1
Ministry of Health of the Republic of Uganda (2017), ‘National Health Facility Master List: A complete list of all health facilities in Uganda’
Ministry of Health of the Government of Kenya, National Infection Prevention and Control Guidelines for Health Care Services in Kenya
Ministry of Health of the Government of Kenya, National Strategic Plan for Infection Prevention and Control (IPC) for Health Care Services in Kenya
Ministry of Health of the Government of Kenya, Kenya Quality Model for Health Quality Standards for Community Health Services
Government of Kenya, The 2010 Constitution of Kenya, http://extwprlegs1.fao.org/docs/pdf/ken127322.pdf
Ministry of Health of the Government of Kenya, National Infection Prevention and Control Guidelines for Health Care Services in Kenya
Ministry of Health of the Government of Kenya, Kenya’s Referral Health care system, https://www.researchgate.net/figure/Flow-chart-of-the-health-delivery-system-in-Kenya_fig1_237833798
2018 Eritrea RMNCAH Policy Guidelines
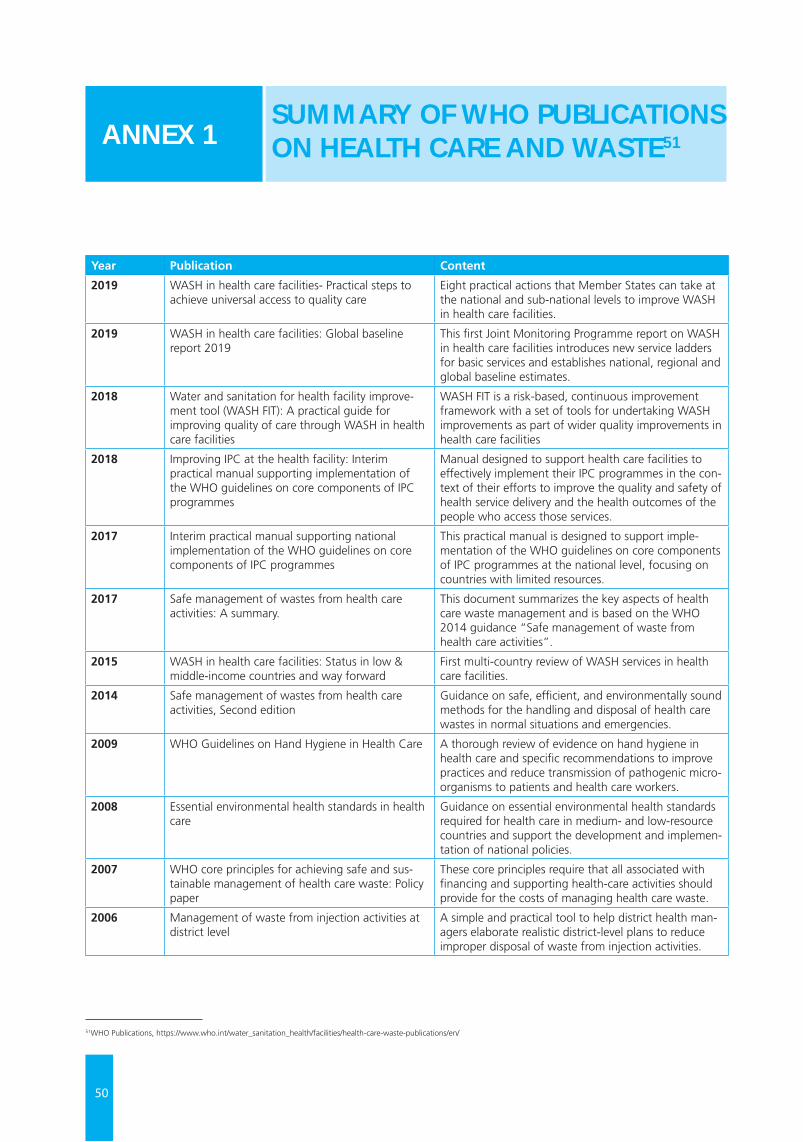
50
Year Publication Content
2019 WASH in health care facilities- Practical steps to achieve universal access to quality care
Eight practical actions that Member States can take at the national and sub-national levels to improve WASH in health care facilities.
2019 WASH in health care facilities: Global baseline report 2019
This first Joint Monitoring Programme report on WASH in health care facilities introduces new service ladders for basic services and establishes national, regional and global baseline estimates.
2018 Water and sanitation for health facility improve-ment tool (WASH FIT): A practical guide for improving quality of care through WASH in health care facilities
WASH FIT is a risk-based, continuous improvement framework with a set of tools for undertaking WASH improvements as part of wider quality improvements in health care facilities
2018 Improving IPC at the health facility: Interim practical manual supporting implementation of the WHO guidelines on core components of IPC programmes
Manual designed to support health care facilities to effectively implement their IPC programmes in the con-text of their efforts to improve the quality and safety of health service delivery and the health outcomes of the people who access those services.
2017 Interim practical manual supporting national implementation of the WHO guidelines on core components of IPC programmes
This practical manual is designed to support imple-mentation of the WHO guidelines on core components of IPC programmes at the national level, focusing on countries with limited resources.
2017 Safe management of wastes from health care activities: A summary.
This document summarizes the key aspects of health care waste management and is based on the WHO 2014 guidance “Safe management of waste from health care activities”.
2015 WASH in health care facilities: Status in low & middle-income countries and way forward
First multi-country review of WASH services in health care facilities.
2014 Safe management of wastes from health care activities, Second edition
Guidance on safe, efficient, and environmentally sound methods for the handling and disposal of health care wastes in normal situations and emergencies.
2009 WHO Guidelines on Hand Hygiene in Health Care A thorough review of evidence on hand hygiene in health care and specific recommendations to improve practices and reduce transmission of pathogenic micro-organisms to patients and health care workers.
2008 Essential environmental health standards in health care
Guidance on essential environmental health standards required for health care in medium- and low-resource countries and support the development and implemen-tation of national policies.
2007 WHO core principles for achieving safe and sus-tainable management of health care waste: Policy paper
These core principles require that all associated with financing and supporting health-care activities should provide for the costs of managing health care waste.
2006 Management of waste from injection activities at district level
A simple and practical tool to help district health man-agers elaborate realistic district-level plans to reduce improper disposal of waste from injection activities.
SUMMARY OF WHO PUBLICATIONS ON HEALTH CARE AND WASTE51ANNEX 1
51WHO Publications, https://www.who.int/water_sanitation_health/facilities/health-care-waste-publications/en/
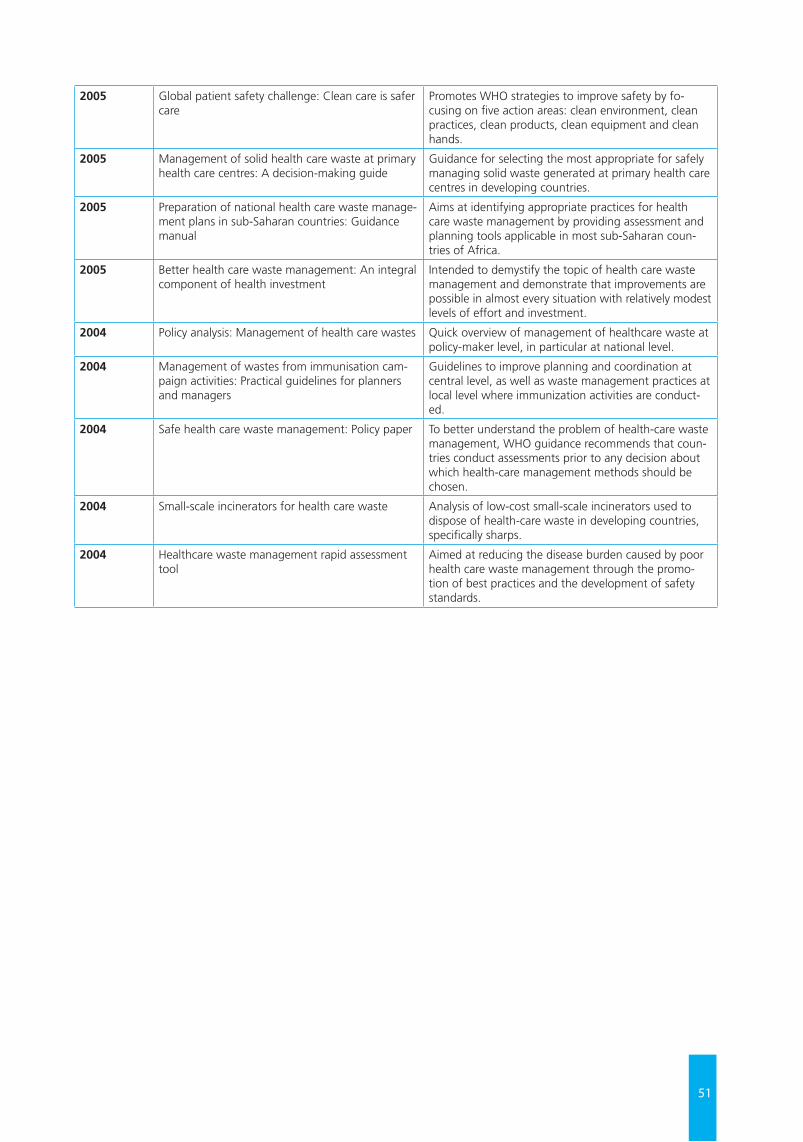
51
2005 Global patient safety challenge: Clean care is safer care
Promotes WHO strategies to improve safety by fo-cusing on five action areas: clean environment, clean practices, clean products, clean equipment and clean hands.
2005 Management of solid health care waste at primary health care centres: A decision-making guide
Guidance for selecting the most appropriate for safely managing solid waste generated at primary health care centres in developing countries.
2005 Preparation of national health care waste manage-ment plans in sub-Saharan countries: Guidance manual
Aims at identifying appropriate practices for health care waste management by providing assessment and planning tools applicable in most sub-Saharan coun-tries of Africa.
2005 Better health care waste management: An integral component of health investment
Intended to demystify the topic of health care waste management and demonstrate that improvements are possible in almost every situation with relatively modest levels of effort and investment.
2004 Policy analysis: Management of health care wastes Quick overview of management of healthcare waste at policy-maker level, in particular at national level.
2004 Management of wastes from immunisation cam-paign activities: Practical guidelines for planners and managers
Guidelines to improve planning and coordination at central level, as well as waste management practices at local level where immunization activities are conduct-ed.
2004 Safe health care waste management: Policy paper To better understand the problem of health-care waste management, WHO guidance recommends that coun-tries conduct assessments prior to any decision about which health-care management methods should be chosen.
2004 Small-scale incinerators for health care waste Analysis of low-cost small-scale incinerators used to dispose of health-care waste in developing countries, specifically sharps.
2004 Healthcare waste management rapid assessment tool
Aimed at reducing the disease burden caused by poor health care waste management through the promo-tion of best practices and the development of safety standards.
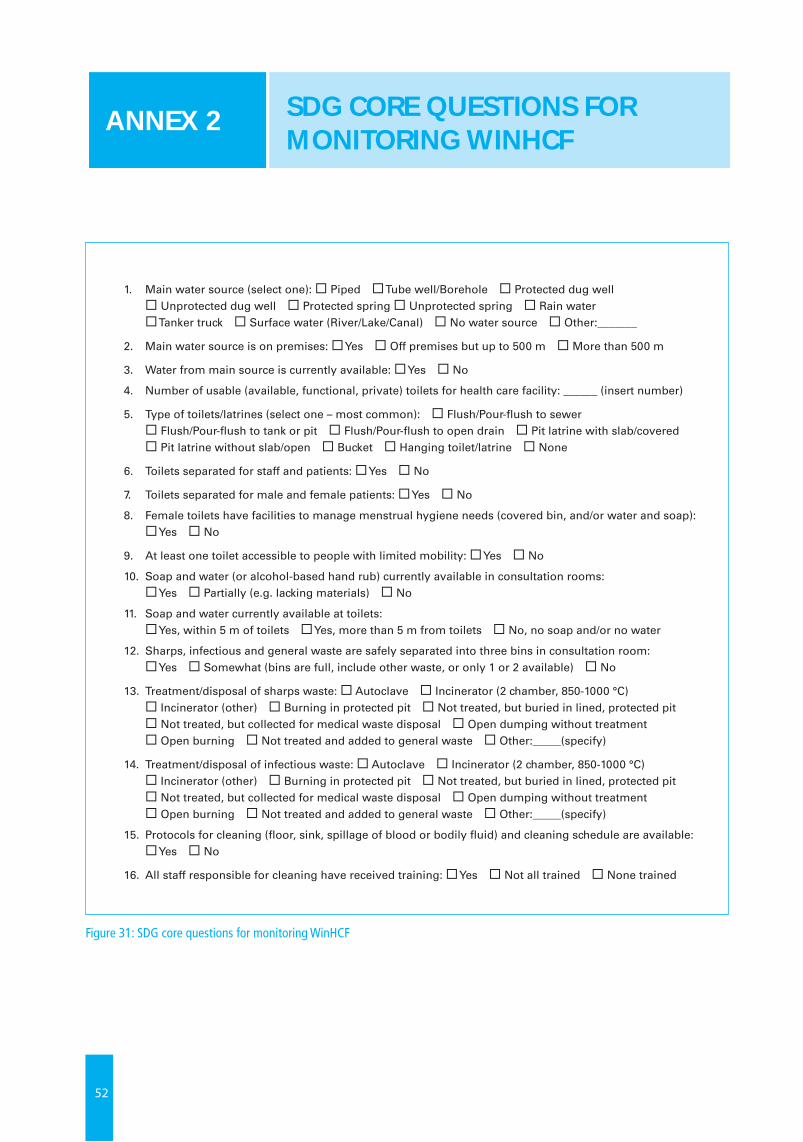
52
Figure 31: SDG core questions for monitoring WinHCF
Core questions and indicators for monitoring WASH in health care facilities in the Sustainable Development Goals 17
1. Main water source (select one): Piped Tube well/Borehole Protected dug well Unprotected dug well Protected spring Unprotected spring Rain water Tanker truck Surface water (River/Lake/Canal) No water source Other:_______
2. Main water source is on premises: Yes Off premises but up to 500 m More than 500 m
3. Water from main source is currently available: Yes No
4. Number of usable (available, functional, private) toilets for health care facility: ______ (insert number)
5. Type of toilets/latrines (select one – most common): Flush/Pour-flush to sewer Flush/Pour-flush to tank or pit Flush/Pour-flush to open drain Pit latrine with slab/covered Pit latrine without slab/open Bucket Hanging toilet/latrine None
6. Toilets separated for staff and patients: Yes No
7. Toilets separated for male and female patients: Yes No
8. Female toilets have facilities to manage menstrual hygiene needs (covered bin, and/or water and soap): Yes No
9. At least one toilet accessible to people with limited mobility: Yes No
10. Soap and water (or alcohol-based hand rub) currently available in consultation rooms: Yes Partially (e.g. lacking materials) No
11. Soap and water currently available at toilets: Yes, within 5 m of toilets Yes, more than 5 m from toilets No, no soap and/or no water
12. Sharps, infectious and general waste are safely separated into three bins in consultation room: Yes Somewhat (bins are full, include other waste, or only 1 or 2 available) No
13. Treatment/disposal of sharps waste: Autoclave Incinerator (2 chamber, 850-1000 °C) Incinerator (other) Burning in protected pit Not treated, but buried in lined, protected pit Not treated, but collected for medical waste disposal Open dumping without treatment Open burning Not treated and added to general waste Other:_____(specify)
14. Treatment/disposal of infectious waste: Autoclave Incinerator (2 chamber, 850-1000 °C) Incinerator (other) Burning in protected pit Not treated, but buried in lined, protected pit Not treated, but collected for medical waste disposal Open dumping without treatment Open burning Not treated and added to general waste Other:_____(specify)
15. Protocols for cleaning (floor, sink, spillage of blood or bodily fluid) and cleaning schedule are available: Yes No
16. All staff responsible for cleaning have received training: Yes Not all trained None trained
Figure 3. Example of core questions adapted for national HMIS
SDG CORE QUESTIONS FOR MONITORING WINHCF
ANNEX 2
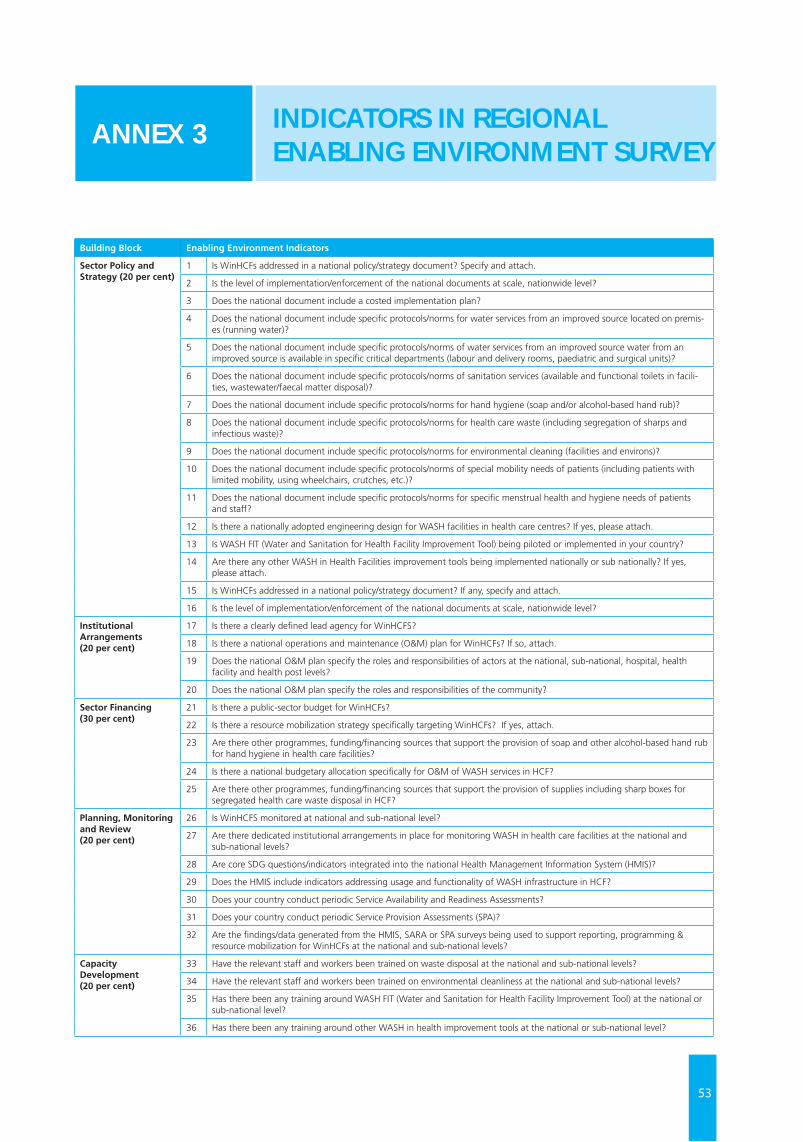
53
INDICATORS IN REGIONAL ENABLING ENVIRONMENT SURVEY
ANNEX 3
Building Block Enabling Environment Indicators
Sector Policy and Strategy (20 per cent)
1 Is WinHCFs addressed in a national policy/strategy document? Specify and attach.
2 Is the level of implementation/enforcement of the national documents at scale, nationwide level?
3 Does the national document include a costed implementation plan?
4 Does the national document include specific protocols/norms for water services from an improved source located on premis-es (running water)?
5 Does the national document include specific protocols/norms of water services from an improved source water from an improved source is available in specific critical departments (labour and delivery rooms, paediatric and surgical units)?
6 Does the national document include specific protocols/norms of sanitation services (available and functional toilets in facili-ties, wastewater/faecal matter disposal)?
7 Does the national document include specific protocols/norms for hand hygiene (soap and/or alcohol-based hand rub)?
8 Does the national document include specific protocols/norms for health care waste (including segregation of sharps and infectious waste)?
9 Does the national document include specific protocols/norms for environmental cleaning (facilities and environs)?
10 Does the national document include specific protocols/norms of special mobility needs of patients (including patients with limited mobility, using wheelchairs, crutches, etc.)?
11 Does the national document include specific protocols/norms for specific menstrual health and hygiene needs of patients and staff?
12 Is there a nationally adopted engineering design for WASH facilities in health care centres? If yes, please attach.
13 Is WASH FIT (Water and Sanitation for Health Facility Improvement Tool) being piloted or implemented in your country?
14 Are there any other WASH in Health Facilities improvement tools being implemented nationally or sub nationally? If yes, please attach.
15 Is WinHCFs addressed in a national policy/strategy document? If any, specify and attach.
16 Is the level of implementation/enforcement of the national documents at scale, nationwide level?
Institutional Arrangements(20 per cent)
17 Is there a clearly defined lead agency for WinHCFS?
18 Is there a national operations and maintenance (O&M) plan for WinHCFs? If so, attach.
19 Does the national O&M plan specify the roles and responsibilities of actors at the national, sub-national, hospital, health facility and health post levels?
20 Does the national O&M plan specify the roles and responsibilities of the community?
Sector Financing (30 per cent)
21 Is there a public-sector budget for WinHCFs?
22 Is there a resource mobilization strategy specifically targeting WinHCFs? If yes, attach.
23 Are there other programmes, funding/financing sources that support the provision of soap and other alcohol-based hand rub for hand hygiene in health care facilities?
24 Is there a national budgetary allocation specifically for O&M of WASH services in HCF?
25 Are there other programmes, funding/financing sources that support the provision of supplies including sharp boxes for segregated health care waste disposal in HCF?
Planning, Monitoring and Review (20 per cent)
26 Is WinHCFS monitored at national and sub-national level?
27 Are there dedicated institutional arrangements in place for monitoring WASH in health care facilities at the national and sub-national levels?
28 Are core SDG questions/indicators integrated into the national Health Management Information System (HMIS)?
29 Does the HMIS include indicators addressing usage and functionality of WASH infrastructure in HCF?
30 Does your country conduct periodic Service Availability and Readiness Assessments?
31 Does your country conduct periodic Service Provision Assessments (SPA)?
32 Are the findings/data generated from the HMIS, SARA or SPA surveys being used to support reporting, programming & resource mobilization for WinHCFs at the national and sub-national levels?
Capacity Development (20 per cent)
33 Have the relevant staff and workers been trained on waste disposal at the national and sub-national levels?
34 Have the relevant staff and workers been trained on environmental cleanliness at the national and sub-national levels?
35 Has there been any training around WASH FIT (Water and Sanitation for Health Facility Improvement Tool) at the national or sub-national level?
36 Has there been any training around other WASH in health improvement tools at the national or sub-national level?
54
Ethiopia stands out in the 2019 Regional WASH in Health Care Facilities Scoping Study as the country with the strongest enabling environment for WinHCF in Eastern and Southern Africa Region. For the building blocks on sector policy and strategy (81.3 per cent), institutional arrangements (79.0 per cent), sector financing (82.5 per cent) and capacity development (75.1 per cent), Ethiopia also scored very high. Planning, monitoring and review came in at 50.0 per cent. One key feature of the WASH sector in Ethiopia is the country’s flagship One WASH National Programme (OWNP), which has been assessed to play a prominent role in shaping the enabling environment for WASH service delivery.
Originally kicking off in July 2013, the OWNP is a sector-wide approach (SWAp) centred on the pooling of WASH resources, capacity, logistics and expertise to improve public health and well-being through increased access to water and sanitation and good hygiene practices in an equitable and sustainable manner.
In 2018, the Government of Ethiopia approved the second phase of the OWNP, which is aligned to the second national Growth and Transformation Plan (GTP-II) and is expected to run up to July 2020. With an overall budget of US$6.5 billion, and a new component on climate-resilient WASH, OWNP-II builds on the original principles of multi-sectoral coordination, harmonization and alignment, all structured under a single plan and budget
The One WASH National Programme brings together four line ministries – 1) Water, Irrigation and Electricity; 2) Health; 3) Education; and 4) Finance and Economic Development – under one national plan to modernize the way water and sanitation services are delivered to the people of Ethiopia, improving the health situation, decreasing the drop-out rates of children in schools, and making financing for WASH more effective. It is led by the Ministry of Water, Irrigation and Energy, represented by the National WASH Coordination Office, and is supported by a task force consisting of focal points of WASH ministries, donors, civil society and bilateral organizations.
The main instrument to implement WASH programmes in Ethiopia is the Consolidated WASH Account (OWN-CWA), which is a government-led initiative working as a pool fund and including contributions from UNICEF and other donors including the World Bank, the African Development Bank, the United Kingdom Department of International Development (DfID), the Government of Finland and the Korea International Cooperation Agency (KOICA).
OWNP-I was initially designed around four components: 1) Rural and Pastoral WASH; 2) Urban WASH; 3) Institutional WASH; and 4) Programme Management and Capacity Building, with WASH in Health and WASH in Schools falling under the Institutional WASH component, which caters to improving water supply, sanitation facilities and hygiene practices in schools and health institutions. A fifth component, on climate-resilient WASH, has since been introduced: this is strategically aimed at creating climate-resilient water supply systems that provide safe and sustainable access to water to communities in drought-prone areas, despite the anticipated negative impact of climate change in the region.
For such a holistic sector-wide approach to work in Ethiopia, numerous platforms, guidelines, systems and structures had first to be put in place to facilitate coordination and harmonization amongst stakeholders. Extensive discussions, consultations and consensus had to be established prior to institutionalization of the One WASH National Programme: this thus strengthened the enabling environment for WASH service delivery across all sub-sectors, including water, sanitation, and hygiene in rural, pastoral, urban and institutional settings.
Despite Ethiopia’s strong enabling environment, the basic WASH coverage data according to the recent JMP baseline report remains quite low. Basic water is at 30.0 percent, basic sanitation 59.25 per cent, and basic waste management 64.33 per cent, with insufficient national data to determine basic hygiene and environmental cleaning. Bridging this observed gap between the enabling environment and improved basic access in health care facilities will require additional efforts, more effective operations and maintenance and robust monitoring approaches to translate national frameworks and coordination mechanisms into implementation gains at the facility level.
A CLOSER LOOK AT ETHIOPIA’S ENABLING ENVIRONMENT FOR WASH IN HEALTH CARE FACILITIES
ANNEX 4
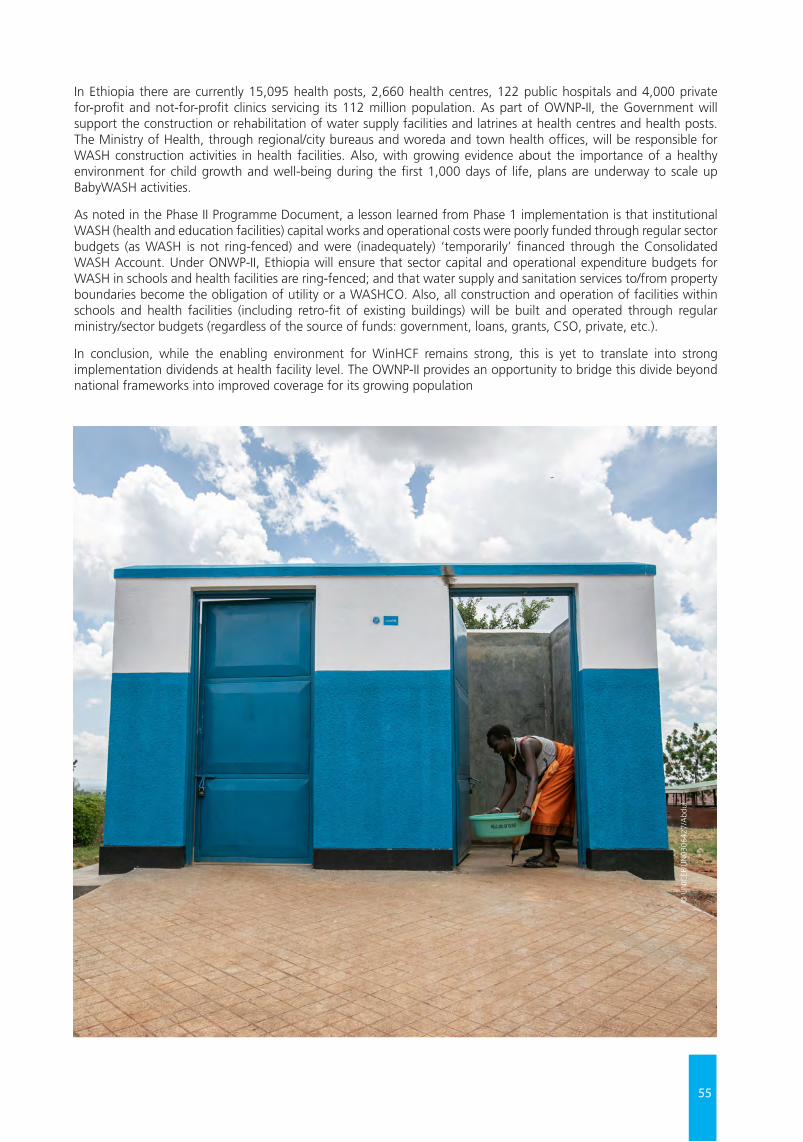
55
© U
NIC
EF/U
N03
0642
7/A
bdul
In Ethiopia there are currently 15,095 health posts, 2,660 health centres, 122 public hospitals and 4,000 private for-profit and not-for-profit clinics servicing its 112 million population. As part of OWNP-II, the Government will support the construction or rehabilitation of water supply facilities and latrines at health centres and health posts. The Ministry of Health, through regional/city bureaus and woreda and town health offices, will be responsible for WASH construction activities in health facilities. Also, with growing evidence about the importance of a healthy environment for child growth and well-being during the first 1,000 days of life, plans are underway to scale up BabyWASH activities.
As noted in the Phase II Programme Document, a lesson learned from Phase 1 implementation is that institutional WASH (health and education facilities) capital works and operational costs were poorly funded through regular sector budgets (as WASH is not ring-fenced) and were (inadequately) ‘temporarily’ financed through the Consolidated WASH Account. Under ONWP-II, Ethiopia will ensure that sector capital and operational expenditure budgets for WASH in schools and health facilities are ring-fenced; and that water supply and sanitation services to/from property boundaries become the obligation of utility or a WASHCO. Also, all construction and operation of facilities within schools and health facilities (including retro-fit of existing buildings) will be built and operated through regular ministry/sector budgets (regardless of the source of funds: government, loans, grants, CSO, private, etc.).
In conclusion, while the enabling environment for WinHCF remains strong, this is yet to translate into strong implementation dividends at health facility level. The OWNP-II provides an opportunity to bridge this divide beyond national frameworks into improved coverage for its growing population
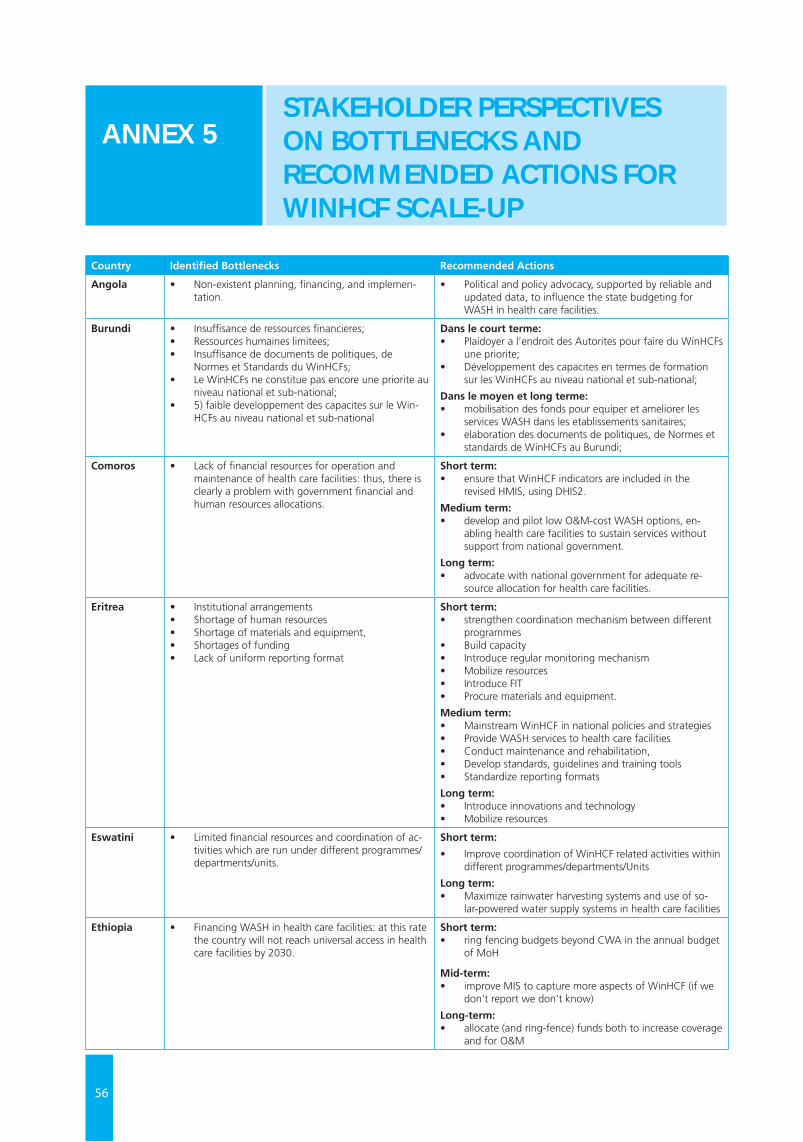
56
Country Identified Bottlenecks Recommended Actions
Angola • Non-existent planning, financing, and implemen-tation.
• Political and policy advocacy, supported by reliable and updated data, to influence the state budgeting for WASH in health care facilities.
Burundi • Insuffisance de ressources financieres;• Ressources humaines limitees;• Insuffisance de documents de politiques, de
Normes et Standards du WinHCFs;• Le WinHCFs ne constitue pas encore une priorite au
niveau national et sub-national;• 5) faible developpement des capacites sur le Win-
HCFs au niveau national et sub-national
Dans le court terme:• Plaidoyer a l’endroit des Autorites pour faire du WinHCFs
une priorite;• Développement des capacites en termes de formation
sur les WinHCFs au niveau national et sub-national;
Dans le moyen et long terme:• mobilisation des fonds pour equiper et ameliorer les
services WASH dans les etablissements sanitaires;• elaboration des documents de politiques, de Normes et
standards de WinHCFs au Burundi;
Comoros • Lack of financial resources for operation and maintenance of health care facilities: thus, there is clearly a problem with government financial and human resources allocations.
Short term: • ensure that WinHCF indicators are included in the
revised HMIS, using DHIS2.
Medium term: • develop and pilot low O&M-cost WASH options, en-
abling health care facilities to sustain services without support from national government.
Long term: • advocate with national government for adequate re-
source allocation for health care facilities.
Eritrea • Institutional arrangements • Shortage of human resources• Shortage of materials and equipment,• Shortages of funding • Lack of uniform reporting format
Short term: • strengthen coordination mechanism between different
programmes• Build capacity• Introduce regular monitoring mechanism• Mobilize resources• Introduce FIT• Procure materials and equipment.
Medium term:• Mainstream WinHCF in national policies and strategies• Provide WASH services to health care facilities• Conduct maintenance and rehabilitation,• Develop standards, guidelines and training tools• Standardize reporting formats
Long term:• Introduce innovations and technology • Mobilize resources
Eswatini • Limited financial resources and coordination of ac-tivities which are run under different programmes/departments/units.
Short term:
• Improve coordination of WinHCF related activities within different programmes/departments/Units
Long term: • Maximize rainwater harvesting systems and use of so-
lar-powered water supply systems in health care facilities
Ethiopia • Financing WASH in health care facilities: at this rate the country will not reach universal access in health care facilities by 2030.
Short term: • ring fencing budgets beyond CWA in the annual budget
of MoH
Mid-term: • improve MIS to capture more aspects of WinHCF (if we
don’t report we don’t know)
Long-term:• allocate (and ring-fence) funds both to increase coverage
and for O&M
STAKEHOLDER PERSPECTIVES ON BOTTLENECKS AND RECOMMENDED ACTIONS FOR WINHCF SCALE-UP
ANNEX 5
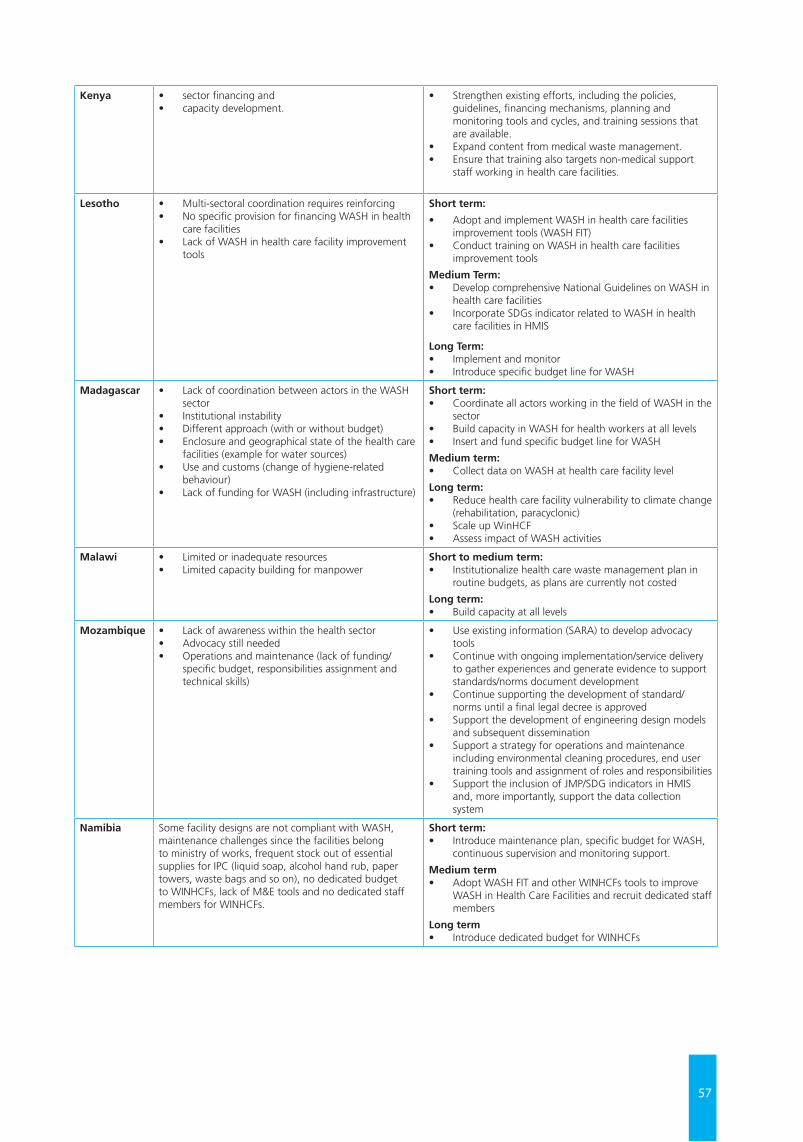
57
Kenya • sector financing and • capacity development.
• Strengthen existing efforts, including the policies, guidelines, financing mechanisms, planning and monitoring tools and cycles, and training sessions that are available.
• Expand content from medical waste management. • Ensure that training also targets non-medical support
staff working in health care facilities.
Lesotho • Multi-sectoral coordination requires reinforcing• No specific provision for financing WASH in health
care facilities • Lack of WASH in health care facility improvement
tools
Short term:
• Adopt and implement WASH in health care facilities improvement tools (WASH FIT)
• Conduct training on WASH in health care facilities improvement tools
Medium Term:• Develop comprehensive National Guidelines on WASH in
health care facilities • Incorporate SDGs indicator related to WASH in health
care facilities in HMIS
Long Term:• Implement and monitor • Introduce specific budget line for WASH
Madagascar • Lack of coordination between actors in the WASH sector
• Institutional instability• Different approach (with or without budget) • Enclosure and geographical state of the health care
facilities (example for water sources) • Use and customs (change of hygiene-related
behaviour)• Lack of funding for WASH (including infrastructure)
Short term: • Coordinate all actors working in the field of WASH in the
sector • Build capacity in WASH for health workers at all levels • Insert and fund specific budget line for WASH
Medium term: • Collect data on WASH at health care facility level
Long term:• Reduce health care facility vulnerability to climate change
(rehabilitation, paracyclonic)• Scale up WinHCF • Assess impact of WASH activities
Malawi • Limited or inadequate resources • Limited capacity building for manpower
Short to medium term: • Institutionalize health care waste management plan in
routine budgets, as plans are currently not costed
Long term: • Build capacity at all levels
Mozambique • Lack of awareness within the health sector• Advocacy still needed• Operations and maintenance (lack of funding/
specific budget, responsibilities assignment and technical skills)
• Use existing information (SARA) to develop advocacy tools
• Continue with ongoing implementation/service delivery to gather experiences and generate evidence to support standards/norms document development
• Continue supporting the development of standard/norms until a final legal decree is approved
• Support the development of engineering design models and subsequent dissemination
• Support a strategy for operations and maintenance including environmental cleaning procedures, end user training tools and assignment of roles and responsibilities
• Support the inclusion of JMP/SDG indicators in HMIS and, more importantly, support the data collection system
Namibia Some facility designs are not compliant with WASH, maintenance challenges since the facilities belong to ministry of works, frequent stock out of essential supplies for IPC (liquid soap, alcohol hand rub, paper towers, waste bags and so on), no dedicated budget to WINHCFs, lack of M&E tools and no dedicated staff members for WINHCFs.
Short term:• Introduce maintenance plan, specific budget for WASH,
continuous supervision and monitoring support.
Medium term• Adopt WASH FIT and other WINHCFs tools to improve
WASH in Health Care Facilities and recruit dedicated staff members
Long term• Introduce dedicated budget for WINHCFs
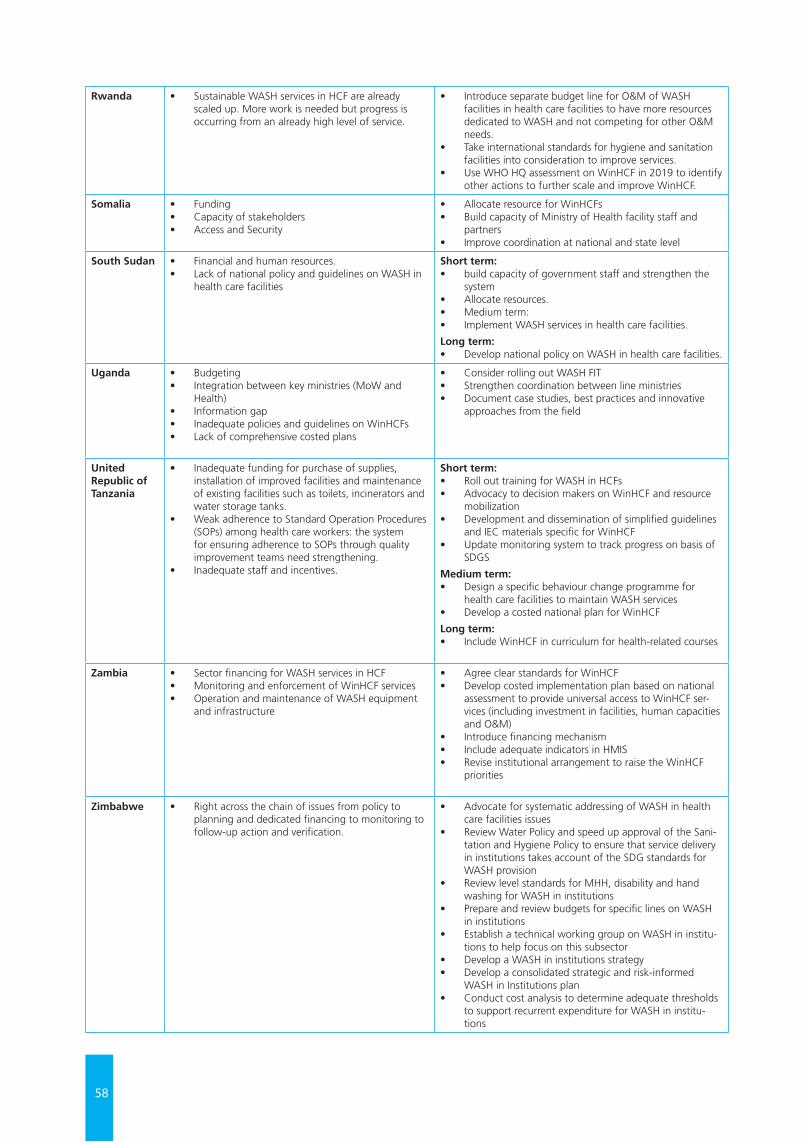
58
Rwanda • Sustainable WASH services in HCF are already scaled up. More work is needed but progress is occurring from an already high level of service.
• Introduce separate budget line for O&M of WASH facilities in health care facilities to have more resources dedicated to WASH and not competing for other O&M needs.
• Take international standards for hygiene and sanitation facilities into consideration to improve services.
• Use WHO HQ assessment on WinHCF in 2019 to identify other actions to further scale and improve WinHCF.
Somalia • Funding • Capacity of stakeholders• Access and Security
• Allocate resource for WinHCFs • Build capacity of Ministry of Health facility staff and
partners • Improve coordination at national and state level
South Sudan • Financial and human resources. • Lack of national policy and guidelines on WASH in
health care facilities
Short term:• build capacity of government staff and strengthen the
system• Allocate resources. • Medium term: • Implement WASH services in health care facilities.
Long term:• Develop national policy on WASH in health care facilities.
Uganda • Budgeting• Integration between key ministries (MoW and
Health)• Information gap• Inadequate policies and guidelines on WinHCFs• Lack of comprehensive costed plans
• Consider rolling out WASH FIT• Strengthen coordination between line ministries• Document case studies, best practices and innovative
approaches from the field
United Republic of Tanzania
• Inadequate funding for purchase of supplies, installation of improved facilities and maintenance of existing facilities such as toilets, incinerators and water storage tanks.
• Weak adherence to Standard Operation Procedures (SOPs) among health care workers: the system for ensuring adherence to SOPs through quality improvement teams need strengthening.
• Inadequate staff and incentives.
Short term: • Roll out training for WASH in HCFs• Advocacy to decision makers on WinHCF and resource
mobilization • Development and dissemination of simplified guidelines
and IEC materials specific for WinHCF • Update monitoring system to track progress on basis of
SDGS
Medium term: • Design a specific behaviour change programme for
health care facilities to maintain WASH services • Develop a costed national plan for WinHCF
Long term: • Include WinHCF in curriculum for health-related courses
Zambia • Sector financing for WASH services in HCF • Monitoring and enforcement of WinHCF services• Operation and maintenance of WASH equipment
and infrastructure
• Agree clear standards for WinHCF • Develop costed implementation plan based on national
assessment to provide universal access to WinHCF ser-vices (including investment in facilities, human capacities and O&M)
• Introduce financing mechanism• Include adequate indicators in HMIS • Revise institutional arrangement to raise the WinHCF
priorities
Zimbabwe • Right across the chain of issues from policy to planning and dedicated financing to monitoring to follow-up action and verification.
• Advocate for systematic addressing of WASH in health care facilities issues
• Review Water Policy and speed up approval of the Sani-tation and Hygiene Policy to ensure that service delivery in institutions takes account of the SDG standards for WASH provision
• Review level standards for MHH, disability and hand washing for WASH in institutions
• Prepare and review budgets for specific lines on WASH in institutions
• Establish a technical working group on WASH in institu-tions to help focus on this subsector
• Develop a WASH in institutions strategy • Develop a consolidated strategic and risk-informed
WASH in Institutions plan • Conduct cost analysis to determine adequate thresholds
to support recurrent expenditure for WASH in institu-tions
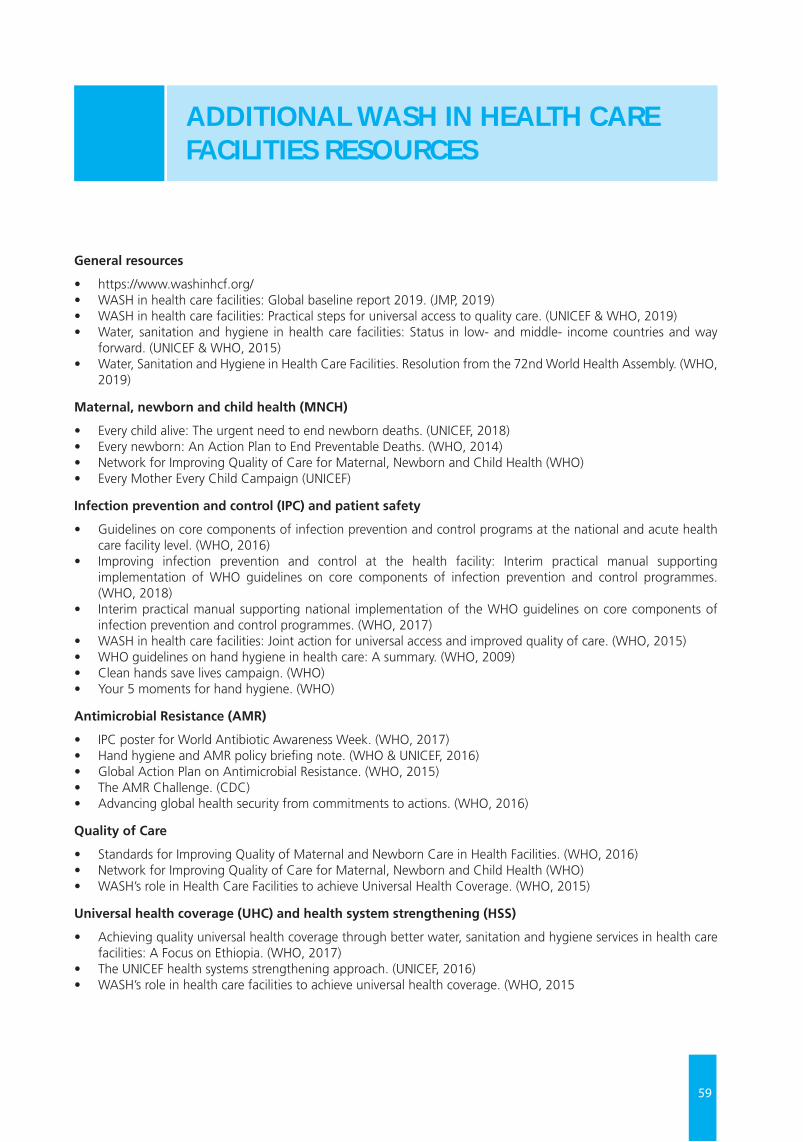
59
General resources
• https://www.washinhcf.org/• WASH in health care facilities: Global baseline report 2019. (JMP, 2019)• WASH in health care facilities: Practical steps for universal access to quality care. (UNICEF & WHO, 2019)• Water, sanitation and hygiene in health care facilities: Status in low- and middle- income countries and way
forward. (UNICEF & WHO, 2015)• Water, Sanitation and Hygiene in Health Care Facilities. Resolution from the 72nd World Health Assembly. (WHO,
2019)
Maternal, newborn and child health (MNCH)
• Every child alive: The urgent need to end newborn deaths. (UNICEF, 2018) • Every newborn: An Action Plan to End Preventable Deaths. (WHO, 2014) • Network for Improving Quality of Care for Maternal, Newborn and Child Health (WHO)• Every Mother Every Child Campaign (UNICEF)
Infection prevention and control (IPC) and patient safety
• Guidelines on core components of infection prevention and control programs at the national and acute health care facility level. (WHO, 2016)
• Improving infection prevention and control at the health facility: Interim practical manual supporting implementation of WHO guidelines on core components of infection prevention and control programmes. (WHO, 2018)
• Interim practical manual supporting national implementation of the WHO guidelines on core components of infection prevention and control programmes. (WHO, 2017)
• WASH in health care facilities: Joint action for universal access and improved quality of care. (WHO, 2015) • WHO guidelines on hand hygiene in health care: A summary. (WHO, 2009)• Clean hands save lives campaign. (WHO)• Your 5 moments for hand hygiene. (WHO)
Antimicrobial Resistance (AMR)
• IPC poster for World Antibiotic Awareness Week. (WHO, 2017) • Hand hygiene and AMR policy briefing note. (WHO & UNICEF, 2016) • Global Action Plan on Antimicrobial Resistance. (WHO, 2015) • The AMR Challenge. (CDC)• Advancing global health security from commitments to actions. (WHO, 2016)
Quality of Care
• Standards for Improving Quality of Maternal and Newborn Care in Health Facilities. (WHO, 2016) • Network for Improving Quality of Care for Maternal, Newborn and Child Health (WHO)• WASH’s role in Health Care Facilities to achieve Universal Health Coverage. (WHO, 2015)
Universal health coverage (UHC) and health system strengthening (HSS)
• Achieving quality universal health coverage through better water, sanitation and hygiene services in health care facilities: A Focus on Ethiopia. (WHO, 2017)
• The UNICEF health systems strengthening approach. (UNICEF, 2016) • WASH’s role in health care facilities to achieve universal health coverage. (WHO, 2015
ADDITIONAL WASH IN HEALTH CARE FACILITIES RESOURCES
68
UNICEF Eastern and Southern Africa Regional OfficeNairobi, Kenya