Embed Size (px)
Citation preview

Washington County HRA
February 3, 2014
County Market Study:
Cottage Grove
Maxfield Research Inc.
Maxfield Research Inc. Housing Study
Purpose – independent third party analysis of county housing market– Document housing needs – Guide HRA strategic planning– Assist with funding applications– Define relationship between housing and economic
development
2
Study Objectives
– Examine existing housing market and demographic trends
– Research existing and projected economic and job sector data
– Identify future senior and workforce housing demand to 2030
– Identify senior housing trends– Develop affordable housing production scenarios
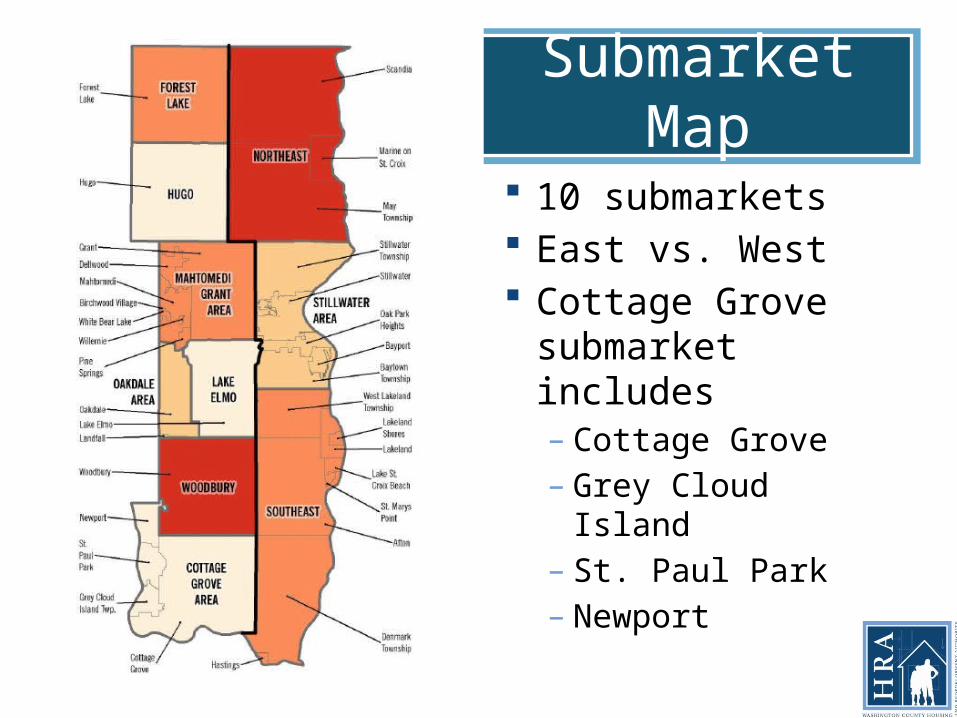
Submarket Map
10 submarkets East vs. West Cottage Grove
submarket includes– Cottage Grove– Grey Cloud Island– St. Paul Park– Newport
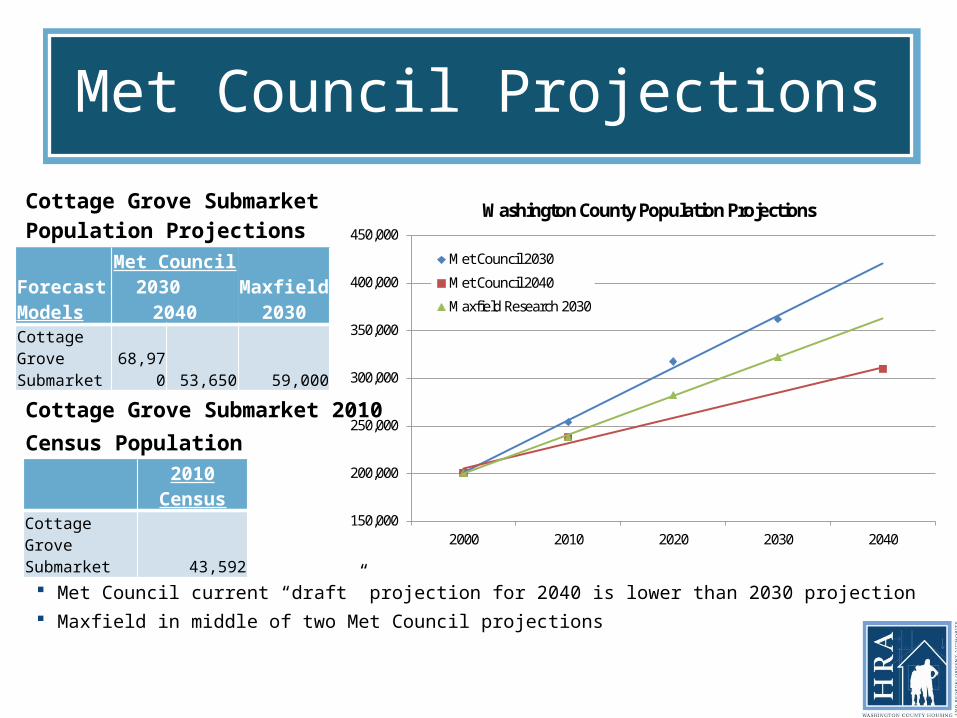
Met Council Projections
Cottage Grove Submarket Population Projections
150,000
200,000
250,000
300,000
350,000
400,000
450,000
2000 2010 2020 2030 2040
Washington County Population Projections
Met Council 2030
Met Council 2040
Maxfield Research 2030
Forecast Models
Met Council 2030 2040
Maxfield 2030
Cottage Grove Submarket 68,970 53,650 59,000
Met Council current “draft” projection for 2040 is lower than 2030 projection Maxfield in middle of two Met Council projections
2010 CensusCottage Grove Submarket 43,592
Cottage Grove Submarket 2010 Census Population
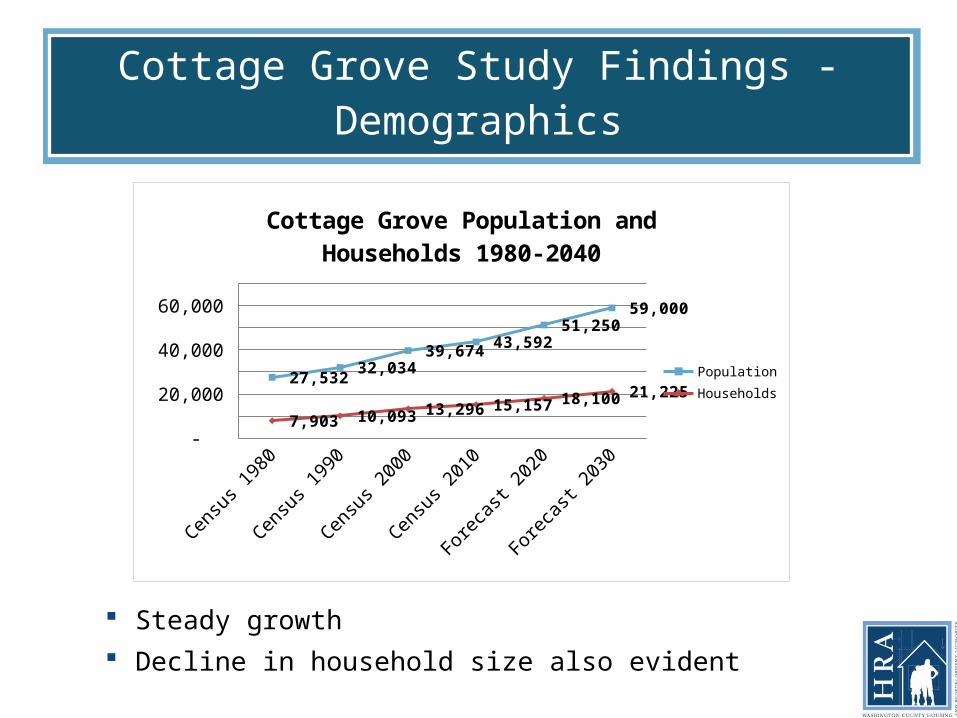
Cottage Grove Study Findings - Demographics
Census 1980
Census 1990
Census 2000
Census 2010
Forecast 2020
Forecast 2030
-
10,000
20,000
30,000
40,000
50,000
60,000
70,000
27,532 32,034
39,674 43,592
51,250
59,000
7,903 10,093 13,296 15,157
18,100 21,225
Cottage Grove Population and Households 1980-2040
Population
Households
Steady growth Decline in household size also evident
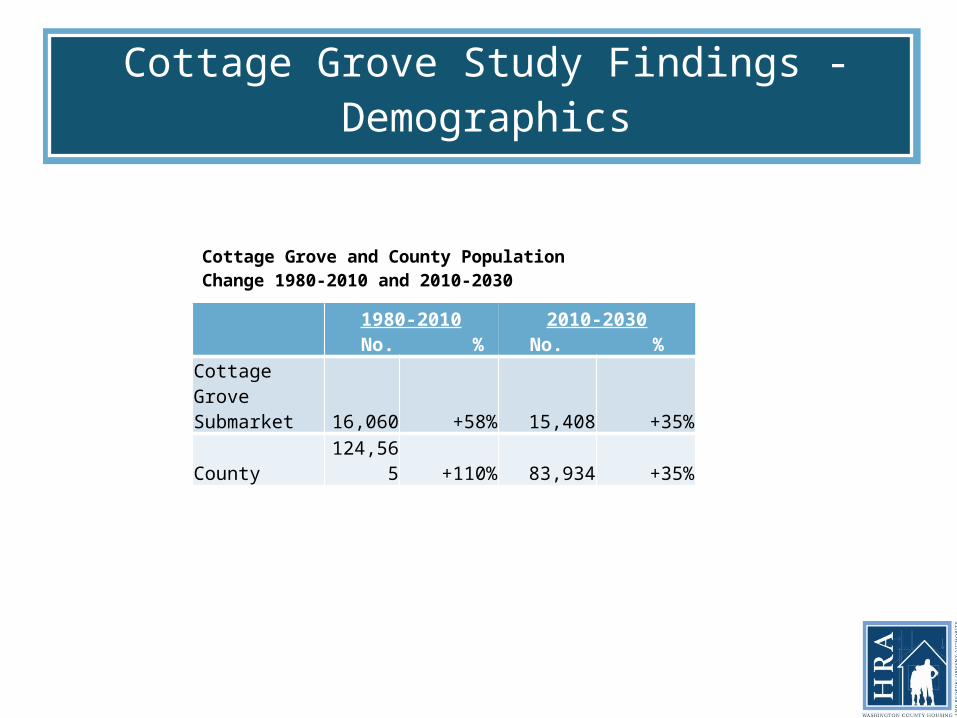
Cottage Grove Study Findings - Demographics
1980-2010 No. %
2010-2030No. %
Cottage Grove Submarket 16,060 +58% 15,408 +35%
County 124,565 +110% 83,934 +35%
Cottage Grove and County Population Change 1980-2010 and 2010-2030

Cottage Grove Study Findings- Jobs
9,368 total jobs– 12.7% of County
Education & Health Services largest– 25% of total
Manufacturing; Education & Health Services; Other Services high concentration
Between 2011-12– Number employees
drop 170; 1.8%
(County + 0.9%)– Number of businesses
+ 20
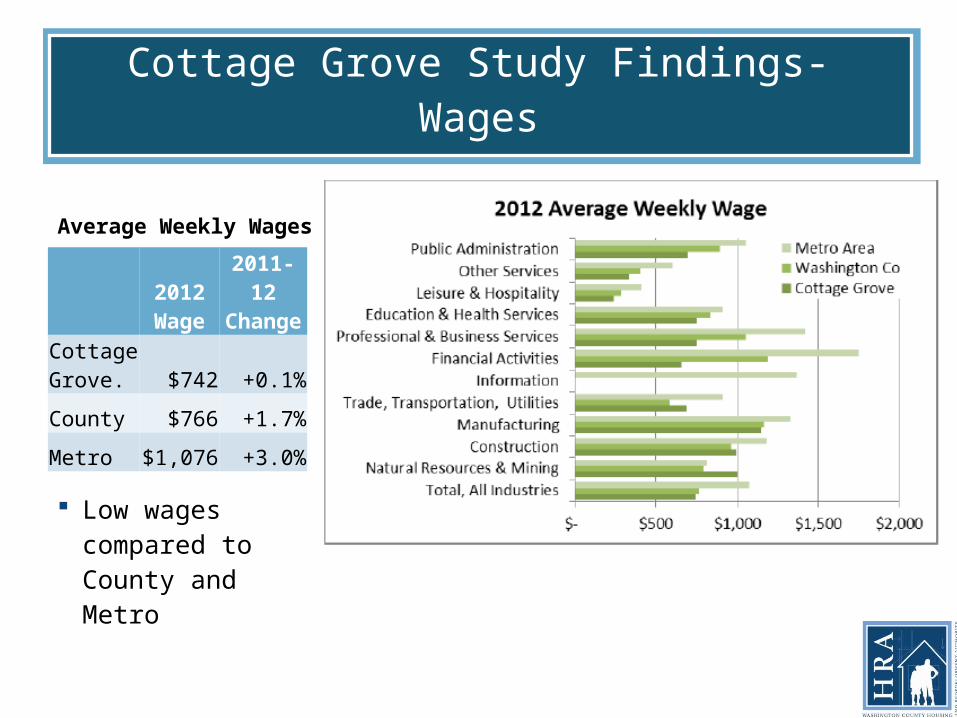
Cottage Grove Study Findings- Wages
Average Weekly Wages2012Wage
2011-12Change
Cottage Grove. $742 +0.1%
County $766 +1.7%
Metro $1,076 +3.0%
Low wages compared to County and Metro

Cottage Grove Study Findings- Employment
Cottage Grove and County Employment Change
No. %
1990-2012
Cottage Grove 2,135 +29%
County 35,072 +90%2010-2020
Cottage Grove 1,386 +14%
County 13,798 +19% 1990 2000 2010 2012 Forecast 2020
-
2,000
4,000
6,000
8,000
10,000
12,000
7,423
10,192 9,614 9,558
11,000
Cottage Grove Employment
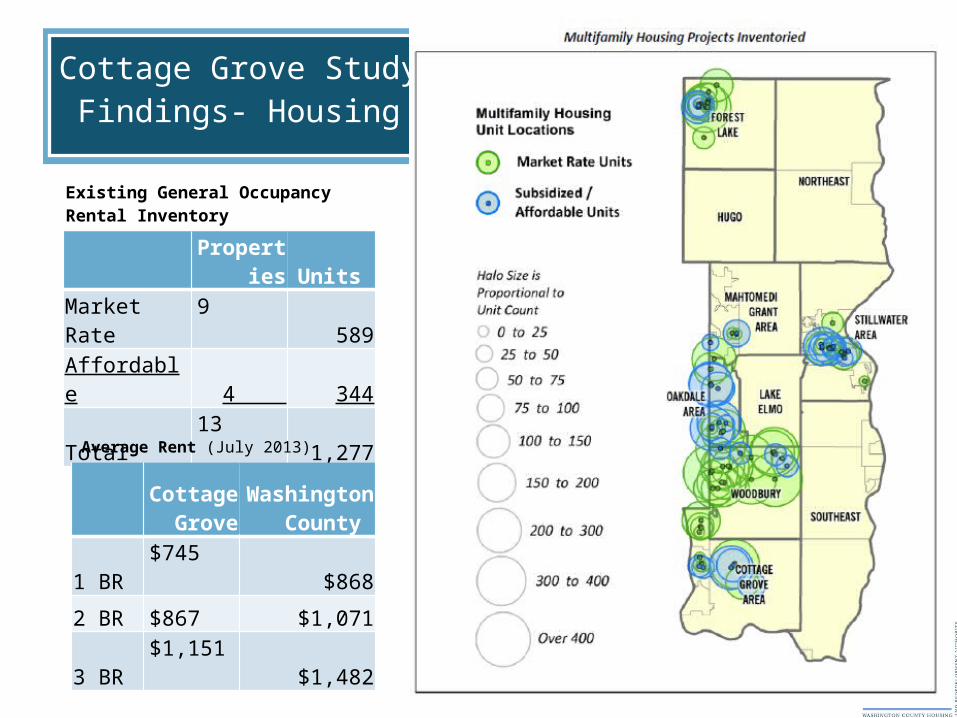
Cottage Grove Study Findings- Housing
Existing General Occupancy Rental Inventory
Properties Units
Market Rate 9 589
Affordable 4 344
Total 13 1,277
Average Rent (July 2013)
Cottage Grove
Washington County
1 BR $745 $868
2 BR $867 $1,071
3 BR$1,151
$1,482
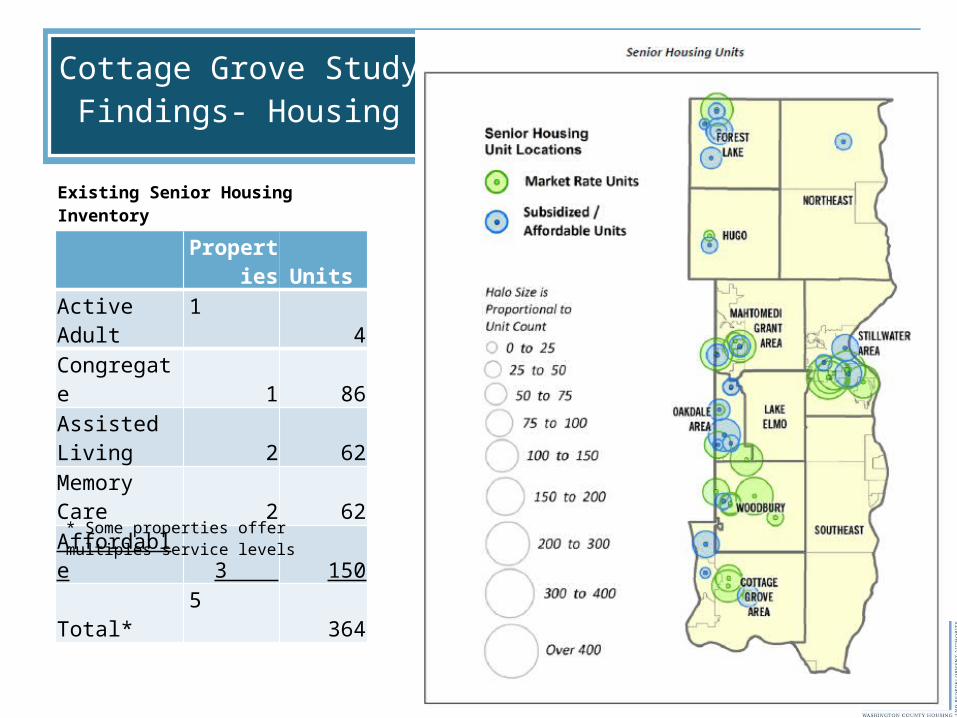
Cottage Grove Study Findings- Housing
Existing Senior Housing Inventory
Properties Units
Active Adult 1 4
Congregate 1 86
Assisted Living 2 62
Memory Care 2 62
Affordable 3 150
Total* 5 364* Some properties offer multiples service levels
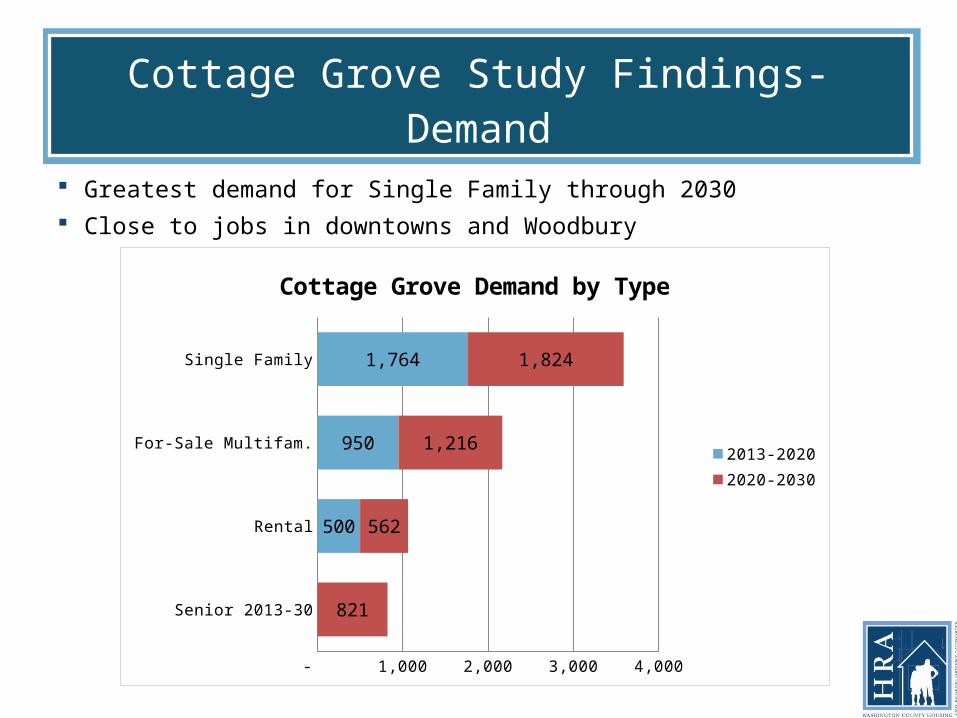
Cottage Grove Study Findings- Demand
Greatest demand for Single Family through 2030 Close to jobs in downtowns and Woodbury
Senior 2013-30
Rental
For-Sale Multifam.
Single Family
- 500 1,000 1,500 2,000 2,500 3,000 3,500 4,000
821
562
1,216
1,824
500
950
1,764
Cottage Grove Demand by Type
2013-20202020-2030
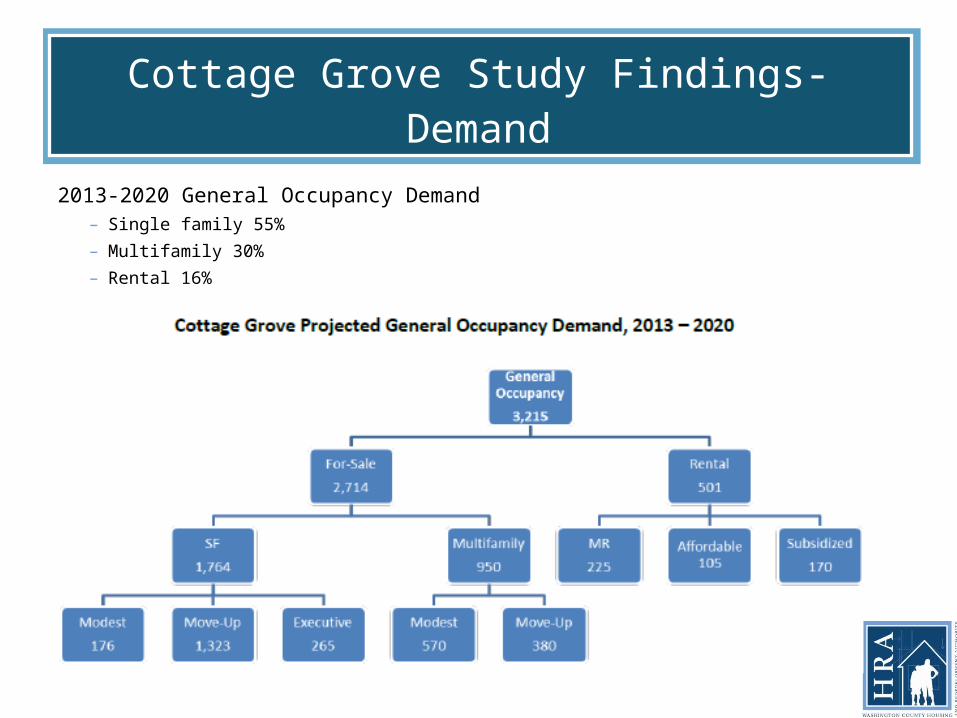
Cottage Grove Study Findings- Demand
2013-2020 General Occupancy Demand– Single family 55% – Multifamily 30% – Rental 16%
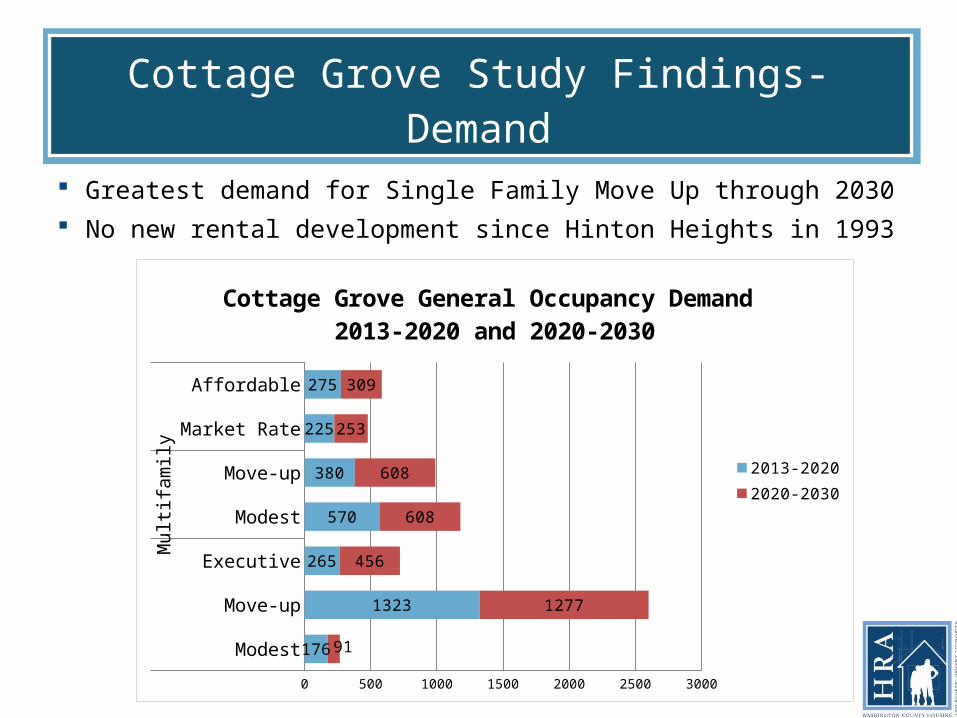
Cottage Grove Study Findings- Demand
Greatest demand for Single Family Move Up through 2030 No new rental development since Hinton Heights in 1993
Modest
Move-up
Executive
Modest
Move-up
Market Rate
Affordable
Sin
gle
Fam
ilyM
ultif
amily
Ren
tal
0 500 1000 1500 2000 2500 3000
176
1323
265
570
380
225
275
91
1277
456
608
608
253
309
Cottage Grove General Occupancy Demand 2013-2020 and 2020-2030
2013-20202020-2030

Cottage Grove Study Findings- Demand
2020 point in time demand for senior housing
Cottage Grove Study Findings- Demand
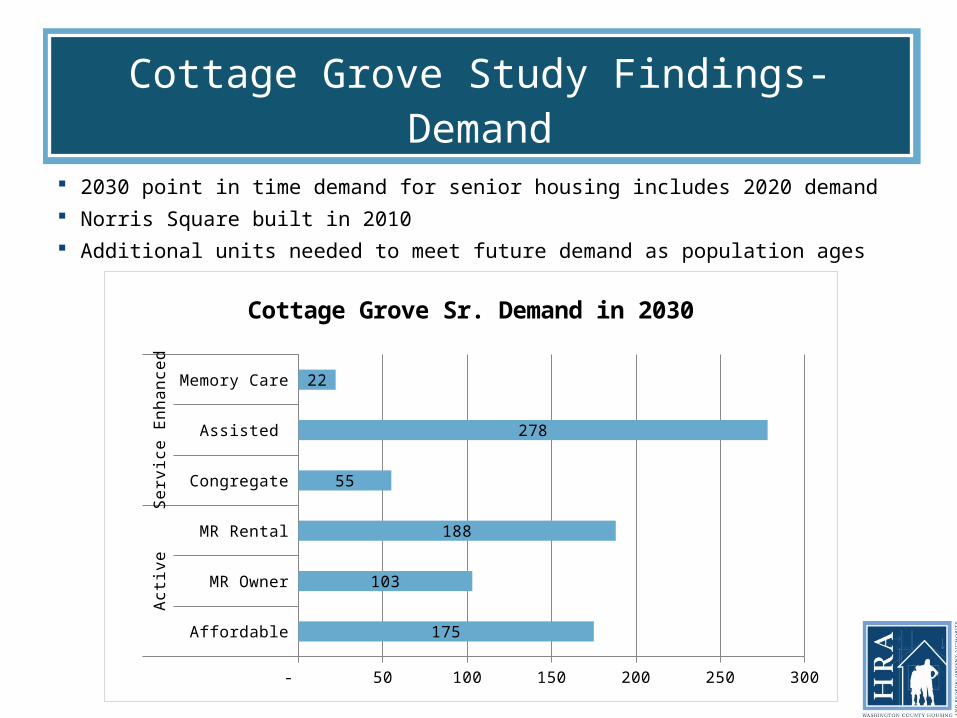
2030 point in time demand for senior housing includes 2020 demand Norris Square built in 2010 Additional units needed to meet future demand as population ages
Affordable
MR Owner
MR Rental
Congregate
Assisted
Memory Care
Act
ive
Ser
vice
Enh
ance
d
- 50 100 150 200 250 300
175
103
188
55
278
22
Cottage Grove Sr. Demand in 2030