Embed Size (px)
Citation preview

UNITED STATES
SECURITIES AND EXCHANGE COMMISSION Washington, D.C. 20549
FORM 10-Q (Mark One)
For the quarterly period ended September 30, 2016
OR
For the transition period from to
Commission file number 001-14905
BERKSHIRE HATHAWAY INC. (Exact name of registrant as specified in its charter)
3555 Farnam Street, Omaha, Nebraska 68131 (Address of principal executive office)
(Zip Code)
(402) 346-1400 (Registrant’s telephone number, including area code)
(Former name, former address and former fiscal year, if changed since last report)
Indicate by check mark whether the registrant (1) has filed all reports required to be filed by Section 13 or 15(d) of the SecuritiesExchange Act of 1934 during the preceding 12 months and (2) has been subject to such filing requirements for the past 90days. Yes ☒ No ☐
Indicate by check mark whether the registrant has submitted electronically and posted on its corporate Web site, if any, everyInteractive Data File required to be submitted and posted pursuant to Rule 405 of Regulation S-T (§232.405 of this chapter) during the preceding 12 months (or for such shorter period that the registrant was required to submit and post such files). Yes ☒ No ☐
Indicate by check mark whether the registrant is a large accelerated filer, an accelerated filer, a non-accelerated filer or a smaller reporting company. See the definitions of “large accelerated filer,” “accelerated filer” and “smaller reporting company” in Rule 12b-2 of the Exchange Act.
Indicate by check mark whether the registrant is a shell company (as defined in Rule 12b-2 of the Act). Yes ☐ No ☒
Number of shares of common stock outstanding as of October 27, 2016:
☒ QUARTERLY REPORT PURSUANT TO SECTION 13 OR 15(d) OF THE SECURITIES EXCHANGEACT OF 1934
☐ TRANSITION REPORT PURSUANT TO SECTION 13 OR 15(d) OF THE SECURITIES EXCHANGEACT OF 1934
Delaware 47-0813844(State or other jurisdiction of
incorporation or organization) (I.R.S. Employer
Identification Number)
Large accelerated filer ☒ Accelerated filer ☐
Non-accelerated filer ☐ Smaller reporting company ☐
Class A — 784,669 Class B — 1,289,055,322

BERKSHIRE HATHAWAY INC.
1
Page No. Part I – Financial Information
Item 1. Financial Statements Consolidated Balance Sheets—September 30, 2016 and December 31, 2015 2 Consolidated Statements of Earnings—Third Quarter and First Nine Months 2016 and 2015 4 Consolidated Statements of Comprehensive Income—Third Quarter and First Nine Months 2016 and 2015 5 Consolidated Statements of Changes in Shareholders’ Equity—First Nine Months 2016 and 2015 5 Consolidated Statements of Cash Flows—First Nine Months 2016 and 2015 6 Notes to Consolidated Financial Statements 7-24
Item 2. Management’s Discussion and Analysis of Financial Condition and Results of Operations 25-43 Item 3. Quantitative and Qualitative Disclosures About Market Risk 44 Item 4. Controls and Procedures 44
Part II – Other Information
Item 1. Legal Proceedings 44 Item 1A. Risk Factors 44 Item 2. Unregistered Sales of Equity Securities and Use of Proceeds and Issuer Repurchases of Equity Securities 44 Item 3. Defaults Upon Senior Securities 44 Item 4. Mine Safety Disclosures 44 Item 5. Other Information 44 Item 6. Exhibits 45
Signature 45

Part I Financial Information Item 1. Financial Statements
BERKSHIRE HATHAWAY INC. and Subsidiaries
CONSOLIDATED BALANCE SHEETS (dollars in millions)
See accompanying Notes to Consolidated Financial Statements
2
September 30,
2016 December 31,
2015 (Unaudited) ASSETS Insurance and Other:
Cash and cash equivalents $ 68,269 $ 61,181 Investments:
Fixed maturity securities 24,613 25,988 Equity securities 100,757 110,212 Other 15,415 15,998
Investments in The Kraft Heinz Company (Fair Value: September 30, 2016 – $29,130; December 31, 2015 – $32,042) 15,711 23,424
Receivables 27,544 23,303 Inventories 15,763 11,916 Property, plant and equipment 19,326 15,540 Goodwill 53,832 37,188 Other intangible assets 35,034 9,148 Deferred charges reinsurance assumed 7,505 7,687 Other 8,685 6,697
392,454 348,282
Railroad, Utilities and Energy: Cash and cash equivalents 3,893 3,437 Property, plant and equipment 123,005 120,279 Goodwill 24,186 24,178 Regulatory assets 4,369 4,285 Other 14,219 12,833
169,672 165,012
Finance and Financial Products: Cash and cash equivalents 12,673 7,112 Investments in equity and fixed maturity securities 336 411 Other investments 2,078 5,719 Loans and finance receivables 13,213 12,772 Property, plant and equipment and assets held for lease 9,737 9,347 Goodwill 1,374 1,342 Other 2,501 2,260
41,912 38,963
$ 604,038 $ 552,257

BERKSHIRE HATHAWAY INC. and Subsidiaries
CONSOLIDATED BALANCE SHEETS (dollars in millions)
See accompanying Notes to Consolidated Financial Statements
3
September 30,
2016 December 31,
2015 (Unaudited) LIABILITIES AND SHAREHOLDERS’ EQUITY Insurance and Other:
Losses and loss adjustment expenses $ 75,469 $ 73,144 Unearned premiums 15,223 13,311 Life, annuity and health insurance benefits 15,405 14,497 Other policyholder liabilities 7,259 7,123 Accounts payable, accruals and other liabilities 22,426 17,879 Notes payable and other borrowings 27,514 14,599
163,296 140,553
Railroad, Utilities and Energy: Accounts payable, accruals and other liabilities 11,590 11,994 Regulatory liabilities 3,094 3,033 Notes payable and other borrowings 58,811 57,739
73,495 72,766
Finance and Financial Products: Accounts payable, accruals and other liabilities 1,616 1,398 Derivative contract liabilities 3,973 3,836 Notes payable and other borrowings 15,473 11,951
21,062 17,185
Income taxes, principally deferred 73,570 63,126
Total liabilities 331,423 293,630
Shareholders’ equity: Common stock 8 8 Capital in excess of par value 35,730 35,620 Accumulated other comprehensive income 29,798 33,982 Retained earnings 205,491 187,703 Treasury stock, at cost (1,763) (1,763)
Berkshire Hathaway shareholders’ equity 269,264 255,550 Noncontrolling interests 3,351 3,077
Total shareholders’ equity 272,615 258,627
$ 604,038 $ 552,257

BERKSHIRE HATHAWAY INC. and Subsidiaries
CONSOLIDATED STATEMENTS OF EARNINGS (dollars in millions except per share amounts)
See accompanying Notes to Consolidated Financial Statements
4
Third Quarter First Nine Months 2016 2015 2016 2015 (Unaudited) (Unaudited)Revenues: Insurance and Other:
Insurance premiums earned $ 11,364 $ 10,514 $ 33,287 $ 30,454 Sales and service revenues 30,536 27,436 89,357 80,169 Interest, dividend and other investment income 1,276 1,132 4,284 3,758 Investment gains/losses 735 8,339 3,221 8,571
43,911 47,421 130,149 122,952
Railroad, Utilities and Energy: Revenues 10,330 10,697 28,026 30,454
Finance and Financial Products: Sales and service revenues 1,588 1,379 4,557 3,984 Interest, dividend and other investment income 366 329 1,109 1,077 Investment gains/losses 2,415 (73) 2,422 154 Derivative gains/losses 458 (764) (332) 380
4,827 871 7,756 5,595
59,068 58,989 165,931 159,001
Costs and expenses: Insurance and Other:
Insurance losses and loss adjustment expenses 7,615 6,831 22,325 19,524 Life, annuity and health insurance benefits 1,339 1,165 3,747 4,083 Insurance underwriting expenses 2,001 1,875 5,948 5,505 Cost of sales and services 24,472 22,297 71,617 65,145 Selling, general and administrative expenses 3,959 3,721 11,747 10,177 Interest expense 259 88 674 449
39,645 35,977 116,058 104,883
Railroad, Utilities and Energy: Cost of sales and operating expenses 6,763 7,018 19,421 20,985 Interest expense 681 672 1,962 1,957
7,444 7,690 21,383 22,942
Finance and Financial Products: Cost of sales and services 886 736 2,529 2,134 Selling, general and administrative expenses 465 409 1,301 1,176 Interest expense 103 105 307 301
1,454 1,250 4,137 3,611
48,543 44,917 141,578 131,436
Earnings before income taxes 10,525 14,072 24,353 27,565 Income tax expense 3,192 4,545 6,281 8,698
Net earnings 7,333 9,527 18,072 18,867 Less: Earnings attributable to noncontrolling interests 135 99 284 262
Net earnings attributable to Berkshire Hathaway shareholders $ 7,198 $ 9,428 $ 17,788 $ 18,605
Net earnings per share attributable to Berkshire Hathaway shareholders* $ 4,379 $ 5,737 $ 10,822 $ 11,323
Average equivalent Class A Shares outstanding* 1,643,913 1,643,316 1,643,716 1,643,118 * Average shares outstanding and net earnings per share are shown on an equivalent Class A common stock basis. Equivalent
Class B shares outstanding are 1,500 times the equivalent Class A amount. Net earnings per equivalent Class B shareoutstanding are one-fifteen-hundredth (1/1,500) of the equivalent Class A amount.

BERKSHIRE HATHAWAY INC. and Subsidiaries
CONSOLIDATED STATEMENTS OF COMPREHENSIVE INCOME (dollars in millions)
CONSOLIDATED STATEMENTS OF CHANGES IN SHAREHOLDERS’ EQUITY (Unaudited)
(dollars in millions)
See accompanying Notes to Consolidated Financial Statements
5
Third Quarter First Nine Months 2016 2015 2016 2015 (Unaudited) (Unaudited)Net earnings $ 7,333 $ 9,527 $ 18,072 $ 18,867
Other comprehensive income: Net change in unrealized appreciation of investments 1,581 (8,623) (1,381) (12,185) Applicable income taxes (515) 2,957 478 4,237 Reclassification of investment appreciation in net earnings (3,088) (1,586) (4,904) (1,781) Applicable income taxes 1,080 555 1,716 623 Foreign currency translation (44) (716) (158) (1,499) Applicable income taxes 9 (11) 23 (30) Prior service cost and actuarial gains/losses of defined benefit pension plans (21) 247 34 252 Applicable income taxes 13 (85) (6) (87) Other, net 3 (4) (3) (104)
Other comprehensive income, net (982) (7,266) (4,201) (10,574)
Comprehensive income 6,351 2,261 13,871 8,293 Comprehensive income attributable to noncontrolling interests 132 47 267 217
Comprehensive income attributable to Berkshire Hathaway shareholders $ 6,219 $ 2,214 $ 13,604 $ 8,076
Berkshire Hathaway shareholders’ equity
Total
Common stock and capital in excess of par
value
Accumulatedother
comprehensiveincome
Retainedearnings
Treasurystock
Non- controlling
interests Balance at December 31, 2014 $ 35,581 $ 42,732 $ 163,620 $ (1,763) $ 2,857 $ 243,027
Net earnings — — 18,605 — 262 18,867 Other comprehensive income, net — (10,529) — — (45) (10,574) Issuance of common stock 63 — — — — 63 Transactions with noncontrolling
interests (26) — — — (36) (62)
Balance at September 30, 2015 $ 35,618 $ 32,203 $ 182,225 $ (1,763) $ 3,038 $ 251,321
Balance at December 31, 2015 $ 35,628 $ 33,982 $ 187,703 $ (1,763) $ 3,077 $ 258,627 Net earnings — — 17,788 — 284 18,072 Other comprehensive income, net — (4,184) — — (17) (4,201) Issuance of common stock 80 — — — — 80 Transactions with noncontrolling
interests 30 — — — 7 37
Balance at September 30, 2016 $ 35,738 $ 29,798 $ 205,491 $ (1,763) $ 3,351 $ 272,615

BERKSHIRE HATHAWAY INC. and Subsidiaries
CONSOLIDATED STATEMENTS OF CASH FLOWS (dollars in millions)
See accompanying Notes to Consolidated Financial Statements
6
First Nine Months 2016 2015 (Unaudited)Cash flows from operating activities:
Net earnings $ 18,072 $ 18,867 Adjustments to reconcile net earnings to operating cash flows:
Investment gains/losses (5,643) (8,725) Depreciation and amortization 6,605 5,801 Other 27 620
Changes in operating assets and liabilities: Losses and loss adjustment expenses 2,615 1,195 Deferred charges reinsurance assumed 182 369 Unearned premiums 1,906 2,311 Receivables and originated loans (3,445) (3,021) Derivative contract assets and liabilities 137 (296) Income taxes 3,601 5,954 Other 1,114 1,080
Net cash flows from operating activities 25,171 24,155
Cash flows from investing activities: Purchases of fixed maturity securities (6,009) (5,365) Purchases of equity securities (5,185) (8,809) Purchase of Kraft Heinz Company common stock — (5,258) Sales of fixed maturity securities 1,121 791 Redemptions and maturities of fixed maturity securities 6,640 4,421 Sales and redemptions of equity securities 19,989 5,755 Purchases of loans and finance receivables (224) (144) Collections of loans and finance receivables 271 345 Acquisitions of businesses, net of cash acquired (30,815) (4,802) Purchases of property, plant and equipment (9,429) (11,803) Other (611) 21
Net cash flows from investing activities (24,252) (24,848)
Cash flows from financing activities: Proceeds from borrowings of insurance and other businesses 9,385 3,271 Proceeds from borrowings of railroad, utilities and energy businesses 2,234 4,468 Proceeds from borrowings of finance businesses 4,740 998 Repayments of borrowings of insurance and other businesses (1,921) (1,875) Repayments of borrowings of railroad, utilities and energy businesses (1,879) (1,050) Repayments of borrowings of finance businesses (1,220) (1,254) Changes in short term borrowings, net 888 (508) Acquisitions of noncontrolling interests (3) (71) Other (28) (181)
Net cash flows from financing activities 12,196 3,798
Effects of foreign currency exchange rate changes (10) (114)
Increase in cash and cash equivalents 13,105 2,991 Cash and cash equivalents at beginning of year 71,730 63,269
Cash and cash equivalents at end of third quarter * $ 84,835 $ 66,260
* Cash and cash equivalents are comprised of the following: Beginning of year—
Insurance and Other $ 61,181 $ 57,974 Railroad, Utilities and Energy 3,437 3,001 Finance and Financial Products 7,112 2,294
$ 71,730 $ 63,269
End of third quarter— Insurance and Other $ 68,269 $ 56,166 Railroad, Utilities and Energy 3,893 4,691 Finance and Financial Products 12,673 5,403
$ 84,835 $ 66,260

BERKSHIRE HATHAWAY INC. and Subsidiaries
NOTES TO CONSOLIDATED FINANCIAL STATEMENTS September 30, 2016
Note 1. General
The accompanying unaudited Consolidated Financial Statements include the accounts of Berkshire Hathaway Inc.(“Berkshire” or “Company”) consolidated with the accounts of all its subsidiaries and affiliates in which Berkshire holds controllingfinancial interests as of the financial statement date. In these notes the terms “us,” “we” or “our” refer to Berkshire and its consolidated subsidiaries. Reference is made to Berkshire’s most recently issued Annual Report on Form 10-K (“Annual Report”) which includes information necessary or useful to understanding Berkshire’s businesses and financial statement presentations. Our significant accounting policies and practices were presented as Note 1 to the Consolidated Financial Statements included in theAnnual Report.
Financial information in this Quarterly Report reflects any adjustments (consisting only of normal recurring adjustments) thatare, in the opinion of management, necessary to a fair statement of results for the interim periods in accordance with accountingprinciples generally accepted in the United States (“GAAP”). For a number of reasons, our results for interim periods are notnormally indicative of results to be expected for the year. The timing and magnitude of catastrophe losses incurred by insurancesubsidiaries and the estimation error inherent to the process of determining liabilities for unpaid losses of insurance subsidiaries canbe more significant to results of interim periods than to results for a full year. Variations in the amount and timing of investmentgains/losses can cause significant variations in periodic net earnings. Investment gains/losses are recorded when investments aredisposed or are other-than-temporarily impaired. In addition, changes in the fair values of liabilities associated with derivativecontracts can cause significant variations in periodic net earnings.
Note 2. New accounting pronouncements
In May 2014, the FASB issued ASU 2014-09 “Revenue from Contracts with Customers.” ASU 2014-09 applies to contracts with customers, excluding, most notably, insurance and leasing contracts. ASU 2014-09 prescribes a framework in accounting for revenues from contracts within its scope, including (a) identifying the contract, (b) identifying the performance obligations under thecontract, (c) determining the transaction price, (d) allocating the transaction price to the identified performance obligations and(e) recognizing revenues as the identified performance obligations are satisfied. ASU 2014-09 also prescribes additional financial statement presentations and disclosures. We currently expect to adopt ASU 2014-09 as of January 1, 2018, under the modified retrospective method where the cumulative effect is recognized at the date of initial application. Our evaluation of ASU 2014-09 is ongoing and not complete. The FASB has issued and may issue in the future, interpretative guidance, which may cause our evaluationto change. While we anticipate some changes to revenue recognition for certain customer contracts, we do not currently believe ASU2014-09 will have a material effect on our Consolidated Financial Statements.
In May 2015, the FASB issued ASU 2015-09 “Financial Services—Insurance—Disclosures about Short-Duration Contracts,”which requires additional disclosures in annual and interim reporting periods by insurance entities regarding liabilities for unpaidclaims and claim adjustment expenses, and changes in assumptions or methodologies for calculating such liabilities. ASU 2015-09 is effective for annual periods beginning after December 15, 2015 and interim periods beginning after December 15, 2016. We continueto evaluate the effect adopting this standard will have on the disclosures in our Consolidated Financial Statements.
In January 2016, the FASB issued ASU 2016-01 “Financial Instruments—Recognition and Measurement of Financial Assets and Financial Liabilities.” ASU 2016-01 generally requires that equity investments (excluding equity method investments) bemeasured at fair value with changes in fair value recognized in net income. Under existing GAAP, changes in fair value of available-for-sale equity investments are recorded in other comprehensive income. Given the current magnitude of our equity investments, theadoption of ASU 2016-01 will likely have a significant impact on the periodic net earnings reported in our Consolidated Statement ofEarnings, although it will likely not significantly impact our comprehensive income or shareholders’ equity. ASU 2016-01 is effective for annual and interim periods beginning after December 15, 2017, with the cumulative effect of the adoption made to thebalance sheet as of the date of adoption. Thus, the adoption will result in a reclassification of the related accumulated unrealizedappreciation currently included in accumulated other comprehensive income to retained earnings, with no impact on Berkshireshareholders’ equity.
In February 2016, the FASB issued ASU 2016-02 “Leases.” ASU 2016-02 requires a lessee to recognize in the statement of financial position a liability to make lease payments and a right-of-use asset representing its right to use the underlying asset for thelease term, along with additional qualitative and quantitative disclosures. ASU 2016-02 is effective for annual and interim periods beginning after December 15, 2018, with early adoption permitted. We are currently evaluating the effect this standard will have onour Consolidated Financial Statements.
7

Notes to Consolidated Financial Statements (Continued) Note 2. New accounting pronouncements (Continued)
In June 2016, the FASB issued ASU 2016-13 “Financial Instruments—Credit Losses,” which provides for the recognition and measurement at the reporting date of all expected credit losses for financial assets held at amortized cost and available-for-sale debt securities. Currently credit losses are recognized and measured when such losses become probable based on the prevailing factsand circumstances. ASU 2016-13 is effective for reporting periods beginning after December 15, 2019. We are currently evaluatingthe effect this standard will have on our Consolidated Financial Statements.
Note 3. Significant business acquisitions
Our long-held acquisition strategy is to acquire businesses at sensible prices that have consistent earning power, good returnson equity and able and honest management. On August 8, 2015, Berkshire entered into a definitive agreement with PrecisionCastparts Corp. (“PCC”) to acquire all outstanding PCC shares of common stock for $235 per share in cash. The acquisition wascompleted on January 29, 2016. The aggregate consideration paid was approximately $32.7 billion, which included the value of PCCshares we already owned. We funded the acquisition with a combination of existing cash balances and proceeds from a short-term credit facility.
PCC is a worldwide, diversified manufacturer of complex metal components and products. It serves the aerospace, power andgeneral industrial markets. PCC is a market leader in manufacturing complex structural investment castings and forged componentsfor aerospace markets, machined airframe components and highly engineered critical fasteners for aerospace applications, and inmanufacturing airfoil castings for the aerospace and industrial gas turbine markets. PCC also is a leading producer of titanium andnickel superalloy melted and mill products for the aerospace, chemical processing, oil and gas and pollution control industries, andmanufactures extruded seamless pipe, fittings and forgings for power generation and oil and gas applications.
In November 2014, Berkshire entered into a definitive agreement with The Procter & Gamble Company (“P&G”) to acquire the Duracell business from P&G. The transaction closed on February 29, 2016. Duracell is a leading manufacturer of high-performance alkaline batteries and is an innovator in renewable power and wireless charging technologies. Pursuant to the agreement,we received a recapitalized Duracell Company in exchange for shares of P&G common stock held by Berkshire subsidiaries whichhad a fair value of approximately $4.2 billion.
Financial results attributable to these business acquisitions are included in our Consolidated Financial Statements beginningon their respective acquisition dates. The acquisition date fair values of certain assets and liabilities, particularly property, plant andequipment and intangible assets, and related estimated useful lives are provisional and are subject to revision as the related valuationsare completed. We expect such values will be finalized as of December 31, 2016. Goodwill from these acquisitions is not amortizablefor income tax purposes. Preliminary fair values of identified assets acquired and liabilities assumed and residual goodwill of PCCand Duracell at their respective acquisition dates are summarized in the table that follows (in millions).
8
PCC DuracellCash and cash equivalents $ 250 $ 1,807 Inventories 3,430 326 Property, plant and equipment 2,772 364 Goodwill 15,880 614 Other intangible assets 24,197 2,024 Other assets 1,914 256
Assets acquired $ 48,443 $ 5,391
Accounts payable, accruals and other liabilities $ 2,442 $ 392 Notes payable and other borrowings 5,251 — Income taxes, principally deferred 8,092 760
Liabilities assumed $ 15,785 $ 1,152
Net assets $ 32,658 $ 4,239

Notes to Consolidated Financial Statements (Continued) Note 3. Significant business acquisitions (Continued)
The following table sets forth certain unaudited pro forma consolidated earnings data for the first nine months of 2015 as ifthe acquisitions discussed previously were consummated on the same terms at the beginning of the year preceding their respectiveacquisition dates (in millions, except per share amount). Pro forma data for the first nine months of 2016 was not materially differentfrom the amounts reflected in the accompanying Consolidated Financial Statements.
Note 4. Investments in fixed maturity securities
Investments in securities with fixed maturities as of September 30, 2016 and December 31, 2015 are summarized below(in millions).
Investments in fixed maturity securities are reflected in our Consolidated Balance Sheets as follows (in millions).
Investments in foreign government securities include securities issued by national and provincial government entities as wellas instruments that are unconditionally guaranteed by such entities. As of September 30, 2016, approximately 92% of foreigngovernment holdings were rated AA or higher by at least one of the major rating agencies. Approximately 80% of foreigngovernment holdings were issued or guaranteed by the United Kingdom, Germany, Australia or Canada.
9
First Nine Months 2015 Revenues $ 167,315Net earnings attributable to Berkshire Hathaway shareholders 19,086Net earnings per equivalent Class A common share attributable to Berkshire Hathaway shareholders 11,615
Amortized
Cost Unrealized
Gains Unrealized
Losses Fair
ValueSeptember 30, 2016
U.S. Treasury, U.S. government corporations and agencies $ 4,549 $ 17 $ (1) $ 4,565 States, municipalities and political subdivisions 1,216 64 (1) 1,279 Foreign governments 9,454 362 (21) 9,795 Corporate bonds 6,996 800 (7) 7,789 Mortgage-backed securities 1,068 156 (5) 1,219
$ 23,283 $ 1,399 $ (35) $ 24,647
December 31, 2015 U.S. Treasury, U.S. government corporations and agencies $ 3,425 $ 10 $ (8) $ 3,427 States, municipalities and political subdivisions 1,695 71 (2) 1,764 Foreign governments 11,327 226 (85) 11,468 Corporate bonds 7,323 632 (29) 7,926 Mortgage-backed securities 1,279 168 (5) 1,442
$ 25,049 $ 1,107 $ (129) $ 26,027
September 30,
2016 December 31,
2015Insurance and other $ 24,613 $ 25,988 Finance and financial products 34 39
$ 24,647 $ 26,027

Notes to Consolidated Financial Statements (Continued) Note 4. Investments in fixed maturity securities (Continued)
The amortized cost and estimated fair value of securities with fixed maturities at September 30, 2016 are summarized belowby contractual maturity dates. Actual maturities may differ from contractual maturities due to early call or prepayment rights held byissuers (in millions).
Note 5. Investments in equity securities
Investments in equity securities as of September 30, 2016 and December 31, 2015 are summarized based on the primaryindustry of the investee in the table below (in millions).
As of September 30, 2016 and December 31, 2015, we concluded that the unrealized losses shown in the tables above weretemporary. Our conclusions were based on: (a) our ability and intent to hold the securities to recovery; (b) our assessment that theunderlying business and financial condition of the issuers was favorable; (c) our opinion that the relative price declines were notsignificant; and (d) our belief that market prices will increase to and exceed our cost. As of September 30, 2016 and December 31,2015, unrealized losses on equity securities in a continuous unrealized loss position for more than twelve months were $995 millionand $989 million, respectively.
Unrealized losses at September 30, 2016 included $941 million related to our investment in IBM common stock of which$855 million had been in a continuous unrealized loss position for more than twelve months. Unrealized losses represented 7% of ourcost. IBM continues to be profitable and generate significant cash flows. We currently do not intend to dispose of our IBM commonstock and we expect that the fair value of this investment will recover and ultimately exceed our cost.
10
Due in one
year or less
Due after one year through
five years
Due after five years through
ten years Due after ten years
Mortgage- backed
securities TotalAmortized cost $8,007 $10,773 $1,076 $2,359 $1,068 $23,283 Fair value 8,068 11,224 1,177 2,959 1,219 24,647
Cost Basis Unrealized
Gains Unrealized
Losses Fair
ValueSeptember 30, 2016 * Banks, insurance and finance $ 19,852 $ 21,695 $ (173) $ 41,374 Consumer products 5,149 16,790 — 21,939 Commercial, industrial and other 32,517 7,904 (1,199) 39,222
$ 57,518 $ 46,389 $ (1,372) $ 102,535
* Approximately 60% of the aggregate fair value was concentrated in the equity securities of four companies (American Express
Company – $9.7 billion; Wells Fargo & Company – $22.1 billion; International Business Machines Corporation (“IBM”) –$12.9 billion; and The Coca-Cola Company – $16.9 billion).
Cost Basis Unrealized
Gains Unrealized
Losses Fair
ValueDecember 31, 2015 * Banks, insurance and finance $ 20,026 $ 27,965 $ (21) $ 47,970 Consumer products 6,867 18,022 (1) 24,888 Commercial, industrial and other 35,417 6,785 (3,238) 38,964
$ 62,310 $ 52,772 $ (3,260) $ 111,822
* Approximately 59% of the aggregate fair value was concentrated in the equity securities of four companies (American Express
Company – $10.5 billion; Wells Fargo & Company – $27.2 billion; IBM – $11.2 billion; and The Coca-Cola Company – $17.2 billion).

Notes to Consolidated Financial Statements (Continued) Note 5. Investments in equity securities (Continued)
Investments in equity securities are reflected in our Consolidated Balance Sheets as follows (in millions).
Note 6. Other investments
Other investments include preferred stock of Wm. Wrigley Jr. Company (“Wrigley”), The Dow Chemical Company (“Dow”) and Bank of America Corporation (“BAC”) warrants to purchase common stock of BAC and preferred and common stock ofRestaurant Brands International, Inc. (“RBI”). Other investments are classified as available-for-sale and are shown in our Consolidated Balance Sheets as follows (in millions).
During 2008, we purchased $2.1 billion of Wrigley preferred stock that was acquired pursuant to a shareholder agreement inconjunction with Mars Incorporated’s acquisition of Wrigley. Pursuant to certain put and call provisions in the shareholderagreement, up to 50% of our original investment was redeemable over a 90-day period that was scheduled to begin on October 6, 2016. On August 8, 2016, we entered into a stock purchase agreement with Mars, under which Mars agreed to acquire all of theWrigley preferred stock for approximately $4.56 billion, which included a prorated dividend that would have otherwise been payableon October 6, 2016. The transaction was completed on September 27, 2016.
We own 3,000,000 shares of Series A Cumulative Convertible Perpetual Preferred Stock of Dow (“Dow Preferred”) with a liquidation value of $1,000 per share. Each share of the Dow Preferred is convertible into 24.201 shares of Dow common stock(equivalent to a conversion price of $41.32 per share). Dow currently has the option to cause some or all of the Dow Preferred to beconverted into Dow common stock at the then applicable conversion rate, if the New York Stock Exchange closing price of itscommon stock exceeds $53.72 per share for any 20 trading days within a period of 30 consecutive trading days ending the day beforeDow exercises its option. The Dow Preferred is entitled to dividends at a rate of 8.5% per annum.
We own 50,000 shares of 6% Non-Cumulative Perpetual Preferred Stock of BAC (“BAC Preferred”) with a liquidation value of $100,000 per share and warrants to purchase 700,000,000 shares of common stock of BAC (“BAC Warrants”). The BAC Preferred is redeemable at the option of BAC beginning on May 7, 2019 at a redemption price of $105,000 per share (or $5.25 billion inaggregate). The BAC Warrants expire in 2021 and are exercisable for an additional aggregate cost of $5 billion ($7.142857/share).
We own Class A 9% Cumulative Compounding Perpetual Preferred Shares of RBI (“RBI Preferred”) having a stated value of $3 billion. RBI, domiciled in Canada, is the ultimate parent company of Burger King and Tim Hortons. The RBI Preferred is entitledto dividends on a cumulative basis of 9% per annum plus an additional amount, if necessary, to produce an after-tax yield to Berkshire as if the dividends were paid by a U.S.-based company. The RBI Preferred is redeemable at the option of RBI beginning onDecember 12, 2017. If not redeemed prior to December 12, 2024, we can cause RBI to redeem the RBI Preferred. In either case, theredemption price will be 109.9% of the stated value of such shares.
11
September 30,
2016 December 31,
2015Insurance and other $ 100,757 $ 110,212 Railroad, utilities and energy * 1,476 1,238 Finance and financial products 302 372
$ 102,535 $ 111,822
* Included in other assets.
Cost Fair Value
September 30,
2016 December 31,
2015 September 30,
2016 December 31,
2015Insurance and other $ 9,970 $ 9,970 $ 15,415 $ 15,998 Finance and financial products 1,000 3,052 2,078 5,719
$ 10,970 $ 13,022 $ 17,493 $ 21,717

Notes to Consolidated Financial Statements (Continued) Note 7. Investments in The Kraft Heinz Company
On June 7, 2013, Berkshire and an affiliate of the global investment firm 3G Capital (such affiliate, “3G”), each made equity investments in H.J. Heinz Holding Corporation (“Heinz Holding”), which, together with debt financing obtained by Heinz Holding,was used to acquire H. J. Heinz Company (“Heinz”). Berkshire’s initial investments consisted of 425 million shares of Heinz Holdingcommon stock, warrants, which were exercised in June 2015, to acquire approximately 46 million additional shares of common stockat one cent per share, and cumulative compounding preferred stock (“Preferred Stock”) with a liquidation preference of $8 billion. The aggregate cost of our investments was $12.25 billion. 3G also acquired 425 million shares of Heinz Holding common stock for$4.25 billion. On June 7, 2016, our Preferred Stock investment was redeemed for cash of $8.32 billion. Prior to its redemption, thePreferred Stock was entitled to dividends at 9% per annum.
On July 1, 2015, Berkshire acquired 262.9 million shares of newly issued common stock of Heinz Holding for $5.26 billionand 3G acquired 237.1 million shares of newly issued common stock for $4.74 billion. Immediately thereafter, Heinz Holdingexecuted a reverse stock split at a rate of 0.443332 of a share for each share.
On July 2, 2015, Heinz Holding acquired Kraft Foods Group, Inc. (“Kraft”). Upon completion of the acquisition, Heinz Holding was renamed The Kraft Heinz Company (“Kraft Heinz”). Kraft Heinz is one of the largest manufacturers and marketers offood and beverage products, including condiments and sauces, cheese and dairy, meals, meats, refreshment beverages, coffee, andother grocery products, in the world. Kraft Heinz’s leading iconic brands include Kraft, Heinz, ABC, Capri Sun, Classico, Jell-O, Kool-Aid, Lunchables, Maxwell House, Ore-Ida, Oscar Mayer, Philadelphia, Planters, Plasmon, Quero, Weight Watchers SmartOnes and Velveeta.
In connection with Heinz Holding’s acquisition of Kraft, Kraft shareholders received one share of newly issued HeinzHolding common stock for each share of Kraft common stock and a special cash dividend of $16.50 per share. Following the issuanceof these additional shares, Berkshire and 3G together owned approximately 51% of the outstanding Kraft Heinz common stock, withBerkshire owning approximately 26.8% and 3G owning 24.2%. We account for our investment in Kraft Heinz common stock on theequity method. Under the equity method, the issuance of shares by an investee is accounted for by the investor as if the investor hadsold a proportionate share of its investment. As a result, we recorded a non-cash pre-tax holding gain of approximately $6.8 billion in the third quarter of 2015, representing the excess of the fair value of Kraft Heinz common stock at the date of the merger over ourcarrying value associated with the reduction in our ownership.
A summary of our investments in Kraft Heinz follows (in millions).
Our equity method earnings on the common stock and dividends earned on the Preferred Stock in the first nine months of2016 and 2015 were $851 million and $329 million, respectively, and are included in interest, dividend and other investment incomein our Consolidated Statements of Earnings. Preferred Stock dividends received in the first nine months of 2016 were $180 million. In2015, Preferred Stock dividends received were $180 million in the third quarter and $540 million in the first nine months.
Summarized consolidated financial information of Kraft Heinz follows (in millions).
12
Carrying Value
September 30,
2016 December 31,
2015Common stock $15,711 $15,714 Preferred Stock — 7,710
$15,711 $23,424
October 2, 2016 January 3, 2016 Assets $121,080 $122,973 Liabilities 63,212 56,737
Third Quarter First Nine Months 2016 2015 2016 2015Sales $ 6,267 $ 6,120 $ 19,630 $ 11,214
Net earnings (loss) attributable to common shareholders $ 842 $ (303) $ 2,508 $ (551)

Notes to Consolidated Financial Statements (Continued) Note 8. Income taxes
Our consolidated effective income tax rates for the third quarter and first nine months of 2016 were 30.3% and 25.8%,respectively. In 2015, our effective income tax rates were 32.3% for the third quarter and 31.6% for the first nine months. Our effectiveincome tax rate normally reflects benefits from the recurring impact of (a) dividends received deductions applicable to certain investmentsin equity securities, (b) income production tax credits from wind-powered electricity generation placed in service in the U.S. and (c)lower income tax rates applicable to earnings of certain foreign subsidiaries.
As discussed in Notes 3 and 9 to these Consolidated Financial Statements, on February 29, 2016, we exchanged our long-heldinvestment in P&G common stock for the common stock of Duracell. This exchange produced a pre-tax gain of $1.1 billion for financialreporting purposes. The exchange transaction was structured as a tax-free reorganization under the Internal Revenue Code. As a result, noincome taxes are currently payable on the excess of the fair value of the business received over the tax basis of the P&G shares exchangedand we recorded a one-time reduction of certain deferred income tax liabilities (approximately $750 million) that were recorded in 2005in connection with our exchange of The Gillette Company common stock for P&G common stock upon the merger of those twocompanies. The P&G/Duracell exchange produced a 4.7 percentage point reduction in our consolidated effective income tax rate for thefirst nine months of 2016.
Note 9. Investment gains/losses
Investment gains/losses are summarized below (in millions).
Gains from sales and redemptions of equity securities in 2016 included gains of approximately $2.4 billion from the dispositionof our investment in Wrigley preferred stock in the third quarter, and in the first nine months also included $610 million from theredemption of our investment in Kraft Heinz Preferred Stock and a non-cash holding gain of approximately $1.1 billion from theexchange of our P&G common stock in connection with the acquisition of Duracell. The non-cash gain from the P&G/Duracell exchangerepresented the excess of the fair value of net assets of Duracell over the cost basis of the P&G stock exchanged. Gains from sales andredemptions of equity securities in the third quarter and first nine months of 2015 included a non-cash holding gain of approximately $6.8billion in connection with our investment in Kraft Heinz common stock.
We record investments in equity and fixed maturity securities classified as available-for-sale at fair value and record thedifference between fair value and cost in other comprehensive income. Other-than-temporary impairment losses recognized in earningsrepresent reductions in the cost basis of the investment, but not the fair value. Accordingly, such losses that are included in earnings aregenerally offset by a credit to other comprehensive income, producing no net effect on shareholders’ equity as of the balance sheet date.
Note 10. Inventories
Inventories are comprised of the following (in millions).
Inventories at September 30, 2016 included approximately $3.6 billion related to PCC and Duracell.
13
Third Quarter First Nine Months 2016 2015 2016 2015 Fixed maturity securities—
Gross gains from sales and redemptions $ 5 $ 6 $ 44 $ 88 Gross losses from sales and redemptions (24) (44) (41) (128)
Equity securities— Gross gains from sales and redemptions 3,173 8,407 5,720 8,855 Gross losses from sales and redemptions (13) (75) (76) (95)
Other-than-temporary impairment losses — (26) (63) (26) Other 9 (2) 59 31
$ 3,150 $ 8,266 $ 5,643 $ 8,725
September 30,
2016 December 31,
2015Raw materials $ 2,909 $ 1,852 Work in process and other 2,461 778 Finished manufactured goods 4,287 3,369 Goods acquired for resale 6,106 5,917
$ 15,763 $ 11,916
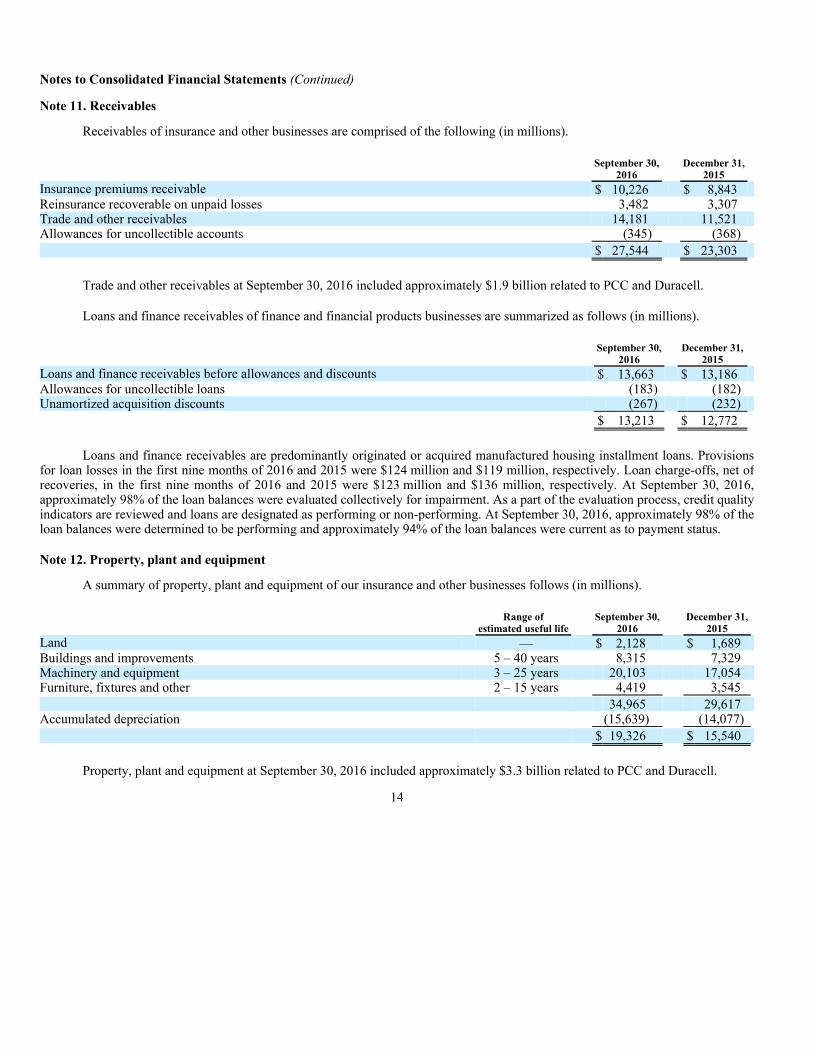
Notes to Consolidated Financial Statements (Continued) Note 11. Receivables
Receivables of insurance and other businesses are comprised of the following (in millions).
Trade and other receivables at September 30, 2016 included approximately $1.9 billion related to PCC and Duracell.
Loans and finance receivables of finance and financial products businesses are summarized as follows (in millions).
Loans and finance receivables are predominantly originated or acquired manufactured housing installment loans. Provisionsfor loan losses in the first nine months of 2016 and 2015 were $124 million and $119 million, respectively. Loan charge-offs, net of recoveries, in the first nine months of 2016 and 2015 were $123 million and $136 million, respectively. At September 30, 2016,approximately 98% of the loan balances were evaluated collectively for impairment. As a part of the evaluation process, credit qualityindicators are reviewed and loans are designated as performing or non-performing. At September 30, 2016, approximately 98% of theloan balances were determined to be performing and approximately 94% of the loan balances were current as to payment status.
Note 12. Property, plant and equipment
A summary of property, plant and equipment of our insurance and other businesses follows (in millions).
Property, plant and equipment at September 30, 2016 included approximately $3.3 billion related to PCC and Duracell.
14
September 30,
2016 December 31,
2015Insurance premiums receivable $ 10,226 $ 8,843 Reinsurance recoverable on unpaid losses 3,482 3,307 Trade and other receivables 14,181 11,521 Allowances for uncollectible accounts (345) (368)
$ 27,544 $ 23,303
September 30,
2016 December 31,
2015Loans and finance receivables before allowances and discounts $ 13,663 $ 13,186 Allowances for uncollectible loans (183) (182) Unamortized acquisition discounts (267) (232)
$ 13,213 $ 12,772
Range of
estimated useful life September 30,
2016 December 31,
2015Land — $ 2,128 $ 1,689 Buildings and improvements 5 – 40 years 8,315 7,329 Machinery and equipment 3 – 25 years 20,103 17,054 Furniture, fixtures and other 2 – 15 years 4,419 3,545
34,965 29,617 Accumulated depreciation (15,639) (14,077)
$ 19,326 $ 15,540

Notes to Consolidated Financial Statements (Continued) Note 12. Property, plant and equipment (Continued)
A summary of property, plant and equipment of our railroad and our utilities and energy businesses follows (in millions). Theutility generation, transmission and distribution systems and interstate natural gas pipeline assets are owned by regulated public utilityand natural gas pipeline subsidiaries.
Assets held for lease and property, plant and equipment of our finance and financial products businesses are summarizedbelow (in millions).
A summary of depreciation expense follows (in millions).
15
Range of
estimated useful life September 30,
2016 December 31,
2015Railroad:
Land — $ 6,060 $ 6,037 Track structure and other roadway 7 – 100 years 47,586 45,967 Locomotives, freight cars and other equipment 6 – 40 years 11,860 11,320 Construction in progress — 1,064 1,031
66,570 64,355 Accumulated depreciation (5,673) (4,845)
$ 60,897 $ 59,510
Utilities and energy: Utility generation, transmission and distribution systems 5 – 80 years $ 70,316 $ 69,248 Interstate natural gas pipeline assets 3 – 80 years 6,866 6,755 Independent power plants and other assets 3 – 30 years 6,056 5,626 Construction in progress — 3,175 2,627
86,413 84,256 Accumulated depreciation (24,305) (23,487)
$ 62,108 $ 60,769
Range of
estimated useful life September 30,
2016 December 31,
2015Assets held for lease 5 – 35 years $ 11,906 $ 11,317 Land — 223 220 Buildings, machinery and other 3 – 50 years 1,289 1,207
13,418 12,744 Accumulated depreciation (3,681) (3,397)
$ 9,737 $ 9,347
First Nine Months 2016 2015Insurance and other $ 1,595 $ 1,240 Railroad, utilities and energy 3,459 3,276 Finance and financial products 466 447
$ 5,520 $ 4,963

Notes to Consolidated Financial Statements (Continued) Note 13. Goodwill and other intangible assets
A reconciliation of the change in the carrying value of goodwill is as follows (in millions).
Other intangible assets are summarized as follows (in millions).
Other intangible assets at September 30, 2016 included preliminary fair values of intangible assets of PCC and Duracell ofapproximately $26.2 billion, which included approximately $17.6 billion in customer relationships and trade names that werepreliminarily determined to have indefinite lives. Amortization expense in the first nine months of 2016 and 2015 was $1,085 millionand $837 million, respectively. Intangible assets with indefinite lives, excluding intangible assets related to business acquisitionscompleted in 2016, were approximately $3.0 billion as of September 30, 2016 and December 31, 2015.
Note 14. Derivative contracts
Derivative contracts have been entered into primarily through our finance and financial products and our utilities and energybusinesses. During 2016, derivative contracts of our finance and financial products businesses consisted of equity index put optioncontracts and a credit default contract. A summary of the liabilities and related notional values of these contracts follows (in millions).
16
September 30,
2016 December 31,
2015Balance at beginning of year $ 62,708 $ 60,714 Acquisitions of businesses 17,016 2,563 Other, including foreign currency translation (332) (569)
Balance at end of period $ 79,392 $ 62,708
September 30, 2016 December 31, 2015
Gross carrying
amount
Accumulatedamortization
Gross carrying amount
Accumulatedamortization
Insurance and other $ 41,575 $6,541 $14,610 $5,462Railroad, utilities and energy 897 279 888 239
$ 42,472 $6,820 $15,498 $5,701
Trademarks and trade names $ 6,049 $ 821 $ 3,041 $ 765Patents and technology 4,455 2,329 4,252 2,050Customer relationships 28,851 2,721 5,474 2,131Other 3,117 949 2,731 755
$ 42,472 $6,820 $15,498 $5,701
September 30, 2016 December 31, 2015
Liabilities
Notional Value Liabilities
Notional Value
Equity index put options $ 3,973 $ 27,982(1) $ 3,552 $ 27,722(1)
Credit default (2) — — 284 7,792
$ 3,973 $ 3,836
(1) Represents the aggregate undiscounted amounts payable assuming that the value of each index is zero at each contract’s
expiration date. Certain of these contracts are denominated in foreign currencies. Notional amounts are based on the foreigncurrency exchange rates as of each balance sheet date.
(2) In July 2016, our remaining credit default contract was terminated by mutual agreement with the counterparty. We no longerhave any exposure to losses under credit default contracts.

Notes to Consolidated Financial Statements (Continued) Note 14. Derivative contracts (Continued)
The derivative contracts of our finance and financial products businesses are recorded at fair value and the changes in the fairvalues of such contracts are reported in earnings as derivative gains/losses. We entered into these contracts with the expectation thatthe premiums received would exceed the amounts ultimately paid to counterparties. A summary of the derivative gains (losses)included in our Consolidated Statements of Earnings follows (in millions).
The equity index put option contracts are European style options written between 2004 and 2008 on four major equityindexes. These contracts will expire between June 2018 and January 2026. Future payments, if any, under any given contract will berequired if the prevailing index value is below the contract strike price at the expiration date. We received the premiums on thesecontracts at the inception dates and therefore we have no counterparty credit risk.
The aggregate intrinsic value (the undiscounted liability assuming the contracts are settled based on the index values andforeign currency exchange rates as of the balance sheet date) of our equity index put option contracts was approximately $1.6 billionat September 30, 2016 and $1.1 billion at December 31, 2015. However, these contracts may not be unilaterally terminated or fullysettled before the expiration dates. Therefore, the ultimate amount of cash basis gains or losses on these contracts will not bedetermined for several years. The remaining weighted average life of all contracts was approximately 4.2 years at September 30,2016.
A limited number of our equity index put option contracts contain collateral posting requirements with respect to changes inthe fair value or intrinsic value of the contracts and/or a downgrade of Berkshire’s credit ratings. As of September 30, 2016, we did not have any collateral posting requirements. If Berkshire’s credit ratings (currently AA from Standard & Poor’s and Aa2 from Moody’s) are downgraded below either A- by Standard & Poor’s or A3 by Moody’s, collateral of up to $1.1 billion could be required to be posted.
Our regulated utility subsidiaries are exposed to variations in the prices of fuel required to generate electricity, wholesaleelectricity purchased and sold and natural gas supplied for customers. Derivative instruments, including forward purchases and sales,futures, swaps and options, are used to manage a portion of these price risks. Derivative contract assets are included in other assetsand were $105 million as of September 30, 2016 and $103 million as of December 31, 2015. Derivative contract liabilities areincluded in accounts payable, accruals and other liabilities and were $198 million as of September 30, 2016 and $237 million as ofDecember 31, 2015. Net derivative contract assets or liabilities that are probable of recovery through rates of our regulated utilitiesare offset by regulatory liabilities or assets. Unrealized gains or losses on contracts accounted for as cash flow or fair value hedges arerecorded in other comprehensive income or in net earnings, as appropriate.
Note 15. Supplemental cash flow information
A summary of supplemental cash flow information is presented in the following table (in millions).
17
Third Quarter First Nine Months
2016 2015 2016 2015Equity index put options $ 458 $ (802) $ (421) $ 371 Credit default — 38 89 9
$ 458 $ (764) $ (332) $ 380
First Nine Months
2016 2015Cash paid during the period for:
Income taxes $ 2,237 $ 2,575 Interest:
Insurance and other businesses 499 312 Railroad, utilities and energy businesses 2,130 2,043 Finance and financial products businesses 263 274
Non-cash investing and financing activities: Liabilities assumed in connection with business acquisitions 17,319 2,792 Equity securities exchanged in connection with business acquisition 4,239 —

Notes to Consolidated Financial Statements (Continued) Note 16. Notes payable and other borrowings
Notes payable and other borrowings are summarized below (in millions). The weighted average interest rates and maturity dateranges shown in the following tables are based on borrowings as of September 30, 2016.
On January 8, 2016, Berkshire entered into a $10 billion 364-day revolving credit agreement. In connection with the PCCacquisition, Berkshire borrowed $10 billion under the credit agreement. In March 2016, Berkshire issued €2.75 billion in seniorunsecured notes consisting of €1.0 billion of 0.50% notes due in 2020, €1.0 billion of 1.30% notes due in 2024 and €750 million of 2.15%notes due in 2028. Berkshire also issued $5.5 billion in senior unsecured notes consisting of $1.0 billion of 2.20% notes due in 2021, $2.0billion of 2.75% notes due in 2023 and $2.5 billion of 3.125% notes due in 2026. The proceeds from these debt issues were used in therepayment of all outstanding borrowings under the aforementioned credit agreement. In June 2016, the revolving credit agreement wasterminated. In August 2016, Berkshire issued $750 million in senior unsecured notes consisting of $500 million of 1.15% notes due in2018 and $250 million of floating rate notes due in 2018, to replace $750 million of maturing debt. Other subsidiary borrowings atSeptember 30, 2016 included $4.7 billion attributable to PCC.
BHE subsidiary debt represents amounts issued pursuant to separate financing agreements. Substantially all of the assets ofcertain BHE subsidiaries are, or may be, pledged or encumbered to support or otherwise secure debt. These borrowing arrangementsgenerally contain various covenants including, but not limited to, leverage ratios, interest coverage ratios and debt service coverage ratios.BNSF’s borrowings are primarily senior unsecured debentures. In May 2016, BNSF issued $750 million of 3.9% debentures due in 2046.As of September 30, 2016, BNSF and BHE and their subsidiaries were in compliance with all applicable debt covenants. Berkshire doesnot guarantee any debt, borrowings or lines of credit of BNSF, BHE or their subsidiaries.
In March 2016, BHFC issued $3.5 billion of senior notes consisting of $750 million of 1.45% notes due in 2018, $1.0 billion offloating rate notes due in 2018, $1.25 billion of 1.70% notes due in 2019 and $500 million of floating rate notes due in 2019. In August2016, BHFC issued $1.25 billion of senior notes consisting of $1 billion of 1.30% notes due in 2019 and $250 million of floating ratenotes due in 2019, primarily to replace $1 billion of maturing debt. The borrowings of BHFC, a wholly owned finance subsidiary ofBerkshire, are fully and unconditionally guaranteed by Berkshire.
As of September 30, 2016, our subsidiaries also had unused lines of credit and commercial paper capacity aggregatingapproximately $8.2 billion to support short-term borrowing programs and provide additional liquidity. Such unused lines of creditincluded about $4.0 billion related to BHE and its subsidiaries. In addition to BHFC’s borrowings, Berkshire guarantees certain othersubsidiary borrowings, which aggregated approximately $3.2 billion at September 30, 2016. Generally, Berkshire’s guarantee of asubsidiary’s debt obligation is an absolute, unconditional and irrevocable guarantee for the full and prompt payment when due of allpresent and future payment obligations.
18
Weighted Average
Interest Rate September 30,
2016 December 31,
2015Insurance and other:
Berkshire Hathaway Inc. (“Berkshire”) due 2016-2047 2.2% $ 18,108 $ 9,799 Short-term subsidiary borrowings 2.2% 2,019 1,989 Other subsidiary borrowings due 2016-2044 4.0% 7,387 2,811
$ 27,514 $ 14,599
Weighted Average
Interest Rate September 30,
2016 December 31,
2015Railroad, utilities and energy:
Berkshire Hathaway Energy Company (“BHE”) and its subsidiaries: BHE senior unsecured debt due 2017-2045 5.1% $ 7,817 $ 7,814 Subsidiary and other debt due 2016-2064 4.7% 28,828 28,188
Burlington Northern Santa Fe (“BNSF”) due 2016-2097 4.8% 22,166 21,737
$ 58,811 $ 57,739
Weighted Average
Interest Rate September 30,
2016 December 31,
2015Finance and financial products:
Berkshire Hathaway Finance Corporation (“BHFC”) due 2017-2043 2.5% $ 14,421 $ 10,679 Other subsidiary borrowings due 2016-2036 5.0% 1,052 1,272
$ 15,473 $ 11,951

Notes to Consolidated Financial Statements (Continued) Note 17. Fair value measurements
Our financial assets and liabilities are summarized below as of September 30, 2016 and December 31, 2015 with fair valuesshown according to the fair value hierarchy (in millions). The carrying values of cash and cash equivalents, receivables and accountspayable, accruals and other liabilities are considered to be reasonable estimates of their fair values.
19
Carrying
Value Fair Value
Quoted Prices
(Level 1)
Significant Other Observable Inputs
(Level 2)
Significant Unobservable Inputs
(Level 3)September 30, 2016 Investments in fixed maturity securities:
U.S. Treasury, U.S. government corporations and agencies $ 4,565 $ 4,565 $ 3,318 $ 1,247 $ —
States, municipalities and political subdivisions 1,279 1,279 — 1,279 — Foreign governments 9,795 9,795 7,704 2,091 — Corporate bonds 7,789 7,789 — 7,682 107 Mortgage-backed securities 1,219 1,219 — 1,219 —
Investments in equity securities 102,535 102,535 102,534 — 1 Investment in Kraft Heinz common stock 15,711 29,130 29,130 — — Other investments 17,493 17,493 376 — 17,117 Loans and finance receivables 13,213 13,650 — 14 13,636 Derivative contract assets (1) 105 105 1 5 99 Derivative contract liabilities:
Railroad, utilities and energy (1) 198 198 5 161 32 Finance and financial products:
Equity index put options 3,973 3,973 — — 3,973 Notes payable and other borrowings:
Insurance and other 27,514 29,119 — 29,119 — Railroad, utilities and energy 58,811 69,130 — 69,130 — Finance and financial products 15,473 16,251 — 15,862 389
December 31, 2015 Investments in fixed maturity securities:
U.S. Treasury, U.S. government corporations and agencies $ 3,427 $ 3,427 $ 2,485 $ 942 $ —
States, municipalities and political subdivisions 1,764 1,764 — 1,764 — Foreign governments 11,468 11,468 9,188 2,280 — Corporate bonds 7,926 7,926 — 7,826 100 Mortgage-backed securities 1,442 1,442 — 1,442 —
Investments in equity securities 111,822 111,822 111,786 35 1 Investment in Kraft Heinz common stock 15,714 23,679 23,679 — — Investment in Kraft Heinz Preferred Stock 7,710 8,363 — — 8,363 Other investments 21,717 21,717 315 — 21,402 Loans and finance receivables 12,772 13,112 — 16 13,096 Derivative contract assets (1) 103 103 — 5 98 Derivative contract liabilities:
Railroad, utilities and energy (1) 237 237 13 177 47 Finance and financial products:
Equity index put options 3,552 3,552 — — 3,552 Credit default 284 284 — — 284
Notes payable and other borrowings: Insurance and other 14,599 14,773 — 14,773 — Railroad, utilities and energy 57,739 62,471 — 62,471 — Finance and financial products 11,951 12,363 — 11,887 476
(1) Assets are included in other assets and liabilities are included in accounts payable, accruals and other liabilities.

Notes to Consolidated Financial Statements (Continued) Note 17. Fair value measurements (Continued)
The fair values of substantially all of our financial instruments were measured using market or income approaches.Considerable judgment may be required in interpreting market data used to develop the estimates of fair value. Accordingly, the fairvalues presented are not necessarily indicative of the amounts that could be realized in an actual current market exchange. The use ofalternative market assumptions and/or estimation methodologies may have a material effect on the estimated fair value. The hierarchyfor measuring fair value consists of Levels 1 through 3, which are described below.
Level 1—Inputs represent unadjusted quoted prices for identical assets or liabilities exchanged in active markets.
Level 2—Inputs include directly or indirectly observable inputs (other than Level 1 inputs) such as quoted prices for similarassets or liabilities exchanged in active or inactive markets; quoted prices for identical assets or liabilities exchanged ininactive markets; other inputs that may be considered in fair value determinations of the assets or liabilities, such as interestrates and yield curves, volatilities, prepayment speeds, loss severities, credit risks and default rates; and inputs that arederived principally from or corroborated by observable market data by correlation or other means. Pricing evaluationsgenerally reflect discounted expected future cash flows, which incorporate yield curves for instruments with similarcharacteristics, such as credit ratings, estimated durations and yields for other instruments of the issuer or entities in the sameindustry sector.
Level 3—Inputs include unobservable inputs used in the measurement of assets and liabilities. Management is required to useits own assumptions regarding unobservable inputs because there is little, if any, market activity in the assets or liabilities andit may be unable to corroborate the related observable inputs. Unobservable inputs require management to make certainprojections and assumptions about the information that would be used by market participants in valuing assets or liabilities.
Reconciliations of assets and liabilities measured and carried at fair value on a recurring basis with the use of significantunobservable inputs (Level 3) for the nine months ending September 30, 2016 and 2015 follow (in millions).
Gains and losses included in earnings are included as components of investment gains/losses, derivative gains/losses or otherrevenues, as appropriate and are primarily related to changes in the fair values of derivative contracts and settlement transactions.Gains and losses included in other comprehensive income primarily represent the net change in unrealized appreciation ofinvestments. In the third quarter of 2016, our investment in Wrigley preferred stock was redeemed.
20
Investments in fixed
maturity securities
Investments in equity securities and other
investments
Net derivative
contractliabilities
Nine months ending September 30, 2016 Balance at December 31, 2015 $ 100 $21,403 $(3,785)Gains (losses) included in:
Earnings — 2,409 (221)Other comprehensive income 3 (2,233) (2)Regulatory assets and liabilities — — (12)
Acquisitions, dispositions and settlements 5 (4,461) (81)Transfers into/out of Level 3 (1) — 195
Balance at September 30, 2016 $ 107 $17,118 $(3,906)
Nine months ending September 30, 2015 Balance at December 31, 2014 $ 8 $21,996 $(4,759)Gains (losses) included in:
Earnings — — 467Other comprehensive income — (1,722) (5)Regulatory assets and liabilities — — (21)
Acquisition, dispositions and settlements 103 — (65)Transfers into/out of Level 3 — — 3
Balance at September 30, 2015 $ 111 $20,274 $(4,380)

Notes to Consolidated Financial Statements (Continued) Note 17. Fair value measurements (Continued)
Quantitative information as of September 30, 2016, with respect to assets and liabilities measured and carried at fair value ona recurring basis with the use of significant unobservable inputs (Level 3) follows (in millions).
Other investments consist of perpetual preferred stocks and common stock warrants that we acquired in private placementtransactions. These investments are subject to contractual restrictions on transferability and may contain provisions that prevent usfrom economically hedging our investments. In applying discounted estimated cash flow techniques in valuing the perpetual preferredstocks, we made assumptions regarding the expected durations of the investments, as the issuers may have the right to redeem orconvert these investments. We also made estimates regarding the impact of subordination, as the preferred stocks have a lowerpriority in liquidation than debt instruments of the issuers. In valuing the common stock warrants, we used a warrant valuation model.While most of the inputs to the model are observable, we are subject to the aforementioned contractual restrictions and we haveapplied discounts with respect to such restrictions. Increases or decreases to these inputs would result in decreases or increases to thefair values of the investments.
Our equity index put option contracts are illiquid and contain contract terms that are not standard in derivatives markets. Forexample, we are not required to post collateral under most of our contracts and many contracts have relatively long durations. Forthese and other reasons, we classified these contracts as Level 3. The methods we use to value these contracts are those that webelieve market participants would use in determining exchange prices with respect to our contracts.
We value equity index put option contracts based on the Black-Scholes option valuation model. Inputs to this model includethe index price, contract duration and dividend and interest rates (including a Berkshire non-performance input) which are observable. However, we believe that the valuation of long-duration options using any model is inherently subjective and, given the lack ofobservable transactions and prices, acceptable values may be subject to wide ranges. Volatility inputs represent our expectations,which consider the remaining duration of each contract and assume that the contracts will remain outstanding until the expirationdates without offsetting transactions occurring in the interim. Increases or decreases in the volatility inputs will produce increases ordecreases in the fair values of the liabilities.
Note 18. Common stock
Changes in Berkshire’s issued, treasury and outstanding common stock during the first nine months of 2016 are shown in thetable below.
21
Fair
Value Principal Valuation
Techniques Unobservable Inputs WeightedAverage
Other investments:
Preferred stocks $11,615 Discounted cash flow Expected duration 6 years
Discount for transferability restrictions and subordination
159 basis points
Common stock warrants
5,502 Warrant pricing model
Discount for transferability andhedging restrictions
7%
Net derivative liabilities:
Equity index put options 3,973 Option pricing model Volatility 21%
Class A, $5 Par Value
(1,650,000 shares authorized)Class B, $0.0033 Par Value
(3,225,000,000 shares authorized)
Issued Treasury Outstanding Issued Treasury OutstandingBalance at December 31, 2015 820,102 (11,680) 808,422 1,253,866,598 (1,409,762) 1,252,456,836Conversions of Class A common stock
to Class B common stock and exercises of replacement stock options issued in a business acquisition (22,628) — (22,628) 34,899,211 — 34,899,211
Balance at September 30, 2016 797,474 (11,680) 785,794 1,288,765,809 (1,409,762) 1,287,356,047

Notes to Consolidated Financial Statements (Continued) Note 18. Common stock (Continued)
Each Class A common share is entitled to one vote per share. Class B common stock possesses dividend and distributionrights equal to one-fifteen-hundredth (1/1,500) of such rights of Class A common stock. Each Class B common share possessesvoting rights equivalent to one-ten-thousandth (1/10,000) of the voting rights of a Class A share. Unless otherwise required underDelaware General Corporation Law, Class A and Class B common shares vote as a single class. Each share of Class A common stockis convertible, at the option of the holder, into 1,500 shares of Class B common stock. Class B common stock is not convertible intoClass A common stock. On an equivalent Class A common stock basis, there were 1,644,031 shares outstanding as of September 30,2016 and 1,643,393 shares outstanding as of December 31, 2015. In addition to our common stock, 1,000,000 shares of preferredstock are authorized, but none are issued.
Berkshire’s Board of Directors (“Berkshire’s Board”) has approved a common stock repurchase program under whichBerkshire may repurchase its Class A and Class B shares at prices no higher than a 20% premium over the book value of the shares.Berkshire may repurchase shares in the open market or through privately negotiated transactions. Berkshire’s Board authorization does not specify a maximum number of shares to be repurchased. However, repurchases will not be made if they would reduceBerkshire’s consolidated cash and cash equivalent holdings below $20 billion. The repurchase program does not obligate Berkshire torepurchase any dollar amount or number of Class A or Class B shares and there is no expiration date to the program.
Note 19. Accumulated other comprehensive income
A summary of the net changes in after-tax accumulated other comprehensive income attributable to Berkshire Hathawayshareholders and significant amounts reclassified out of accumulated other comprehensive income for the nine months endingSeptember 30, 2016 and 2015 follows (in millions).
22
Unrealized appreciation of
investments
Foreigncurrency
translation
Prior service and actuarial gains/losses of defined benefit pension plans Other
AccumulatedOther
Comprehensive income
Nine months ending September 30, 2016 Balance at December 31, 2015 $38,598 $(3,856) $(762) $ 2 $ 33,982Other comprehensive income, net before reclassifications (912) (101) (39) (26) (1,078)Reclassifications from accumulated other comprehensive
income (3,188) — 59 23 (3,106)
Balance at September 30, 2016 $34,498 $(3,957) $(742) $ (1) $ 29,798
Reclassifications from other comprehensive income into net earnings: Investment gains/losses $(4,904) $ — $ — $ — $ (4,904)Other — — 79 41 120
Reclassifications before income taxes (4,904) — 79 41 (4,784)Applicable income taxes (1,716) — 20 18 (1,678)
$(3,188) $ — $ 59 $ 23 $ (3,106)

Notes to Consolidated Financial Statements (Continued) Note 19. Accumulated other comprehensive income (Continued)
Note 20. Contingencies and Commitments
We are parties in a variety of legal actions that routinely arise out of the normal course of business, including legal actionsseeking to establish liability directly through insurance contracts or indirectly through reinsurance contracts issued by Berkshiresubsidiaries. Plaintiffs occasionally seek punitive or exemplary damages. We do not believe that such normal and routine litigationwill have a material effect on our financial condition or results of operations. Berkshire and certain of its subsidiaries are alsoinvolved in other kinds of legal actions, some of which assert or may assert claims or seek to impose fines and penalties. We believethat any liability that may arise as a result of other pending legal actions will not have a material effect on our consolidated financial condition or results of operations.
We own a 50% interest in a joint venture, Berkadia Commercial Mortgage LLC (“Berkadia”), with Leucadia National Corporation (“Leucadia”) owning the other 50% interest. Berkadia is a servicer of commercial real estate loans in the U.S.,performing primary, master and special servicing functions for U.S. government agency programs, commercial mortgage-backed securities transactions, banks, insurance companies and other financial institutions. A significant source of funding for Berkadia’s operations is through the issuance of commercial paper. Repayment of the commercial paper is supported by a surety policy issued bya Berkshire insurance subsidiary. Leucadia has agreed to indemnify us for one-half of any losses incurred under the policy. Berkadia’s maximum outstanding balance of commercial paper borrowings is currently limited to $1.5 billion. On September 30,2016, the aggregate amount of Berkadia commercial paper outstanding was $1.47 billion.
In the third quarter of 2016, our wholly-owned subsidiary, National Indemnity Company entered into a definitive agreementto acquire Medical Liability Mutual Insurance Company (“MLMIC”), a writer of medical professional liability insurance domiciledin New York. MLMIC’s assets and policyholders’ surplus determined under statutory accounting principles as of June 30, 2016 wereapproximately $5.5 billion and $1.9 billion, respectively. The acquisition price will be an amount equal to the sum of: (i) the tangiblebook value of MLMIC at the closing date (determined under U.S. GAAP); plus (ii) $100 million. The acquisition will involve theconversion of MLMIC from a mutual company to a stock company. The closing of the transaction is subject to various regulatoryapprovals, customary closing conditions and the approval of the MLMIC policyholders eligible to vote on the proposeddemutualization and sale. The transaction is currently expected to be completed in late 2017.
23
Unrealized appreciation of
investments
Foreigncurrency
translation
Prior service and actuarial gains/losses of
defined benefit pension plans Other
Accumulatedother
comprehensive income
Nine months ending September 30, 2015 Balance at December 31, 2014 $45,636 $(1,957) $(1,039) $ 92 $ 42,732 Other comprehensive income, net before reclassifications (7,958) (1,602) 162 (113) (9,511) Reclassifications from accumulated other comprehensive
income (1,158) 128 1 11 (1,018)
Balance at September 30, 2015 $36,520 $(3,431) $ (876) $ (10) $ 32,203
Reclassifications from other comprehensive income into net earnings:
Investment gains/losses $(1,781) $ 197 $ — $ — $ (1,584) Other — — 2 18 20
Reclassifications before income taxes (1,781) 197 2 18 (1,564) Applicable income taxes (623) 69 1 7 (546)
$(1,158) $ 128 1 $ 11 $ (1,018)

Notes to Consolidated Financial Statements (Continued) Note 21. Business segment data
Our operating businesses include a large and diverse group of insurance, finance, manufacturing, service and retailingbusinesses. Our manufacturing businesses include PCC and Duracell, which were acquired in the first quarter of 2016. Revenues bysegment were as follows (in millions).
Earnings before income taxes by segment were as follows (in millions).
24
Third Quarter First Nine Months 2016 2015 2016 2015Operating Businesses: Insurance group:
Underwriting: GEICO $ 6,474 $ 5,788 $ 18,771 $ 16,792 General Re 1,389 1,405 4,168 4,397 Berkshire Hathaway Reinsurance Group 1,872 1,892 5,767 5,317 Berkshire Hathaway Primary Group 1,629 1,429 4,581 3,948
Investment income 1,043 1,046 3,428 3,474
Total insurance group 12,407 11,560 36,715 33,928 BNSF 5,167 5,600 14,519 16,571 Berkshire Hathaway Energy 5,198 5,144 13,615 14,018 Manufacturing 12,082 9,181 34,837 27,568 McLane Company 12,271 12,264 36,121 36,200 Service and retailing 6,331 6,151 18,607 16,966 Finance and financial products 1,962 1,725 5,677 5,078
55,418 51,625 160,091 150,329 Reconciliation of segments to consolidated amount:
Investment and derivative gains/losses 3,608 7,502 5,311 9,105 Income from Kraft Heinz 225 98 851 329 Eliminations and other (183) (236) (322) (762)
$ 59,068 $ 58,989 $ 165,931 $ 159,001
Third Quarter First Nine Months 2016 2015 2016 2015Operating Businesses: Insurance group:
Underwriting: GEICO $ 138 $ 258 $ 552 $ 471 General Re 100 (2) 144 58 Berkshire Hathaway Reinsurance Group (19) 199 86 247 Berkshire Hathaway Primary Group 190 188 485 566
Investment income 1,029 1,045 3,406 3,466
Total insurance group 1,438 1,688 4,673 4,808 BNSF 1,633 1,839 4,129 5,047 Berkshire Hathaway Energy 1,246 1,153 2,481 2,398 Manufacturing 1,981 1,259 5,150 3,857 McLane Company 106 106 371 384 Service and retailing 449 378 1,230 1,260 Finance and financial products 517 486 1,578 1,480
7,370 6,909 19,612 19,234 Reconciliation of segments to consolidated amount:
Investment and derivative gains/losses 3,608 7,502 5,311 9,105 Income from Kraft Heinz 225 98 851 329 Interest expense, not allocated to segments (201) (83) (518) (391) Eliminations and other (477) (354) (903) (712)
$ 10,525 $ 14,072 $ 24,353 $ 27,565
Item 2. Management’s Discussion and Analysis of Financial Condition and Results of Operations
Results of Operations
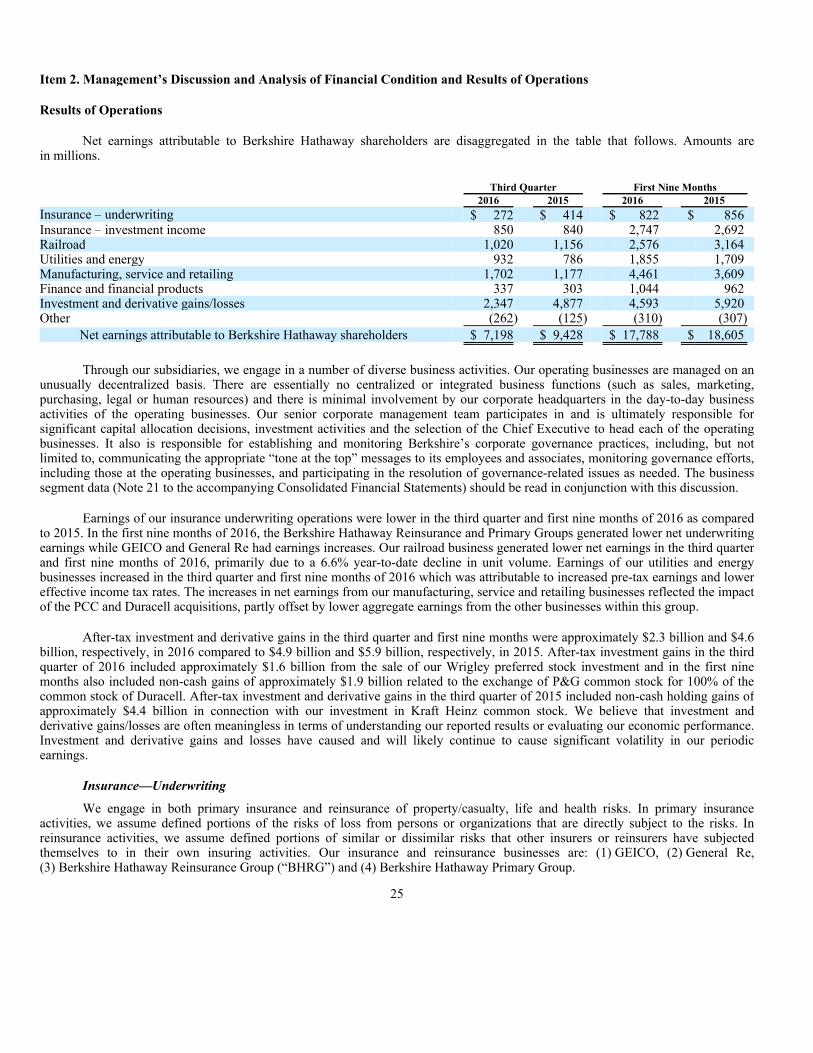
Net earnings attributable to Berkshire Hathaway shareholders are disaggregated in the table that follows. Amounts arein millions.
Through our subsidiaries, we engage in a number of diverse business activities. Our operating businesses are managed on anunusually decentralized basis. There are essentially no centralized or integrated business functions (such as sales, marketing,purchasing, legal or human resources) and there is minimal involvement by our corporate headquarters in the day-to-day business activities of the operating businesses. Our senior corporate management team participates in and is ultimately responsible forsignificant capital allocation decisions, investment activities and the selection of the Chief Executive to head each of the operatingbusinesses. It also is responsible for establishing and monitoring Berkshire’s corporate governance practices, including, but not limited to, communicating the appropriate “tone at the top” messages to its employees and associates, monitoring governance efforts,including those at the operating businesses, and participating in the resolution of governance-related issues as needed. The business segment data (Note 21 to the accompanying Consolidated Financial Statements) should be read in conjunction with this discussion.
Earnings of our insurance underwriting operations were lower in the third quarter and first nine months of 2016 as comparedto 2015. In the first nine months of 2016, the Berkshire Hathaway Reinsurance and Primary Groups generated lower net underwritingearnings while GEICO and General Re had earnings increases. Our railroad business generated lower net earnings in the third quarterand first nine months of 2016, primarily due to a 6.6% year-to-date decline in unit volume. Earnings of our utilities and energybusinesses increased in the third quarter and first nine months of 2016 which was attributable to increased pre-tax earnings and lower effective income tax rates. The increases in net earnings from our manufacturing, service and retailing businesses reflected the impactof the PCC and Duracell acquisitions, partly offset by lower aggregate earnings from the other businesses within this group.
After-tax investment and derivative gains in the third quarter and first nine months were approximately $2.3 billion and $4.6billion, respectively, in 2016 compared to $4.9 billion and $5.9 billion, respectively, in 2015. After-tax investment gains in the thirdquarter of 2016 included approximately $1.6 billion from the sale of our Wrigley preferred stock investment and in the first ninemonths also included non-cash gains of approximately $1.9 billion related to the exchange of P&G common stock for 100% of the common stock of Duracell. After-tax investment and derivative gains in the third quarter of 2015 included non-cash holding gains of approximately $4.4 billion in connection with our investment in Kraft Heinz common stock. We believe that investment andderivative gains/losses are often meaningless in terms of understanding our reported results or evaluating our economic performance.Investment and derivative gains and losses have caused and will likely continue to cause significant volatility in our periodicearnings.
Insurance—Underwriting
We engage in both primary insurance and reinsurance of property/casualty, life and health risks. In primary insuranceactivities, we assume defined portions of the risks of loss from persons or organizations that are directly subject to the risks. Inreinsurance activities, we assume defined portions of similar or dissimilar risks that other insurers or reinsurers have subjectedthemselves to in their own insuring activities. Our insurance and reinsurance businesses are: (1) GEICO, (2) General Re,(3) Berkshire Hathaway Reinsurance Group (“BHRG”) and (4) Berkshire Hathaway Primary Group.
25
Third Quarter First Nine Months 2016 2015 2016 2015Insurance – underwriting $ 272 $ 414 $ 822 $ 856 Insurance – investment income 850 840 2,747 2,692 Railroad 1,020 1,156 2,576 3,164 Utilities and energy 932 786 1,855 1,709 Manufacturing, service and retailing 1,702 1,177 4,461 3,609 Finance and financial products 337 303 1,044 962 Investment and derivative gains/losses 2,347 4,877 4,593 5,920 Other (262) (125) (310) (307)
Net earnings attributable to Berkshire Hathaway shareholders $ 7,198 $ 9,428 $ 17,788 $ 18,605

Item 2. Management’s Discussion and Analysis of Financial Condition and Results of Operations (Continued)
Insurance—Underwriting (Continued)
Our management views insurance businesses as possessing two distinct operations – underwriting and investing. Underwriting decisions are the responsibility of the unit managers; investing decisions, with limited exceptions, are the responsibilityof Berkshire’s Chairman and CEO, Warren E. Buffett. Accordingly, we evaluate performance of underwriting operations without anyallocation of investment income or investment gains.
The timing and amount of large property catastrophe losses can produce significant volatility in our periodic underwritingresults, particularly with respect to our reinsurance businesses. In the first nine months of 2016, we had no significant catastrophelosses. Based on preliminary estimates, we believe that losses arising from Hurricane Matthew in October 2016 will not be material.In the third quarter of 2015, we recorded estimated losses of $130 million in connection with a property loss event in China. Ourperiodic underwriting results may be affected significantly by changes in estimates for unpaid losses and loss adjustment expenses,including amounts established for occurrences in prior years. Actual claim settlements and revised loss estimates will develop overtime. Unpaid loss estimates recorded as of the balance sheet date will develop upward or downward in future periods, producing acorresponding decrease or increase to pre-tax earnings. Variations in foreign currency exchange rates can produce relativelysignificant foreign currency exchange gains and losses in our periodic earnings with respect to non-U.S. dollar liabilities of our U.S.-based insurance subsidiaries.
A key marketing strategy of our insurance businesses is the maintenance of extraordinary capital strength. A measure ofcapital strength is combined shareholders’ equity determined pursuant to U.S. statutory accounting rules (“Statutory Surplus”). Statutory Surplus of our insurance businesses was approximately $124 billion at December 31, 2015. This superior capital strengthcreates opportunities, especially with respect to reinsurance activities, to negotiate and enter into insurance and reinsurance contractsspecially designed to meet the unique needs of insurance and reinsurance buyers. Underwriting results of our insurance businesses aresummarized below. Amounts are in millions.
GEICO
GEICO writes private passenger automobile insurance, offering coverages to insureds in all 50 states and the District ofColumbia. GEICO’s policies are marketed mainly by direct response methods in which customers apply for coverage directly to thecompany via the Internet or over the telephone. This is a significant element in our strategy to be a low-cost auto insurer. In addition, we strive to provide excellent service to customers, with the goal of establishing long-term customer relationships. GEICO’s underwriting results are summarized below. Dollars are in millions.
26
Third Quarter First Nine Months 2016 2015 2016 2015Underwriting gain (loss) attributable to:
GEICO $ 138 $ 258 $ 552 $ 471 General Re 100 (2) 144 58 Berkshire Hathaway Reinsurance Group (19) 199 86 247 Berkshire Hathaway Primary Group 190 188 485 566
Pre-tax underwriting gain 409 643 1,267 1,342 Income taxes and noncontrolling interests 137 229 445 486
Net underwriting gain $ 272 $ 414 $ 822 $ 856
Third Quarter First Nine Months 2016 2015 2016 2015 Amount % Amount % Amount % Amount %Premiums written $ 6,977 $ 6,141 $ 19,771 $ 17,618
Premiums earned $ 6,474 100.0 $ 5,788 100.0 $ 18,771 100.0 $ 16,792 100.0
Losses and loss adjustment expenses 5,335 82.4 4,658 80.4 15,331 81.7 13,673 81.4 Underwriting expenses 1,001 15.5 872 15.1 2,888 15.4 2,648 15.8
Total losses and expenses 6,336 97.9 5,530 95.5 18,219 97.1 16,321 97.2
Pre-tax underwriting gain $ 138 $ 258 $ 552 $ 471

Item 2. Management’s Discussion and Analysis of Financial Condition and Results of Operations (Continued)
Insurance—Underwriting (Continued)
GEICO (Continued)
Premiums written in the third quarter and first nine months of 2016 were $7.0 billion and $19.8 billion, respectively, increases of13.6% and 12.2%, respectively, compared to the third quarter and first nine months of 2015. Premiums earned in 2016 increased $686million (11.9%) in the third quarter and $2.0 billion (11.8%) in the first nine months, as compared to the same periods in 2015. Theseincreases reflected voluntary auto policy-in-force growth of 5.2% and increased average premiums per auto policy of approximately 6.9%over the past twelve months, which were attributable to rate increases, coverage changes and changes in state and risk mix. Throughout2015, we experienced increases in claims frequencies and severities across all of our major coverages. As a result, we implementedpremium rate increases as necessary. Voluntary auto new business sales in 2016 increased 16.5% in the third quarter and 6.8% in the firstnine months compared to 2015. The significant growth in voluntary auto new business during the third quarter has continued in October.In 2016, voluntary auto policies-in-force increased by approximately 276,000 in the third quarter and 670,000 in the first nine months.
Losses and loss adjustment expenses incurred in 2016 increased $677 million (14.5%) in the third quarter and $1.7 billion(12.1%) in the first nine months, as compared to 2015. In 2016, our loss ratio (the ratio of losses and loss adjustment expenses to earnedpremiums) increased 2.0 percentage points in the third quarter and 0.3 percentage points in the first nine months as compared to 2015,reflecting increased storm losses and claims severity, partly offset by the aforementioned premium rate increases. Claims frequencies(claim counts per exposure unit) in the first nine months of 2016 for property damage and collision coverages were relatively unchangedas the decreases experienced in the first quarter were offset by subsequent increases. Claim frequencies for bodily injury coverage for thefirst nine months of 2016 were relatively unchanged from 2015. Average claims severities were higher in the first nine months of 2016for physical damage and collision coverages (four to six percent range) and bodily injury coverage (five to seven percent range). Inaddition, storm-related losses (primarily from hail and flooding) in the third quarter and first nine months of 2016 were approximately$90 million and $380 million, respectively, compared to $5 million and $129 million, respectively, in the corresponding 2015 periods.
Underwriting expenses in the third quarter and first nine months of 2016 were $1.0 billion and $2.9 billion, respectively,increases of $129 million (14.8%) and $240 million (9.1%), respectively, over 2015. Our expense ratio (underwriting expenses topremiums earned) in 2016 increased 0.4 percentage points in the third quarter and decreased 0.4 percentage points in the first ninemonths compared to 2015. The largest components of underwriting expenses are employee-related expenses (salaries and benefits) andadvertising costs. The increases in underwriting expenses reflected the increases in policies-in-force.
General Re
General Re conducts a reinsurance business offering property and casualty coverages to clients worldwide through GeneralReinsurance Corporation, Germany-based General Reinsurance AG, Faraday Holdings in London and other wholly-owned affiliates.Property and casualty reinsurance is written primarily on a direct basis, but is also written through brokers and intermediaries. Life andhealth reinsurance is written primarily on a direct basis through General Re Life Corporation and General Reinsurance AG. General Restrives to generate underwriting profits in essentially all of its product lines. Our management does not evaluate underwriting performance based upon market share and our underwriters are instructed to reject inadequately priced risks. General Re’s underwriting results aresummarized in the following table. Amounts are in millions.
Property/casualty
In the third quarter of 2016, property/casualty premiums written were relatively unchanged from 2015, reflecting a modestincrease in North America, offset by modestly lower volume in international markets. In the first nine months, property/casualtypremiums written in 2016 declined $215 million (9%) compared to 2015, primarily due to lower volume in international treaty and brokermarket business, and to a lesser degree, to unfavorable foreign currency exchange rate changes. In 2016, premiums earned decreased $40million (6%) in the third quarter and $200 million (9%) in the first nine months as compared to the same periods in 2015. The declines inearned premiums reflected lower volume and unfavorable changes in foreign currency exchange rates. Insurance industry capacityremains high and price competition in most property/casualty reinsurance markets persists. We continue to decline business when webelieve prices are inadequate. However, we remain prepared to write substantially more business when more appropriate prices can beattained.
27
Premiums earned Pre-tax underwriting gain (loss) Third Quarter First Nine Months Third Quarter First Nine Months 2016 2015 2016 2015 2016 2015 2016 2015
Property/casualty $ 643 $ 683 $1,919 $2,119 $ 66 $ (9) $ 119 $ 65 Life/health 746 722 2,249 2,278 34 7 25 (7)
$1,389 $1,405 $4,168 $4,397 $ 100 $ (2) $ 144 $ 58

Item 2. Management’s Discussion and Analysis of Financial Condition and Results of Operations (Continued)
Insurance—Underwriting (Continued)
General Re (Continued)
Our property business generated pre-tax underwriting gains of $76 million in the third quarter and $154 million in the first ninemonths of 2016 compared to gains of $15 million and $114 million, respectively, in the corresponding 2015 periods. There were nosignificant catastrophe losses during the first nine months of 2016, while underwriting results in 2015 included estimated losses of $44million from an explosion in Tianjin, China during the third quarter. In the first nine months of 2016, we recognized pre-tax gains fromreductions of estimated losses on prior years’ business of approximately $160 million, which were relatively unchanged from 2015.
Our casualty/workers’ compensation business produced pre-tax underwriting losses of $10 million in the third quarter and $35million in the first nine months of 2016 and pre-tax losses of $24 million in the third quarter and $49 million in the first nine months of2015. Underwriting results in 2016 and 2015 included net losses on current year business and charges for recurring discount accretion onworkers’ compensation liabilities and deferred charge amortization on retroactive reinsurance contracts, partially offset by gains fromreductions of estimated losses on prior years’ business. Casualty losses tend to be long-tailed and it should not be assumed that favorableloss experience in a given period means that the ultimate liability estimates currently established will continue to develop favorably.
Life/health
In the third quarter and first nine months of 2016, life/health premiums earned increased $24 million (3%) and decreased $29million (1%), respectively, compared to 2015. Adjusting for changes in foreign currency exchange rates, premiums earned in 2016increased $31 million (4%) in the third quarter and $32 million (1%) in the first nine months, reflecting growth across a number of non-U.S. markets, particularly in Asia and the United Kingdom. Our life/health business produced pre-tax underwriting gains of $25 millionin the first nine months of 2016 compared to losses of $7 million in the first nine months of 2015. In the first nine months of 2016,underwriting results reflected gains from our international life business offset by losses from the recurring discount accretion on long-term care liabilities and higher than expected individual life claim frequency in North America. Our international underwriting results in2016 were adversely affected by increased liabilities for estimated premium deficiencies on certain disability business in the secondquarter, partly offset by reductions in both foreign currency exchange losses and the adverse impact from lower interest rates compared to2015.
Berkshire Hathaway Reinsurance Group
BHRG underwrites excess-of-loss reinsurance and quota-share coverages on property and casualty risks for insurers andreinsurers worldwide, including property catastrophe insurance and reinsurance. BHRG also writes retroactive reinsurance onproperty/casualty exposures as well as life reinsurance and periodic payment annuity business. BHRG’s underwriting results aresummarized in the table below (in millions).
Property/casualty
Premiums written in the third quarter and first nine months of 2016 decreased $945 million (50.2%) and $322 million (8.2%),respectively, compared to 2015. The decline during the third quarter was primarily due to the impact of the quota-share contract withInsurance Australia Group Ltd. (“IAG”), which became effective on July 1, 2015. Premiums written in the third quarter of 2015 includeda quota-share percentage of IAG’s unearned premiums in-force as of the effective date. Premiums earned decreased $177 million (13.2%)in the third quarter and increased $190 million (6.0%) in the first nine months compared to 2015. The increase in the first nine monthswas primarily attributable to increased premiums earned from the IAG contract, partially offset by lower premiums from propertybusiness. Our premium volume is generally constrained for most property/casualty reinsurance coverages, and for property catastrophereinsurance in particular as rates, in our view, are generally inadequate. However, we have the capacity and desire to write more businesswhen appropriate pricing can be obtained.
Our property/casualty business generated pre-tax underwriting gains of $40 million and $415 million in the third quarter and firstnine months of 2016, respectively, compared to $315 million and $737 million, respectively, in 2015. In the third quarter of 2015, theproperty/casualty business incurred losses of $86 million from an explosion in Tianjin, China. The declines in pre-tax underwriting gainsin 2016 were primarily due to comparatively lower gains from reductions of estimated losses on prior years’ events.
28
Premiums earned Pre-tax underwriting gain (loss) Third Quarter First Nine Months Third Quarter First Nine Months 2016 2015 2016 2015 2016 2015 2016 2015Property/casualty $ 1,164 $ 1,341 $ 3,358 $ 3,168 $ 40 $ 315 $ 415 $ 737 Retroactive reinsurance — 1 582 4 (114) 2 (196) (283) Life and annuity 708 550 1,827 2,145 55 (118) (133) (207)
$ 1,872 $ 1,892 $ 5,767 $ 5,317 $ (19) $ 199 $ 86 $ 247

Item 2. Management’s Discussion and Analysis of Financial Condition and Results of Operations (Continued)
Insurance—Underwriting (Continued)
Berkshire Hathaway Reinsurance Group (Continued)
Retroactive reinsurance
Retroactive reinsurance contracts provide indemnification of losses and loss adjustment expenses with respect to past lossevents, and related claims are generally expected to be paid over long periods of time. At the inception of a contract, deferred chargeassets are recorded for the excess, if any, of the estimated ultimate losses payable over the premiums earned. Deferred charges aresubsequently amortized over the estimated claims payment period based on estimates of the timing and amount of future losspayments. The original estimates of the timing and amount of loss payments are periodically analyzed against actual experience andrevised based on an actuarial evaluation of the expected remaining losses. Amortization charges and deferred charge adjustmentsresulting from changes to the estimated timing and amount of future loss payments are included in periodic earnings.
Pre-tax underwriting results from retroactive reinsurance contracts also include foreign currency transaction gains/lossesassociated with foreign currency denominated liabilities of U.S.-based subsidiaries. In 2016, foreign currency gains were $21 millionin the third quarter and $198 million in the first nine months. In 2015, foreign currency gains were $120 million in the third quarterand $92 million in the first nine months. Before foreign currency gains/losses, retroactive reinsurance contracts produced pre-tax losses in the first nine months of $394 million in 2016 and $375 million in 2015, primarily from recurring periodic deferred chargeamortization. Gross unpaid losses assumed under retroactive reinsurance contracts were approximately $23.7 billion at September 30,2016 and at December 31, 2015. Unamortized deferred charges related to such reinsurance contracts were approximately $7.4 billionat September 30, 2016 and $7.6 billion at December 31, 2015.
Life and annuity
BHRG’s life and annuity underwriting results are summarized as follows. Amounts are in millions.
Premiums earned in 2016 from periodic payment annuity contracts increased $172 million (88.2%) in the third quarter anddeclined $291 million (27.4%) in the first nine months compared to 2015. Premiums earned in 2016 increased in the third quarter dueto increased direct annuity volume, which for the first nine months was more than offset by the impact of a sizable reinsurancecontract written in the second quarter of 2015.
Periodic payment annuity contracts generated pre-tax underwriting losses of $61 million in the third quarter and $123 million in the first nine months of 2016 and $6 million in the third quarter and $159 million in the first nine months of 2015. Our periodicpayment annuity liabilities under certain contracts of a U.S. subsidiary are denominated in foreign currencies, most significantly theGreat Britain Pound (“GBP”). In 2016, the value of the U.S. Dollar strengthened versus the GBP, producing reductions in ourliabilities in U.S. Dollars and resulting in pre-tax gains of $216 million in the first nine months of 2016 and $53 million in the firstnine months of 2015. Before the impact of foreign currency exchange rate changes, pre-tax underwriting losses from annuity contracts were $111 million and $339 million in the third quarter and first nine months of 2016, respectively, compared to $66million and $212 million, respectively, in the corresponding 2015 periods. This business is expected to generate underwriting lossesattributable to the recurring accretion of discounted annuity liabilities. The increases in underwriting losses (before foreign currencyimpacts) reflected increased liabilities from new business written over the past two years and the impact of lower interest rates, whichincreased expected future loss payments under certain reinsurance contracts. Aggregate annuity liabilities were approximately $9.6billion at September 30, 2016 and $8.7 billion at December 31, 2015.
In the third quarter and first nine months of 2016, life reinsurance premiums were relatively unchanged compared to 2015.The life reinsurance business produced a pre-tax underwriting loss of $9 million in the third quarter and a pre-tax gain of $5 million in the first nine months of 2016. Underwriting losses of $81 million in the first nine months of 2015 included losses of $53 millionincurred in connection with business terminated in the second quarter.
29
Premiums earned Pre-tax underwriting gain (loss) Third Quarter First Nine Months Third Quarter First Nine Months 2016 2015 2016 2015 2016 2015 2016 2015Periodic payment annuity $ 367 $ 195 $ 771 $ 1,062 $ (61) $ (6) $ (123) $ (159) Life reinsurance 337 350 1,043 1,068 (9) (13) 5 (81) Variable annuity guarantee 4 5 13 15 125 (99) (15) 33
$ 708 $ 550 $ 1,827 $ 2,145 $ 55 $ (118) $ (133) $ (207)

Item 2. Management’s Discussion and Analysis of Financial Condition and Results of Operations (Continued)
Insurance—Underwriting (Continued)
Berkshire Hathaway Reinsurance Group (Continued)
Our variable annuity business primarily consists of contracts that provide guarantees on closed blocks of variable annuitybusiness written by other insurers. The periodic underwriting gains and losses in each period reflect changes in liabilities forguaranteed benefits which are impacted by changes in securities markets and interest rates. Periodic results from these contracts canbe volatile reflecting changes in investment market conditions, which impact the underlying insured exposures. In the third quarter of2016, the pre-tax underwriting gains were primarily due to better than expected equity market performance, which was more thanoffset in the first nine months of 2016 by lower interest rates. In the third quarter of 2015, pre-tax underwriting losses were primarily due to lower equity markets and interest rates which partly offset the underwriting gains in the first six months.
Berkshire Hathaway Primary Group
The Berkshire Hathaway Primary Group (“BH Primary”) consists of several independently managed insurance businesses.These businesses include: MedPro Group, providers of healthcare malpractice insurance coverages; National Indemnity Company’s primary group (“NICO Primary”), writers of commercial motor vehicle and general liability coverages; U.S. Investment Corporation,whose subsidiaries underwrite specialty insurance coverages; a group of companies referred to as Berkshire Hathaway HomestateCompanies (“BHHC”), providers of commercial multi-line and workers’ compensation insurance; Berkshire Hathaway Specialty Insurance (“BH Specialty”), which concentrates on providing large scale insurance solutions for commercial property and casualtyrisks; Applied Underwriters, a provider of integrated workers’ compensation solutions; Berkshire Hathaway GUARD InsuranceCompanies (“GUARD”), providers of workers’ compensation and commercial property and casualty insurance coverage to small andmid-sized businesses; and Central States Indemnity Company, a provider of credit and Medicare Supplement insurance.
Premiums earned in the first nine months of 2016 were $4.58 billion, an increase of 16.0% compared to 2015. The increase inpremiums was primarily attributable to volume increases from BH Specialty, MedPro Group, BHHC and GUARD. The BH Primaryinsurers produced aggregate pre-tax underwriting gains of $485 million in the first nine months of 2016 and $566 million in 2015.Combined loss ratios were 61% in the first nine months of 2016 and 59% in 2015. The comparative increase in the loss ratio reflectedcomparative declines in favorable loss development of prior years’ loss events, partly offset by lower loss ratios on current yearbusiness. Our primary insurers write considerable amounts of liability and workers’ compensation business, which can have extended claim tails. It should not be assumed that the current claim experience or underwriting results will continue into the future.
Insurance—Investment Income
A summary of net investment income generated by investments held by our insurance operations follows. Amounts are inmillions.
Pre-tax investment income in the third quarter and first nine months of 2016 declined $16 million (2%) and $60 million (2%),respectively, from 2015, due primarily to lower dividends from foreign issuers as a result of investment dispositions in 2015, partlyoffset by increased dividends from domestic issuers. We continue to hold significant cash and cash equivalents earning very lowyields. We believe that maintaining ample liquidity is paramount and we insist on safety over yield with respect to such balances.
Invested assets of our insurance businesses derive from shareholder capital, including reinvested earnings, and from netliabilities under insurance contracts or “float.” The major components of float are unpaid losses, life, annuity and health benefitliabilities, unearned premiums and other liabilities to policyholders less premium and reinsurance receivables, deferred chargesassumed under retroactive reinsurance contracts and deferred policy acquisition costs. Float approximated $91 billion at September30, 2016 and $88 billion at December 31, 2015. The cost of float was negative as our insurance businesses overall generated pre-tax underwriting gains in each period.
30
Third Quarter First Nine Months 2016 2015 2016 2015Interest income $ 224 $ 221 $ 668 $ 675 Dividend income 805 824 2,738 2,791
Net investment income before income taxes and noncontrolling interests 1,029 1,045 3,406 3,466 Income taxes and noncontrolling interests 179 205 659 774
Net investment income $ 850 $ 840 $ 2,747 $2,692

Item 2. Management’s Discussion and Analysis of Financial Condition and Results of Operations (Continued)
Insurance—Investment Income (Continued)
A summary of cash and investments held in our insurance businesses follows. Amounts are in millions.
Fixed maturity investments as of September 30, 2016 were as follows. Amounts are in millions.
U.S. government obligations are rated AA+ or Aaa by the major rating agencies and approximately 87% of all state,municipal and political subdivisions, foreign government obligations and mortgage-backed securities were rated AA or higher. Non-investment grade securities represent securities that are rated below BBB- or Baa3. Foreign government securities include obligations issued or unconditionally guaranteed by national or provincial government entities.
Railroad (“Burlington Northern Santa Fe”)
Burlington Northern Santa Fe, LLC (“BNSF”) operates one of the largest railroad systems in North America. BNSF operatesapproximately 32,500 route miles of track in 28 states. BNSF also operates in three Canadian provinces. BNSF’s major business groups are classified by type of product shipped and include consumer products, industrial products, agricultural products and coal.Earnings of BNSF are summarized below (in millions).
31
September 30,
2016 December 31,
2015Cash and cash equivalents $ 50,242 $ 43,762 Equity securities 100,277 109,607 Fixed maturity securities 23,630 23,621 Other investments 15,415 15,998
$ 189,564 $ 192,988
Amortized
cost Unrealized gains/losses
Carryingvalue
U.S. Treasury, U.S. government corporations and agencies $ 4,053 $ 16 $ 4,069 States, municipalities and political subdivisions 1,180 62 1,242 Foreign governments 9,319 341 9,660 Corporate bonds, investment grade 5,491 515 6,006 Corporate bonds, non-investment grade 1,280 277 1,557 Mortgage-backed securities 949 147 1,096
$ 22,272 $ 1,358 $ 23,630
Third Quarter First Nine Months 2016 2015 2016 2015Revenues $ 5,167 $ 5,600 $ 14,519 $ 16,571
Operating expenses: Compensation and benefits 1,193 1,220 3,535 3,826 Fuel 533 670 1,359 2,080 Purchased services 562 633 1,789 1,909 Depreciation and amortization 534 503 1,584 1,488 Equipment rents, materials and other 462 497 1,379 1,538
Total operating expenses 3,284 3,523 9,646 10,841 Interest expense 250 238 744 683
3,534 3,761 10,390 11,524
Pre-tax earnings 1,633 1,839 4,129 5,047 Income taxes 613 683 1,553 1,883
Net earnings $ 1,020 $ 1,156 $ 2,576 $ 3,164

Item 2. Management’s Discussion and Analysis of Financial Condition and Results of Operations (Continued)
Railroad (“Burlington Northern Santa Fe”) (Continued)
Consolidated revenues in the third quarter and first nine months of 2016 were approximately $5.2 billion and $14.5 billion,respectively, representing decreases of $433 million (7.7%) and $2.1 billion (12.4%), respectively, versus the corresponding periods in 2015.Pre-tax earnings in the third quarter and first nine months of 2016 declined 11.2% and 18.2%, respectively, compared to the same periods in2015. In 2016, our revenues and earnings were negatively impacted by lower volumes versus 2015, particularly in the coal and petroleumproducts categories.
In the first nine months of 2016, revenues reflected comparative declines in average revenue per car/unit (6.5%) and in volumes(6.6%). The decrease in average revenue per car/unit was primarily attributable to lower fuel surcharge revenue driven by lower fuel pricesand business mix changes. The fuel price impact on fuel surcharges generally lags its impact on fuel costs. This timing difference contributedto the decline in earnings in the first quarter of 2016 as compared to 2015 because the price of fuel declined more significantly in early 2015.The effect of the timing difference has moderated since the first quarter and is not expected to be significant in the fourth quarter.
Freight revenues from consumer products in the third quarter of 2016 were $1.7 billion, a decline of 3.4% from 2015, driven by a3.6% decline in volume. Revenues for the first nine months of 2016 were $4.8 billion, a decline of 2.2% from 2015. Volume for the first ninemonths of 2016 was relatively flat, as increased automotive volumes, due to the addition of a new customer, and domestic intermodal volumeswere offset by lower international intermodal volumes attributable to soft economic activity and excess retail inventories.
In the third quarter and first nine months of 2016, freight revenues from industrial products were $1.2 billion and $3.6 billion,respectively, which decreased 15.2% and 15.8%, respectively, from the comparable 2015 periods. The decreases reflected lower volumes(8.0% in the third quarter and 7.5% in the first nine months), primarily for petroleum products, reflecting pipeline displacement of U.S. cruderail traffic and lower U.S. oil production. This decline was partially offset by increased plastics products volume. For the first nine months of2016, we also experienced lower demand for taconite and steel products partially offset by increased movements of non-owned rail equipment. With oil production at low levels, along with pipeline displacement of rail, we expect comparative volume declines in petroleumand related products for the remainder of 2016.
Freight revenues in 2016 from agricultural products increased 7.8% in the third quarter to $1.1 billion and decreased 1.8% to $3.1billion in the first nine months compared to the same periods in 2015. The increase in revenue in the third quarter of 2016 was driven by avolume increase of 13.2% compared to 2015. The decrease in the first nine months of 2016 was primarily attributable to lower averagerevenue per car, partly offset by a volume increase of 6.7%. In the third quarter and first nine months of 2016 volumes increased primarily dueto higher corn, soybeans and wheat exports.
Freight revenues in 2016 from coal declined 18.5% in the third quarter to $1.0 billion and 33.0% in the first nine months to $2.4billion compared to the same periods in 2015. Coal volumes declined 13.0% in the third quarter and 26.5% in the first nine months of 2016. Inrecent years, demand for coal by utilities has declined as other fuel sources, particularly natural gas, have increased. Coal volumes in 2015also benefitted from higher demand in the early part of the year as utility customers restocked coal inventories. Although natural gas priceshave risen in the third quarter, we expect declines in coal volumes for the rest of 2016, driven by coal unit retirements and elevated utility coalinventories.
Operating expenses in the third quarter and first nine months of 2016 were $3.3 billion and $9.6 billion, respectively, representingdecreases of $239 million (6.8%) and $1.2 billion (11.0%), respectively, compared to the same periods in 2015. Our ratios of operatingexpenses to revenues in 2016 increased 0.7 percentage points to 63.6% in the third quarter and 1.0 percentage points to 66.4% for the firstnine months versus the corresponding 2015 periods.
Compensation and benefits expenses decreased $27 million (2.2%) for the third quarter and $291 million (7.6%) for the first ninemonths of 2016 as compared to 2015. The declines were primarily due to lower employment levels, as a result of lower freight volumes, andproductivity improvements, partially offset by inflation. Fuel expenses declined $137 million (20.4%) in the third quarter and $721 million(34.7%) in the first nine months of 2016 as compared to 2015 due to lower average fuel prices and lower volumes. Purchased servicesdeclined $71 million (11.2%) in the third quarter and $120 million (6.3%) in the first nine months of 2016 as compared to 2015, due tovolume-based and other cost reductions. Depreciation expense increased $31 million (6.2%) in the third quarter and $96 million (6.5%) in thefirst nine months of 2016 as compared to 2015, due to increased assets in service reflecting our ongoing capital additions and improvementprograms. In the third quarter and first nine months of 2016, equipment rents, materials and other expense declined $35 million (7.0%) and$159 million (10.3%), respectively, compared to the same periods of 2015. These declines resulted from lower freight volumes andproductivity improvements in both periods, as well as, lower derailment and other casualty related costs in the nine-month period.
Interest expense in the third quarter and first nine months of 2016 was $250 million and $744 million, respectively, increases of $12million (5.0%) and $61 million (8.9%), respectively, compared to 2015. BNSF funds its capital expenditures with cash flow from operationsand new debt issuances. The increased interest expense in 2016 resulted from higher average outstanding debt.
32

Item 2. Management’s Discussion and Analysis of Financial Condition and Results of Operations (Continued)
Utilities and Energy (“Berkshire Hathaway Energy Company”)
We hold an 89.9% ownership interest in Berkshire Hathaway Energy Company (“BHE”), which operates an internationalenergy business. BHE’s domestic regulated utility interests are comprised of PacifiCorp, MidAmerican Energy Company (“MEC”), and NV Energy. In Great Britain, BHE subsidiaries operate two regulated electricity distribution businesses referred to as NorthernPowergrid. BHE also owns two domestic regulated interstate natural gas pipeline companies. Other energy businesses includeAltaLink, L.P. (“AltaLink”), a regulated electricity transmission-only business in Alberta, Canada and a diversified portfolio ofindependent power projects. In addition, BHE also operates the second-largest residential real estate brokerage firm and one of the largest real estate franchise networks in the United States.
The rates our regulated businesses charge customers for energy and services are based, in large part, on the costs of businessoperations, including a return on capital, and are subject to regulatory approval. To the extent these operations are not allowed toinclude such costs in the approved rates, operating results will be adversely affected. Revenues and earnings of BHE are summarizedbelow. Amounts are in millions.
PacifiCorp
PacifiCorp operates a regulated electric utility in portions of several Western states, including Utah, Oregon and Wyoming.PacifiCorp’s revenues in the third quarter and first nine months of 2016 were $1.45 billion and $3.95 billion, respectively, and wererelatively unchanged from 2015. Revenues in 2016 reflected increased retail revenues and lower wholesale revenues. The year-to-date increase in retail revenues was primarily due to higher retail rates as average customer loads were relatively unchanged. Thedeclines in wholesale revenues were attributable to lower volumes and average prices. EBIT in the third quarter and first nine monthsof 2016 increased $11 million (3.1%) and $68 million (8.5%), respectively, from the same periods of 2015. The increases wereprimarily due to increased gross margins as energy costs declined due to lower fuel prices and changes in fuel mix.
MidAmerican Energy Company
MEC operates a regulated electric and natural gas utility primarily in Iowa and Illinois. Revenues increased $121 million(17.7%) in the third quarter of 2016 compared to 2015, while revenues in the first nine months were comparatively flat versus 2015.The revenue increase in the third quarter was primarily due to higher retail and wholesale electric revenues ($107 million). Theincrease in retail electric revenues resulted primarily from a 3.6% increase in customer load and higher electric rates, and the increasein wholesale revenues was due to increased wholesale prices and volumes and transmission revenue. Revenues in the first ninemonths of 2016 included increased electric revenues ($100 million), which were largely offset by lower natural gas revenues ($69million) and other revenues. The decline in natural gas revenues was primarily due to lower average per-unit cost of gas sold ($61 million) which is offset in cost of sales, and a 6.3% decline in retail sales volumes, primarily from warmer winter temperatures in2016. EBIT increased $78 million (47.9%) in the third quarter and $79 million (25.5%) in the first nine months of 2016 as comparedto 2015. The increase in EBIT was primarily due to increased gross margins from electric revenues partially offset by higherdepreciation and amortization from additional assets placed in service and higher interest expenses. In addition, EBIT in the first ninemonths of 2015 included a gain of $13 million from the sale of a generating facility lease.
33
Third Quarter First Nine Months Revenues Earnings Revenues Earnings 2016 2015 2016 2015 2016 2015 2016 2015PacifiCorp $ 1,445 $ 1,432 $ 365 $ 354 $ 3,952 $ 3,977 $ 867 $ 799 MidAmerican Energy Company 806 685 241 163 2,031 2,017 389 310 NV Energy 997 1,130 345 340 2,335 2,688 495 529 Northern Powergrid 220 264 57 95 749 852 274 352 Natural gas pipelines 204 198 59 52 709 743 288 277 Other energy businesses 703 686 204 191 1,677 1,782 336 341 Real estate brokerage 823 749 89 80 2,162 1,959 187 166
$ 5,198 $ 5,144 $ 13,615 $ 14,018
Earnings before corporate interest and income taxes (“EBIT”) 1,360 1,275 2,836 2,774 Corporate interest 114 122 355 376 Income taxes and noncontrolling interests 314 367 626 689
Net earnings attributable to Berkshire Hathaway shareholders $ 932 $ 786 $ 1,855 $ 1,709

Item 2. Management’s Discussion and Analysis of Financial Condition and Results of Operations (Continued)
Utilities and Energy (“Berkshire Hathaway Energy Company”) (Continued)
NV Energy
NV Energy operates regulated electric and natural gas utilities in Nevada. Revenues in the third quarter and first nine monthsof 2016 were approximately $1.0 billion and $2.3 billion, respectively, decreases of $133 million (11.8%) and $353 million (13.1%),respectively, versus the same periods in 2015. The declines were primarily attributable to lower electric retail rates resulting fromlower energy costs. Electric retail customer load in the first nine months of 2016 increased 1.4% compared to 2015. EBIT wererelatively unchanged in the third quarter and fell $34 million (6.4%) in the first nine months of 2016 compared to 2015. In 2016, thenegative impact of the revenue declines were substantially offset by the declines in energy costs. However, operating expensesincreased $6 million (2%) in the third quarter and $48 million (7%) in the first nine months compared to 2015. The year-to-date increase resulted primarily from higher depreciation and amortization and property and other taxes. In addition, operating expenses inthe first nine months of 2015 included non-recurring benefits from reductions in certain accrued liabilities.
Northern Powergrid
Revenues in the third quarter and first nine months of 2016 declined $44 million (16.7%) to $220 million and $103 million(12.1%) to $749 million, respectively, as compared to 2015. The unfavorable impact from a stronger U.S. Dollar reduced revenues by$40 million in the third quarter and $72 million in the first nine months. In the first nine months of 2016, revenues also declined, dueto lower tariff rates from a new price control period that became effective April 1, 2015. EBIT in the third quarter and first ninemonths of 2016 declined $38 million (40.0%) to $57 million and $78 million (22.2%) to $274 million, respectively, as compared to2015. The declines were primarily due to the impact of lower tariff rates and the stronger U.S. Dollar, as well as increases indepreciation and other operating expenses.
Natural gas pipelines
Revenues in the third quarter of 2016 increased 3.0% and for the first nine months declined 4.6% as compared to 2015. Therevenue increase in the third quarter was primarily attributable to transportation revenues from expansion projects. For the first ninemonths of 2016, the decline was due to the impact of lower gas sales from balancing activities and lower transportation revenues fromlower volumes and rates, in part due to comparatively milder temperatures in the first quarter. EBIT in 2016 increased $7 million(13.5%) in the third quarter and $11 million (4.0%) in the first nine months versus 2015. These increases reflected lower interestexpense in 2016, as a result of lower average debt balances, partly offset by increased depreciation expense.
Other energy businesses
Revenues in the third quarter of 2016 increased $17 million (2.5%) and for the first nine months declined $105 million(5.9%) compared to the corresponding 2015 periods. The increase in third quarter revenues was primarily attributable to increasedrevenues from AltaLink as a result of increased assets in service. The declines in comparative revenues in the first nine months wereprincipally attributable to lower revenues from AltaLink and from our unregulated retail services business. AltaLink’s year-to-date revenue decline reflected the impact of a regulatory decision in the second quarter that resulted in one-time net reductions in revenue,which more than offset increased revenues from additional assets placed in service. The regulatory decision changed the timing ofwhen construction-in-progress expenditures included in rate base are billable to customers and earned in revenues, but had no impacton net earnings as the one-time revenue reduction was offset by one-time reductions in expenses.
EBIT in the third quarter of 2016 increased $13 million (6.8%) over 2015, while EBIT in the first nine months declined $5million (1.5%) compared to 2015. The increase in third quarter EBIT was primarily due to increased earnings from our renewableenergy and transmission businesses, while the decline in the first nine months reflected lower solar generation primarily fromtransformer related forced outages.
Real estate brokerage
Revenues in the third quarter and first nine months of 2016 increased 9.9% to $823 million and 10.4% to $2.16 billion,respectively, as compared to 2015. The increases were primarily attributable to increased closed brokerage transactions (primarily asa result of business acquisitions) and from modest increases in average home prices, as well as higher mortgage revenues. EBIT in thethird quarter and first nine months of 2016 increased $9 million (11.3%) and $21 million (12.7%), respectively, compared to 2015,primarily reflecting the increases in mortgage revenues.
34

Item 2. Management’s Discussion and Analysis of Financial Condition and Results of Operations (Continued)
Utilities and Energy (“Berkshire Hathaway Energy Company”) (Continued)
Corporate interest and income taxes
Corporate interest includes interest on unsecured debt issued by BHE and borrowings from certain Berkshire insurancesubsidiaries. The declines in corporate interest in 2016 were primarily due to lower average borrowings from Berkshire insurancesubsidiaries. BHE’s effective income tax rate for the first nine months was approximately 15.9% in 2016 and 19.8% in 2015. BHE’s effective income tax rates regularly reflect significant production tax credits from wind-powered electricity generation placed in service. In addition, pre-tax earnings of Northern Powergrid and AltaLink are taxed at lower statutory rates in the U.K. and Canada,respectively, compared to the statutory tax rate in the U.S.
Manufacturing, Service and Retailing
A summary of revenues and earnings of our manufacturing, service and retailing businesses follows. Amounts are in millions.
Manufacturing
Our manufacturing group includes a variety of businesses that produce industrial, building and consumer products. Industrialproducts businesses include specialty chemicals (The Lubrizol Corporation), metal cutting tools/systems (IMC InternationalMetalworking Companies), equipment and systems for the livestock and agricultural industries (CTB International), and a variety ofindustrial products for diverse markets (Marmon and Scott Fetzer). Beginning on January 29, 2016, our industrial products groupincludes Precision Castparts Corp. (“PCC”), a leading manufacturer of complex metal products for aerospace, power and generalindustrial markets.
Our building products businesses include flooring (Shaw), insulation, roofing and engineered products (Johns Manville),bricks and masonry products (Acme Building Brands), paint and coatings (Benjamin Moore), and residential and commercialconstruction and engineering products and systems (MiTek). Our consumer products businesses include leisure vehicles (ForestRiver), six apparel and footwear operations (led by Fruit of the Loom, which includes Russell athletic apparel and Vanity Fair Brandswomen’s intimate apparel), custom picture framing products (Larson Juhl) and jewelry products (Richline). Beginning onFebruary 29, 2016, our consumer products group includes the Duracell Company (“Duracell”), a leading manufacturer of highperformance alkaline batteries. A summary of revenues and pre-tax earnings of our manufacturing operations follows. Amounts are inmillions.
35
Third Quarter First Nine Months Revenues Earnings* Revenues Earnings* 2016 2015 2016 2015 2016 2015 2016 2015Manufacturing $ 12,082 $ 9,181 $ 1,981 $ 1,259 $ 34,837 $ 27,568 $ 5,150 $ 3,857 Service and retailing 18,602 18,415 555 484 54,728 53,166 1,601 1,644
$ 30,684 $ 27,596 $ 89,565 $ 80,734
Pre-tax earnings 2,536 1,743 6,751 5,501 Income taxes and noncontrolling interests 834 566 2,290 1,892
$ 1,702 $ 1,177 $ 4,461 $ 3,609
* Excludes certain acquisition accounting expenses, which were primarily from the amortization of identified intangible assetsrecorded in connection with our business acquisitions. In the third quarter, the after-tax acquisition accounting expenses excluded from earnings above were $281 million in 2016 and $190 million in 2015. For the first nine months such expenses were$486 million in 2016 and $372 million in 2015. These expenses are included in “other” earnings summarized on page 25.
Third Quarter First Nine Months Revenues Pre- tax earnings Revenues Pre- tax earnings 2016 2015 2016 2015 2016 2015 2016 2015Industrial products $ 6,400 $ 4,208 $ 1,347 $ 753 $ 18,599 $ 12,917 $ 3,534 $ 2,387 Building products 2,841 2,809 362 346 8,149 7,846 909 917 Consumer products 2,841 2,164 272 160 8,089 6,805 707 553
$ 12,082 $ 9,181 $ 1,981 $ 1,259 $ 34,837 $ 27,568 $ 5,150 $ 3,857

Item 2. Management’s Discussion and Analysis of Financial Condition and Results of Operations (Continued)
Manufacturing, Service and Retailing (Continued)
Manufacturing (Continued)
Aggregate revenues in 2016 were approximately $12.1 billion in the third quarter and $34.8 billion in the first nine months,representing increases of approximately $2.9 billion (31.6%) and $7.3 billion (26.4%), respectively, from the corresponding 2015periods. Pre-tax earnings were approximately $2.0 billion in the third quarter and $5.2 billion in the first nine months of 2016,representing increases of $722 million (57.3%) and $1.3 billion (33.5%), respectively, compared to the same periods in 2015.Excluding PCC and Duracell, aggregate pre-tax earnings increased 2.9% in the third quarter and were relatively unchanged in the firstnine months.
Industrial products
Revenues in the third quarter and first nine months of 2016 increased approximately $2.2 billion (52.1%) and $5.7 billion(44.0%), respectively, versus the same periods in 2015. These increases were due to the inclusion of PCC, partially offset by revenuedeclines of $210 million (5.0%) in the third quarter and $832 million (6.4%) in the first nine months across our other businesses. In2016, sales volumes of our other businesses were lower compared to 2015, reflecting sluggish demand for most products, andparticularly for products sold to businesses in the oil and gas and heavy equipment industries. In addition, lower costs of oil-based raw materials and metals and increased competitive pressures continued to lower average selling prices.
Pre-tax earnings in 2016 increased $594 million (78.9%) in the third quarter and $1,147 million (48.1%) in the first ninemonths as compared to 2015. The increases in pre-tax earnings reflected the inclusion of PCC, partially offset by comparativedeclines in earnings (7.1% for the third quarter and 6.3% for the first nine months) from our other businesses, primarily IMCInternational, Lubrizol and several of Marmon’s businesses. Generally, these businesses were negatively affected by a combination ofweaker customer demand and price and mix changes and increased restructuring costs, partly offset by the impacts of costcontainment initiatives and lower average material prices. We expect the prevailing market conditions to continue during theremainder of 2016 and we may take additional cost containment actions in response to further slowdowns in customer demand.
Building products
Revenues in the third quarter and first nine months of 2016 increased $32 million (1.1%) and $303 million (3.9%),respectively, compared to the same periods in 2015. In the third quarter, volume-driven revenue increases achieved by MiTek and Johns Manville were partially offset by revenue declines at Benjamin Moore and Shaw. In the first nine months, the revenue increasereflected increased unit sales across most of our product categories, and was partly offset by lower average sales prices and changesin product mix.
Pre-tax earnings in 2016 increased $16 million (4.6%) in the third quarter and decreased $8 million (0.9%) in the first ninemonths as compared to the corresponding periods in 2015. In the first nine months, the favorable impact from increased sales volumeand lower manufacturing costs attributable to deflation in certain commodity unit costs was essentially offset by increased chargesrelated to asset impairments, pension settlements and environmental claims.
Consumer products
Revenues in the third quarter and first nine months of 2016 were approximately $2.8 billion and $8.1 billion, respectively,increases of $677 million (31.3%) and approximately $1.3 billion (18.9%), respectively, compared to the corresponding 2015 periods.The increases reflected the inclusion of Duracell and increases in Forest River’s revenues of 19% in the third quarter and 12% in the first nine months, which were primarily attributable to increased unit sales. Apparel revenues in the third quarter increased $18million (1.6%) and in the first nine months declined $56 million (1.8%) compared to 2015. The year-to-date decline reflected lower footwear sales and the impact of the disposition of a historically unprofitable operation within Fruit of the Loom in 2015.
36

Item 2. Management’s Discussion and Analysis of Financial Condition and Results of Operations (Continued)
Manufacturing, Service and Retailing (Continued)
Consumer products (Continued)
Pre-tax earnings in the third quarter and first nine months of 2016 increased $112 million (70.0%) and $154 million (27.8%),respectively, compared to the same periods in 2015. The increases in third quarter earnings reflected the impact of the Duracellacquisition as well as increased earnings from Forest River and certain of our apparel businesses. Duracell contributed pre-tax earnings of $39 million in the third quarter of 2016 and $5 million from its acquisition date, reflecting the impact of transition andintegration costs. Forest River generated pre-tax earnings increases of 34% in the third quarter and 24% in the first nine months,primarily due to increased unit sales and higher gross margin rates. Earnings of our apparel businesses increased 62% in the thirdquarter and 29% in the first nine months. The comparative increases were primarily attributable to lower restructuring costs in 2016and a loss on the disposition of the Fruit of the Loom unprofitable operation in 2015, partly offset by lower earnings in 2016 from ourfootwear businesses.
Service and retailing
Our service and retailing businesses are comprised of a large group of independently managed businesses engaged in avariety of activities. A summary of revenues and pre-tax earnings of these operations follows. Amounts are in millions.
Service
Our service businesses offer fractional ownership programs for general aviation aircraft (NetJets) and high technologytraining to operators of aircraft (FlightSafety). We also distribute electronic components (TTI) and provide electronic distributionservices of corporate news, multimedia and regulatory filings (Business Wire). We are a franchisor of quick service restaurants (DairyQueen), publish newspapers and other publications (Buffalo News and the BH Media Group) and operate a television station inMiami, Florida (WPLG). We also offer third party logistics services that primarily serve the petroleum and chemical industries(Charter Brokerage).
Revenues in the third quarter of 2016 increased $150 million (6.1%) compared to 2015, while revenues for the first ninemonths of 2016 were relatively unchanged from 2015. NetJets’ comparative revenues increased 3.9% in the third quarter anddecreased 6.3% for the first nine months. The increase in NetJets’ third quarter revenues reflected a 2% increase in operatingrevenues and increased gains from aircraft dispositions, while the decline in revenues for the first nine months was primarily due tolower aircraft sales. TTI’s revenue increases in 2016 were 9.1% in the third quarter and 5.5% for the first nine months and were primarily due to increased sales volume in Europe and through the Internet.
Pre-tax earnings increased $18 million (6.3%) in the third quarter and decreased $93 million (10.1%) in the first nine monthsof 2016 as compared to corresponding periods in 2015. Pre-tax earnings in the third quarter included increased earnings from NetJetsand lower earnings from several of our other service businesses. The year-to-date decline in earnings was primarily due to lower earnings from NetJets, FlightSafety and our newspaper businesses. The decline in NetJets’ earnings for the first nine months was primarily due to increased depreciation expense and lower aircraft sales margins. TTI’s earnings were relatively flat in 2016 as changes in geographic sales mix and price competition produced lower gross margin rates, offsetting the aforementioned revenueincreases.
Retailing
Our retailing businesses include four distinct home furnishings retailing businesses (Nebraska Furniture Mart, R.C. Willey,Star Furniture and Jordan’s), which sell furniture, appliances, flooring and electronics. Our retailing businesses also include BerkshireHathaway Automotive (“BHA”) which was acquired in the first quarter of 2015. BHA currently includes 83 auto dealerships. BHAsells new and pre-owned automobiles and offers repair and other related services and products, and includes two related insurancebusinesses, two auto auctions and a distributor of automotive fluid maintenance products.
37
Third Quarter First Nine Months Revenues Pre-tax earnings Revenues Pre-tax earnings 2016 2015 2016 2015 2016 2015 2016 2015Service $ 2,619 $ 2,469 $ 305 $ 287 $ 7,557 $ 7,579 $ 826 $ 919 Retailing 3,712 3,682 144 91 11,050 9,387 404 341 McLane Company 12,271 12,264 106 106 36,121 36,200 371 384
$ 18,602 $ 18,415 $ 555 $ 484 $ 54,728 $ 53,166 $ 1,601 $ 1,644

Item 2. Management’s Discussion and Analysis of Financial Condition and Results of Operations (Continued)
Manufacturing, Service and Retailing (Continued)
Retailing (Continued)
Our other retailing businesses include three jewelry retailing businesses (Borsheims, Helzberg and Ben Bridge), See’s Candies (confectionary products), Pampered Chef (high quality kitchen tools), Oriental Trading Company (party supplies, schoolsupplies and toys and novelties) and Detlev Louis Motorrad (“Louis”), a retailer of motorcycle accessories based in Germany whichwas acquired in the second quarter of 2015.
Revenues of our retailing businesses in the third quarter and first nine months of 2016 increased approximately $30 million(0.8%) and $1.7 billion (17.7%), respectively, as compared to the same periods in 2015. The increase in year-to-date revenues reflected the impact of the BHA and Louis acquisitions, which accounted for approximately $1.5 billion of the comparative increase.Revenues of our home furnishings retailers in the third quarter and first nine months of 2016 increased $11 million (1.3%) and$180 million (8.5%), respectively, over 2015, primarily due to new stores opened in 2015 by Nebraska Furniture Mart and Jordan’s. Pre-tax earnings in 2016 from the retail group increased $53 million (58.2%) in the third quarter and $63 million (18.5%) in the firstnine months. The increases were primarily attributable to BHA, Louis and our home furnishings businesses.
McLane Company
McLane operates a wholesale distribution business that provides grocery and non-food consumer products to retailers and convenience stores (“grocery”) and to restaurants (“foodservice”). McLane also operates businesses that are wholesale distributors ofdistilled spirits, wine and beer (“beverage”). The grocery and foodservice businesses are marked by high sales volumes and very lowprofit margins and have several significant customers, including Wal-Mart, 7-Eleven and Yum! Brands. A curtailment of purchasing by any of its significant customers could have an adverse impact on McLane’s periodic revenues and earnings.
Revenues for the third quarter and first nine months of 2016 were $12.3 billion and $36.1 billion, respectively, and wererelatively unchanged as compared with the corresponding periods in 2015. Year-to-date revenues in 2016 reflected a comparative decline in grocery sales of 2%, attributable to lower unit volume, partly offset by price and mix changes. Year-to-date foodservice revenues increased 3%, primarily due to an overall increase in unit volume. Earnings in the third quarter and first nine months of2016 were $106 million and $371 million, respectively, unchanged from the third quarter of 2015 and a decrease of $13 million (3%)compared to the first nine months of 2015. Pre-tax earnings in the first nine months of 2015 included a gain of $19 million from thedisposition of a subsidiary. Excluding this gain, the operating margin (ratio of earnings to revenues) in the first nine months of 2016was 1.03%, compared to 1.01% in 2015. The grocery and foodservice business has been and is expected to continue to be highlycompetitive.
Finance and Financial Products
Our finance and financial products businesses include manufactured housing and finance (Clayton Homes), transportationequipment manufacturing and leasing businesses (UTLX and XTRA, and together, “transportation equipment leasing”), as well as other leasing and financing activities. A summary of revenues and earnings from our finance and financial products businessesfollows. Amounts are in millions.
38
Third Quarter First Nine Months Revenues Earnings Revenues Earnings 2016 2015 2016 2015 2016 2015 2016 2015Manufactured housing and finance $ 1,099 $ 926 $ 165 $ 189 $ 3,057 $ 2,637 $ 514 $ 515 Transportation equipment leasing 655 633 235 235 2,009 1,849 731 655 Other 208 166 117 62 611 592 333 310
$ 1,962 $ 1,725 $ 517 $ 486 $ 5,677 $ 5,078 $ 1,578 $ 1,480
Income taxes and noncontrolling interests 180 183 534 518
$ 337 $ 303 $ 1,044 $ 962

Item 2. Management’s Discussion and Analysis of Financial Condition and Results of Operations (Continued)
Finance and Financial Products (Continued)
Manufactured housing and finance
Clayton Homes’ revenues in the third quarter and first nine months of 2016 increased $173 million (19%) and $420 million(16%), respectively, compared to 2015. The increases reflected a 27% increase in year-to-date revenues from home sales, due primarily to a 22% increase in units sold and changes in mix. Pre-tax earnings for the third quarter decreased 13% and in the first ninemonths of 2016 were flat as compared to earnings in the corresponding 2015 periods. Clayton’s earnings in 2016 were negatively impacted by increased losses from insurance claims, increased impairment charges on servicing assets and lower gross sales margins,which partially offset the benefit from the significant increases in unit sales. As of September 30, 2016, approximately 94% of theinstallment loan portfolio was current in terms of payment status.
Transportation equipment leasing
Transportation equipment leasing revenues in the third quarter and first nine months of 2016 increased $22 million (3.5%)and $160 million (8.7%), respectively, compared to 2015. The increases derived primarily from the acquisition of GE’s railcar services fleet and railcar repair services business in the last half of 2015 and an increase in core fleet size, offset in part by lowerutilization rates, lower crane lease demand in North America and reduced volumes in other products and services primarily related tooil and gas markets.
Pre-tax earnings in 2016 were unchanged in the third quarter and increased $76 million (11.6%) in the first nine monthscompared to 2015. The year-to-date increase was primarily attributable to revenue growth and lower depreciation rates for certainrailcars, partially offset by higher railcar repair costs and interest expense on new borrowings from a Berkshire financing subsidiary.
Other
Other finance activities include CORT furniture leasing, our share of the earnings of a commercial mortgage servicingbusiness (“Berkadia”) in which we own a 50% joint venture interest, and interest and dividends from a portfolio of investments. Inthe first nine months of 2016, other earnings increased $23 million compared to 2015, reflecting increased earnings from investmentsecurities and CORT, partly offset by lower earnings from Berkadia. Other earnings also includes income from interest rate spreadscharged on borrowings by a Berkshire financing subsidiary that are used to finance loans and assets held for lease. Correspondingexpenses are included in Clayton Homes’ and UTLX’s results. Interest rate spreads charged to these businesses were $55 million inthe first nine months of 2016 and $47 million in 2015.
Investment and Derivative Gains/Losses
A summary of investment and derivative gains and losses follows. Amounts are in millions.
Investment gains/losses
Investment gains/losses arise primarily from the sale, redemption, or exchange of investments or when investments are carried at fair value with the periodic changes in fair values recorded in earnings. The timing of gains or losses can have a materialeffect on periodic earnings. Investment gains and losses included in earnings usually have minimal impact on the periodic changes inour consolidated shareholders’ equity since most of our investments are recorded at fair value with the unrealized gains and lossesincluded in shareholders’ equity as a component of accumulated other comprehensive income.
39
Third Quarter First Nine Months 2016 2015 2016 2015Investment gains/losses $ 3,150 $ 8,266 $ 5,643 $ 8,725Derivative gains/losses 458 (764) (332) 380
Gains/losses before income taxes and noncontrolling interests 3,608 7,502 5,311 9,105Income taxes and noncontrolling interests 1,261 2,625 718 3,185
Net gains/losses $ 2,347 $ 4,877 $ 4,593 $ 5,920
Item 2. Management’s Discussion and Analysis of Financial Condition and Results of Operations (Continued)
Investment and Derivative Gains/Losses (Continued)
Investment gains/losses (Continued)
We believe the amount of investment gains/losses included in earnings in any given period typically has little analytical orpredictive value. Our decisions to sell securities are not motivated by the impact that the resulting gains or losses will have on ourreported earnings. Although we do not consider investment gains and losses as necessarily meaningful or useful in evaluating ourperiodic results, we are providing information to explain the nature of such gains and losses when reflected in our earnings.
Pre-tax investment gains in the third quarter and first nine months of 2016 were $3.2 billion and $5.6 billion, respectively.Investment gains in the third quarter of 2016 included $2.4 billion from the disposition of our Wrigley preferred stock investment andin the first nine months also included $610 million from the redemption of our Kraft Heinz Preferred Stock investment and $1.1billion realized in connection with the exchange of shares of P&G common stock for 100% of the common stock of Duracell. Incometax expense allocated to investment gains included a benefit from the reduction of certain deferred income tax liabilities in connectionwith the exchange of P&G common stock for Duracell. See Notes 8 and 9 to the accompanying Consolidated Financial Statements. In2015, pre-tax investment gains included non-cash holding gains related to our investment in Kraft Heinz of $6.8 billion in the thirdquarter, as well as net gains from dispositions of equity and fixed maturity securities of approximately $1.5 billion in the third quarterand $1.9 billion in the first nine months.
Investment gains/losses also included pre-tax other-than-temporary impairment (“OTTI”) charges of $63 million and $26million in the first nine months of 2016 and 2015, respectively. Although we have periodically recorded OTTI charges in earnings inthe past, we continue to hold certain of those securities. If the market values of those securities increase following the date OTTIcharges were recorded in earnings, the increases are not reflected in earnings but are instead included in shareholders’ equity as a component of accumulated other comprehensive income. When recorded, OTTI charges have no impact whatsoever on the assetvalues otherwise recorded in our Consolidated Balance Sheets or on our consolidated shareholders’ equity. In addition, the recognition of such losses in earnings rather than in accumulated other comprehensive income does not necessarily indicate that salesare planned and ultimately sales may not occur for a number of years. Furthermore, the recognition of an OTTI charge does notnecessarily indicate that the loss in value of the security is permanent or that the market price of the security will not subsequentlyincrease to and ultimately exceed our original cost.
As of September 30, 2016, gross unrealized losses on our investments in equity and fixed maturity securities determined onan individual purchase lot basis were approximately $1.4 billion, of which $941 million pertained to our investment in IBM commonstock. We concluded that such losses were temporary. We consider several factors in determining whether or not impairments aredeemed to be other than temporary, including the current and expected long-term business prospects and if applicable, the creditworthiness of the issuer, our ability and intent to hold the investment until the price recovers and the length of time and relativemagnitude of the price decline.
Derivative gains/losses
Derivative gains/losses primarily represented the changes in fair value of our equity index put option contract liabilities.Periodic changes in the fair values of liabilities reflected in earnings can be significant, reflecting the volatility of underlying equitymarkets and from changes in the inputs used to measure such liabilities.
In 2016, our equity index put option contracts produced pre-tax gains of $458 million in the third quarter and pre-tax losses of $421 million for the first nine months. In each period, these gains and losses were primarily due to changes in the index values andinterest rates and the passage of time. In 2015, our equity index put option contracts produced pre-tax losses of $802 million in thethird quarter and pre-tax gains of $371 million in the first nine months. In the third quarter of 2015, the losses were driven by lowerindex prices and increased expected volatility assumptions, which produced an increase in the fair value of our liabilities. The thirdquarter losses offset much of the gains realized in the first six months of 2015, which were primarily attributable to higher indexprices, a stronger U.S. Dollar and increased interest rates. As of September 30, 2016, equity index put option intrinsic values wereapproximately $1.6 billion and our recorded liabilities at fair value were approximately $4.0 billion. Our ultimate paymentobligations, if any, under our equity index put option contracts will be determined as of the contract expiration dates (beginning in2018), and will be based on the intrinsic value as defined under the contracts.
In July 2016, our remaining credit default contract was terminated by mutual agreement with the counterparty and we paid$195 million upon termination. This contract produced pre-tax earnings of $89 million in the first nine months of 2016. We have nofurther exposure to losses under credit default contracts.
40

Item 2. Management’s Discussion and Analysis of Financial Condition and Results of Operations (Continued)
Other
A summary of after-tax other earnings which include corporate income (including income from our investments in KraftHeinz), expenses and income taxes not allocated to operating businesses is summarized below. Amounts are in millions.
Our earnings in 2016 from our investments in Kraft Heinz included lower dividends on the Preferred Stock, which wasredeemed in June 2016, and increased equity method earnings from our common stock investment. Our earnings, after allocatedBerkshire corporate income taxes, were $146 million in the third quarter and $552 million in the first nine months of 2016. In 2015,these investments produced earnings of $115 million in the third quarter and $315 million for the first nine months.
After-tax corporate interest expense was $116 million in the third quarter and $297 million for the first nine months of 2016and $41 million and $216 million, respectively, in the comparable 2015 periods. The increases in 2016 reflected the impact ofincreased average borrowings. The variations in comparative periodic after-tax corporate interest expense also reflected the impact of foreign exchange gains and losses with respect to Euro denominated debt issued by Berkshire in March 2015 (€3.0 billion par) and March 2016 (€2.75 billion par). Corporate interest included after-tax foreign currency exchange losses of $48 million in the thirdquarter and $107 million in the first nine months of 2016 and $4 million and $106 million, respectively, in the comparable 2015periods. Relatively minor changes in the U.S. Dollar/Euro exchange rate can produce significant gains or losses given the currentlevel of our Euro-denominated borrowings.
Also included in other earnings are charges related to the application of the acquisition method in connection with Berkshire’s business acquisitions. Such charges were primarily from the amortization of intangible assets recorded in connection with thosebusiness acquisitions. These charges (after-tax) were $317 million and $550 million in the third quarter and first nine months of 2016,respectively, compared to $199 million and $400 million, respectively, in the comparable periods in 2015.
Financial Condition
Our balance sheet continues to reflect significant liquidity and a strong capital base. Our consolidated shareholders’ equity at September 30, 2016 was $269.3 billion, an increase of $13.7 billion since December 31, 2015. Net earnings attributable to Berkshireshareholders in the first nine months of 2016 were $17.8 billion. At September 30, 2016, our insurance and other businesses held cashand cash equivalents of $68.3 billion, and investments (excluding our investment in Kraft Heinz) of $140.8 billion. In June 2016, wereceived $8.32 billion in connection with the redemption of our Kraft Heinz Preferred Stock investment.
In January 2016, we used cash of approximately $32.1 billion to fund the acquisition of PCC, which we funded through acombination of cash on hand and $10 billion borrowed under a new 364-day revolving credit agreement. In March 2016, we issued €2.75 billion and $5.5 billion of senior unsecured notes. The proceeds were used in the repayment of all outstanding borrowingsunder the aforementioned revolving credit agreement. In June, the revolving credit agreement was terminated. See Note 16 to theaccompanying Consolidated Financial Statements. In August 2016, we issued $750 million of senior unsecured notes to replace $750million of maturing notes. Over the next twelve months, $1.1 billion of parent company senior notes will mature.
41
Third Quarter First Nine Months 2016 2015 2016 2015Kraft Heinz earnings $ 146 $ 115 $ 552 $ 315 Acquisition accounting expenses (317) (199) (550) (400) Corporate interest expense (116) (41) (297) (216) Other 25 — (15) (6)
Net earnings attributable to Berkshire Hathaway shareholders $ (262) $ (125) $ (310) $ (307)

Item 2. Management’s Discussion and Analysis of Financial Condition and Results of Operations (Continued) Financial Condition (Continued)
Our railroad, utilities and energy businesses (conducted by BNSF and BHE) maintain very large investments in capital assets(property, plant and equipment) and will regularly make significant capital expenditures in the normal course of business. In the firstnine months of 2016, aggregate capital expenditures of these businesses were approximately $6.4 billion, including $3.5 billion byBHE and $2.9 billion by BNSF. Forecasted capital expenditures of the two businesses for the remainder of 2016 approximate $2.5billion. Future capital expenditures are expected to be funded from cash flows from operations and debt issuances.
BNSF’s outstanding debt was approximately $22.2 billion as of September 30, 2016, an increase of $429 million fromDecember 31, 2015. Outstanding borrowings of BHE and its subsidiaries, excluding its borrowings from Berkshire insurancesubsidiaries, were approximately $36.6 billion as of September 30, 2016, an increase of $643 million from December 31, 2015.Berkshire does not guarantee the repayment of debt issued by BNSF, BHE or any of their subsidiaries and is not committed toprovide capital to support BNSF or BHE or any of their subsidiaries.
Finance and financial products assets were approximately $41.9 billion as of September 30, 2016, an increase ofapproximately $2.9 billion since December 31, 2015. Finance assets at September 30, 2016 primarily consisted of loans and financereceivables and various types of property held for lease, as well as significant cash and cash equivalents, which included the proceedsof approximately $4.6 billion from the sale of our Wrigley preferred stock investment in September.
Finance and financial products liabilities were approximately $21.1 billion as of September 30, 2016, an increase ofapproximately $3.9 billion compared to December 31, 2015. The year-to-date increase was primarily attributable to new debt issued by Berkshire Hathaway Finance Corporation (“BHFC”), including $3.5 billion of senior notes issued in March. See Note 16 to theaccompanying Consolidated Financial Statements. The proceeds were used to fund loans originated and acquired by Clayton Homesand to fund a portion of existing assets held for lease by our rail tank car leasing business, UTLX. Over the next twelve months, $2.8billion of BHFC senior notes will mature.
Contractual Obligations
We are party to contracts associated with ongoing business and financing activities, which will result in cash payments tocounterparties in future periods. Certain obligations are reflected in our Consolidated Balance Sheets, such as notes payable, whichrequire future payments on contractually specified dates and in fixed and determinable amounts. Other obligations pertain to theacquisition of goods or services in the future, such as minimum rentals under operating leases and certain purchase obligations, andare not currently reflected in the financial statements. Such obligations will be reflected in future periods as the goods are delivered orservices provided.
During the first nine months of 2016, we issued new term debt and assumed debt through the PCC business acquisition.Future payments of principal and interest related to such borrowings are summarized as follows (in millions): 2016 - $225; 2017 -$424; 2018 - $3,905; 2019 - $3,362; and 2020 and after - $15,756. Except as otherwise disclosed in this Quarterly Report, ourcontractual obligations as of September 30, 2016 were, in the aggregate, not materially different from those disclosed in the“Contractual Obligations” section of “Management’s Discussion and Analysis of Financial Condition and Results of Operations”contained in Berkshire’s Annual Report on Form 10-K for the year ended December 31, 2015.
Critical Accounting Policies
Certain accounting policies require us to make estimates and judgments that affect the amounts reflected in the ConsolidatedFinancial Statements. Such estimates and judgments necessarily involve varying, and possibly significant, degrees of uncertainty.Accordingly, certain amounts currently recorded in the financial statements will likely be adjusted in the future based on newavailable information and changes in other facts and circumstances. Reference is made to “Critical Accounting Policies” discussed in “Management’s Discussion and Analysis of Financial Condition and Results of Operations” included in Berkshire’s Annual Report on Form 10-K for the year ended December 31, 2015.
Our Consolidated Balance Sheet as of September 30, 2016 includes estimated liabilities for unpaid losses from property andcasualty insurance and reinsurance contracts of approximately $75.5 billion. Due to the inherent uncertainties in the process ofestablishing these liabilities, the actual ultimate claim liabilities will likely differ from the currently recorded amounts. A smallpercentage change in estimates of this magnitude could have a material effect on our periodic earnings. The effects from changes inthese estimates are recorded as a component of insurance losses and loss adjustment expenses in the period of the change.
42

Item 2. Management’s Discussion and Analysis of Financial Condition and Results of Operations (Continued) Critical Accounting Policies (Continued)
Our Consolidated Balance Sheet as of September 30, 2016 includes goodwill of acquired businesses of approximately$79 billion. We evaluate goodwill for impairment at least annually and we conducted our most recent annual review during the fourthquarter of 2015. Although we believe that the goodwill reflected in the Consolidated Balance Sheet is not impaired, goodwill maysubsequently become impaired as a result of changes in facts and circumstances that adversely affect the valuations of the reportingunits. A goodwill impairment charge could have a material effect on periodic earnings.
Our Consolidated Balance Sheets include significant derivative contract liabilities with respect to our long-duration equity index put option contracts. The fair values recorded for these liabilities are based on valuation models that utilize various inputs andassumptions that we believe are used by market participants. We further believe that fair values based on such models are inherentlysubjective and the values in an actual transaction may differ significantly from the model values. Changes in the assumptions utilizedwithin the valuation models may have a significant effect on recorded fair values and periodic earnings.
Information concerning new accounting pronouncements is included in Note 2 to the accompanying Consolidated FinancialStatements.
Forward-Looking Statements
Investors are cautioned that certain statements contained in this document as well as some statements in periodic pressreleases and some oral statements of Berkshire officials during presentations about Berkshire or its subsidiaries are “forward-looking”statements within the meaning of the Private Securities Litigation Reform Act of 1995 (the “Act”). Forward-looking statements include statements which are predictive in nature, which depend upon or refer to future events or conditions, which include wordssuch as “expects,” “anticipates,” “intends,” “plans,” “believes,” “estimates” or similar expressions. In addition, any statements concerning future financial performance (including future revenues, earnings or growth rates), ongoing business strategies orprospects and possible future Berkshire actions, which may be provided by management, are also forward-looking statements as defined by the Act. Forward-looking statements are based on current expectations and projections about future events and are subjectto risks, uncertainties and assumptions about Berkshire and its subsidiaries, economic and market factors and the industries in whichwe do business, among other things. These statements are not guarantees of future performance and we have no specific intention toupdate these statements.
Actual events and results may differ materially from those expressed or forecasted in forward-looking statements due to a number of factors. The principal risk factors that could cause our actual performance and future events and actions to differ materiallyfrom such forward-looking statements include, but are not limited to, changes in market prices of our investments in fixed maturityand equity securities, losses realized from derivative contracts, the occurrence of one or more catastrophic events, such as anearthquake, hurricane or act of terrorism that causes losses insured by our insurance subsidiaries and/or losses to our businessoperations, changes in laws or regulations affecting our insurance, railroad, utilities and energy and finance subsidiaries, changes infederal income tax laws, and changes in general economic and market factors that affect the prices of securities or the industries inwhich we do business.
43

Item 3. Quantitative and Qualitative Disclosures About Market Risk
Reference is made to Berkshire’s most recently issued Annual Report and in particular the “Market Risk Disclosures”included in “Management’s Discussion and Analysis of Financial Condition and Results of Operations.” As of September 30, 2016, there were no material changes in the market risks described in Berkshire’s Annual Report on Form 10-K for the year ended December 31, 2015.
Item 4. Controls and Procedures
As of the end of the period covered by this Quarterly Report on Form 10-Q, the Company carried out an evaluation, under the supervision and with the participation of the Company’s management, including the Chairman (Chief Executive Officer) and theSenior Vice President (Chief Financial Officer), of the effectiveness of the design and operation of the Company’s disclosure controls and procedures pursuant to Exchange Act Rule 13a-15. Based upon that evaluation, the Chairman (Chief Executive Officer) and theSenior Vice President (Chief Financial Officer) concluded that the Company’s disclosure controls and procedures are effective in timely alerting them to material information relating to the Company (including its consolidated subsidiaries) required to be includedin the Company’s periodic SEC filings. During the quarter, there have been no significant changes in the Company’s internal control over financial reporting or in other factors that could significantly affect internal control over financial reporting.
Part II Other Information
Item 1. Legal Proceedings
We are parties in a variety of legal actions that routinely arise out of the normal course of business, including legal actionsseeking to establish liability directly through insurance contracts or indirectly through reinsurance contracts issued by Berkshiresubsidiaries. Plaintiffs occasionally seek punitive or exemplary damages. We do not believe that such normal and routine litigationwill have a material effect on our financial condition or results of operations. Berkshire and certain of its subsidiaries are alsoinvolved in other kinds of legal actions, some of which assert or may assert claims or seek to impose fines and penalties. We believethat any liability that may arise as a result of other pending legal actions will not have a material effect on our consolidated financialcondition or results of operations.
Item 1A. Risk Factors
Our significant business risks are described in Item 1A to Form 10-K for the year ended December 31, 2015 to which reference is made herein.
Item 2. Unregistered Sales of Equity Securities and Use of Proceeds and Issuer Repurchases of Equity Securities
Berkshire’s Board of Directors (“Berkshire’s Board”) has approved a common stock repurchase program under whichBerkshire may repurchase its Class A and Class B shares at prices no higher than a 20% premium over the book value of the shares.Berkshire may repurchase shares in the open market or through privately negotiated transactions. Berkshire’s Board authorization does not specify a maximum number of shares to be repurchased. However, repurchases will not be made if they would reduceBerkshire’s consolidated cash and cash equivalents below $20 billion. The repurchase program is expected to continue indefinitelyand the amount of repurchases will depend entirely upon the level of cash available, the attractiveness of investment and businessopportunities either at hand or on the horizon, and the degree of discount of the market price relative to management’s estimate of intrinsic value. The repurchase program does not obligate Berkshire to repurchase any dollar amount or number of Class A or Class Bshares and there is no expiration date to the program. There were no share repurchases under the program in the first nine months of2016.
Item 3. Defaults Upon Senior Securities
None
Item 4. Mine Safety Disclosures
Information regarding the Company’s mine safety violations and other legal matters disclosed in accordance with Section 1503(a) of the Dodd-Frank Reform Act is included in Exhibit 95 to this Form 10-Q.
Item 5. Other Information
None
44

Item 6. Exhibits
SIGNATURE
Pursuant to the requirement of the Securities Exchange Act of 1934, the Registrant has duly caused this Report to be signedon its behalf by the undersigned thereunto duly authorized.
45
a. Exhibits
3(ii) By-Laws Incorporated by reference to Exhibit 3(ii) to Form 8-K filed on May 4, 2016.
12 Calculation of Ratio of Consolidated Earnings to Consolidated Fixed Charges
31.1 Rule 13a-14(a)/15d-14(a) Certifications
31.2 Rule 13a-14(a)/15d-14(a) Certifications
32.1 Section 1350 Certifications
32.2 Section 1350 Certifications
95 Mine Safety Disclosures
101
The following financial information from Berkshire Hathaway Inc.’s Quarterly Report on Form 10-Q for the quarter ended September 30, 2016, formatted in XBRL (Extensible Business Reporting Language) includes: (i) the Consolidated Balance Sheets as of September 30, 2016 and December 31, 2015, (ii) the Consolidated Statements of Earnings for each of the three-month and nine-month periods ended September 30, 2016 and 2015, (iii) the Consolidated Statements of Comprehensive Income for each of the three-month and nine-month periods ended September 30, 2016 and 2015, (iv) the Consolidated Statements of Changes in Shareholders’ Equity for each of the nine-month periods ended September 30, 2016 and 2015, (v) the Consolidated Statements of Cash Flows for each of the nine-month periods ended September 30, 2016 and 2015, and (vi) the Notes to Consolidated Financial Statements, tagged in summary and detail.
BERKSHIRE HATHAWAY INC. (Registrant)
Date: November 4, 2016 /S/ MARC D. HAMBURG (Signature)
Marc D. Hamburg,Senior Vice President andPrincipal Financial Officer

Exhibit 12
BERKSHIRE HATHAWAY INC. Calculation of Ratio of Consolidated Earnings to Consolidated Fixed Charges
(Dollars in millions)
Nine Months Ending September 30, 2016
Year Ended December 31, 2015 2014 2013 2012 2011Net earnings attributable to Berkshire Hathaway
shareholders $ 17,788 $ 24,083 $ 19,872 $ 19,476 $ 14,824 $ 10,254 Income tax expense 6,281 10,532 7,935 8,951 6,924 4,568 Earnings attributable to noncontrolling interests 284 331 298 369 488 492 (Earnings) loss from equity method investments (834) (83) 33 255 — — Dividends from equity method investments 666 547 — — — — Fixed charges 3,481 4,134 3,882 3,386 3,304 3,219
Earnings available for fixed charges $ 27,666 $ 39,544 $ 32,020 $ 32,437 $ 25,540 $ 18,533
Fixed charges Interest expense, including amortization(1) $ 2,943 $ 3,515 $ 3,253 $ 2,801 $ 2,744 $ 2,664 Rentals representing interest and capitalized
interest 538 619 629 585 560 555
$ 3,481 $ 4,134 $ 3,882 $ 3,386 $ 3,304 $ 3,219
Ratio of earnings to fixed charges 7.95x 9.57x 8.25x 9.58x 7.73x 5.76x
(1) Includes non-cash foreign currency exchange losses on the Euro denominated debt issued by Berkshire of $165 million for the first nine months of 2016 and $69 million for the year ended December 31, 2015.

EXHIBIT 31.1
Quarter ended September 30, 2016
Rule 13a-14(a)/15d-14(a) Certifications
CERTIFICATIONS
I, Warren E. Buffett, certify that:
Date: November 4, 2016
1. I have reviewed this quarterly report on Form 10-Q of Berkshire Hathaway Inc.;
2. Based on my knowledge, this report does not contain any untrue statement of a material fact or omit to state a material factnecessary to make the statements made, in light of the circumstances under which such statements were made, notmisleading with respect to the period covered by this report;
3. Based on my knowledge, the financial statements, and other financial information included in this report, fairly present in allmaterial respects the financial condition, results of operations and cash flows of the registrant as of, and for, the periodspresented in this report;
4. The registrant’s other certifying officer(s) and I are responsible for establishing and maintaining disclosure controls andprocedures (as defined in Exchange Act Rules 13a-15(e) and 15d-15(e)) and internal control over financial reporting (asdefined in Exchange Act Rules 13a-15(f) and 15d-15(f)) for the registrant and have:
a) Designed such disclosure controls and procedures, or caused such disclosure controls and procedures to bedesigned under our supervision, to ensure that material information relating to the registrant, including itsconsolidated subsidiaries, is made known to us by others within those entities, particularly during the period inwhich this report is being prepared;
b) Designed such internal control over financial reporting, or caused such internal control over financial reporting tobe designed under our supervision, to provide reasonable assurance regarding the reliability of financial reportingand the preparation of financial statements for external purposes in accordance with generally acceptedaccounting principles;
c) Evaluated the effectiveness of the registrant’s disclosure controls and procedures and presented in this report our
conclusions about the effectiveness of the disclosure controls and procedures, as of the end of the period coveredby this report based on such evaluation; and
d) Disclosed in this report any change in the registrant’s internal control over financial reporting that occurred during the registrant’s most recent fiscal quarter (the registrant’s fourth fiscal quarter in the case of an annual report) that has materially affected, or is reasonably likely to materially affect, the registrant’s internal control over financial reporting; and
5. The registrant’s other certifying officer(s) and I have disclosed, based on our most recent evaluation of internal control overfinancial reporting, to the registrant’s auditors and the audit committee of the registrant’s board of directors (or personsperforming the equivalent functions):
a) All significant deficiencies and material weaknesses in the design or operation of internal control over financial
reporting which are reasonably likely to adversely affect the registrant’s ability to record, process, summarize and report financial information; and
b) Any fraud, whether or not material, that involves management or other employees who have a significant role inthe registrant’s internal control over financial reporting.
/S/ WARREN E. BUFFETT Chairman—Principal Executive Officer

EXHIBIT 31.2
Quarter ended September 30, 2016
Rule 13a-14(a)/15d-14(a) Certifications
CERTIFICATIONS
I, Marc D. Hamburg, certify that:
Date: November 4, 2016
1. I have reviewed this quarterly report on Form 10-Q of Berkshire Hathaway Inc.;
2. Based on my knowledge, this report does not contain any untrue statement of a material fact or omit to state a material factnecessary to make the statements made, in light of the circumstances under which such statements were made, notmisleading with respect to the period covered by this report;
3. Based on my knowledge, the financial statements, and other financial information included in this report, fairly present in allmaterial respects the financial condition, results of operations and cash flows of the registrant as of, and for, the periodspresented in this report;
4. The registrant’s other certifying officer(s) and I are responsible for establishing and maintaining disclosure controls andprocedures (as defined in Exchange Act Rules 13a-15(e) and 15d-15(e)) and internal control over financial reporting (asdefined in Exchange Act Rules 13a-15(f) and 15d-15(f)) for the registrant and have:
a) Designed such disclosure controls and procedures, or caused such disclosure controls and procedures to bedesigned under our supervision, to ensure that material information relating to the registrant, including itsconsolidated subsidiaries, is made known to us by others within those entities, particularly during the period inwhich this report is being prepared;
b) Designed such internal control over financial reporting, or caused such internal control over financial reporting tobe designed under our supervision, to provide reasonable assurance regarding the reliability of financial reportingand the preparation of financial statements for external purposes in accordance with generally acceptedaccounting principles;
c) Evaluated the effectiveness of the registrant’s disclosure controls and procedures and presented in this report our
conclusions about the effectiveness of the disclosure controls and procedures, as of the end of the period coveredby this report based on such evaluation; and
d) Disclosed in this report any change in the registrant’s internal control over financial reporting that occurred during the registrant’s most recent fiscal quarter (the registrant’s fourth fiscal quarter in the case of an annual report) that has materially affected, or is reasonably likely to materially affect, the registrant’s internal control over financial reporting; and
5. The registrant’s other certifying officer(s) and I have disclosed, based on our most recent evaluation of internal control overfinancial reporting, to the registrant’s auditors and the audit committee of the registrant’s board of directors (or personsperforming the equivalent functions):
a) All significant deficiencies and material weaknesses in the design or operation of internal control over financial
reporting which are reasonably likely to adversely affect the registrant’s ability to record, process, summarize and report financial information; and
b) Any fraud, whether or not material, that involves management or other employees who have a significant role inthe registrant’s internal control over financial reporting.
/S/ MARC D. HAMBURG Senior Vice President—Principal Financial Officer

EXHIBIT 32.1
Section 1350 Certifications
Quarter ended September 30, 2016
I, Warren E. Buffett, Chairman and Chief Executive Officer of Berkshire Hathaway Inc. (the “Company”), certify, pursuant to Section 906 of the Sarbanes-Oxley Act of 2002, 18 U.S.C. Section 1350, that to the best of my knowledge:
Dated: November 4, 2016
(1) the Quarterly Report on Form 10-Q of the Company for the period ended September 30, 2016 (the “Report”) fully complieswith the requirements of Section 13(a) or 15(d) of the Securities Exchange Act of 1934 (15 U.S.C. 78m or 78o(d)); and
(2) the information contained in the Report fairly presents, in all material respects, the financial condition and results ofoperations of the Company.
/S/ WARREN E. BUFFETT Warren E. Buffett
Chairman and Chief Executive Officer

EXHIBIT 32.2
Section 1350 Certifications
Quarter ended September 30, 2016
I, Marc D. Hamburg, Senior Vice President and Chief Financial Officer of Berkshire Hathaway Inc. (the “Company”), certify, pursuant to Section 906 of the Sarbanes-Oxley Act of 2002, 18 U.S.C. Section 1350, that to the best of my knowledge:
Dated: November 4, 2016
(1) the Quarterly Report on Form 10-Q of the Company for the period ended September 30, 2016 (the “Report”) fully complieswith the requirements of Section 13(a) or 15(d) of the Securities Exchange Act of 1934 (15 U.S.C. 78m or 78o(d)); and
(2) the information contained in the Report fairly presents, in all material respects, the financial condition and results ofoperations of the Company.
/S/ MARC D. HAMBURG Marc D. Hamburg
Senior Vice President and Chief Financial Officer

EXHIBIT 95
MINE SAFETY VIOLATIONS AND OTHER LEGAL MATTER DISCLOSURES PURSUANT TO SECTION 1503(a) OF THE DODD-FRANK WALL STREET
REFORM AND CONSUMER PROTECTION ACT
PacifiCorp and its subsidiaries operate coal mines and coal processing facilities and Acme Brick and its affiliates operate clay, shaleand limestone excavation facilities (collectively, the “mining facilities”) that are regulated by the Federal Mine Safety and Health Administration (“MSHA”) under the Federal Mine Safety and Health Act of 1977 (the “Mine Safety Act”). MSHA inspects mining facilities on a regular basis. The total number of reportable Mine Safety Act citations, orders, assessments and legal actions for thethree-month period ended September 30, 2016 are summarized in the table below and are subject to contest and appeal. The severityand assessment of penalties may be reduced or, in some cases, dismissed through the contest and appeal process. Amounts arereported regardless of whether PacifiCorp or Acme has challenged or appealed the matter. Clay and other reserves that are not yetmined and mines that are closed or idled are not included in the information below as no reportable events occurred at those locationsduring the three-month period ended September 30, 2016. PacifiCorp and Acme have not received any notice of a pattern, or notice ofthe potential to have a pattern, of violations of mandatory health or safety standards that are of such nature as could have significantlyand substantially contributed to the cause and effect of coal or other mine health or safety hazards under Section 104(e) of the MineSafety Act during the three-month period ended September 30, 2016. Mine Safety Act Total
Value of Proposed
MSHA Assessments
(in thousands)
Total
Number ofMining Related
Fatalities
Legal Actions
Mining Facilities
Section 104Significant
and Substantial Citations(1)
Section104(b)
Orders(2)
Section 104(d)
Citations/Orders(3)
Section110(b)(2)
Violations(4)
Section107(a)
ImminentDanger
Orders(5)
Pending as of Last
Day of Period(6)
InstitutedDuringPeriod
ResolvedDuringPeriod
Coal: Bridger (surface) 1 — — — — $ 1 — 7 1 — Bridger (underground) 13 — — — — 15 — 2 1 4 Wyodak Coal Crushing
Facility — — — — — — — — — — Clay, shale and limestone: Malvern — — — — — — — — — — Wheeler — — — — — — — — — — Fort Smith — — — — — — — — — — Oklahoma City — — — — — — — — — — Tulsa — — — — — — — — — — Denver — — — — — — — — — — Bennett — — — — — — — — — — Denton — — — — — — — — — — Elgin — — — — — — — — — — Sealy — — — — — — — — — — Texas Clay — — — — — — — — — — Leeds — — — — — — — — — — Montgomery — — 1 — — 5 — — — — Lueders — — — — — — — — — — Cordova — — — — — — — — — — (1) Citations for alleged violations of mandatory health and safety standards that could significantly or substantially contribute to the cause and effect of a safety or health hazard
under Section 104 of the Mine Safety Act. (2) For alleged failure to totally abate the subject matter of a Mine Safety Act Section 104(a) citation within the period specified in the citation. (3) For alleged unwarrantable failure (i.e., aggravated conduct constituting more than ordinary negligence) to comply with a mandatory health or safety standard. (4) For alleged flagrant violations (i.e., reckless or repeated failure to make reasonable efforts to eliminate a known violation of a mandatory health or safety standard that
substantially and proximately caused, or reasonably could have been expected to cause, death or serious bodily injury). (5) For the existence of any condition or practice in a coal or other mine which could reasonably be expected to cause death or serious physical harm before such condition or
practice can be abated. (6) Amounts include six contests of proposed penalties under Subpart C and two contests of citations or orders under Subpart B and one labor-related complaint under Subpart E
of the Federal Mine Safety and Health Review Commission’s procedural rules. The pending legal actions are not exclusive to citations, notices, orders and penalties assessedby MSHA during the reporting period.


![WASHINGTON, D.C. 20549 FORM 10-K · 2009-02-06 · united states securities and exchange commission washington, d.c. 20549 form 10-k (mark one) [x] annual report pursuant to section](https://img.pdfslide.net/doc/110x75/5f49dabfcc1717019c745f13/washington-dc-20549-form-10-k-2009-02-06-united-states-securities-and-exchange.jpg)

![Washington, D.C. 20549 SECURITIES AND EXCHANGE … · united states securities and exchange commission washington, d.c. 20549 form 10-q (mark one) [x] quarterly report pursuant to](https://img.pdfslide.net/doc/110x75/5f27a465e7a8ed5f2163b2a7/washington-dc-20549-securities-and-exchange-united-states-securities-and-exchange.jpg)