Embed Size (px)
Citation preview

Washington Recreational Boats: Economic Impact Research
Research Report
May 2011
Jim Hebert President
Jann Skotdal Research Analyst
Hebert Research, Inc. 13629 NE Bel-Red Road
Bellevue, WA 98005 www.hebertresearch.com
Phone (425) 643-1337 x112
Fax (425) 746-8138

Hebert Research, Inc. Page 2 Washington Recreational Boats: Economic Impact Research
Table of Contents
INTRODUCTION .............................................................................................................................................. 3
RESEARCH METHODOLOGY ........................................................................................................................... 6
OVERVIEW OF WASHINGTON STATE TAXES, FEES AND POLICIES ...............................................................11
COMPARISON OF TAXES, FEES AND POLICIES IN OTHER JURISDICTIONS ...................................................16
CURRENT RECREATIONAL BOAT POPULATION AND SALES IN WASHINGTON STATE .................................23
CURRENT RECREATIONAL BOAT-RELATED SPENDING IN WASHINGTON....................................................25
CURRENT ECONOMIC IMPACT OF RECREATIONAL BOATING IN WASHINGTON ........................................29
COMPARISON TO WASHINGTON STATE SKIING INDUSTRY ........................................................................33
ADDITIONAL RECREATIONAL BOAT ACTIVITY EXPECTED FROM PROPOSED LEGISLATION ........................35
PREDICTED ECONOMIC IMPACT OF PROPOSED LEGISLATION ....................................................................39
APPENDIX: ECONOMIC IMPACT OF WASHINGTON’S RECREATIONAL MARINE SECTOR ............................47

Hebert Research, Inc. Page 3 Washington Recreational Boats: Economic Impact Research
Introduction
Background and Research Goal Although Washington State enjoys some of the world’s most appealing boating waters,
the state is currently governed by some of the nation’s highest taxes on boat owners. In
addition to a sales tax on boats purchased within the state, Washington levies a use tax
on boats purchased elsewhere and used within the state for more than a few months
per year. These taxes cause many resident recreational boat owners to keep their
vessels and conduct all of their recreational boating activities out of state. Additionally,
they deter owners in other states from visiting Washington for extended cruising as well
as repair and maintenance work.
Two factors suggest that Washington’s current tax and fee policies for recreational
boats may be economically inefficient. First, although they are often casually dismissed
as toys for the rich, the spending required to purchase, equip, maintain and operate a
recreational boat has far-reaching economic effects. The diagram below illustrates
some of the expenditures that recreational boats require throughout their life cycle,
generating revenue, employment and taxes wherever they go.
Spending on Recreational Boats throughout Ownership Life Cycle

Hebert Research, Inc. Page 4 Washington Recreational Boats: Economic Impact Research
The second key factor is the inherently mobile nature of recreational boats. These
vessels can easily be moved from place to place, taking their economic activity with
them. Thus, Washington’s taxes may be driving away recreational boats that would
otherwise act as floating engines for the local economy.
Motivated by this concept, a bill is currently under consideration by the Washington
legislature. This measure would cap the taxable value of recreational boats at $300,000,
resulting in a maximum sales and use tax charge of about $28,500 for recreational boats
purchased or brought into the state. Additionally, the legislation would allow
recreational boats owned by out-of-state entities (such as corporations, trusts and LLCs)
access to two types to cruising permits, which are currently available only to vessels
owned by individuals. This change would allow these entity-owned vessels to remain in
the state for longer temporary periods without incurring use tax liability.
To determine what tax and fee policies can strike the ideal balance between revenue
generation and economic activity, it is necessary to understand the existing and
potential economic impact of recreational boats in Washington. Accordingly, this
research is intended to provide a quantitative estimate of the total economic impact on
Washington State resulting from recreational boats, including effects on employment
and tax base. Additionally, the research will estimate the economic impacts resulting
from changes in recreational boating activity resulting from the proposed legislation,
including the net effects on state tax revenues.

Hebert Research, Inc. Page 5 Washington Recreational Boats: Economic Impact Research
Research Objectives The research was designed to accomplish the following objectives:
Provide an overview of Washington’s current policies regarding taxes, fees, and
cruising permits with regard to recreational boats.
Discuss strategies being employed by both resident and non-resident
recreational boat owners to limit state taxes.
Compare the tax and fee policies of other coastal jurisdictions, especially the
other West Coast states and British Columbia.
Profile Washington’s recreational boat-related industries, with respect to
revenues, recreational boats served, employment, and compensation.
Describe measures taken by other states to reduce recreational boat-related
taxes and fees, and where possible, discuss the effect of these measures on
recreational boating activity and the state economy.
Assess the current level of recreational boat ownership and activity in
Washington, including:
o Number of registered vessels by length
o Average value
o Annual sales activity, both new and resale
o State revenues collected through taxes and fees assessed on recreational
boats
o Typical spending by recreational boat owners on a range of recreational
boat-related goods and services
Measure the total economic impact on the state from recreational boat-related
spending, including overall economic activity, employment, labor income, and
tax revenue.
Identify and categorize the recreational boats deterred from Washington due to
the current tax and fee policies.
Estimate the economic impact of an increase in Washington’s recreational boat
population and activity due to tax and fee changes.
Calculate the expected net change in the state’s tax revenues that would result
from tax and fee reforms, taking into account the loss of revenues from a tax
reduction and the gains in revenues from additional recreational boats and
recreational boating activity.
Summarize the total economic impact of Washington’s marine recreation sector,
including recreational boats as well as smaller vessels.

Hebert Research, Inc. Page 6 Washington Recreational Boats: Economic Impact Research
Research Methodology
Secondary Research
The secondary research component consisted of a review of existing data produced by a
range of private and public sector sources, including:
National Marine Manufacturers Association
Recreational Marine Research Council
Boat US (Boat Owners Association of the United States)
Northwest Marine Trade Association
Pacific Maritime Title
Washington State Department of Licensing
Washington State Department of Revenue
Agencies in other states responsible for boat registration and taxes
United States Coast Guard
United States Census Bureau
Secondary research was used to gather information topics including:
Recreational boat sales, registrations, purchase prices and assessed valuations
State policies regarding taxes, fees, cruising permits, etc.
Recreational boat-related industries: firm counts, employment, revenues, etc.
State revenues collected from taxes and fees on recreational boats
Methodologies and findings from other recreational marine economic impact
studies, including vessel spending profiles and total impacts
Key Person Interviews
Key person interviews were conducted with experts on the regional recreational boating
industry, as well as tax, fee and regulatory policies. Participants included recreational
boat brokers, attorneys and other specialists in recreational boat transactions,
representatives from other industries that serve recreational boats, and staff from the
state government agencies that administer the taxes and fees on Washington
recreational boats.

Hebert Research, Inc. Page 7 Washington Recreational Boats: Economic Impact Research
Recreational Boat-Related Business Survey
This research component consisted of a survey of businesses in 16 distinct sectors
involved in the state recreational boating industry. The business survey served to
collect data on per-recreational boat business revenues that could be cross-checked
against the results of the owner survey. Additionally, this survey obtained additional
information about the structure of the respective industries, such as employment
breakdowns and salary ranges, and the proportion of revenue derived from visiting
recreational boats based outside of the state.
British Columbia Recreational Boat Census and Statistical Sample
A physical census was conducted to confirm anecdotal accounts that a large number of
recreational boats owned by Washington residents were being moored in Vancouver
Island, as an alternative to paying Washington's use tax on recreational boats. The
objective of the census was to count, identify and categorize American recreational
boats moored at five marines in the Sydney, BC area:
Van Isle Marina
Port Sidney Marina
North Saanich Marina
Westport Marina
Canoe Cove Marina
Jim Hebert and a research analyst personally conducted the census with assistance from
a local recreational boat broker on February 14, 2011. It consisted of an inspection of all
visible recreational boats in the relevant size and class categories. Vessels were
identified as US-owned based on indicators such as the place of registration and hailing
port. Photographs were taken of all US boats for use in later analysis. After collection of
the data, vessel names and hailing ports were cross-checked against the Coast Guard
documented vessel database to obtain information on characteristics including length,
model, and age.
Additionally, a telephone survey was conducted among all other marinas in the
Vancouver, BC and Vancouver Island areas, to obtain summary information on
recreational boat occupancy. This information was combined with the categorization
obtained from the census to estimate the population of US recreational boats at other
Canadian marinas.

Hebert Research, Inc. Page 8 Washington Recreational Boats: Economic Impact Research
IMPLAN Economic Model
IMPLAN Professional is a computer based economic impact assessment modeling
system. Combined with the IMPLAN data file for a specific study area, it allows the user
to develop local level input-output models that can estimate the economic impact of a
new development and to assess the "ripple effects" caused by increasing or decreasing
expenditures in various parts of an economy.
The input-output analysis used by IMPLAN employs a two-stage modeling process:
1. Descriptive modeling
2. Predictive modeling
Descriptive Model The descriptive model is a representation of the existing interactions between economic
sectors within a given study area (e.g. Washington State, a county or combination of
counties). This model uses a system called regional economic accounts to describe a
local economy in terms of the flow of dollars from purchasers to producers within the
region. A descriptive model presents a detailed picture of each of more than 400
industry sectors, including data on total employment, sales, inputs used in production,
and interaction with economies outside the study area.
An additional layer of information called Social Accounting data is also added to the
model, allowing analysts to examine non-commercial transactions, such as payment of
taxes by businesses and households.
Predictive Model A Predictive Model assesses the total impact of an economic event on the overall
economy of the area being studied. The key concept behind the Predictive Model is
called a multiplier: using the descriptive model as a basis, the program calculates how
each dollar of a selected economic event will affect all other industries in the area.
Because of this linear nature of the multiplier, the economic impact can easily be scaled
to account for inputs of different sizes.
The impact of an economic stimulus can be broken down into three components: direct
effects, indirect effects, and induced effects. To illustrate each of these concepts,

Hebert Research, Inc. Page 9 Washington Recreational Boats: Economic Impact Research
suppose that a company decides to invest in Washington by constructing a new housing
development.
Direct effects represent the immediate impact of an economic change on the
industry directly involved. In the housing construction example, direct effects
would include gross revenues earned by the contractors working on the project.
Indirect effects represent the changes in inter-industry purchases as the
economy responds to the new demands of the directly affected industries.
Following the same example, local suppliers of construction materials would
increase their economic activities in order to meet new demand by the
contractors.
Induced effects represent the changes in spending from households as income
increases due to the changes in production. In the example, construction
workers would receive additional wages by working on the new housing project.
They would then spend a portion of those wages on consumer goods, such as
food, clothing, and entertainment, from other Washington businesses.
The effects stimulated by an example construction project are illustrated below:
Note: This diagram is for illustration purposes only, and is by no means an exclusive list of all economic effects.

Hebert Research, Inc. Page 10 Washington Recreational Boats: Economic Impact Research
Key Multipliers
The following table lists the multipliers used in the IMPLAN Washington State model for some of the major industry sectors affected by recreational boating activity.
Multipliers for Major Recreational Boat-Related Sectors
Industry Sector
Total Economic
Output Value Added
Direct Labor Income
Total Labor Income
Direct Employment
Total Employment
Boat building 1.77 0.74 0.26 0.51 4.50 9.52
Boat sellers (margin) 1.83 1.33 0.70 0.97 13.50 19.64
Fuel sales 1.68 1.24 0.51 0.73 12.60 17.60
Accessory and equipment sales 1.67 1.25 0.52 0.74 16.17 21.08
Maintenance and repair 1.78 0.83 0.32 0.57 9.19 9.48
Detailing and cleaning 1.91 1.01 0.39 0.65 16.85 22.34
Marinas 1.76 1.18 0.32 0.58 10.98 16.55
Use of this Report
Hebert Research has made every effort to produce the highest quality research product
possible within the agreed specifications, budget and time schedule. Hebert Research
uses those statistical techniques which, in its opinion, are the most accurate possible.
However, inherent in any statistical process is a possibility of error, which must be taken
into account in evaluating the results. Statistical research can predict respondent
attitudes and behavior only as of the time of the sampling, within the parameters of the
project, and within the margin of error inherent within the techniques used.
Evaluations and interpretations of statistical research findings, and decisions based on
them, are solely the responsibility of the customer and not that of Hebert Research.
The conclusions, summaries and interpretations provided by Hebert Research are based
strictly on the analysis of the data gathered and are not to be construed as
recommendations. Therefore, Hebert Research neither warrants their viability nor
assumes responsibility for the success or failure of any customer actions subsequently
taken based on these findings.

Hebert Research, Inc. Page 11 Washington Recreational Boats: Economic Impact Research
Overview of Washington State Taxes, Fees and Policies
The following section summarizes the tax and fee policies currently in effect in the State
of Washington with respect to recreational boats.
Sales and Use Tax
With certain exceptions, Washington law requires vessels sold or kept in the state to
register and pay a one-time sales and use tax. This requirement includes:
Washington residents must pay sales or use tax when they purchase a boat in-
state (new or used).
Washington residents must pay sales or use tax if they purchase a boat out of
state, and subsequently bring it into Washington.
Non-residents must pay sales or use tax when they purchase a boat in-state,
unless the boat departs the state within 45 days of purchase (can be extended
up to 12 months with a use permit).
Non-residents must pay sales or use tax if they bring a boat purchased out of
state for more than the allowed visiting period (discussed in detail below).
Application of Sales v. Use Tax
Sales tax is collected by the Department of Revenue on transactions conducted by an
entity authorized to collect the tax, such as a boat dealership. Both new and resale
transactions are subject to sales tax.
Use tax is collected by the Department of Licensing concurrently with vessel
registration, and applies to all transactions where sales tax was not collected. The most
common scenarios for use tax include:
Private party transactions, such as the sale of a recreational boat through a
classified ad
Sales conducted through a buyer and/or seller’s broker, where the transaction is
closed directly between a buyer and seller
Taxes assessed when a boat originally purchased out-of-state is brought into
Washington

Hebert Research, Inc. Page 12 Washington Recreational Boats: Economic Impact Research
Sales and Use Tax Rates
The standard sales tax rate is applied to both sales and use tax transactions. This
consists of the state base rate, plus additional charges in certain counties and cities.
Although the tax rates are the same for both sales and use tax within a given
jurisdiction, different criteria are used in determining the jurisdiction of the transaction,
and hence the applicable tax rate. Sales tax transactions are judged to occur at the
place of purchase (i.e. where the new owner assumes control of the vessel). Use taxes,
however, are levied based on the location where the vessel is primarily kept. As will be
discussed later in this report, this discrepancy results in transactions designed to achieve
the most favorable tax rate.
If an owner purchased a vessel out of state and paid sales or use tax on the original
purchase, he or she may deduct the amount of the tax originally paid from the use tax
owed.
Taxes on Nonresident Visitors
As discussed above, a non-Washington resident who brings an out-of state boat (a boat
registered in another state or documented through the Coast Guard) into Washington
must pay use tax if the vessel remains in Washington for a sufficient length of time. This
applies even if the vessel is only visiting, with no intention to permanently locate in the
state. Unless an additional permit is obtained, out-of-state vessels incur use tax liability
if they are present within Washington for more than 60 days per calendar year.
Currently, two types of permits are available to extend this period. However, the
permits are available only for boats owned by individuals; those owned by entities (e.g.,
corporations, LLCs or trust) must adhere to the 60 day limit.
Cruising Permits extend the tax-free period by 60 days. Up to two cruising
permits may be obtained per calendar year, allowing a vessel to remain in the
state for a total of 180 days without registering or paying use tax. A nominal fee
is charged for cruising permits.
Use Permits allow a vessel to remain in-state for an entire year without
registering or paying use tax. The cost of the user permit is higher than cruising
permits, at $500 (for boats under 50 feet) or $800 (50 feet or longer). In
addition, for 24 months after the permit expires, the vessel may not return to
Washington at all.

Hebert Research, Inc. Page 13 Washington Recreational Boats: Economic Impact Research
Additional Taxes and Fees
Washington-registered vessels are required to renew their registration each year. In
addition to a nominal boat registration fee, owners must pay an excise tax equal to 0.5%
of the vessel’s assessed value. Various other fees, such as an invasive species charge,
may apply depending on the location and type of boat. Vessels documented with the
US Coast Guard are not required to register, but still must pay the excise tax and submit
annual paperwork to the Washington State Department of Licensing (DOL).
Measures Undertaken to Limit Taxes and Fees
The key person interviews and secondary research revealed several strategies that
recreational boat owners may employ to limit the taxes and fees they pay on their
vessels.
Nonpayment of Taxes
The simplest way to have a boat in Washington without paying the assessed taxes and
fees is to never register one’s boat or send the required payment. This is generally not
possible for a vessel purchased from in-state dealer, who would collect sales taxes
and/or report the transaction to DOL. However, for private party purchases and vessels
brought into the state, it is up to the owner to initiate the registration process. An
owner of an unregistered vessel naturally runs the risk of having the unregistered boat
noticed by authorities such as the Department of Revenue (DOR) and local law
enforcement. Thus, this technique is presumably most common for vessels kept at
private docks, rather than marinas or other public areas where observation is more
likely.
Due to the inherent lack of documentation, it is uncertain how many vessels are
currently employing this strategy. A 2004 Seattle P-I article on the subject estimated
that 10% to 20% of large vessels failed to pay the annual excise tax, either intentionally
or inadvertently, but noted that increased enforcement had sharply reduced the rate of
nonpayment since the 1980s. However, violations still remain: in 1998, a prominent
software executive was caught keeping his untaxed 62-foot recreational boat at his
Mercer Island home, and the next year a 58-foot California-based vessel was cited in
Roche Harbor for staying too long in-state without registering.

Hebert Research, Inc. Page 14 Washington Recreational Boats: Economic Impact Research
Delivery Outside State Water Boundary
The formal transfer of recreational boat ownership is often conducted offshore, outside
of the three-mile boundary of Washington territorial waters. Because such transactions
do not occur within the state of Washington, they provide the following advantages:
If a Washington resident purchases the recreational boat for use in-state, the
transaction will be governed by use tax instead of sales tax. Since use tax is
based on the jurisdiction where the vessel will be primarily kept, this may result
in a reduced tax rate. For example, on a recreational boat purchased offshore
and then moored in Anacortes, the applicable use tax rate would be 8.2%. If the
same recreational boat were purchased in Seattle and then moved to Anacortes,
a 9.5% sales tax rate would have applied.
A Washington resident cannot purchase a boat in Washington without paying
sales tax, even if the boat would be immediately moved out of state. However, a
Washington resident could purchase a Washington boat outside of territorial
waters, and then move it to a permanent out of state home such as British
Columbia. No tax would be required under this scenario.
Finally, out-of state buyers may elect to take possession outside of territorial
waters, even if the boat would leave the state within the grace period. This is
generally done to eliminate the need for the paperwork that would be required
to establish the tax-exempt status of the transaction.
Commercial Charter Service
A recreational boat may be registered as a commercial charter vessel. In this case, a
different set of tax structures and regulations apply. Taxes are based on the revenues of
the charter operation, personal property tax applies rather than excise tax, certain
expenses are tax-deductible, etc. However, to legally qualify, the vessel must have bona
fide use as a charter vessel. Owners may use the recreational boat for recreation only if
on an equal footing with other customers; uses must be recorded and taxed as
transactions.
Although chartering of recreational boats is not uncommon, expert accounts suggest
that owners primarily charter their vessels for the actual revenue received, rather than
the tax consequences.
Recreational Boating Outside of Washington
The most economically significant way that recreational boat owners respond to
Washington’s sales and use taxes on recreational boats is to simply not bring their

Hebert Research, Inc. Page 15 Washington Recreational Boats: Economic Impact Research
vessels into the state. As this report will discuss in greater detail, numerous Washington
residents never bring their recreational boats to their home state. Moreover,
nonresidents who might otherwise spend several months in the state for cruising or
maintenance work are deterred by the prospect of paying significant taxes to a state in
which they are only temporary visitors.
British Columbia is a particularly attractive alternative to Washington for recreational
boat owners deterred in this way, due to the lack of any comparable tax, a relatively
short travel distance, and attractive cruising destinations such as the Vancouver Island,
the Gulf Islands, and the Inside Passage leading to Alaska.

Hebert Research, Inc. Page 16 Washington Recreational Boats: Economic Impact Research
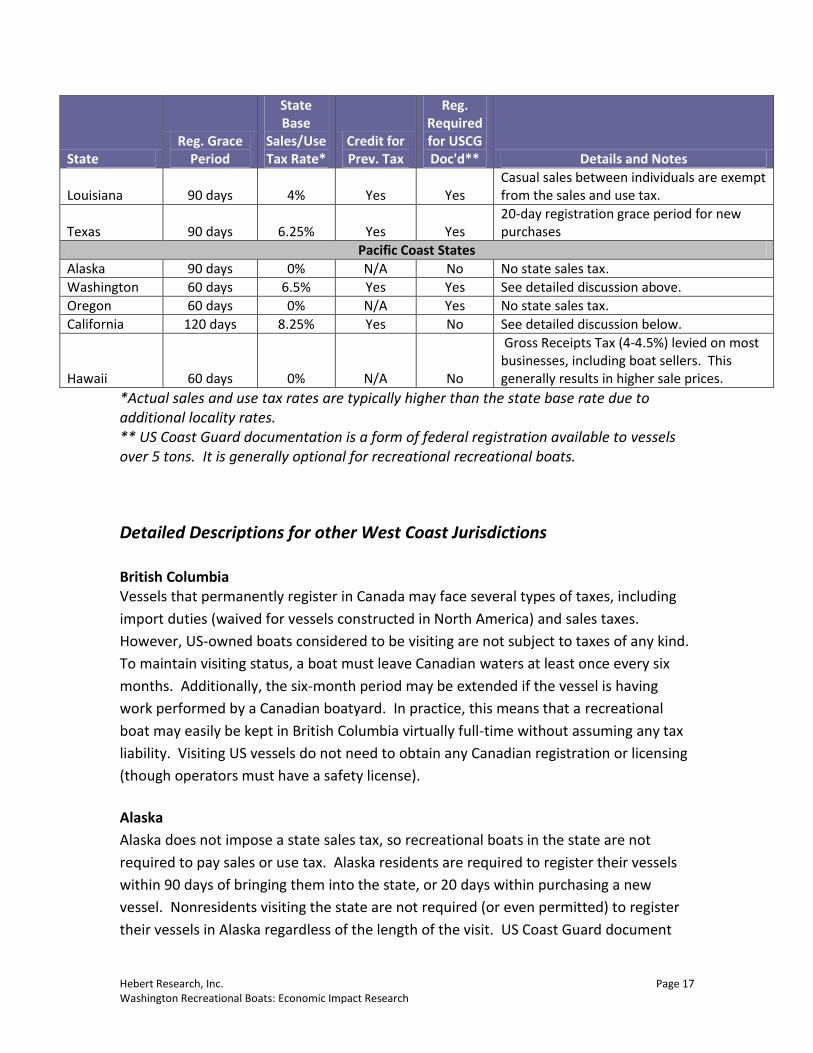
Comparison of Taxes, Fees and Policies in Other Jurisdictions
Summary of U.S. Coastal States
The table below summarizes the vessel registration, tax and fee policies in other coastal
U.S. states. Some other states’ policies are highly complex, so exceptions may apply to
the general rules stated below. In addition, taxes and fees assessed at state, county,
and other local levels may differ from the prevailing statewide rates, or impose
additional charges such as personal property taxes.
More detailed descriptions follow for the West Coast states of Alaska, Oregon, and
California, as well as selected other states which have altered their tax policies.
State Reg. Grace
Period
State Base
Sales/Use Tax Rate*
Credit for Prev. Tax
Reg. Required for USCG Doc'd** Details and Notes
Atlantic and Gulf Coast States
Maine 60 days 5% Yes Yes 2% sales/use tax for nonresident boats. See detailed discussion below.
New Hampshire 30 days 0% N/A Yes No state sales tax
Massachusetts 60 days 6.25% Yes No
Rhode Island 90 days 0% N/A Yes Sales/use tax on boats repealed in 1993. See detailed discussion below.
Connecticut 60 days 6% Yes Yes
New York 90 days 8.75% Yes Yes Exemption for vessels brought in for repair.
New Jersey 180 days 7% Yes Yes
Delaware 60 days 0% N/A No No state sales tax.
Maryland 90 days 5% Yes Yes 5% use tax applies to nonresident boats used primary in MD.
Virginia 90 days 2% Yes No Sales/use tax liability capped at $2,000.
North Carolina 90 days 3%* Yes No No sales tax on used boats. New boat tax value capped at $1,500.
South Carolina 60 days 5% Yes No
Sales/use tax liability capped at $300. Up to 10.5% property tax; see detailed discussion below.
Georgia 60 days 4% Yes Yes
Florida 90 days 6% Yes Yes
Sales tax is capped at $18,000. Vessels brought into the state for repair exempt from registration requirement.
Alabama 90 days 2% Yes Yes
Mississippi 60 days 7% Yes No
Hebert Research, Inc. Page 17 Washington Recreational Boats: Economic Impact Research
State Reg. Grace
Period
State Base
Sales/Use Tax Rate*
Credit for Prev. Tax
Reg. Required for USCG Doc'd** Details and Notes
Louisiana 90 days 4% Yes Yes Casual sales between individuals are exempt from the sales and use tax.
Texas 90 days 6.25% Yes Yes 20-day registration grace period for new purchases
Pacific Coast States
Alaska 90 days 0% N/A No No state sales tax.
Washington 60 days 6.5% Yes Yes See detailed discussion above.
Oregon 60 days 0% N/A Yes No state sales tax.
California 120 days 8.25% Yes No See detailed discussion below.
Hawaii 60 days 0% N/A No
Gross Receipts Tax (4-4.5%) levied on most businesses, including boat sellers. This generally results in higher sale prices.
*Actual sales and use tax rates are typically higher than the state base rate due to additional locality rates. ** US Coast Guard documentation is a form of federal registration available to vessels over 5 tons. It is generally optional for recreational recreational boats.
Detailed Descriptions for other West Coast Jurisdictions
British Columbia Vessels that permanently register in Canada may face several types of taxes, including
import duties (waived for vessels constructed in North America) and sales taxes.
However, US-owned boats considered to be visiting are not subject to taxes of any kind.
To maintain visiting status, a boat must leave Canadian waters at least once every six
months. Additionally, the six-month period may be extended if the vessel is having
work performed by a Canadian boatyard. In practice, this means that a recreational
boat may easily be kept in British Columbia virtually full-time without assuming any tax
liability. Visiting US vessels do not need to obtain any Canadian registration or licensing
(though operators must have a safety license).
Alaska
Alaska does not impose a state sales tax, so recreational boats in the state are not
required to pay sales or use tax. Alaska residents are required to register their vessels
within 90 days of bringing them into the state, or 20 days within purchasing a new
vessel. Nonresidents visiting the state are not required (or even permitted) to register
their vessels in Alaska regardless of the length of the visit. US Coast Guard document

Hebert Research, Inc. Page 18 Washington Recreational Boats: Economic Impact Research
vessels are also not required to register. Vessel registration costs $24 for powered
vessels and $10 for non-powered vessels, and is effective for a three-year period.
Oregon
Similarly, Oregon does not assess a state sales tax, meaning that there is no comparable
use tax. Oregon residents must register their vessels with the state within 60 days of
purchase or entry. USCG documented vessels are required to register if they are
“primarily used in Oregon waters.” Registration is effective for two years, with a cost of
$5 plus $3 per linear foot (for example, a 40 foot recreational boat would pay $125).
California
California’s registration, tax and fee requirements are relatively complex, and have
changed several times in recent years. Like Washington, California assesses a sales tax
consisting of a statewide base rate (8.25%) and additional rates for certain cities and
counties. The highest total rate in the state, 9.75%, applies to the greater Los Angeles
area.
Sales tax applies to all recreational boat purchases taking place within the state – even
for vessels purchased by nonresidents who intend to move the vessel out of state.
Thus, transactions outside the state’s territorial boundaries are quite common.
Use tax may be required for a boat that is brought into California within 365 days of the
purchase date (vessels brought in after one year are fully exempt). However, use tax
only applies if the vessel is intended to be used primarily in California. The following
criteria are generally used to determine whether a boat is intended for California use
and therefore subject to use tax:
For California residents, use tax is presumed to apply if the vessel ever enters the
state within 12 months of purchase.
For nonresidents, use tax is presumed to apply if the vessel remains in California
for more than half of the first 12 months of ownership.
An exemption can be obtained if the owner presents credible evidence that the
vessel is intended for use primarily out-of-state, such as registration in another
state.
Vessels are also exempt if brought into the state for repair, retrofit or
modification, and used no more than 25 hours for recreational or incidental
purposes.
Instead of the “12 month rule” described above, California previously used a 90-day
period to determine whether use tax was owed. This lead to a common practice where

Hebert Research, Inc. Page 19 Washington Recreational Boats: Economic Impact Research
recreational boat buyers would purchase their boats outside of California waters and
wait 90 days before returning to the state. Ensenada, Mexico was a particularly popular
destination for this so-called “90 day yacht club,” a term coined by a guidebook
explaining the procedure. In 2004 the California legislature lengthened the required
period from 90 days to 12 months, but this measure expired in 2007 without being
renewed, providing a brief return for the 90-day rule. However, the California
legislature re-enacted the 12 month rule in 2008, this time with no sunset provision.
Additionally, vessels in California are subject to personal property taxes. The tax rate
depends on jurisdiction, but the prevailing rate is approximately 1.2% of assessed value.
A vessel registered in other states must be registered in California within 120 days of
entry if it “will be used upon California waterways the majority of the time.” Coast
Guard documented vessels are not required to register.
Reforms Conducted in Selected Other States
The following accounts involve other states that have reformed their registration, tax
and fee policies in order to increase recreational boating activity. States are listed in
chronological order of the reforms, from oldest to newest.
Rhode Island
In 1993, Rhode Island repealed all sales and use taxes on recreational boats. This has
established the state as a popular mooring location for recreational boats owned by
residents of other Northeastern states. As an appraisal of Rhode Island marinas
performed by Thomas M. Ross explains:
[A]pproximately one-third of the State's boat registrations is owned by out-of-
staters. Rhode Island eliminated the sales tax on used or new boats in 1993.
Since that time, dockage space has become scarce in the state, as it is now seen
as a sales tax haven for boat buyers, many of them from Connecticut and New
York. To avoid paying sales tax on a boat, a buyer must purchase, register, and
keep the vessel here. The economic benefits of this tax law has [sic] been broad
to the local economy.”
As the following table shows, the per capita boat registration rate in Rhode Island is
substantially higher than in surrounding states. Rhode Island has a total of 42,524 total
registered boats, but would only be expected to have 27,490 based on the rates seen in

Hebert Research, Inc. Page 20 Washington Recreational Boats: Economic Impact Research
nearby sates. This is consistent with Mr. Ross’ finding that 30% of boats registered in
Rhode Island are owned by nonresidents.
State Boat Registrations
per Capita Rhode Island 0.0404
Connecticut 0.0220
Massachusetts 0.0314
New York 0.0248
Avg. other States 0.0261
According to a 2007 Recreational Marine Research Council economic impact analysis,
the total impact of the state's recreational marine industry provides $416 million in
revenues and more than 3,500 jobs. Of this total activity, $147 million in spending and
over 1,200 jobs can be attributed to Rhode Island’s boat surplus (the number of
registrations above what would be expected based on surrounding state’s per capita
ownership rates). Rhode Island’s tax policies are likely not the only driver of the
unusually large fleet of registered boats – the “Ocean State” has a strong nautical
heritage and close access to water throughout– but the favorable financial conditions
are undoubtedly a significant factor in attracting boats.
Rhode Island’s tax-free status briefly made political news in 2010 when it emerged that
Massachusetts Senator John Kerry kept his 76-foot recreational boat moored in Rhode
Island rather than his home state. Sen. Kerry issued a statement that the boat was kept
in Rhode Island "for long-term maintenance, upkeep and charter purposes," but
voluntarily paid Massachusetts the $500,000 the state would have charged in taxes.
South Carolina
South Carolina imposes a low sales and use tax (capped at only $300). However,
personal property tax rates in the state are extremely high, with annual charges of up to
10.5% of a vessel’s assessed value. In an effort to offset the high cost imposed by the
personal property tax rate, several South Carolina counties have enacted reforms within
the last five years. Some have altered the tax structure so that only a portion of the
vessel’s value is subject to tax assessment. Additionally, many counties have also
extended the nontaxable visiting period for recreational boats registered out of state
from 60 to 180 days. However, many recreational boat owners reportedly still keep
their boats in state for only 179 days per year.

Hebert Research, Inc. Page 21 Washington Recreational Boats: Economic Impact Research
Statewide vessel registration and sales data has not shown a noticeable effect of these
changes; in fact, sales and registrations have generally been decreasing since 2007.
However, the tax and fee reforms were only conducted in some jurisdictions, and even
under some of the more lenient rules – 180 visiting days allowed, and a reduced
property tax valuation – a high annual property tax charge is still imposed. Additionally,
the current recession has caused a steep nationwide fall in boat activity, which would
tend to overshadow any gains made. Finally, nearby states such as North Carolina and
Florida both offer more favorable tax and fee structures for recreational boats. Thus, it
appears that the moderate reforms made in South Carolina are unlikely to lead to major
increases in the recreational boat population.
Maine
Maine imposes sales tax on nonresidents who purchase a boat in Maine and keep it in-
state for more than 30 days. Additionally, the state applies a use tax to vessels used in
Maine within one year of purchase, similar to the policy in California In 2010, in an
effort to attract visiting recreational boats, the sales tax rate for vessels registered in
other states was reduced from 5% (the same rate charged to in-state vessels) to 2%.
Florida
The Florida marine industry recently organized a campaign to reduce the state's taxes
on recreational boats, arguing that this would create new jobs and tax revenue by
attracting these vessels, and all their associated economic activity, to the state. A study
was commissioned to assess the state of megayacht-related industries in Florida and
measure the impact they provide to the state. The study found that each visiting
megayacht provided about $488,000 in revenue to South Florida. On the whole, these
vessels provided $220 million in annual revenue to South Florida maintenance and
repair providers, and an additional Brokerage and charter commissions provided an
additional $150 million in revenue. Furthermore, a single charter megayacht based in
Florida would contribute $2.6 million directly to the local economy, and $5.1 million
including secondary effects.
In the summer of 2010, the state passed the Jobs for Florida Bill, which included a
measure capping the state sales tax on recreational boats at $18,000 ($300,000
maximum taxable value, at 6% sales tax rate).
The author of the megayacht economic impact study has reported that it is too early to
quantitatively assess the effectiveness of the tax cap legislation. However, anecdotal
accounts suggest that Florida recreational boat brokers have seen a substantial increase
in sales, both to Americans planning to keep their vessels in-state, and to international

Hebert Research, Inc. Page 22 Washington Recreational Boats: Economic Impact Research
buyers interested in flagging their recreational boats in a location with advantageous tax
policies.

Hebert Research, Inc. Page 23 Washington Recreational Boats: Economic Impact Research
Current Recreational Boat Population and Sales in Washington
State
Population of Recreational Boats Registered in Washington
The following table reports the registered population of recreational boats in
Washington State, including US Coast Guard documented vessels. Also included is the
average assessed value for each length class, based on the number of vessels and the
total excise tax assessed.
This report focuses on the current potential economic impacts of those recreational
boats that would be affected by the proposed tax cap legislation – i.e., those valued at
over $300,000. Among the fleet existing vessels, this valuation level generally coincides
with a length of 50 feet or greater. Of course, some newer and/or higher quality
recreational boats of less than 50 feet are likely to exceed this threshold, and some large
vessels are likely to be worth less than $300,000, but these outliers should roughly
cancel out. Washington Department of Licensing data indicates that 1,000 such vessels
were registered in the state in 2010. This figure is used as the basis for the economic
impact estimates.
2010 Washington Recreational Boat Registrations
Vessel Length Registered Vessels Avg. Est. Value 35-40 ft 4,979* $98,511
41-45 ft 2,213* $149,208
46-50 ft 1,086* $237,996
51-55 ft 425 $373,151
56-60 ft 244 $534,282
61-65 ft 172 $755,853
66-70 ft 53 $1,038,823
71-75 ft 35 $1,230,561
76-80 ft 34 $1,509,931
81-85 ft 13 $1,780,124
Over 85 ft 24 $2,436,431
Total 35-50 ft 8,278 $130,363
Total Over 50 ft 1,000 $650,042
Total 9,278 $186,375
*not included in the total impact calculations

Hebert Research, Inc. Page 24 Washington Recreational Boats: Economic Impact Research
Recreational Boat Sales in Washington
The number of recreational boat sales is based on NMTA data for the most recent 4-
quarter period available (Q4 2009 to Q3 2010). Price estimates for new sales are based
on NMMA data on recreational boat retail prices by vessel length. Estimates for resale
prices are based on vessel assessed valuations and a database of Washington state
transactions. Note that the average retail prices of all recreational boats 35 feet or
longer exceed the threshold of $300,000. However, based on assessed value, used sales
of the same length classes do not reach this threshold. Therefore, sales of new
recreational boats between 35 and 50 feet in length are included in the population that
would be affected by the proposed legislation, but resale vessels in these length classes
are not.
Recreational Boat Sales for Most Recent 4-Quarter Period (Q4 2009-Q3 2010)
Vessel Length New Sales Used Sales Total Sales
Est. Sales Revenue
35-38 ft 33 213* 246 $35,272,326
39-42 ft 21 161* 182 $31,550,355
43-46 ft 8 62* 70 $14,030,357
47-50 ft 13 36* 49 $16,411,857
51-54 ft 7 23 30 $14,969,365
55-58 ft 4 7 11 $7,309,019
59-62 3 11 14 $12,269,686
63-66 0 4 4 $3,391,182
67-70 4 3 7 $21,165,537
Over 70 feet 3 29 32 $53,246,034
Total over 35 ft 96 549 645 $209,615,718
Total 35-50 ft 75 472 547 $97,264,896
Total over 50 ft 21 77 98 $112,350,823
Total over $300,000 96 77 152 $150,531,676
*not included in the total impact calculations

Hebert Research, Inc. Page 25 Washington Recreational Boats: Economic Impact Research
Current Recreational Boat-Related Spending in Washington
Spending by Washington-Based Recreational Boats
This section estimates the total spending by the owners of Washington recreational
boats with market values of $300,000 or more. Average per-recreational boat spending
figures are derived from three sources: the recreational boat owner survey, the business
survey (where appropriate), key person interviews with industry experts, and a model of
boat spending published by the Recreational Marine Research Council.
The recreational boating economy is characterized by a relatively small number of very
large vessels, or “megayachts,” whose spending may be orders of magnitude greater
than moderately-sized recreational boats. These outliers make it difficult to accurately
estimate the overall average spending for recreational boats using a single point
average. Therefore, other than for initial costs, the recreational boat population and
spending profiles have been stratified into two tiers: recreational boats between 50 and
85 feet, and vessels 85 feet and larger.
The expenditures are grouped into three categories:
1. Initial costs are one-type expenditures associated with purchasing a new boat,
other than the purchase price (discussed in the previous section). The per-
recreational boat average was multiplied by the total number of new and used
recreational boat sales to produce total statewide spending.
Initial Costs
Expenditure Type Average Per Recreational Boat Total Annual Spending
Initial Outfitting and Upgrades $39,273 $6,558,591
Transportation and Delivery $7,452 $1,244,484
Total $46,725 $7,803,075

Hebert Research, Inc. Page 26 Washington Recreational Boats: Economic Impact Research
2. Annual ownership costs are expenditures required to keep and maintain a
vessel, such as permanent moorage, insurance and routine maintenance. Total
spending figures refer to the entire expenditures of the 1,000-recreational boat
fleet currently registered in Washington.
Annual Ownership Costs
Expenditure Type
Average Per Recreational
Boat: 50-85 Feet
Average Per Recreational Boat:
85+ Feet Total Annual
Spending
Insurance $3,637 $9,746 $3,783,616
Permanent Moorage $5,366 $14,700 $5,590,016
Surveying and Inspection $589 $958 $597,856
Maintenance and Repair $30,397 $99,580 $32,057,392
Detailing and Cleaning $1,818 $7,309 $1,949,784
Chandlery, Accessories and Electronics
$3,959 $13,409 $4,185,800
Total $45,766 $145,702 $48,164,464
The next table provides a detailed breakdown of the individual maintenance cost
estimations used to reach the total average maintenance costs reported above.
Item
Frequency (Years)
Average Cost Per Job Prorated Annual Cost
50-85 ft 85+ ft 50-85 ft 85+ft
Haulout, power wash, etc. 1.5 $3,000 $6,000 $2,000 $4,000
Incidental repairs during haulout (prop, blisters, etc) 1.5 $3,000 $6,000 $2,000 $4,000
Painting 8 $84,500 $130,000 $10,563 $16,250
Teak work 8 $7,000 $35,000 $875 $4,375
Major upgrade/refit 15 $100,000 $500,000 $6,667 $33,333
Major maintenance (cooling, etc) 7 $15,000 $60,000 $2,143 $8,571
Annual engine/generator service 1 $2,750 $10,000 $2,750 $10,000
Engine overhaul (1% of fleet per year) $225,000 $1,125,000 $2,250 $11,250
Generator overhaul 10 $8,000 $50,000 $800 $5,000
Stabilizer/thruster install (1% of fleet per year) $10,000 $80,000 $100 $800
Stabilizer/thruster service 4.00 $1,000 $8,000 $250 $2,000

Hebert Research, Inc. Page 27 Washington Recreational Boats: Economic Impact Research
Total $30,397 $99,580
3. Operating costs are expenditures incurred when using the recreational boat,
such as fuel, guest moorage and provisions. The estimates were obtained by
combining each owner’s daily spending on each expense category and the
average number of days per the vessel is operated within Washington. Again,
the total spending refers to the aggregate expenditures of the 1,000 vessels
registered in-state
Annual Operating Costs
Expenditure Type
Average Per Recreational
Boat: 50-85 Feet
Average Per recreational Boat:
85+ Feet Total Annual
Spending
Fuel $6,122 $23,264 $6,533,408
Guest Moorage $2,154 $6,915 $2,268,264
Hotels $13 $176 $16,912
Restaurants $2,783 $12,252 $3,010,256
Air Transportation $932 $1,544 $946,688
Ground Transportation $115 $3,594 $198,496
Entertainment and Recreation
$455 $1,760 $486,320
Grocery and other retail $4,994 $17,442 $5,292,752
Crew costs $0 $82,590 $1,982,160
Total $17,568 $149,537 $20,735,256

Hebert Research, Inc. Page 28 Washington Recreational Boats: Economic Impact Research
Spending by Visiting Recreational Boats No official data is kept on the number of out-of state recreational boats that visit
Washington each year. According to the Department of Licensing, 241 cruising permits
were issued to visiting vessels in 2010. However, as discussed previously, visiting vessels
only need to obtain a cruising permit if they remain in-state for more than 60 days in a
given year.
Estimates of visiting recreational boat spending were obtained through the business
survey, in which businesses reported the percent of their recreational boat-related
revenues derived from visiting out-of-state recreational boats. This ratio was compared
to the in-state recreational boat spending totals reported above, resulting in the
following estimates of total spending for visiting recreational boats.
Total Spending by Visiting Recreational Boats
Expense Category Total Visiting Recreational Boat Spending
Guest moorage $637,158
Chandlery $1,046,450
Fuel $1,156,484
Restaurant $3,533,779
Grocery and other retail $6,213,231
Maintenance $4,790,184
Detailing $216,643
Surveying $81,526
Total $17,675,455

Hebert Research, Inc. Page 29 Washington Recreational Boats: Economic Impact Research
Current Economic Impact of Recreational Boating in Washington
The following section reports the total economic impacts resulting from the existing
recreational boat activities and spending described above, as determined by the
IMPLAN model.
Economic Output Impacts
As discussed above, recreational boats in Washington Sate are responsible for $244.2
million in direct economic activity, including vessel sales, ownership and operating costs,
as well as spending by visiting recreational boats. Indirect and induced spending
generates an additional $98.9 million in annual activity, for a total economic impact of
$343.1 million per year. Value added (economic output minus the cost of intermediate
inputs, such as supplies consumed) comprises $124.3 million of the total economic
activity.
Expenditure Type Direct Indirect Induced Total Output
Boat Sales and Initial Costs $157,633,725 $8,473,414 $24,473,071 $190,580,210
Annual Ownership Costs $48,164,464 $16,950,860 $19,813,457 $84,928,782
Operating Costs $20,735,256 $5,459,988 $10,353,994 $36,549,237
Visiting Recreational Boats $17,675,460 $5,090,491 $8,255,778 $31,021,729
Total $244,208,905 $35,974,753 $62,896,300 $343,079,958

Hebert Research, Inc. Page 30 Washington Recreational Boats: Economic Impact Research
Expenditure Type Total Value
Added
Boat Sales and Initial Costs $35,462,720
Annual Ownership Costs $45,079,544
Operating Costs $24,542,193
Visiting Recreational Boats $19,196,832
Total $124,281,289

Hebert Research, Inc. Page 31 Washington Recreational Boats: Economic Impact Research
Employment Impacts
About 1,250 people in Washington are employed in industries directly serving
recreational boats. Including secondary effects, recreational boats are responsible for
creating 1,923 total jobs. These positions will generate a total of $110.2 million in labor
income.
Region Direct
Employment
Total Employment
Impact Direct Labor
Income Total Labor
Income
Boat Sales and Initial Costs 455.2 685.4 $24,734,504 $35,462,720
Annual Ownership Costs 313.3 557.2 $16,330,990 $28,711,213
Operating Costs 264.7 373.8 $9,868,210 $14,969,364
Visiting Recreational Boats 216.6 306.9 $17,675,460 $31,021,729
Total 1249.8 1923.3 $68,609,164 $110,165,026
Tax Impacts
Recreational Boat Sales, Use Taxes and Registration Fees The Department of Licensing collected about $3.25 million in taxes and fees from
recreational boats valued at $300,000 or more in 2010, including registration fees,
excise taxes, and use taxes. Additionally, DOR collected an estimated $8.11 million in
sales tax on sales of new $300,000+ recreational boats, and $6.19 million on resale
transactions over the same value threshold. Thus, the two agencies levied a total of
$17.55 million in direct taxes and fees on recreational boats.

Hebert Research, Inc. Page 32 Washington Recreational Boats: Economic Impact Research
Taxes from Recreational Boat Spending and Secondary Effects The one-time, annual and operating expenditures by recreational boat owners provide
the state with tax revenues through a variety of additional channels, including:
Retail sales tax on goods purchases and select services
Leasehold tax on moorage
B&O taxes on all business activity, including boat sellers
Excluding sales taxes on vessels, which were included above, direct business taxes
provide an estimated $8.5 million in annual revenue to state and local government.
Additionally, the indirect and induced effects of recreational boat spending generate a
second round of own tax revenues, totaling approximately $5.4 million per year.
Total Tax Revenues The following table summarizes the tax revenue effects discussed above. In total, the
recreational boating industry is responsible for about $31.5 million in tax revenue each
year.
State Tax Impact of Current Recreational Boats
Category Annual Tax
Revenue
Sales Taxes on Boat Purchases $14,289,268
Taxes and Fees Collected by DOL $3,246,195
Taxes on Direct Spending (excl. boat seller sales tax) $8,545,076
Taxes on Indirect and Induced Spending $5,396,653
Total Tax Revenue $31,477,192

Hebert Research, Inc. Page 33 Washington Recreational Boats: Economic Impact Research
Comparison to Washington State Skiing Industry
The following section compares the current Washington State recreational boating industry to the Washington State skiing industry.
Economic Output Impacts
Though similar in terms of direct output, the recreational boating and skiing industry differ greatly in terms of indirect and induced output. The Washington State skiing industry has a direct economic output of $244.50 million, which is comparable to the recreational boating industry’s direct economic output of $244.21 million. Washington’s skiing industry produces more indirect and induced output, valuing $143.60 and $266.70 million respectively, compared to the recreational boating industry’s $35.97 million of indirect output and $62.90 million of induced output. This leads to a higher total output of the skiing industry than the recreational boating industry, at $664.80 and $343.08 million respectively.
Total Economic Output (in Millions of Dollars)
Industry Direct Indirect Induced Total Output
Recreational Boating $244.21 $35.97 $62.90 $343.08
Skiing $244.50 $153.60 $266.70 $664.80
Other Economic Effects
The Washington State skiing industry is, in general, larger than the recreational boating industry. The skiing industry leads to a total value added of $395.20 million compared to the recreational boating industry’s $124.28 million. Additionally, the skiing industry leads to a greater number of jobs, 5,251 as compared to 1,923. The size of Washington State’s skiing industry leads to a larger impact on state tax revenue. The skiing industry results in $46.30 million whereas the recreational boating industry has an impact of $31.48 million.

Hebert Research, Inc. Page 34 Washington Recreational Boats: Economic Impact Research
Comparison of Economic Impact in Washington State
Industry
Total Value Added
($ Millions)
Total Employment
Impact (# Jobs)
State Tax Impact
($ Millions)
Recreational Boating $124.28 1,923 $31.48
Skiing $395.20 5,251 $46.30

Hebert Research, Inc. Page 35 Washington Recreational Boats: Economic Impact Research
Additional Recreational Boat Activity Expected from Proposed Legislation
As discussed previously in this report, the Washington legislature is considering a bill to
reform recreational boat taxes and fees. The bill has two main components:
1. Entity-owned, out-of-state recreational boats would be allowed to purchase
cruising and use permits on the same terms currently available to individual-
owned vessels. These permits would allow visiting recreational boats to remain
in Washington longer without facing use tax liability.
2. For sales and use tax, the taxable value of recreational boats would be capped at
$300,000. At a 9.5% tax rate, this means a maximum tax liability of $28,500 for a
vessel purchased in or brought into the state.
The expected effects of each of the two components are described below.
Cruising Permits for Entity-Owned Recreational Boats
According to Department of Licensing data, 241 cruising permits were issued in 2010.
These permits are currently only available to recreational boats owned by individuals, as
opposed to entities.
Due to the diffuse nature of potential recreational boat visitors living in other states or
countries, it was not possible to obtain an estimate of potential cruising permit use
through survey research. However, recreational boat management experts, including
those based in other jurisdictions, suggested that substantial numbers of entity-owned
vessels would likely use these permits. In particular, many recreational boats make an
annual migration up and down the Pacific Coast, cruising Alaska and Canada during the
summer, returning to California in the fall for maintenance, and wintering in Mexico or
transiting via the Panama Canal. Many of these vessels would spend part of their
summer cruising time in Washington if the threat of use tax liability were not present.
Additionally, several pieces of evidence indicate that the entity-owned visits would be
economically significant. First, the percentage of recreational boats that are entity-
owned increases steadily with vessel size and value; virtually all of the “megayachts” are
owned under an entity structure. Thus, this reform would open the state to visitation

Hebert Research, Inc. Page 36 Washington Recreational Boats: Economic Impact Research
by larger and higher-spending class of vessels than those that can currently obtain
cruising and use permits. Second, recreational boat owners using an entity
arrangement tend to be savvy and well-advised on financial and legal issues relating to
their vessels. This suggests that these well-informed and cost-concious owners will be
likely to respond to the new opportunity provided by these permits.
Based on these considerations, it was estimated that 241 cruising permits would be
issued to entity-owned vessels – the same number issued to individual-owned
recreational boats in 2010. At 60 days per permit, this would provide these vessels with
the right to remain in Washington for a total of 14,460 total operating days. (Note: not
all vessels may use the full 60 days allowed by each permit. However, some vessels may
not come to Washington at all if permits were not available, causing an increase in
visitation greater than 60 days per permit. The 60-day average accounts for these
offsetting factors).

Hebert Research, Inc. Page 37 Washington Recreational Boats: Economic Impact Research
Sales and Use Tax Cap
As previously discussed, anecdotal evidence suggests that a significant number of
recreational boat owners, including Washington residents and residents of other states,
keep their vessels outside of Washington so as not to incur sales or use tax.
Many these diverted vessels reside in British Columbia, a nearby, tax-free location that
enjoys similarly attractive cruising waters to those of Washington. However, experts
have suggested that the vast majority of these boats would be located in Washington if
not for the tax policies. Boat owners who must journey to Canada every time they use
their boat face substantial hassle and expense, including plane or ferry rides and lengthy
border crossings. Additionally, fuel and maintenance costs are significantly higher in
Canada than in the United States, particularly with the currently strong Canadian dollar.
Experts have also suggested that a substantial number of boats currently located in
California, or sold there in the future, would be likely to relocate to Washington if the
legislation were enacted. California currently has a stringent tax scheme that requires
boats purchased there to either vacate the state for 12 months or pay the full sales tax
rate. Thus, it is common for vessels to spend a year in another location such as BC,
Mexico, or Oregon. If taxes in Washington were reduced, it is likely that a substantial
stream of new boats would reside in Washington each year.
Furthermore, California has several disadvantages even for recreational boats that are
no longer liable for sales and use tax. First, its personal property tax, an annual tax
based on assessed value, is substantially higher than Washington’s excise tax. Rates
vary based on locality, but typically range between 1.5 and 2% per year. Finally, despite
a warmer climate, California does not have a strong reputation for attractive cruising
waters. In particular, the majority of the coast is unprotected and often rough.
Based on a census of five British Columbia marinas and a telephone survey of other
marinas the area, it is estimated that 519 recreational boats valued at over $300,000 are
currently moored in Canadian marinas, and that virtually all of these vessels would be in
Washington if not for the state’s tax policies. Further, based on consultation with
recreational boat planning experts in California, an estimated 265 vessels will
permanently relocate to Washington due to the sales and use tax adjustment. This
provides a total of 784 recreational boats newly based in Washington.

Hebert Research, Inc. Page 38 Washington Recreational Boats: Economic Impact Research
As with visiting entity-owned recreational boats, permanently relocating vessels are
likely to have a higher average market value than those currently in the state. This is
because more valuable vessels are more likely to receive advising on their taxation
strategies and cruising plans; they will have larger sums of money at stake in tax issues,
providing an greater incentive to respond to policy changes.
Smaller numbers of recreational boats may also be kept at non-marina locations in BC,
such as private homes, as well as tax-free US states such as Oregon and Alaska, but a
reliable count of such vessels could not be obtained.
Projected Distribution of New WA-Based Recreational Boats
Vessel Length Registered Vessels Avg. Est. Value 51-55 ft 333 $466,244
56-60 ft 191 $679,641
61-65 ft 135 $944,605
66-70 ft 42 $1,261,136
71-75 ft 27 $1,629,235
76-80 ft 27 $2,048,900
81-85 ft 10 $2,520,133
Over 85 ft 19 $2,940,505
Total 784 $823,318

Hebert Research, Inc. Page 39 Washington Recreational Boats: Economic Impact Research
Predicted Economic Impact of Proposed Legislation
The following section describes the expected economic impact of changes in
recreational boating activity resulting from the proposed legislation.
Effects on Recreational Boat Spending
The increased recreational boat activity described in the preceding section will generate
corresponding increases in economic activity.
Increase in Visiting Entity-Owned Recreational Boats
As discussed in the preceding section, entity-owned recreational boats would be
expected to purchase approximately 241 cruising permits per year, and would
consequently remain in Washington for 14,460 additional vessel-days. These vessels
would spend over $17 million per year while in Washington.
The research has indicated that entity-owned recreational boats skew towards larger
sizes and higher market values. Therefore, the average expenditure profiles used for
the Washington-based population were adjusted to account for a higher average value
among entity-owned recreational boats.
Increase in State Recreational Boat Population Due to Sales and Use Tax Cap
As discussed in the preceding section, it is expected that 784 total vessels would
permanently relocate from British Columbia and California to Washington if the sales
and use taxes were capped. Again, the average spending profile was adjusted based on
a higher expected average value. For all 784 vessels, this results in total ownership and
operating spending of more than $69 million per year.
Increase in Recreational Boat Sales Due to Sales and Use Tax Cap
In addition, the tax cap is expected to increase the sales of new and used recreational
boats in Washington by lowering the effective price paid by the consumer. This increase
can manifest in several ways. First, individuals who would have purchased a new
recreational boat even under the current tax policy may decide to “re-invest” the tax
savings into a higher value vessel. Second, current recreational boat owners who would
otherwise have kept their existing recreational boat may decide to upgrade to a newer
or larger vessel. Finally, individuals who do not own a recreational boat at all may take
the opportunity to enter the recreational boat market.

Hebert Research, Inc. Page 40 Washington Recreational Boats: Economic Impact Research
Since this research did not involve individuals who do not currently own a recreational
boat, is it not possible to directly estimate the total increase in sales. However, as a
conservative estimate, it is reasonable to assume that the increase in the value of total
recreational boat sales will at least equal the reduction in taxes. For example, assume a
prospective buyer had previously planned to purchase a recreational boat listed at $1
million, which would currently entail a $95,000 sales tax payment. If the proposed
legislation capped the tax liability at $28,500, the tax savings would total $66,500. Since
this hypothetical buyer had already budgeted $1,095,000 for a recreational boat, he or
she could be expected to spend the savings on additional options or equipment for the
recreational boat.
Thus, new recreational boat sales can be expected to equal, at a minimum, the volume
of the sales tax no longer collected (discussed in the following section) , or about $9.4
million per year.
Note: the relationship between the price of a good and the quantity sold is known as
price elasticity, and is a topic of significant study in economics. The scenario described
above, where a change in the price facing the consumer causes an increase in demand
that keeps the total expenditure constant, is known as “unit elastic” demand. Luxury
goods are generally considered to be highly price-elastic (meaning that a small change in
price leads to a large change in demand), since it is usually easy to substitute one luxury
good for another. Recreational boats are literally a textbook example of high price
elasticity in the economics literature: the short-lived federal luxury tax in the early 1990s
is notorious for causing a very steep decline in recreational boat purchases. Thus, the
converse is also generally understood to be true, meaning that a 9.5% tax reduction is
likely to produce a disproportionate increase in the total value of recreational boat
sales. However, to produce a conservative estimate, this analysis retains the
assumption of unit elastic demand.

Hebert Research, Inc. Page 41 Washington Recreational Boats: Economic Impact Research
Economic Output Effects
The following tables report the economic impacts expected from the recreational
boating activity changes described above. The increases in the population of visiting
and resident recreational boats, as well as the increase in recreational boat sales, would
generate a total of $29.4 million per year in direct spending. Including secondary
effects, this would create $164.4 million in total annual economic activity, of which
$92.7 million is value added.
Expenditure Type Direct Indirect Induced Total Output
Visiting Entity-Owned Recreational Boats $17,121,390 $4,497,139 $8,259,357 $29,877,940
Additional Recreational Boat Sales $9,370,009 $456,823 $1,363,903 $11,190,735
Annual Ownership Costs $48,986,663 $14,240,100 $20,151,616 $86,378,379
Operating Costs $20,950,803 $5,513,735 $10,441,644 $36,906,183
Total $96,428,865 $24,707,797 $40,216,520 $164,353,237
Expenditure Type Total Value
Added
Visiting Entity-Owned Recreational Boats $20,139,078
Additional Recreational Boat Sales $2,745,226
Annual Ownership Costs $45,079,544
Operating Costs $24,791,031
Total $92,754,879

Hebert Research, Inc. Page 42 Washington Recreational Boats: Economic Impact Research
Employment Effects
The increase in demand from the tax reform legislation would create 837 jobs in sectors
directly serving recreational boats, and a total of 1,295 jobs including secondary effects.
The labor income earned through these newly-created jobs would total $58.2 million
per year.
Region Direct
Employment
Total Employment
Impact Direct Labor
Income
Total Labor Income Impact
Visiting Entity-Owned Recreational Boats 225.3 312.6 $7,861,578 $11,941,635
Additional Recreational Boat Sales 25.5 38.2 $1,385,776 $1,976,534
Annual Ownership Costs 318.4 566.7 $16,609,508 $29,201,231
Operating Costs 267.8 377.8 $9,951,260 $15,096,120
Total 837.0 1295.3 $35,808,122 $58,215,520
Summary of Tax Impacts
To determine the total tax impact, it is necessary to compare the decreases in direct
revenue resulting from the tax reductions, against the additional taxes paid by
recreational boats brought to Washington by the reforms, as well as the tax receipts
from business activity directly or indirectly generated by recreational boat spending.
Tax Effect of Cruising Permit Reform
The cruising permit reform measure could decrease state use revenues in two possible
ways.
1. Entity-owned vessels desiring to stay in Washington for longer than the current
60-day period, who otherwise would have paid use tax, will now instead acquire
a cruising or use permit.
2. Washington residents use an offshore entity ownership structure to disguise
their in-state status, avoiding the use tax they would be obligated to pay upon
bringing their vessel into the state.
However, both of these effects are expected to be negligible. As it stands, few if any
vessels would pay the considerable use tax payment simply to visit Washington for a

Hebert Research, Inc. Page 43 Washington Recreational Boats: Economic Impact Research
few months in a given year, so use tax loses should be minimal to nonexistent. The
second effect is dependent upon implementation and enforcement of the bill, but
should mitigate the potential for abuse.
Decrease in Sales and Use Tax for Existing Transactions
If recreational boat sales figures remained unchanged, sales taxes on new recreational
boats would decrease due to the cap, from $8.1 million to approximately $2.7 million
per year (a loss of $5.4 million). Similarly, sales taxes and use tax paid on the resale of
recreational boats would decrease by $4.0 million. Finally, use tax on vessels brought
into the state would decrease by approximately $993,000.
Increase in Use Tax for New Vessels
If the enactment of the proposed legislation caused 784 recreational boats valued at
over $300,000 to relocate to Washington, those vessels would consequently pay use tax
at the new rate. At the capped value of $300,000, each vessel would pay approximately
$28,500, raising a total of $22.3 million in additional revenue.
Increase in Annual Excise Tax
The 784 new recreational boats would also pay annual excise tax (0.5% of assessed
value).
Increase in Business Taxes The permanently relocating recreational boats, visiting entity-owned recreational boats, and new recreational boats sold because of the tax reform will all generate economic activity in Washington, which will provide returns through sales, B&O, leasehold and other taxes.

Hebert Research, Inc. Page 44 Washington Recreational Boats: Economic Impact Research
Three Year Projection of Tax Impacts
The table below provides a three-year projection for the overall tax impact of the legislation. Several parameters are built into this model:
2% annual increase in recreational boat prices and spending
3% annual increase in the number of recreational boats sold
The predicted increases in relocating and visiting recreational boats will take three years to fully manifest. 33% of the effect occurs each year (e.g. each year, one-third of the predicted 784 recreational boats will relocate).
Three Year Projection of Fleet Size and Tax Impacts
Year 1 Year 2 Year 3
New recreational boats sold due to legislation 7.2 7.4 7.7
Total fleet size (no legislation) 1,020 1,040 1,061
Total fleet size (legislation) 1,289 1,578 1,868
Sales tax revenue lost (new sales) ($5,370,013) ($5,697,047) ($5,867,958)
Sales tax revenue lost (used sales) ($3,999,997) ($4,119,997) ($4,243,597)
Use tax revenue lost ($432,619) ($445,598) ($458,965)
New use Tax Revenue $7,562,000 $7,562,000 $7,562,000
New sales tax revenue $205,770 $211,943 $218,301
New excise tax revenue $702,249 $1,405,065 $2,108,464
Tax Revenue from new recreational boat activity $3,466,702 $7,074,923 $10,829,084
Net Annual Tax Impact $2,134,092 $5,991,290 $10,147,329
Cumulative Tax Impact $2,134,092 $8,125,382 $18,272,711

Hebert Research, Inc. Page 45 Washington Recreational Boats: Economic Impact Research
Conclusions 1. Washington currently charges sales tax or the equivalent amount in use tax for
recreational boats purchased for use in the state, vessels brought into the state by
residents, and visiting out-of-state vessels that visit for more than 60 days per year
(individual-owned recreational boats may extend this period with cruising or use
permits).
2. Boat owners may employ several strategies to limit the taxes assessed on
recreational boats. The strategy most relevant to this report is simply not bringing a
recreational boat into the state’s waters. This is economically harmful to
Washington, because the spending associated with owning and operating a
recreational boat does not take place within the state, and thus does not contribute
to the local economy.
3. Tax and fee policies vary widely among coastal states in the United States. Several
states, including the Pacific states of Alaska, Hawaii and Oregon, levy no sales or use
tax on boat purchases. British Columbia also offers a tax-free place for US owners to
keep their recreational boats. Taking into account the tax rate applied as well as the
application of taxes to visiting recreational boats, Washington has some of the most
restrictive recreational boat tax and fee policies in the nation.
4. Numerous states have embarked on efforts to reform the taxes and fees they assess
on recreational boats. Rhode Island, which eliminated sales and use taxes on boats
in 1993, has established a thriving recreational marine sector with significant
economic impacts. For states that embarked on such reforms more recently,
including Maine, South Carolina, and Florida, it is still too early to assess the
economic effect.
5. At least one state, California, has responded to the economic and budget crisis by
tightening its recreational boat tax policies. California extended the time a newly-
purchased vessel must remain outside of California to eliminate tax liability from 90
days to 12 months.
6. As of 2010, there are a total of 9,278 recreational boats 35 feet or larger registered
in Washington. Approximately 1,000 of these vessels have a value greater than
$300,000 – the category of vessels that would be affected by the proposed tax cap
legislation.
7. Currently, annual recreational boat sales in Washington total approximately 645
transactions: 96 new vessels and 549 resales. Of the 645 vessels sold,
Hebert Research, Inc. Page 46 Washington Recreational Boats: Economic Impact Research
approximately 152 sold for more than $300,000 and would thus be affected by the
tax cap.
8. Owners of recreational boats over $300,000 in value spend an average of over
$45,000 on upgrades and delivery at the time of purchase.
9. Owners of 50-85 foot vessels spend an average of more than $45,766 per year on
ownership costs such as maintenance and guest moorage, and an additional $17,568
on operating costs such as fuel, restaurants and groceries.
10. The average expenditures are much higher for owners of vessels larger than 85 feet.
These recreational boats spend an average of 45,766 per year on ownership costs,
and $149,537 on operating costs.
11. Each year, recreational boats that visit Washington from other states and countries
spend an additional $17.7 million in the state.
12. Including secondary effects, recreational boats valued at over $300,000 generate a
total of $434.1 million in economic activity each year for Washington. This spending
creates a total of 1,923 jobs, and $110.2 million in labor income.
13. The State of Washington collects a total of $31.5 million in tax income from these
recreational boats, including sales and use taxes, annual fees, and taxes on direct
and secondary business activity.
14. Approximately 784 recreational boats being kept in British Columbia and California
would likely relocate to the state if these taxes were reduced.
15. If they relocated to Washington, the 784 recreational boats would spend about $70
million per year in-state for ownership and operating costs.
16. Capping the sales tax on vessel purchases is expected to generate at least $9.4
million per year in additional recreational boat sales revenue.
17. If entity-owned vessels were allowed to obtain cruising and use permits, 241 vessels
would be expected to participate, spending $17.1 million per year in Washington.
18. In total, the proposed legislation is expected to generate $32.1 million per year in
direct spending, $47.1 million in total economic activity, 370 total jobs, and $19.6
million in labor income per year.
19. The proposed legislation would reduce the tax revenue collected on current
recreational boat sales, but would also provide new sources of tax revenue due to
additional recreational boating activity. Over three years, the legislation would
create a cumulative increase of over $18 million in tax revenues.

Hebert Research, Inc. Page 47 Washington Recreational Boats: Economic Impact Research
Appendix: Economic Impact of Washington’s Recreational
Marine Sector
The following are estimates of the total economic impact provided by Washington’s
entire recreational boating sector. This includes smaller vessels as well as the
recreational boats described in the body of the report. Additionally, the total impact
includes economic activity for vessels that do not remain in Washington, such as
manufacturing of boats for sale in other states.
The economic impact estimates are based on data collected by the NMMA in 2008. This
included per-vessel and total ownership and operating costs, as well as revenues for
businesses in boating-related industries (NAICS codes). Care was taken to avoid double-
counting activities captured in both business revenue and owner spending data.
Similar to the recreational boat spending impacts, data has been divided into annual
ownership costs, such as insurance and storage/moorage, and operating costs such as
fuel and grocery purchases. “Other business” revenues include all additional industries
in the recreational marine sector, such as boat building, part and accessory
manufacturing, wholesale and retail, and services such as boat rental, chartering and
instruction.
Output Impacts
Expenditure Type Direct Indirect Induced Total Output
Other Business Revenues $954,087,017 $342,017,912 $417,477,459 $1,713,582,388
Annual Ownership Costs $888,797,899 $341,882,188 $371.354,880 $1,602,034,968
Operating Costs $340,440,424 $118,520,740 $154,734,566 $613,695,730
Total $2,183,325,340 $802,420,840 $943,566,906 $3,929,320,544

Hebert Research, Inc. Page 48 Washington Recreational Boats: Economic Impact Research
Expenditure Type Total Value
Added
Visiting Entity-Owned Recreational Boats $1,140,936
Additional Recreational Boat Sales $2,537,857
Annual Ownership Costs $11,259,653
Operating Costs $9,962,479
Total $24,900,925

Hebert Research, Inc. Page 49 Washington Recreational Boats: Economic Impact Research
Employment Impacts
Region Direct
Employment
Total Employment
Impact Direct Labor
Income Total Labor
Income
Other Business Revenues 5,767 10,773 $354,469,566 $604,898,247
Annual Ownership Costs 6,089 10,911 $296,608,703 $537,859,146
Operating Costs 4,499 6,354 $136,173,199 $223,984,652
Total 16,355 28,038 $787,251,458 $1,366,742,045