Embed Size (px)
Citation preview

Washington State Auditor’s Office
Financial Statements and Federal Single Audit Report
City of Pullman Whitman County
Audit Period January 1, 2008 through December 31, 2008
Report No. 1001984
Issue Date August 24, 2009

August 24, 2009 Mayor and City Council City of Pullman Pullman, Washington Report on Financial Statements and Federal Single Audit Please find attached our report on the City of Pullman’s financial statements and compliance with federal laws and regulations. We are issuing this report in order to provide information on the City’s financial condition. Sincerely,
BRIAN SONNTAG, CGFM STATE AUDITOR
Washington State Auditor Brian Sonntag
Insurance Building, P.O. Box 40021 Olympia, Washington 98504-0021 (360) 902-0370 TDD Relay (800) 833-6388
FAX (360) 753-0646 http://www.sao.wa.gov

Table of Contents
City of Pullman
Whitman County January 1, 2008 through December 31, 2008
Federal Summary ....................................................................................................................... 1
Independent Auditor’s Report on Internal Control over Financial Reporting and on Compliance and Other Matters in Accordance with Government Auditing Standards ........................................................................................................................ 3
Independent Auditor’s Report on Compliance with Requirements Applicable to its Major Program and Internal Control over Compliance in Accordance with OMB Circular A-133 .............................................................................................................................. 5
Independent Auditor’s Report on Financial Statements ............................................................... 7
Financial Section ......................................................................................................................... 9

Federal Summary
City of Pullman
Whitman County January 1, 2008 through December 31, 2008
The results of our audit of the City of Pullman are summarized below in accordance with U.S. Office of Management and Budget Circular A-133. FINANCIAL STATEMENTS An unqualified opinion was issued on the financial statements of the governmental activities, the business-type activities, each major fund, and the aggregate remaining fund information. Internal Control Over Financial Reporting: Significant Deficiencies: We reported no deficiencies in the design or operation of
internal control over financial reporting that we consider to be significant deficiencies. Material Weaknesses: We identified no significant deficiencies that we consider to be
material weaknesses. We noted no instances of noncompliance that were material to the financial statements of the City. FEDERAL AWARDS Internal Control Over Major Programs: Significant Deficiencies: We reported no deficiencies in the design or operation of
internal control over major federal programs that we consider to be significant deficiencies.
Material Weaknesses: We identified no significant deficiencies that we consider to be
material weaknesses. We issued an unqualified opinion on the City’s compliance with requirements applicable to its major federal program. We reported no findings that are required to be disclosed under OMB Circular A-133.
_________________________________________________________________________________________________________ Washington State Auditor's Office 1

Identification of Major Programs: The following was a major program during the period under audit:
CFDA No. Program Title 20.106 Federal Aviation The dollar threshold used to distinguish between Type A and Type B programs, as prescribed by OMB Circular A-133, was $300,000. The City qualified as a low-risk auditee under OMB Circular A-133.
_________________________________________________________________________________________________________ Washington State Auditor's Office 2

Independent Auditor’s Report on Internal
Control over Financial Reporting and on
Compliance and Other Matters in Accordance
with Government Auditing Standards
City of Pullman
Whitman County January 1, 2008 through December 31, 2008
Mayor and City Council City of Pullman Pullman, Washington We have audited the financial statements of the governmental activities, the business-type activities, each major fund and the aggregate remaining fund information of the City of Pullman, Whitman County, Washington, as of and for the year ended December 31, 2008, which collectively comprise the City‘s basic financial statements, and have issued our report thereon dated July 20, 2009. During the year ended December 31, 2008, the City implemented Governmental Accounting Standards Board Statement 45, Accounting and Financial Reporting by Employers for Postemployment Benefits Other Than Pensions. We conducted our audit in accordance with auditing standards generally accepted in the United States of America and the standards applicable to the financial audits contained in Government Auditing Standards, issued by the Comptroller General of the United States. INTERNAL CONTROL OVER FINANCIAL REPORTING In planning and performing our audit, we considered the City’s internal control over financial reporting as a basis for designing our auditing procedures for the purpose of expressing our opinions on the financial statements, but not for the purpose of expressing an opinion on the effectiveness of the City’s internal control over financial reporting. Accordingly, we do not express an opinion on the effectiveness of the City’s internal control over financial reporting. A control deficiency exists when the design or operation of a control does not allow management or employees, in the normal course of performing their assigned functions, to prevent or detect misstatements on a timely basis. A significant deficiency is a control deficiency, or combination of control deficiencies, that adversely affects the City's ability to initiate, authorize, record, process or report financial data reliably in accordance with generally accepted accounting principles such that there is more than a remote likelihood that a misstatement of the City's financial statements that is more than inconsequential will not be prevented or detected by the City's internal control.
_________________________________________________________________________________________________________ Washington State Auditor's Office 3

A material weakness is a significant deficiency, or combination of significant deficiencies, that results in more than a remote likelihood that a material misstatement of the financial statements will not be prevented or detected by the entity’s internal control. Our consideration of internal control over financial reporting was for the limited purpose described in the first paragraph of this section and would not necessarily identify all deficiencies in internal control that might be significant deficiencies or material weaknesses. We did not identify any deficiencies in internal control over financial reporting that we consider to be material weaknesses, as defined above. COMPLIANCE AND OTHER MATTERS As part of obtaining reasonable assurance about whether the City’s financial statements are free of material misstatement, we performed tests of the City’s compliance with certain provisions of laws, regulations, contracts and grant agreements, noncompliance with which could have a direct and material effect on the determination of financial statement amounts. However, providing an opinion on compliance with those provisions was not an objective of our audit, and accordingly, we do not express such an opinion. The results of our tests disclosed no instances of noncompliance or other matters that are required to be reported under Government Auditing Standards. This report is intended for the information and use of management, the Mayor and City Council, federal awarding agencies and pass-through entities. However, this report is a matter of public record and its distribution is not limited. It also serves to disseminate information to the public as a reporting tool to help citizens assess government operations.
BRIAN SONNTAG, CGFM STATE AUDITOR July 20, 2009
_________________________________________________________________________________________________________ Washington State Auditor's Office 4

Independent Auditor’s Report on Compliance
with Requirements Applicable to its Major
Program and Internal Control over Compliance
in Accordance with OMB Circular A-133
City of Pullman
Whitman County January 1, 2008 through December 31, 2008
Mayor and City Council City of Pullman Pullman, Washington COMPLIANCE We have audited the compliance of the City of Pullman, Whitman County, Washington, with the types of compliance requirements described in the U.S. Office of Management and Budget (OMB) Circular A-133 Compliance Supplement that are applicable to its major federal program for the year ended December 31, 2008. The City’s major federal program is identified in the Federal Summary. Compliance with the requirements of laws, regulations, contracts and grants applicable to its major federal program is the responsibility of the City’s management. Our responsibility is to express an opinion on the City’s compliance based on our audit. The City’s basic financial statements include the operations of Pullman-Moscow Regional Airport, which expended $1,863,727 in federal awards. Our audit, described below, did not include the operations of the Pullman-Moscow Regional Airport because it has arranged for a separate audit of its federal awards in accordance with OMB Circular A-133. We conducted our audit of compliance in accordance with auditing standards generally accepted in the United States of America; the standards applicable to the financial audits contained in Government Auditing Standards, issued by the Comptroller General of the United States; and OMB Circular A-133, Audits of States, Local Governments, and Non-Profit Organizations. Those standards and OMB Circular A-133 require that we plan and perform the audit to obtain reasonable assurance about whether noncompliance with the types of compliance requirements referred to above that could have a direct and material effect on a major federal program occurred. An audit includes examining, on a test basis, evidence about the City’s compliance with those requirements and performing such other procedures as we considered necessary in the circumstances. We believe that our audit provides a reasonable basis for our opinion. Our audit does not provide a legal determination on the City’s compliance with those requirements. In our opinion, the City complied, in all material respects, with the requirements referred to above that are applicable to its major federal program for the year ended December 31, 2008.
_________________________________________________________________________________________________________ Washington State Auditor's Office 5

INTERNAL CONTROL OVER COMPLIANCE The management of the City is responsible for establishing and maintaining effective internal control over compliance with requirements of laws, regulations, contracts and grants applicable to federal programs. In planning and performing our audit, we considered the City’s internal control over compliance with the requirements that could have a direct and material effect on a major federal program in order to determine our auditing procedures for the purpose of expressing our opinion on compliance and to test and report on internal control over compliance, but not for the purpose of expressing an opinion on the effectiveness of internal control over compliance. Accordingly, we do not express an opinion on the effectiveness of the City's internal control over compliance. A control deficiency in an entity’s internal control over compliance exists when the design or operation of a control does not allow management or employees, in the normal course of performing their assigned functions, to prevent or detect noncompliance with a type of compliance requirement of a federal program on a timely basis. A significant deficiency is a control deficiency, or combination of control deficiencies, that adversely affects the entity’s ability to administer a federal program such that there is a more than remote likelihood that noncompliance with a type of compliance requirement of a federal program that is more than inconsequential will not be prevented or detected by the entity’s internal control. A material weakness is a significant deficiency, or combination of significant deficiencies, that results in a more than remote likelihood that material noncompliance with a type of compliance requirement of a federal program will not be prevented or detected by the entity’s internal control. Our consideration of internal control over compliance was for the limited purpose described in the first paragraph of this section and would not necessarily identify all deficiencies in internal control that might be significant deficiencies or material weaknesses. We did not identify any deficiencies in internal control over compliance that we consider to be material weaknesses, as defined above. This report is intended for the information of management, the Mayor and City Council, federal awarding agencies and pass-through entities. However, this report is a matter of public record and its distribution is not limited. It also serves to disseminate information to the public as a reporting tool to help citizens assess government operations.
BRIAN SONNTAG, CGFM STATE AUDITOR July 20, 2009
_________________________________________________________________________________________________________ Washington State Auditor's Office 6

Independent Auditor’s Report on Financial
Statements
City of Pullman Whitman County
January 1, 2008 through December 31, 2008 Mayor and City Council City of Pullman Pullman, Washington We have audited the accompanying financial statements of the governmental activities, the business-type activities, each major fund and the aggregate remaining fund information of the City of Pullman, Whitman County, Washington, as of and for the year ended December 31, 2008, which collectively comprise the City’s basic financial statements as listed on page 9. These financial statements are the responsibility of the City’s management. Our responsibility is to express opinions on these financial statements based on our audit. We conducted our audit in accordance with auditing standards generally accepted in the United States of America and the standards applicable to financial audits contained in Government Auditing Standards, issued by the Comptroller General of the United States. Those standards require that we plan and perform the audit to obtain reasonable assurance about whether the financial statements are free of material misstatement. An audit includes examining, on a test basis, evidence supporting the amounts and disclosures in the financial statements. An audit also includes assessing the accounting principles used and significant estimates made by management, as well as evaluating the overall financial statement presentation. We believe that our audit provides a reasonable basis for our opinions. In our opinion, the financial statements referred to above present fairly, in all material respects, the respective financial position of the governmental activities, the business-type activities, each major fund and the aggregate remaining fund information of the City of Pullman, as of December 31, 2008, and the respective changes in financial position and, where applicable, cash flows thereof, and the respective budgetary comparison for the General and Street funds for the year then ended in conformity with accounting principles generally accepted in the United States of America. As described in Note 17, during the year ended December 31, 2008, the City implemented Governmental Accounting Standards Board Statement 45, Accounting and Financial Reporting by Employers for Postemployment Benefits Other Than Pensions. In accordance with Government Auditing Standards, we have also issued our report on our consideration of the City’s internal control over financial reporting and on our tests of its compliance with certain provisions of laws, regulations, contracts and grant agreements and other matters. The purpose of that report is to describe the scope of our testing of internal control over financial reporting and compliance and the results of that testing, and not to provide an opinion on the internal control over financial reporting or on compliance. That report is an
_________________________________________________________________________________________________________ Washington State Auditor's Office 7

integral part of an audit performed in accordance with Government Auditing Standards and should be considered in assessing the results of our audit. The management’s discussion and analysis on pages 10 through 18 is not a required part of the basic financial statements but is supplementary information required by the Governmental Accounting Standards Board. We have applied certain limited procedures, which consisted principally of inquiries of management regarding the methods of measurement and presentation of the required supplementary information. However, we did not audit the information and express no opinion on it. Our audit was performed for the purpose of forming an opinion on the financial statements that collectively comprise the City’s basic financial statements. The accompanying Schedule of Expenditures of Federal Awards is presented for purposes of additional analysis as required by U.S. Office of Management and Budget Circular A-133, Audits of States, Local Governments, and Non-Profit Organizations. This schedule is not a required part of the basic financial statements. Such information has been subjected to the auditing procedures applied in the audit of the basic financial statements and, in our opinion, is fairly stated, in all material respects, in relation to the basic financial statements taken as a whole.
BRIAN SONNTAG, CGFM STATE AUDITOR July 20, 2009
_________________________________________________________________________________________________________ Washington State Auditor's Office 8

Financial Section
City of Pullman
Whitman County January 1, 2008 through December 31, 2008
REQUIRED SUPPLEMENTAL INFORMATION
Management’s Discussion and Analysis – 2008
BASIC FINANCIAL STATEMENTS
Statement of Net Assets – 2008 Statement of Activities – 2008 Balance Sheet – Governmental Funds – 2008 Statement of Revenues, Expenditures and Changes in Fund Balances – Governmental
Funds – 2008 Reconciliation of Statement of Revenues, Expenditures and Changes in Fund Balances
of Governmental Funds – 2008 Statement of Revenues, Expenditures and Changes in Fund Balance – Budget to Actual
– General Fund – 2008 Statement of Revenues, Expenditures and Changes in Fund Balance – Budget to Actual
– Street Fund – 2008 Statement of Net Assets – Proprietary Funds – 2008 Statement of Revenues, Expenses and Changes in Fund Net Assets – Proprietary
Funds – 2008 Statement of Cash Flows – Proprietary Funds – 2008 Statement of Net Assets – Fiduciary Funds – 2008 Statement of Changes in Fiduciary Net Assets – Fiduciary Funds – 2008 Notes to Financial Statements – 2008
SUPPLEMENTAL INFORMATION
Schedule of Expenditures of Federal Awards – 2008 Notes to the Schedule of Expenditures of Federal Awards – 2008
_________________________________________________________________________________________________________ Washington State Auditor's Office 9

MANAGEMENT’S DISCUSSION AND ANALYSIS
Within this section of the City of Pullman, Washington (the City)’s annual financial report, the City’s management is pleased to provide this narrative discussion and analysis of the financial activities of the City as of and for the fiscal year ended December 31, 2008. The City’s financial performance is discussed and analyzed within the context of the accompanying financial statements and disclosures following this section. Financial Highlights • The City’s assets exceeded its liabilities by $83,138,008 (net assets) for the fiscal year reported. • Total net assets are comprised of the following:
(1) Capital assets, net of related debt, of $66,124,814 include property and equipment, net of accumulated depreciation, and reduced for outstanding debt related to the purchase or construction of capital assets.
(2) Net assets of $2,208,865 are restricted by constraints imposed from outside the City such as debt covenants, grantors, laws, or regulations.
(3) Unrestricted net assets of $14,804,329 represent the portion available to maintain the City’s continuing obligations to citizens and creditors.
• The City’s governmental funds reported total ending fund balance of $9,063,250 this year. This
compares to the prior year ending fund balance of $10,762,390, showing a decrease of $1,699,140 during the current year. Unreserved fund balance of $8,509,418 for fiscal year 2008 shows a $1,279,374 decrease from the prior year.
• At the end of the current fiscal year, unreserved fund balance for the General Fund was $3,431,780,
or 23.0 percent of total General Fund expenditures including transfers and 23.1 percent of total General Fund revenues including transfers.
• Overall, the City continues to maintain a stable financial position. The above financial highlights are explained in more detail in the “financial analysis” section of this document. Overview of the Financial Statements This Management Discussion and Analysis document introduces the City’s basic financial statements. The basic financial statements include: (1) government-wide financial statements, (2) fund financial statements, and (3) notes to the basic financial statements. The intent of this section of the management’s discussion and analysis is to introduce and explain the basic financial statements. The financial statements are prepared in accordance with accounting principles generally accepted in the United States as proclaimed by the GASB principles. Government-wide Financial Statements The City’s annual report includes two government-wide financial statements. These statements provide both long-term and short-term information about the City's overall financial status. These statements include all assets and liabilities using the accrual basis of accounting, which is similar to that used by the private sector. The first of these government-wide statements is the Statement of Net Assets. This is the government-wide statement of position presenting information that includes all of the City’s assets and liabilities, with the difference reported as net assets. Over time, increases or decreases in net assets may serve as a useful indicator of whether the financial position of the City as a whole is improving or deteriorating.
_________________________________________________________________________________________________________ Washington State Auditor's Office 10

Evaluation of the overall health of the City would extend to other nonfinancial factors such as changes to the City’s property tax base, changes to the sales tax base, and the condition of the City’s infrastructure. The second government-wide statement is the Statement of Activities, which reports how the City’s net assets changed during the current fiscal year. All current year revenues and expenses are included regardless of when cash is received or paid. An important purpose of the design of the statement of activities is to show the financial reliance of the City's distinct activities or functions on revenues provided by the City's taxpayers. Both government-wide financial statements differentiate governmental activities of the City that are principally supported by property, sales and utility taxes from business-type activities that are intended to recover all or a significant portion of their costs through user fees and charges. Governmental activities include general government services, public safety, physical environment, transportation, economic environment, mental health & physical health, and culture and recreation. Business-type activities include the utility services and transit services. The internal service funds provide services to other funds within the City and the majority of these activities are reported in governmental activities at the government-wide financial reporting level. The government-wide financial statements are presented immediately following this Management Discussion and Analysis (MD&A). Fund Financial Statements A fund is an accountability unit used to maintain control over resources segregated for specific activities or objectives. The City uses funds to ensure and demonstrate compliance with finance-related laws and regulations. Within the basic financial statements, fund financial statements focus on the City’s most significant funds rather than the City as a whole. Major funds are separately reported while all others are combined into a single, aggregate presentation. Individual fund data for non-major funds is provided in the form of combining statements in a later section of this report. The City has three kinds of funds: Governmental funds are reported in the fund financial statements and encompass the same functions reported as governmental activities in the government-wide financial statements. However, the focus is very different with fund statements providing a distinctive view of the City’s governmental funds. These statements report short-term fiscal accountability focusing on the use of spendable resources and balances of spendable resources available at the end of the year. They are useful in evaluating annual financing requirements of governmental programs and the commitment of spendable resources for the near-term. Since the government-wide focus includes the long-term view, comparisons between these two perspectives may provide insight into the long-term impact of short-term financing decisions. Both the governmental fund balance sheet and the governmental fund operating statement provide a reconciliation to illustrate the differences between these two perspectives. Budgetary comparison statements are included as “basic financial statements” for the major, general and street funds. Budgetary comparison schedules for all other governmental funds can be found later in this report. These statements demonstrate compliance with the City’s adopted and final revised budget. Individual fund information for non-major governmental funds is found in combining statements later in this report. Proprietary funds are reported in the fund financial statements and generally report services for which the City charges customers a fee. The City proprietary funds are classified as enterprise funds. The enterprise funds essentially encompass the same functions reported as business-type activities in the government-wide statements. The internal service funds provide services to other funds of the City.
_________________________________________________________________________________________________________ Washington State Auditor's Office 11
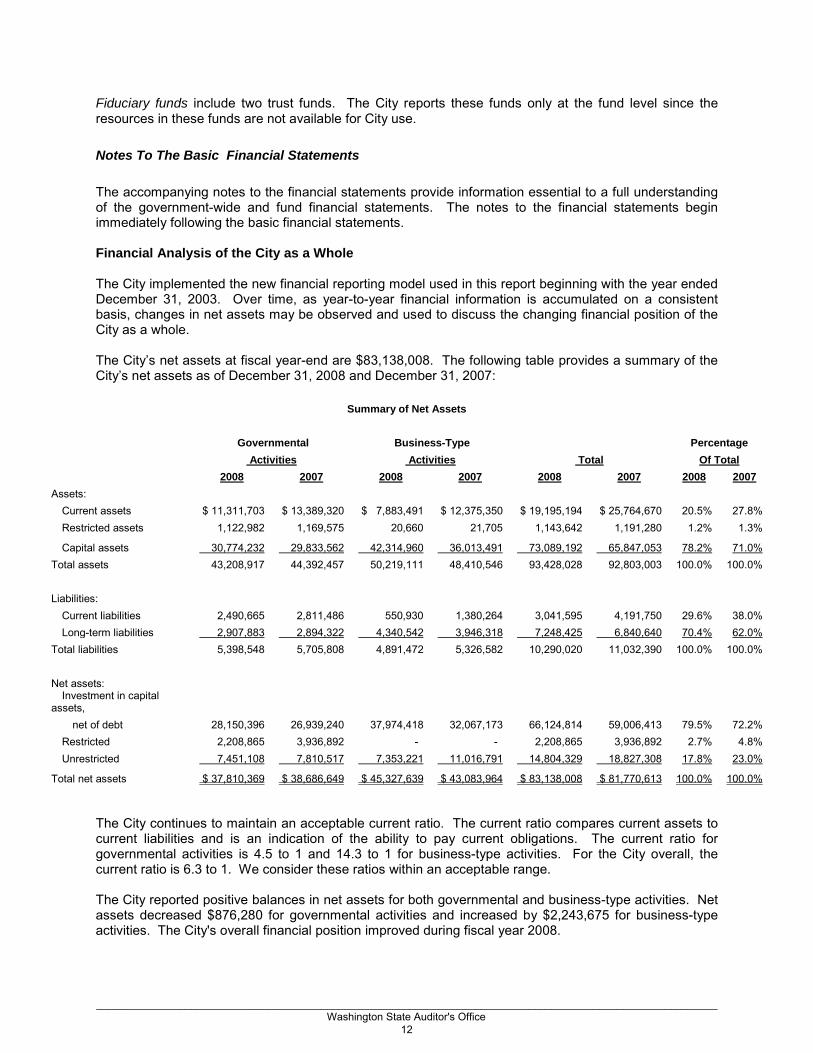
Fiduciary funds include two trust funds. The City reports these funds only at the fund level since the resources in these funds are not available for City use. Notes To The Basic Financial Statements The accompanying notes to the financial statements provide information essential to a full understanding of the government-wide and fund financial statements. The notes to the financial statements begin immediately following the basic financial statements. Financial Analysis of the City as a Whole The City implemented the new financial reporting model used in this report beginning with the year ended December 31, 2003. Over time, as year-to-year financial information is accumulated on a consistent basis, changes in net assets may be observed and used to discuss the changing financial position of the City as a whole. The City’s net assets at fiscal year-end are $83,138,008. The following table provides a summary of the City’s net assets as of December 31, 2008 and December 31, 2007:
Summary of Net Assets Governmental Business-Type Percentage Activities Activities Total Of Total 2008 2007 2008 2007 2008 2007 2008 2007 Assets:
Current assets $ 11,311,703 $ 13,389,320 $ 7,883,491 $ 12,375,350 $ 19,195,194 $ 25,764,670 20.5% 27.8% Restricted assets 1,122,982 1,169,575 20,660 21,705 1,143,642 1,191,280 1.2% 1.3%
Capital assets 30,774,232 29,833,562 42,314,960 36,013,491 73,089,192 65,847,053 78.2% 71.0% Total assets 43,208,917 44,392,457 50,219,111 48,410,546 93,428,028 92,803,003 100.0% 100.0% Liabilities:
Current liabilities 2,490,665 2,811,486 550,930 1,380,264 3,041,595 4,191,750 29.6% 38.0% Long-term liabilities 2,907,883 2,894,322 4,340,542 3,946,318 7,248,425 6,840,640 70.4% 62.0%
Total liabilities 5,398,548 5,705,808 4,891,472 5,326,582 10,290,020 11,032,390 100.0% 100.0% Net assets:
Investment in capital assets,
net of debt 28,150,396 26,939,240 37,974,418 32,067,173 66,124,814 59,006,413 79.5% 72.2% Restricted 2,208,865 3,936,892 - - 2,208,865 3,936,892 2.7% 4.8% Unrestricted 7,451,108 7,810,517 7,353,221 11,016,791 14,804,329 18,827,308 17.8% 23.0%
Total net assets $ 37,810,369 $ 38,686,649 $ 45,327,639 $ 43,083,964 $ 83,138,008 $ 81,770,613 100.0% 100.0% The City continues to maintain an acceptable current ratio. The current ratio compares current assets to current liabilities and is an indication of the ability to pay current obligations. The current ratio for governmental activities is 4.5 to 1 and 14.3 to 1 for business-type activities. For the City overall, the current ratio is 6.3 to 1. We consider these ratios within an acceptable range. The City reported positive balances in net assets for both governmental and business-type activities. Net assets decreased $876,280 for governmental activities and increased by $2,243,675 for business-type activities. The City's overall financial position improved during fiscal year 2008.
_________________________________________________________________________________________________________ Washington State Auditor's Office 12

Note that approximately 81.4 percent of the governmental activities’ net assets are tied up in capital. Also, note that the City began capitalizing their total infrastructure December 31, 2007. The City uses these capital assets to provide services to its citizens. However, with business-type activities, the City has spent approximately 93.4 percent of its net assets on capital. Capital assets in the business-type activities provide utility services, but they also generate revenues for these funds. Capital assets make up 88.0 percent of the City’s total net assets. The following table provides a summary of the City’s changes in net assets as of December 31, 2008 and December 31, 2007:
Summary of Changes in Net Assets Governmental Business-Type Percentage Activities Activities Total Of Total 2008 2007 2008 2007 2008 2007 2008 2007 Revenues:
Program: Charges for services $ 2,792,164 $ 3,104,957 $ 7,451,951 $ 7,267,521 $ 10,244,115 $ 10,372,478 33.9% 32.2% Fines and forfeits - - - - - - 0.0% 0.0% Miscellaneous - - - - - - 0.0% 0.0% Operating Grants 2,185,724 2,344,634 2,170,479 3,538,026 4,356,203 5,882,660 14.4% 18.2% Capital Grants - - 2,129,720 2,712,877 2,129,720 2,712,877 7.0% 8.4%
General: - - Taxes 12,871,996 12,137,698 - - 12,871,996 12,137,698 42.6% 37.6% Interest 516,374 752,376 104,452 377,980 620,826 1,130,356 2.1% 3.5% Disposition of capital
assets - - - 2,526 - 2,526 0.0% 0.0% Total revenues 18,366,258 18,339,665 11,856,602 13,898,930 30,222,860 32,238,595 100.0% 100.0% Program expenses:
Gen Gov't Services 2,188,444 2,053,476 - - 2,188,444 2,053,476 7.8% 6.3% Public Safety 9,462,715 8,585,131 - - 9,462,715 8,585,131 33.7% 26.5% Highways and Streets 2,977,497 6,075,223 - - 2,977,497 6,075,223 10.6% 18.8% Economic Development - - - - - - 0.0% 0.0% Culture & Recreation 4,751,704 5,186,217 - - 4,751,704 5,186,217 16.9% 16.0% Int & Other Debt Service
Costs (10,830) 588,582 - - (10,830) 588,582 0.0% 1.8% Utilities - - 6,446,603 7,779,869 6,446,603 7,779,869 23.0% 24.0% Other business types - - 2,257,413 2,097,763 2,257,413 2,097,763 8.0% 6.5%
Total expenses 19,369,530 22,488,629 8,704,016 9,877,632 28,073,546 32,366,261 100.0% 100.0% Excess revenues (1,003,272) (4,148,964) 3,152,586 4,021,298 2,149,314 (127,666) - - Transfers 126,683 100,000 (100,000) (100,000) 26,683 - Prior period adjustments 309 18,133,777 (808,911) (744,981) (808,602) 17,388,796 Change in net assets (876,280) 14,084,813 2,243,675 3,176,317 1,367,395 17,261,130 Beginning net assets 38,686,649 24,601,836 43,083,964 39,907,647 81,770,613 64,509,483
Ending net assets $ 37,810,369 $ 38,686,649 $ 45,327,639 $ 43,083,964 $ 83,138,008 $ 81,770,613
_________________________________________________________________________________________________________ Washington State Auditor's Office 13

GOVERNMENTAL REVENUES The City is heavily reliant on three types of taxes to support governmental operations. Property taxes provided 25.3 percent of the revenues for governmental activities. Sales taxes provided 17.8 percent of these revenues, and utility taxes total 17.4 percent. Charges for services totaled 15.2 percent of these revenues. Note that program revenues cover approximately 25.7 percent of governmental operating expenses. This means that the government’s taxpayers and the City’s other general revenues fund 74.3 percent of the governmental activities. As a result, the general economy and the local businesses have a major impact on the City’s revenue streams.
GOVERNMENTAL FUNCTIONAL EXPENSES Public safety costs comprise 48.9 percent of the City’s total governmental expenses. Highways and Streets costs make up 15.4 percent of the total governmental expenses. The general government services expenses are 11.3 percent of governmental expenses. This table presents the cost of each of the City’s programs, including the net costs (i.e., total cost less revenues generated by the activities). The net costs illustrate the financial burden that was placed on the City’s taxpayers by each of these functions.
Governmental Activities Total Cost Net Cost Of Services Of Services 2008 2007 2008 2007 Gen Gov't Services $ 2,188,444 $ 2,053,476 $ (1,096,772) $ (821,334) Public Safety 9,462,715 8,585,131 (7,909,594) (7,081,138) Highways and Streets 2,977,497 6,075,223 (1,908,424) (4,697,504) Culture & Recreation 4,751,704 5,186,217 (3,487,682) (3,850,480) Int & Other Debt Service Costs (10,830) 588,582 10,830 (588,582)
$ 19,369,530 $ 22,488,629 $ (14,391,642) $ (17,039,038) Program revenues covered the program expenses for only one function, interest on long-term debt.
BUSINESS-TYPE ACTIVITIES Revenues vs. Costs
For all enterprise funds, the City reports a current ratio of 6.0 to 1, which is a healthy ratio. The business-type activities report capitalized assets of over $42.3 million, which provide a variety of services to the citizens of Pullman. The business-type activities report $6.4 million in unrestricted net assets, which provides these funds with adequate resources to maintain service levels without substantial increases in their revenue streams. The operating revenues for both of the City’s enterprise funds were up $184,458 or 2.6 percent more than 2007, with operating expenses 10.0 percent less than 2007. Within the total business-type activities of the City, these enterprise funds reported $(2,309,699) operating income compared to operating income of $(3,561,021) for the prior year. A detailed discussion of the major enterprise funds is presented in a separate section below.
_________________________________________________________________________________________________________ Washington State Auditor's Office 14

Financial Analysis of the City’s Funds Governmental funds As discussed, governmental funds are reported in the fund statements with a short-term, inflow and outflow of spendable resources focus. This information is useful in assessing resources available at the end of the year in comparison with upcoming financing requirements. Governmental funds reported ending fund balances of approximately $9.1 million. Of this year-end total, $8.51 million is unreserved indicating availability for continuing City service requirements. Legally restricted fund balances (i.e., the reserved fund balances) include $9,497 committed to debt service and $544,335 committed to the Lawson Expendable Trust, Firemen Pension Fund, and the Cemetery Perpetual Care Fund. The total ending fund balances of governmental funds show a decrease of $1,699,140 or 15.8 percent above the prior year. This increase is primarily the result of the events and programs described within the analysis of the City's governmental activities. Major Governmental Funds The General Fund is the City’s primary operating fund and the largest source of day-to-day service delivery. The General Fund’s fund balance decreased by $83,345. In the prior year, the fund balance increased by $453,207. Unreserved fund balance as a percentage of expenditures was 23.0 percent of operations or slightly less than three months of operations. This is an adequate amount to protect the fund against unforeseen emergencies or downturns in the economy. Taxes totaling $10.51 million made up 70.9 percent of total general fund revenue in 2008 as compared to 67.3 percent in 2007. Sales Taxes increased approximately 5.1 percent as the City experienced continued higher than normal levels of new construction in 2008 General fund expenditures increased $891,721 or approximately 6.48 percent. Much of this increase is related to rising personnel costs related to benefits. Public safety made up 62.4 percent of total expenditures. Since the general fund supports a number of programs in other funds, $231,915 was transferred to these funds including $125,717 to the government buildings fund, $102,281 to the equipment rental fund and $3,917 to the information systems fund. The streets fund ended the year with a decrease in fund balance of $171,814. After the above-mentioned transfers, the net assets balance in the government buildings and the information systems funds were $413,063 and $258,375 respectively. The Proprietary Funds The City reports two primary enterprise funds, of which both are considered major funds. One fund provides the utility services of water and sewer and the other provides transit services to the citizens of Pullman. The City also maintains three internal service funds. The Water and Sewer Systems - The water and sewer systems report net assets of $39.7 million, with 97.1 percent invested in capital assets. The current ratio for this fund is 6.0 to 1 which provides this fund with adequate resources to cover cash flow issues. The water and sewer systems reported operating loss of $697,779 with a total increase in net assets of approximately $2,111,701 million after capital contributions and transfers in from other funds. The operating income amount is more favorable than the operating loss of $2,107,547 in 2007. The total increase in net assets is less favorable than the amount of $2.71 million in 2007. The Transit System - The transit system reports net assets of over $4.7 million, with 80.1 percent invested in capital assets. The current ratio for this fund is 5.9 to 1 which provides this fund with adequate resources to cover cash flow issues.
_________________________________________________________________________________________________________ Washington State Auditor's Office 15

The transit system reported operating loss of $1,611,920 with a total increase in net assets of approximately $25,222 after capital contributions and transfers in from other funds. The operating income amount is less favorable than the loss of $1,453,474 in 2007. The total increase in net assets is less favorable than the amount of $406,160 million in 2007. Budgetary Highlights The General Fund – The General Fund’s original revenue budget was less than the 2008 actual results and expenditure budget was more than the 2008 actual results. The City Council amended both the revenue and expenditure budgets during 2008, which resulted in a 1.0 percent change between the original and final budgets. In total, actual revenues exceeded the final budget by $659,649 or about a 4.65 percent difference. The primary changes to the expenditure budgets are related to building security system improvements and salary and benefit costs relating to a labor contract settlement in the police department, overtime expenditures in the fire department, and one-time transfers to other funds for capital improvement program projects. The primary changes in the revenue budgets are related to donations. The total actual expenditures were approximately $522,395 less than budgeted or 3.44 percent below budget. On the revenue side of the budget, the primary difference between the final budget and the actual amounts relates to sales taxes, other taxes, licenses and permits, and investment earnings. The difference in sales taxes relates to very high levels of construction within the city limits. The differences in other taxes relate to an increase to admission taxes from two high profile concerts, licensing and permits revenues were lower than expected due to a significant decline in building permit activity. Increases to investment earnings are a combination of higher rates and cash balances than were expected. On the expenditure side of the budget, the largest variances between the final budget and the actual amounts occurred in the public safety and culture and recreation functions. The actual amounts expended by the public safety function were less than the final budget by $178,637 but only a 1.9 percent difference. The actual amounts expended by the culture and recreation function were less than the final budget by $159,049 but only a 3.9 percent difference. The City staff considers the annual budget to be an extremely important document and attempts to include in the budget, their best estimate of revenue and expenditures. Capital Assets and Debt Administration Capital assets The City's investment in capital assets, net of accumulated depreciation, for governmental and business-type activities as of December 31, 2008, was $30.8 million and $42.3 million respectively. The total increase in this net investment was 3.2 percent for governmental and a 17.5 percent increase for business-type activities. The overall increase was 11.0 percent for the City as a whole. See Note 6 for additional information about changes in capital assets during the fiscal year and outstanding at the end of the year.
_________________________________________________________________________________________________________ Washington State Auditor's Office 16

The following table provides a summary of capital asset activity.
Capital Assets (Amounts Presented in $1,000's)
Governmental Business-Type Percentage Activities Activities Total Of Total 2008 2007 2008 2007 2008 2007 2008 2007 Non-depreciable assets:
Land $ 1,301 $ 1,235 $ 828 $ 711 $ 2,129 $ 1,946 2.0% 2.0% Construction in progress 2,622 1,102 11,580 7,411 14,202 8,513 13.5% 8.9%
Total non-depreciable 3,923 2,337 12,408 8,122 16,331 10,459 15.6% 11.0% Depreciable assets:
Plant in service - - 48,650 45,354 48,650 45,354 46.3% 47.7% Buildings 5,348 5,135 - - 5,348 5,135 5.1% 5.4% Other improvements 3,259 3,108 - - 3,259 3,108 3.1% 3.3% Machinery and equipment 6,968 6,662 - - 6,968 6,662 6.6% 7.0% Infrastructure 24,420 24,420 - - 24,420 24,420 23.3% 25.7%
Total depreciable assets 39,995 39,324 48,650 45,354 88,645 84,678 84.4% 89.0% Total cost of capital assets 43,918 41,661 61,058 53,476 104,976 95,137 100.0% 100.0% Accumulated depreciation 13,144 11,828 18,743 17,462 31,887 29,290
Book value - capital assets $ 30,774 $ 29,834 $ 42,315 $ 36,013 $ 73,089 $ 65,847 Percentage depreciated 29.9% 28.4% 30.7% 32.7% 30.4% 30.8%
At December 31, 2008, the depreciable capital assets for governmental activities were 29.9 percent depreciated compared to 28.4 percent at December 31, 2007. These percentages provide an indicator that the City is maintaining and replacing their assets at a favorable rate. With the City’s business type activities, 30.7 percent of the asset values were depreciated at December 31, 2008 compared to 32.7 percent at December 31, 2007. These percentages provide an indicator that the City is maintaining and replacing their assets at a favorable rate. Long-term debt At the end of the fiscal year, the City had long-term debt outstanding of $6.97 million. Of this amount, $2,325,000 or 33.4 percent is backed by the full faith and credit of the City (general obligation bonds) with debt service fully funded by voter-approved property taxes or general government revenue. The other major components are $4.6 million supported by pledged revenues generated primarily by the business-type activities of the City (Public Works Trust Fund loans) and the governmental activities of the City (LOCAL Program).
_________________________________________________________________________________________________________ Washington State Auditor's Office 17

During the year, the City retired $911,761 or 13.3 percent of the beginning outstanding borrowed debt balance.
Outstanding Borrowings (in $1,000's)
Governmental Business-Type Activities Activities Totals Percentage 2008 2007 2008 2007 2008 2007 Change
General obligation bonds $ 2,325 $ 2,545 $ - $ - $ 2,325 $ 2,545 -8.6%
Special assessment debt - - - - - - 0.0%
Revenue bonds - - - - - - 0.0%
Capital leases - - - - - - 0.0%
Bank and other loans 299 349 4,341 3,946 4,640 4,295 8.0%
Total $ 2,624 $ 2,894 $ 4,341 $ 3,946 $ 6,965 $ 6,840 1.8% During the year, the City issued $1,035,500 in Public Works Trust Fund (PWTF) Loan debt. The debt per capita was approximately $256.51, which is substantially below the national average. See Note 10 for additional information about the City’s long-term debt. Economic Conditions Affecting the City Since one of the primary revenue streams for the City is sales tax, the City’s sales tax revenues are subject to changes in the economy. Since sales taxes are considered an “elastic” revenue stream, tax collections are higher in a flourishing economy and are lower in a depressed economy. The City of Pullman is not considered a retail center, but has experienced higher than average sales tax collections. The City of Pullman’s sales tax collections have been strong due to high levels of new construction. Based on the weaker building permit issuances in 2008 and decreasing scheduled construction on the Washington State University, new construction is expected to weaken sales tax collections in 2009. The City of Pullman will be negatively impacted by the expected budget reductions facing Washington State University. The City of Pullman is expected to continue to face challenges from significant increases to medical insurance premiums. Contacting the City’s Financial Management This financial report is designed to provide a general overview of the City’s finances, comply with finance-related laws and regulations, and demonstrate the City’s commitment to public accountability. If you have questions about this report or would like to request additional information, contact the City’s Office of Finance, 325 S.E. Paradise Street, Pullman, WA 99163.
_________________________________________________________________________________________________________ Washington State Auditor's Office 18

MCAG: 0820 City of PullmanStatement of Net Assets
December 31, 2008
Governmental Business-typeActivities Activities Total
ASSETSCash and cash equivalents 9,909,437$ 4,531,305$ 14,440,742$ Investments 1,000,754 1,000,754 Receivables (net of allowance for uncollectibles) 734,616 582,321 1,316,937 Due from other government units 476,325 434,620 910,945 Internal balances 915,663 915,663 Inventories 168,658 410,592 579,250 Prepaids 22,667 8,236 30,903 Deferred chargesRestricted assets: Temporarily restricted: Cash and cash equivalents 547,399 20,660 568,059 Investments 575,000 575,000 Intergovernmental receivable 583 583 Permanently restricted: InvestmentsCapital assets (net of accumulated depreciation): Land 1,301,018 827,669 2,128,687 Buildings and system 2,813,901 5,149,068 7,962,969 Improvements other than buildings 1,969,077 14,416,000 16,385,077 Machinery and equipment 2,820,331 10,341,722 13,162,053 Infrastructure 19,248,317 19,248,317 Construction in progress 2,621,588 11,580,501 14,202,089 Total assets 43,208,917 50,219,111 93,428,028
LIABILITIESAccounts payable and other current liabilities 1,142,559 106,545 1,249,104 Matured long term debt - Custodial deposits 322,539 - 322,539 Accrued interest payable 532,945 - 532,945 Accrued wages and benefits - 277,536 277,536 Compensated absences 329,888 134,072 463,960 Unearned revenue 152,734 11,417 164,151 Liabilities payable from restricted assets 10,000 21,360 31,360 Noncurrent liabilities: - Net OPEB obligation 284,047 - 284,047 Due within one year 277,208 641,276 918,484 Due in more than one year 2,346,628 3,699,266 6,045,894 Total liabilities 5,398,548 4,891,472 10,290,020
NET ASSETSInvested in capital assets, net of related debt 28,150,396 37,974,418 66,124,814 Restricted for: Highways and streets - - - Culture and recreation 1,655,033 - 1,655,033 Debt service 9,497 - 9,497 Perpetual care: - - - Expendable - - - Nonexpendable 242,968 - 242,968 Other purposes 301,367 - 301,367 Unrestricted 7,451,108 7,353,221 14,804,329
Total net assets 37,810,369$ 45,327,639$ 83,138,008$
The notes to the financial statements are an integral part of this statement.
Primary Government
_________________________________________________________________________________________________________ Washington State Auditor's Office 19

MC
AG
: 082
0C
ity o
f Pul
lman
Stat
emen
t of A
ctiv
ities
For t
he Y
ear E
nded
Dec
embe
r 31,
200
8
O
pera
ting
Cap
ital
Cha
rges
for
Gra
nts
and
Gra
nts
and
Gov
ernm
enta
lB
usin
ess-
type
Func
tions
/Pro
gram
sEx
pens
esSe
rvic
esC
ontr
ibut
ions
Con
trib
utio
nsA
ctiv
ities
Act
iviti
esTo
tal
Prim
ary
gove
rnm
ent:
G
over
nmen
tal a
ctiv
ities
:
G
ener
al g
over
nmen
t2,
188,
444
$
63
0,49
2$
46
1,18
0$
-
$
(1,0
96,7
72)
$
-$
(1
,096
,772
)$
P
ublic
saf
ety
9,46
2,71
5
750,
948
802,
173
-
(7
,909
,594
)
-
(7,9
09,5
94)
Hig
hway
s an
d st
reet
s2,
977,
497
30
0,96
5
76
8,10
8
-
(1,9
08,4
24)
-
(1
,908
,424
)
C
ultu
re a
nd re
crea
tion
4,75
1,70
4
1,10
9,75
9
154,
263
-
(3
,487
,682
)
-
(3,4
87,6
82)
Inte
rest
on
long
-term
deb
t(1
0,83
0)
-
-
-
10,8
30
-
10,8
30
To
tal g
over
nmen
tal a
ctiv
ities
19,3
69,5
30
2,
792,
164
2,
185,
724
-
(14,
391,
642)
-
(1
4,39
1,64
2)
Bus
ines
s-ty
pe a
ctiv
ities
:
U
tiliti
es6,
446,
603
6,
153,
795
1,
048,
076
1,
520,
426
-
2,27
5,69
4
2,27
5,69
4
Tra
nsit
2,25
7,41
3
1,29
8,15
6
1,12
2,40
3
609,
294
-
77
2,44
0
77
2,44
0
To
tal b
usin
ess-
type
act
iviti
es8,
704,
016
7,
451,
951
2,
170,
479
2,
129,
720
-
3,04
8,13
4
3,04
8,13
4
Tota
l prim
ary
gove
rnm
ent
28,0
73,5
46$
10
,244
,115
$
4,35
6,20
3$
2,12
9,72
0$
(14,
391,
642)
3,04
8,13
4
(11,
343,
508)
Gen
eral
reve
nues
:
Pro
perty
taxe
s4,
824,
927
-
4,82
4,92
7
S
ales
taxe
s3,
431,
430
-
3,43
1,43
0
U
tility
taxe
s3,
464,
890
-
3,46
4,89
0
B
usin
ess
taxe
s27
5,28
1
-
275,
281
E
xcis
e ta
xes
-
-
-
Oth
er ta
xes
875,
468
-
87
5,46
8
Gra
nts
and
cont
ribut
ions
not
rest
ricte
d to
spe
cific
pro
gram
s-
-
Unr
estri
cted
inve
stm
ent e
arni
ngs
516,
374
104,
452
620,
826
L
oss
on s
ale
of c
apita
l ass
ets
-
-
-
Tr
ansf
ers
126,
683
(100
,000
)
26,6
83
Tot
al g
ener
al re
venu
es a
nd tr
ansf
ers
13,5
15,0
53
4,
452
13
,519
,505
Prio
r yea
r adj
ustm
ents
309
-
30
9
Cha
nge
in n
et a
sset
s(8
76,2
80)
3,
052,
586
2,
176,
306
P
rior y
ear n
et a
sset
cha
nge
for t
his
stat
emen
t(8
08,9
11)
(8
08,9
11)
N
et a
sset
s - b
egin
ning
38,6
86,6
49
43
,083
,964
81,7
70,6
13
N
et a
sset
s - e
ndin
g37
,810
,369
$
45,3
27,6
39$
83
,138
,008
$
The
note
s to
the
finan
cial
sta
tem
ents
are
an
inte
gral
par
t of t
his
stat
emen
t.
Prim
ary
Gov
ernm
ent
Net
(Exp
ense
) Rev
enue
and
Cha
nges
in N
et A
sset
sPr
ogra
m R
even
ues
_________________________________________________________________________________________________________ Washington State Auditor's Office 20
MCAG: 0820 City of PullmanBalance Sheet
Governmental FundsDecember 31, 2008
Other TotalGeneral Streets Governmental Governmental
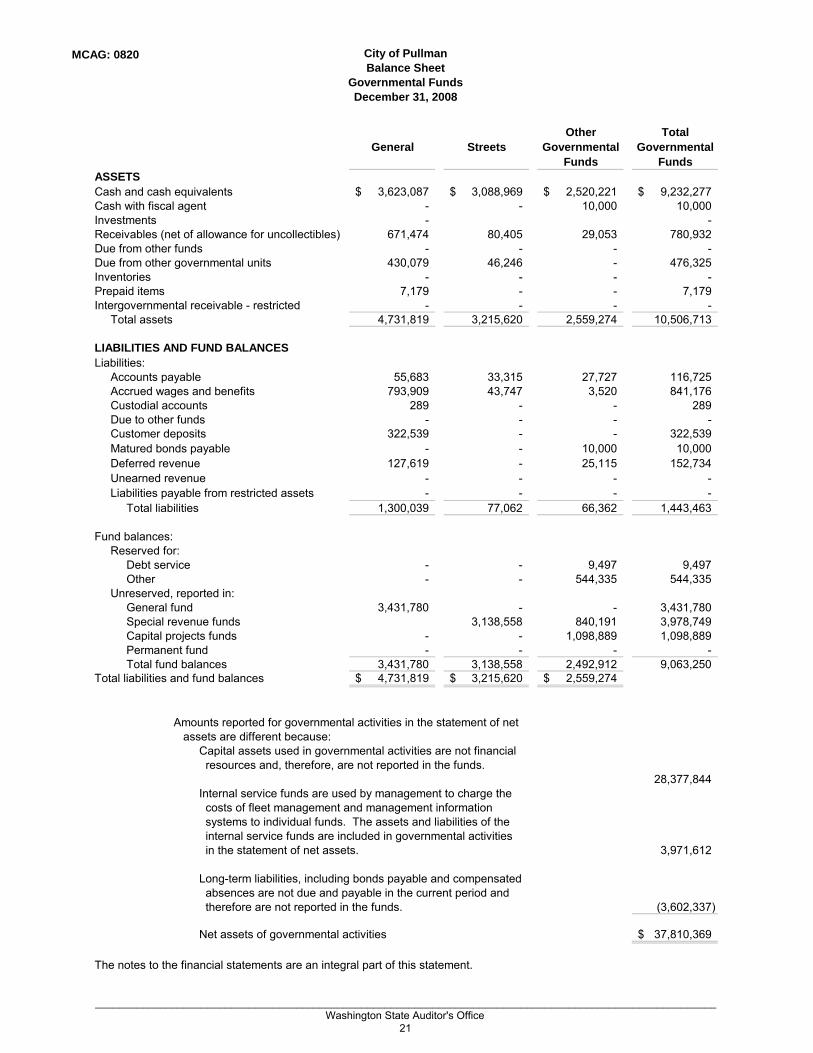
Funds FundsASSETSCash and cash equivalents 3,623,087$ 3,088,969$ 2,520,221$ 9,232,277$ Cash with fiscal agent - - 10,000 10,000 Investments - - Receivables (net of allowance for uncollectibles) 671,474 80,405 29,053 780,932 Due from other funds - - - - Due from other governmental units 430,079 46,246 - 476,325 Inventories - - - - Prepaid items 7,179 - - 7,179 Intergovernmental receivable - restricted - - - - Total assets 4,731,819 3,215,620 2,559,274 10,506,713
LIABILITIES AND FUND BALANCESLiabilities: Accounts payable 55,683 33,315 27,727 116,725 Accrued wages and benefits 793,909 43,747 3,520 841,176 Custodial accounts 289 - - 289 Due to other funds - - - - Customer deposits 322,539 - - 322,539 Matured bonds payable - - 10,000 10,000 Deferred revenue 127,619 - 25,115 152,734 Unearned revenue - - - - Liabilities payable from restricted assets - - - - Total liabilities 1,300,039 77,062 66,362 1,443,463
Fund balances: Reserved for: Debt service - - 9,497 9,497 Other - - 544,335 544,335 Unreserved, reported in: General fund 3,431,780 - - 3,431,780 Special revenue funds 3,138,558 840,191 3,978,749 Capital projects funds - - 1,098,889 1,098,889 Permanent fund - - - - Total fund balances 3,431,780 3,138,558 2,492,912 9,063,250 Total liabilities and fund balances 4,731,819$ 3,215,620$ 2,559,274$
Amounts reported for governmental activities in the statement of net assets are different because: Capital assets used in governmental activities are not financial resources and, therefore, are not reported in the funds.
28,377,844 Internal service funds are used by management to charge the costs of fleet management and management information systems to individual funds. The assets and liabilities of the internal service funds are included in governmental activities in the statement of net assets. 3,971,612
Long-term liabilities, including bonds payable and compensated absences are not due and payable in the current period and therefore are not reported in the funds. (3,602,337)
Net assets of governmental activities 37,810,369$
The notes to the financial statements are an integral part of this statement.
_________________________________________________________________________________________________________ Washington State Auditor's Office 21

MCAG: 0820 City of PullmanStatement of Revenues, Expenditures, and Changes in Fund Balances
Governmental FundsFor the Year Ended December 31, 2008
Other TotalGeneral Streets Governmental Governmental
Funds FundsREVENUESTaxes: Property 3,865,223$ 197,407$ 762,297$ 4,824,927$ Sales 3,431,430 - - 3,431,430 Utility 2,342,490 1,122,400 - 3,464,890 Business - - 275,281 275,281 Excise - - - - Other 875,469 - - 875,469 Licenses and permits 341,711 555 - 342,266 Intergovernmental 1,257,550 768,108 79,869 2,105,527 Charges for services 2,165,033 - 7,532 2,172,565 Fines 108,188 - - 108,188 Investment earnings 294,745 37,795 137,123 469,663 Contributions and donations 53,021 9,759 2,113 64,893 Facility rentals 45,900 - - 45,900 Other miscellaneous revenues 52,940 5,780 - 58,720 Total revenues 14,833,700 2,141,804 1,264,215 18,239,719
EXPENDITURESCurrent: General government 1,326,197 - - 1,326,197 Public safety 9,141,693 - - 9,141,693 Highway and streets 258,671 1,416,821 - 1,675,492 Transportation - - - - Economic and physical development - - - - Culture and recreation 3,933,878 - 978,812 4,912,690 Debt service: Principal - - 220,000 220,000 Debt issuance - - - - Interest - - 150,596 150,596 Debt service costs - - 607 607 Capital outlay: Land - - - Buildings - - 910,231 910,231 Highway and streets - 46,883 - 46,883 Improvements - 928,327 451,945 1,380,272 Total expenditures 14,660,439 2,392,031 2,712,191 19,764,661 Excess (deficiency) of revenues over (under) expenditures 173,261 (250,227) (1,447,976) (1,524,942)
OTHER FINANCING SOURCES (USES)Transfers in - 119,040 430,927 549,967 Transfers out (231,915) (40,628) (426,931) (699,474) Bond proceeds - - - - Prior year adjustments and change in reserves (24,691) - - (24,691) Total other financing sources and uses (256,606) 78,412 3,996 (174,198) Net change in fund balances (83,345) (171,815) (1,443,980) (1,699,140) Fund balances - beginning 3,515,125 3,310,373 3,936,892 10,762,390 Fund balances - ending 3,431,780$ 3,138,558$ 2,492,912$ 9,063,250$
The notes to the financial statements are an integral part of this statement.
_________________________________________________________________________________________________________ Washington State Auditor's Office 22

MCAG: 0820 City of PullmanReconciliation of the Statement of Revenues,
Expenditures, and Changes in Fund Balances of Governmental FundsFor the Year Ended December 31, 2008
Amounts reported for governmental activities in the statement of activities aredifferent because:
Net change in fund balances- total governmental funds (1,699,140)$
Governmental funds report capital outlays as expenditures. However, in the 1,019,153 statement of activities the cost of those assets is allocated over their
estimated useful lives and reported as depreciation expense. This is the amount by which capital outlays exceed depreciation in the current period.
The net effect of various miscellaneous transactions involving changes in fund balance (258,785)(i.e. prior year adjustments, changes in reserves) is to decrease net assets
The issuance of long term debt provides current financial resources to governmental 220,000funds, while the repayment of the principal; of long-term debt consumes the current financial resources of governmental funds. Neither transaction, however,has any effect on net assets.
Some expenses reported in the statement of activities do not require the use of (284,047) current financial resources and, therefore, are not reported asexpenditures in governmental funds.
Internal service funds are used by management to charge the costs of fleetmanagement and management information systems to individual funds.
The net revenue of certain activities of internal service funds is reported with 126,539governmental activities.
Change in net assets of governmental activities (876,280)
The notes to the financial statements are an integral part of this statement.
_________________________________________________________________________________________________________ Washington State Auditor's Office 23

MCAG: 0820 City of PullmanGeneral Fund
Statement of Revenues, Expenditures, and Changes in Fund Balances - Budget and ActualFor the Year Ended December 31, 2008
Variance with Final Budget -
PositiveOriginal Final Actual Amounts (Negative)
REVENUESTaxes: Property 3,902,672$ 3,902,672$ 3,865,223$ (37,449)$ Sales 2,974,472 2,974,472 3,431,430 456,958 Utility 2,373,673 2,373,673 2,342,490 (31,183) Other 699,063 699,063 875,469 176,406 Licenses and permits 474,790 474,790 341,711 (133,079) Intergovernmental 1,257,108 1,257,108 1,257,550 442 Charges for services 2,078,235 2,078,235 2,165,033 86,798 Fines 111,500 111,500 108,188 (3,312) Investment earnings 175,000 175,000 294,745 119,745 Contributions and donations 6,500 43,038 53,021 9,983 Facility rentals 51,000 51,000 45,900 (5,100) Other miscellaneous revenues 33,500 33,500 52,940 19,440 Total revenues 14,137,513 14,174,051 14,833,700 659,649
EXPENDITURESCurrent: General government: Council 137,745 137,745 112,185 25,560 Manager 172,423 172,423 170,473 1,950 Attorney 84,830 84,830 94,263 (9,433) Personnel 95,311 95,311 92,481 2,830 Finance and administration 780,590 780,590 715,184 65,406 Other - unclassified 211,109 211,109 141,611 69,498 Total general government 1,482,008 1,482,008 1,326,197 155,811 Public safety: Police 4,908,097 5,011,818 4,848,800 163,018 Fire 3,852,791 3,953,810 3,956,329 (2,519) Inspection 354,702 354,702 336,564 18,138 Total public safety 9,115,590 9,320,330 9,141,693 178,637 Highway and streets 287,569 287,569 258,671 28,898 Culture and recreation 4,045,389 4,092,927 3,933,878 159,049 Total expenditures 14,930,556 15,182,834 14,660,439 522,395 Excess of revenues over expenditures (793,043) (1,008,783) 173,261 1,182,044
OTHER FINANCING SOURCES (USES)Transfers inTransfers out (61,923) (187,640) (231,915) (44,275) Capital leases - Prior year adjustments and change in reserves - - (24,691) (24,691) Sale of capital assets - - - - Total other financing sources and uses (61,923) (187,640) (256,606) (68,966) Net change in fund balances (854,966) (1,196,423) (83,345) 1,113,078 Fund balances - beginning (923,972) (2,730,458) 3,515,125 6,245,583 Fund balances - ending (1,778,938)$ (3,926,881)$ 3,431,780$ 7,358,661$
The notes to the financial statements are an integral part of this statement.
Budgeted Amounts
_________________________________________________________________________________________________________ Washington State Auditor's Office 24

MCAG: 0820 City of PullmanStreet Fund
Statement of Revenues, Expenditures, and Changes in Fund Balances - Budget and ActualFor the Year Ended December 31, 2008
Variance withFinal Budget -
PositiveOriginal Final Actual Amounts (Negative)
REVENUESTaxes: Property 150,000$ 150,000$ 197,407$ 47,407$ Sales - - Utility 1,000,000 1,000,000 1,122,400 122,400 Business - - Excise - - Other - - Licenses and permits 500 500 555 55 Intergovernmental 833,217 833,217 768,108 (65,109) Charges for services - Fines - Special assessments - - Investment earnings 90,000 90,000 37,795 (52,205) Contributions and donations 9,759 9,759 Facility rentals - - Other miscellaneous revenues 500 500 5,780 5,280 Total revenues 2,074,217 2,074,217 2,141,804 67,587
EXPENDITURESCurrent: - General government - Public safety - Highway and streets 1,488,375 1,582,747 1,416,820 (165,927) Transportation - Economic and physical development - Culture and recreation - Debt service: - Principal - Interest - Debt service costs - Capital outlay: - Highway and streets 150,000 150,000 46,883 (103,117) Improvements 640,500 950,500 928,327 (22,173) Total expenditures 2,278,875 2,683,247 2,392,030 (291,217) Excess (deficiency) of revenues over (under) expenditures (204,658) (609,030) (250,226) (223,630)
OTHER FINANCING SOURCES (USES)Transfers in 100,000 119,040 119,040 - Transfers out (40,628) (40,628) - Prior year adjustments and change in reserves - Total other financing sources and uses 100,000 78,412 78,412 - Net change in fund balances (104,658) (530,618) (171,814) 358,804 Fund balances - beginning 140,732 241,012 3,310,373 3,069,361 Fund balances - ending 36,074$ (289,606)$ 3,138,559$ 3,428,165$
The notes to the financial statements are an integral part of this statement.
Budgeted Amounts
_________________________________________________________________________________________________________ Washington State Auditor's Office 25

MCAG: 0820 City of PullmanStatement of Net Assets
Proprietary FundsDecember 31, 2008
Governmental
Activities-Utility Transit Internal
Current Year Current Year Totals Service FundsASSETSCurrent assets: Cash and cash equivalents 3,752,951$ 778,354$ 4,531,305$ 1,214,559$ Cash with fiscal agent - - - - Investments 1,000,754 - 1,000,754 - Interest receivable 13,969 - 13,969 12,059 Accounts receivable 355,922 56 355,978 - Due from other funds - - - - Other current receivable - 212,374 212,374 4,862 Intergovernmental receivable 292,100 142,520 434,620 4,191 Inventories 410,592 - 410,592 168,658 Prepaid Items 6,046 2,190 8,236 15,488 Total current assets 5,832,334 1,135,494 6,967,828 1,419,817 Noncurrent assets: Restricted cash, cash equivalents, and investments: Customer deposits 20,660 - 20,660 - Investments - - - 575,000 Total restricted assets 20,660 - 20,660 575,000 Deferred charges - - - - Capital assets: Land 827,669 - 827,669 - Buildings and system 6,823,736 1,865,052 8,688,788 - Improvements other than buildings 18,992,694 98,189 19,090,883 - Machinery and equipment 16,763,313 4,106,816 20,870,129 4,928,112 Construction in progress 11,570,501 10,000 11,580,501 - Less accumulated depreciation (16,456,130) (2,286,880) (18,743,010) (2,435,800) Total capital assets (net of accumulated depreciation) 38,521,783 3,793,177 42,314,960 2,492,312 Total noncurrent assets 38,542,443 3,793,177 42,335,620 3,067,312 Total assets 44,374,777 4,928,671 49,303,448 4,487,129
Business-type Activities-Enterprise Funds
_________________________________________________________________________________________________________ Washington State Auditor's Office 26

MCAG: 0820 City of PullmanStatement of Net Assets
Proprietary FundsDecember 31, 2008
Governmental
Utility Transit Activities-Current Year Current Year Internal
401 405 Totals Service FundsLIABILITIESCurrent liabilities: Accounts payable 98,533 8,012 106,545 104,522 Matured long term debt - - - - Compensated absences 86,370 47,702 134,072 32,312 Accrued wages and benefits 139,631 137,905 277,536 79,847 Revenues in advance 11,417 - 11,417 - Matured bonds payable - - - - Matured interest payable - - - - Accrued interest payable - - - - Long term debt - current portion 641,276 - 641,276 - Capital leases payable - current - - - - Total current liabilities 977,227 193,619 1,170,846 216,681
Current liabilities payable from restricted assets: Customer deposits payable 21,360 - 21,360 - Revenue bonds payable - - - - Accrued interest payable - - - - Total current liabilities payable from restricted assets 21,360 - 21,360 -
Noncurrent liabilities: General obligation bonds payable (net of unamortized discounts) 3,699,266 - 3,699,266 Revenue bonds payable (net of unamortized discounts and deferred amount on refunding) - - - - Capital leases payable - - - - Due to other governments - - 298,836 Total noncurrent liabilities 3,699,266 - 3,699,266 298,836 Total liabilities 4,697,853 193,619 4,891,472 515,517
NET ASSETSInvested in capital assets, net of related debt 34,181,241 3,793,177 37,974,418 2,193,476 Restricted for debt service - - - - Unrestricted 5,495,683 941,875 6,437,558 1,778,136 Total net assets 39,676,924$ 4,735,052$ 44,411,976$ 3,971,612$
Adjustment to reflect the consolidation of internal service fund activities related to enterprise funds. 915,663
Net assets of business-type activities 45,327,639$
The notes to the financial statements are an integral part of this statement.
Business-type Activities-Enterprise Funds
_________________________________________________________________________________________________________ Washington State Auditor's Office 27

MCAG: 0820 City of PullmanStatement of Revenues, Expenses, and Changes in Fund Net Assets
Proprietary FundsFor the Year Ended December 31, 2008
Governmental
Activities-Utility Transit Internal
Current Year Current Year Totals Service FundsOperating revenues: Charges for sales and services Water and Sewer sales 5,702,732$ -$ 5,702,732$ -$ Sewer charges pledged as security for revenue bonds - - - - Tap fees - unpledged 267,488 - 267,488 - Transit sales - 1,292,809 1,292,809 - Other services 46,951 - 46,951 2,922,511 Total operating revenues 6,017,171 1,292,809 7,309,980 2,922,511 Operating expenses: Costs of sales and services 5,566,281 2,381,924 7,948,205 2,859,386 Administration - 275,885 275,885 367,722 Depreciation 1,148,669 246,920 1,395,589 313,920 Total operating expenses 6,714,950 2,904,729 9,619,679 3,541,028 Operating income (697,779) (1,611,920) (2,309,699) (618,517)
Nonoperating revenues (expenses): Intergovernmental 1,048,076 1,731,697 2,779,773 - Investment earnings 104,354 98 104,452 46,711 Interest expense - - - - Gain (Loss) on sale of fixed assets - - - 100 Other nonoperating revenues (expenses) 136,624 5,347 141,971 84,457 Total nonoperating revenue (expenses) 1,289,054 1,737,142 3,026,196 131,268 Income before contributions and transfers 591,275 125,222 716,497 (487,249) Capital contributions 1,520,426 - 1,520,426 - Prior year adjustments - - - 25,000 Transfers in - - - 231,915 Transfers out - (100,000) (100,000) - Change in net assets 2,111,701 25,222 2,136,923 (230,334) Total net assets - beginning 37,565,223 4,709,830 4,201,946 Total net assets - ending 39,676,924$ 4,735,052$ 3,971,612$
Adjustment to reflect the consolidation of internal service fund activities related to enterprise funds. 915,663
Change in net assets of business-type activities 3,052,586$
The notes to the financial statements are an integral part of this statement.
Business-type Activities-Enterprise Funds
_________________________________________________________________________________________________________ Washington State Auditor's Office 28

MCAG: 0820 City of PullmanStatement of Cash Flows
Proprietary FundsFor the Year Ended December 31, 2008
Governmental Activities-
Utility Transit InternalCurrent Year Current Year Totals Service Funds
CASH FLOWS FROM OPERATING ACTIVITIES Receipts from customers and users 8,105,901$ 1,435,320$ 9,541,221$ Receipts from interfund services provided - - - 4,099,898 Payments to suppliers (5,593,322) (236,762) (5,830,084) (2,621,057) Payments to employees (1,771,866) (1,711,094) (3,482,960) (960,622) Payments for interfund services used (518,889) (692,904) (1,211,793) (881,148) Net cash provided by operating activities 221,824 (1,205,440) (983,616) (362,929) CASH FLOWS FROM OPERATING FINANCING ACTIVITIES Transfers to other funds - (100,000) (100,000) - Transfers from other funds - - - 231,915 Financing available for operating purposes - - - - Taxes available for operating purposes - 1,123,924 1,123,924 - Proceeds from nonoperating 149,200 617,170 766,370 84,557 Net cash provided (used) by noncapital and related financing activities 149,200 1,641,094 1,790,294 316,472
CASH FLOWS FROM CAPITAL AND RELATED FINANCING ACTIVITIES Proceeds from capital debt 1,035,500 - 1,035,500 - Capital contributions 970,926 - 970,926 - Purchases of capital assets - - - - Acquisition and construction of capital assets (6,391,821) (103,674) (6,495,495) (391,453) Principal paid on capital debt (641,276) - (641,276) - Interest paid on capital debt (16,079) - (16,079) - Proceeds from sales of capital assets - - - - Net cash provided (used) by capital and related financing activities (5,042,750) (103,674) (5,146,424) (391,453)
CASH FLOWS FROM INVESTING ACTIVITIES Proceeds from sales and maturities of investments 1,000,000 - 1,000,000 13,350 Purchases of investments (1,000,000) - (1,000,000) (13,350) Premiums and Discounts 1,000 - 1,000 - Interest and dividends received 103,842 98 103,940 46,712 Net cash provided (used) by investing activities 104,842 98 104,940 46,712
Net increase in cash and cash equivalents (4,566,884) 332,078 (4,234,806) (391,198)
Cash and cash equivalents, January 1 8,340,495 446,276 8,786,771 1,605,757
Cash and cash equivalents, December 31 3,773,611$ 778,354$ 4,551,965$ 1,214,559$
Business-type Activities-Enterprise Funds
_________________________________________________________________________________________________________ Washington State Auditor's Office 29

MCAG: 0820 City of PullmanStatement of Cash Flows
Proprietary FundsFor the Year Ended December 31, 2008
Reconciliation of operating income to net cash provided (used) by operating activities: Operating income (697,779)$ (1,611,920)$ (2,309,699)$ (618,517)$ Adjustments to reconcile operating income to net cash provided (used) by operating activities: Depreciation expense 1,148,669 246,920 1,395,589 313,920 Prior period adjustments - - - 25,000 (Increase) decrease in accounts receivable 19,658 1,299 20,957 (5,460) (Increase) decrease in current receivable 351,319 36,208 387,527 - (Increase) decrease in intergovernmental receivable 28,004 103,447 131,451 - (Increase) decrease in interest receivable (512) - (512) (1,691) (Increase) decrease in inventories (170,967) - (170,967) (23,956) (Increase) decrease in prepaid items (2,601) (252) (2,853) (1,691) Increase (decrease) in customer deposits (1,045) - (1,045) - Increase (decrease) in accounts payable (849,087) (2,297) (851,384) (57,378) Increase (decrease) in long term obligations - - - - Increase (decrease) in advance revenues 3,361 - 3,361 - Increase (decrease) in compensated absences payable 1,573 4,675 6,248 (2,702) Increase (decrease) in intergovernmental payables 394,224 - 394,224 - Increase (decrease) in accrued wages and benefits (2,993) 16,480 13,487 9,546 Total adjustments 919,603 406,480 1,326,083 255,588 Net cash provided by operating activities 221,824$ (1,205,440)$ (983,616)$ (362,929)$
NON-CASH ACTIVITIES:Assets contributed from developers and customers 549,500$
The notes to the financial statements are an integral part of this statement.
_________________________________________________________________________________________________________ Washington State Auditor's Office 30
MCAG: 0820 City of PullmanStatement of Fiduciary Net Assets
Fiduciary FundsDecember 31, 2008
Lawson Airport Investment Trust Agency
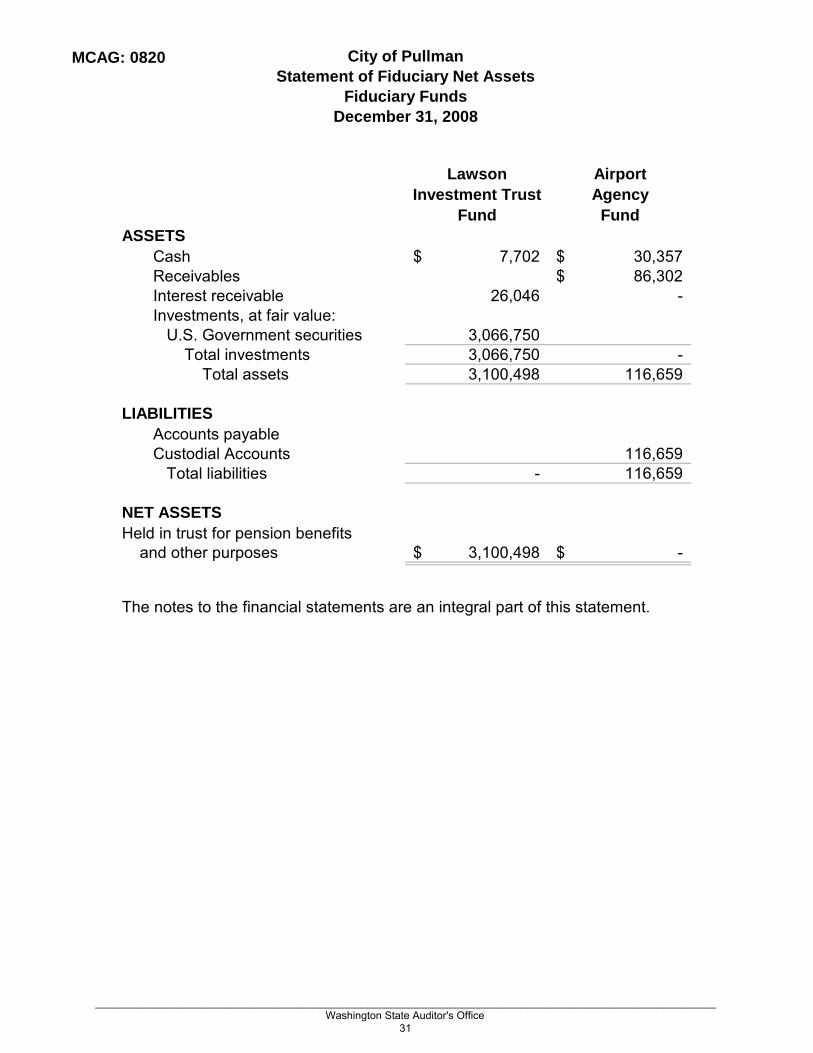
Fund FundASSETS Cash 7,702$ 30,357$ Receivables 86,302$ Interest receivable 26,046 - Investments, at fair value: U.S. Government securities 3,066,750 Total investments 3,066,750 - Total assets 3,100,498 116,659 LIABILITIES Accounts payable Custodial Accounts 116,659 Total liabilities - 116,659
NET ASSETSHeld in trust for pension benefits and other purposes 3,100,498$ -$
The notes to the financial statements are an integral part of this statement.
_________________________________________________________________________________________________________ Washington State Auditor's Office 31

MCAG: 0820 City of PullmanStatement of Changes in Fiduciary Net Assets
Fiduciary FundsFor the Year Ended December 31, 2008
Lawson GardensInvestment Trust
FundADDITIONSContributions: Employer -$ Plan members - Private donations - Other Sources - Total Contributions - Investment earnings: Interest 139,151 Net increase in the fair value of investments 26,830 Total investment earnings 165,981 Less investment expense Net investment earnings 165,981 Total additions 165,981
DEDUCTIONS Refunds of contributions (80,323) Prior Year refunds of contributions - Total deductions (80,323) Change in net assets 85,658 Net assets - beginning 3,014,840 Net assets - ending 3,100,498$
The notes to the financial statements are an integral part of this statement.
_________________________________________________________________________________________________________ Washington State Auditor's Office 32

NOTES TO FINANCIAL STATEMENTS NOTE 1 - SUMMARY OF SIGNIFICANT ACCOUNTING POLICIES The financial statements of the City of Pullman have been prepared in conformity with generally accepted accounting principles (GAAP) as applied to governmental units. The Governmental Accounting Standards Board (GASB) is the accepted standard setting body for establishing governmental accounting and financial reporting principles. The significant accounting policies are described below. In June 1999, the Governmental Accounting Standards Board (GASB) unanimously approved “Basic Financial Statements and Management Discussion and Analysis for State and Local Governments” (Statement #34). This Statement provides for the most significant change in financial reporting in over twenty years and was scheduled for a phased implementation (based on size of government) starting with fiscal years ending 2003 (for Phase 2 governments). As part of the Statement, there is a new reporting requirement regarding the local government’s infrastructure (roads, bridges, traffic signals, etc.). As permitted by GASB #34, the City of Pullman delayed the implementation of the infrastructure reporting requirement to the fiscal year ending in 2007. The City implemented the basic model for fiscal year 2003 and has implemented the infrastructure-related portion for the fiscal year ending 2007. The Financial Statements and the Management Discussion and Analysis include the required infrastructure reporting and related adjustments and entries. A. Reporting Entity
The City of Pullman was incorporated on April 11, 1888, and operates under the laws of the state of Washington applicable to a non-charter code City with a mayor-council form of government. As required by the generally accepted accounting principles, the financial statements present the City of Pullman - the primary government.
The Pullman-Moscow Airport provides airport services to the region surrounding the City of Pullman. This activity is neither directly controlled nor dependent upon the City. It is directed by a board of directors composed of representatives from the City of Pullman, Port of Whitman, Washington State University, the City of Moscow, Idaho, the University of Idaho and Latah County, Idaho, and derives some financial support from each of these entities. It is not a separate taxing authority. The interlocal agreement establishing this activity directs the City of Pullman to maintain the financial records and reports as required by the laws of the State of Washington. The combined financial statements therefore also include the Pullman-Moscow Airport Agency fund. The Pullman-Moscow Airport also issues its own separate and distinct financial statements. Blended Component Unit
The elected 7-member council of the City of Pullman serves in an ex-officio capacity as the board of metropolitan park commissioners for the City of Pullman Metropolitan Park District. Although the District is legally separated from the City, the District is reported as if it were part of primary government because its sole purpose is to provide for management, maintenance and improvement of the parks and recreational facilities within the City of Pullman boundaries.
_________________________________________________________________________________________________________ Washington State Auditor's Office 33

B. Government-Wide and Fund Financial Statements
The government-wide financial statements (i.e., the statement of net assets and the statement of changes in net assets) report information on all of the nonfiduciary activities of the primary government. For the most part, the effects of interfund activity have been removed from these statements. Governmental activities, which normally are supported by taxes and intergovernmental revenues, are reported separately from business-type activities, which rely to a significant extent on fees and charges for support. The statement of activities demonstrates how the direct expenses of a given function or segments are offset by program revenues. Direct expenses are those that are clearly identifiable with a specific function or segment. Program revenues include 1) charges to customers or applicants who purchase, use or directly benefit from goods, services, or privileges provided by a given function or segment and 2) grants and contributions that are restricted to meeting the operational or capital requirements of a particular function or segment. Taxes and other items not properly included among program revenues are reported instead as general revenues. Separate fund financial statements are provided for governmental funds, proprietary funds, and fiduciary funds, even though the latter are excluded from the government-wide financial statements. Major individual governmental funds and major individual enterprise funds are reported as separate columns in the fund financial statements.
C. Measurement Focus, Basis of Accounting, and Financial Statement Presentation
The government-wide financial statements are reported using the economic resources measurement focus and the accrual basis of accounting, as are the proprietary fund and fiduciary fund financial statements. Revenues are recorded when earned and expenses are recorded when a liability is incurred, regardless of the timing of related cash flows. Property taxes are recognized as revenues in the year for which they are levied. Sales taxes, utility taxes, and other derived tax revenues are accrued in the period in which the underlying exchange transaction occurs. Grants and similar items are recognized as revenue as soon as all eligibility requirements imposed by the provider have been met. Governmental fund financial statements are reported using the current financial resources measurement focus and the modified accrual basis of accounting. Revenues are recognized as soon as they are both measurable and available. Revenues are considered to be available when they are collectible within the current period or soon enough thereafter to pay liabilities of the current period. For this purpose, the City considers revenues to be available if they are collected within 30 days of the end of the current fiscal period. Expenditures generally are recorded when a liability is incurred, as under accrual accounting. However, debt service expenditures, as well as expenditures related to compensated absences, and claims and judgments, are recorded only when payment is due. Property taxes and interest associated with the current period are all considered to be susceptible to accrual and so have been recognized as current fiscal period revenues. Only the portion of special assessment receivable due within the current fiscal period is considered to be susceptible to accrual as revenue of the current period. All other revenue items are considered to be measurable and available only when cash is received by the City.
_________________________________________________________________________________________________________ Washington State Auditor's Office 34

The City reports the following major governmental funds: The General Fund is the City’s primary operating fund. It accounts for all financial resources of the general government, except for those required to be accounted in another fund. The Arterial and Street Funds (presented together as one major fund) are responsible for the maintenance of all city streets, street lighting, and bridges. The City reports the following major proprietary funds: The Utility and Utility Capital Projects Funds account for all revenues derived from and expenses incurred in the operation and construction of the water distribution. The fund also accounts for all revenue derived from and expenses incurred in the operation and construction of the wastewater treatment plant and the sewer system of the City. The Transit Fund accounts for all revenues derived from and expenses incurred in the operation of the public transit system. Additionally, the City reports the following fund types: Internal service funds account for the equipment rental division and information systems management, and government building maintenance provided to other departments of the City on a cost reimbursement basis. The private purpose trust fund accounts for contributions and donations from private sources to be expended for improvements and maintenance of the Lawson Gardens Park. Private-sector standards of accounting and financial reporting issued prior to December 1, 1989, generally are followed in both the government-wide and proprietary fund financial statements to the extent that those standards do not conflict with or contradict guidance of the Governmental Accounting Standards Board. Governments also have the option of following subsequent private-sector guidance for their business-type activities and enterprise funds, subject to this same limitation. The City has elected not to follow subsequent private-sector guidance. As a general rule the effect of interfund activity has been eliminated from the government-wide financial statements. Exceptions to this general rule are payments-in-lieu of taxes and other charges between the City’s sewer and water functions and various other functions of the City. Elimination of these charges would distort the direct costs and program revenues reported for the various functions concerned. Amounts reported as program revenues include 1) charges to customers or applicants for goods, services, or privileges provided, 2) operating grants and contributions, and 3) capital grants and contributions. Internally dedicated resources are reported as general revenues rather than as program revenues. Likewise, general revenues include all taxes. Proprietary funds distinguish operating revenues and expenses from nonoperating items. Operating revenues and expenses generally result from providing services and producing and delivering goods in connection with a proprietary fund’s principal ongoing operations. The principal operating revenues of the Utility enterprise fund and of the City’s internal
_________________________________________________________________________________________________________ Washington State Auditor's Office 35

service funds are charges to customers for sales and services. Operating expenses for enterprise fund and internal service funds include the cost of sales and services, administrative expenses, and depreciation on capital assets. All revenues and expenses not meeting this definition are reported as nonoperating revenues and expenses. When both restricted and unrestricted resources are available for use, it is the City’s policy to use restricted resources first, and then unrestricted resources as they are needed.
D. Budgets and Budgetary Accounting
1. Scope of Budget Annual appropriated budgets are adopted for all governmental fund types and for all proprietary funds on the modified accrual basis of accounting. For governmental funds, there are no differences between the budgetary basis and generally accepted accounting principles. Budgetary accounts are integrated in fund ledgers for all budgeted funds, but the financial statements include budgetary comparisons for only the two major Governmental Funds: General and Arterial/Streets. NCGA Statement 1 does not require, and the financial statements do not present, budgetary comparisons for proprietary fund types.
Annual appropriated budgets are adopted at the fund level, except in the General Fund, where expenditures may not exceed appropriations at the department level and the budgets constitute the legal authority for expenditures at that level. Subsidiary revenue and expenditure ledgers are used to compare the budgeted amounts with actual revenues and expenditures. As a management control device, the subsidiary ledgers monitor expenditures for individual department functions and activities by object class.
Appropriations for general and special revenue funds lapse at year-end.
2. Procedures for Adopting the Original Budget
The City's budget procedures are mandated by RCW 35A.33. The steps in the budget process are as follows:
a. Prior to November 1 the mayor submits a proposed budget to the city
council. This budget is based on priorities established by the council and estimates provided by City departments during preceding months and bal-anced with revenue estimates made by the Finance Director.
b. The council conducts public hearings on the proposed budget in November
and December.
c. The council makes its adjustments to the proposed budget and adopts by ordinance a final balanced budget no later than December 31.
d. Within 30 days of adoption, the final budget is available to the public.
_________________________________________________________________________________________________________ Washington State Auditor's Office 36

3. Amending the Budget
The mayor is authorized to transfer budgeted amounts between departments within any fund; however, any revisions that alter the total expenditures of a fund, or that affect the number of authorized employee positions, salary ranges, hours, or other conditions of employment must be approved by the city council.
When the city council determines that it is in the best interest of the City to increase or decrease the appropriation for a particular fund it may do so by ordinance ap-proved by one more than the majority after holding a public hearing.
The budget amounts shown in the financial statements are the original and final authorized amounts as revised during the year. The financial statements contain the original and final budget information. The original budget is the first complete appropriated budget. The final budget is the original budget adjusted by all reserves, transfers, allocations, supplemental appropriations, and other legally authorized changes applicable for the fiscal year.
4. Excess of Expenditures Over Appropriations
The Fire Services Division within the General Fund had $2,520 worth of expenditures in excess of appropriations. The expenditures were funded by General Fund reserves. The Transit Fund had $33,931 worth of expenditures in excess of appropriations. The expenditures were funded by Transit Fund reserves.
E. Assets, Liabilities and Equities
1. Cash and Equivalents
It is the City's policy to invest all temporary cash surpluses. On December 31, 2008, the finance director was holding $3,341,568 in short-term residual investments of surplus cash. This amount is classified on the balance sheet as cash and equivalents in various funds. The interest on these investments is credited to the General Fund. For purposes of the statement of cash flows, the city considers all highly liquid investments (including restricted assets) with a maturity of three months or less when purchased to be cash equivalents.
2. Temporary Investments - See Note 4.
3. Receivables
Taxes receivable consists of property taxes and related interest and penalties (See Note 5). Accrued interest receivable consists of amounts earned on investments, notes, and contracts at the end of the year.
_________________________________________________________________________________________________________ Washington State Auditor's Office 37
Customer accounts receivable consist of amounts owed from private individuals or organizations for goods and services including amounts owed for which billings have not been prepared. Notes and contracts receivable consist of amounts owed on open accounts from private individuals or organizations for goods and services rendered. (See Note 1-C).
4. Amounts Due to and from Other Funds; Interfund Loans and Advances Receivable
Activity between funds that are representative of lending/borrowing arrangements outstanding at the end of the fiscal year are referred to as either “interfund loans receivable/payable” or “advances to/from other funds.” All other outstanding balances between funds are reported as “due to/from other funds.” Any residual balances outstanding between the governmental activities and business-type activities are reported in the government-wide financial statements as “internal balances.” A separate schedule of interfund loans receivable and payable is furnished in Note 15. Advances between funds, as reported in the fund financial statements, are offset by a fund balance reserve account in applicable governmental funds to indicate that they are not available for appropriation and are not expendable available financial resources.
5. Amounts Due to and from Other Governmental Units
These accounts include amounts due to or from other governments for grants,
entitlements, temporary loans, taxes and charges for services. 6. Inventories
Inventories in governmental funds consist of expendable supplies held for consumption. The cost is recorded as an expenditure at the time individual inventory items are purchased. The reserve for inventory is equal to the ending amount of inventory to indicate that a portion of the fund balance is not available for future expenditures. A comparison to market value is not considered necessary.
Inventories in proprietary funds are valued by the LIFO method.
7. Restricted Assets and Liabilities
These accounts contain resources for construction and debt service including current and delinquent special assessments receivable in enterprise funds. The current portion of related liabilities is shown as Payables from Restricted Assets. Specific debt service reserve requirements, if any, are described in Note 10.
The restricted assets of the Governmental funds composed of the following:
Cash and Investments – Temporary Restrictions $ 547,399 Cash and Investments - for Construction $ 575,000 Cash and Investments – Permanent Restriction for Pension obligations (Fund 615) $ 0 Total Restricted Assets $1,122,399
_________________________________________________________________________________________________________ Washington State Auditor's Office 38

The restricted assets of the Proprietary funds are composed of the following: Cash and Investments – Customer Deposits $ 20,660 Total Restricted Assets $ 20,660
8. Capital Assets (See Note 6).
Capital assets, which include property, plant, equipment, and infrastructure assets (e.g. roads, bridges, sidewalks, and similar items), are reported in the applicable governmental or business-type columns in the government-wide financial statements. The City defines capital assets as assets with an initial, individual cost of more than $10,000 and an estimated useful life in excess of 1 year. Such assets are recorded at historical cost or estimated historical cost if purchased or constructed. Donated capital assets are recorded at estimated fair market value at the date of donation. Pursuant to GASB Statement #34, an extended period of deferral (FY 2007 for Phase 2 governments) was available for the requirement to record and depreciate infrastructure assets acquired before the implementation date. The City has fully met this requirement for fiscal year 2007. Significant adjustments have occurred relating to this requirement. This category has become the largest asset class of the City and has historically not been reflected nor a measure of its consumption charged. Infrastructure assets include roads, bridges, traffic signals, sidewalks, etc. Costs for additions or improvements to capital assets are capitalized when they increase the effectiveness or efficiency of the asset. The cost of normal maintenance and repairs that do not add to the value of the asset or materially extend assets lives are not capitalized. Property, plant and equipment of the primary government are depreciated using the straight line method over the following estimated useful lives:
Years Buildings and Improvements 10-60 Infrastructure 40 Light/Heavy Trans. Equip. 5-10 Other Equipment 2-20 Heavy Equipment 10 Water Mains 60 Water Hydrants 50-60 Sewer Interceptors 100
Property, plant and equipment assets within the governmental activity funds except the equipment rental division fund are depreciated for a full year regardless of the month the asset was put in service. Property, plant and equipment assets within the business-type activity funds and the equipment rental division fund are depreciated partial years depending on the month the asset was put in service.
_________________________________________________________________________________________________________ Washington State Auditor's Office 39

Major outlays for capital assets and improvements are capitalized as projects are constructed.
9. Other Property and Investments (See Note 4.)
10. Other Assets and Debits
These accounts reflect future resources needed to retire general long-term debt principal and amounts currently available in debt service or other funds to retire general long-term debt.
11. Custodial Accounts
This account reflects the liability for net monetary assets being held by the City in its trustee or agency capacity.
12. Compensated Absences
Compensated absences are absences for which employees will be paid, such as vacation and sick leave. All vacation and sick pay is accrued when incurred in the government-wide, proprietary, and fiduciary fund financial statements. Vacation pay, which may be accumulated up to 240 hours, is payable upon resignation, retirement or death. Sick leave may accumulate up to 800 hours. Outstanding sick leave is not payable upon resignation, retirement or death.
13. Other Accrued Liabilities
These accounts consist of accrued wages and accrued employee benefits.
14. Long-term Debt (See Note 10).
In the government-wide financial statements, and proprietary fund types in the fund financial statements, long-term debt and other long-term obligations are reported as liabilities in the applicable governmental activities, business-type activities, or proprietary fund type statement of net assets.
15. Deferred Revenues
This account includes amounts recognized as receivables but not revenues in governmental funds because the revenue recognition criteria have not been met. (See Note 1-C)
16. Other Credits
This account is used to account for gains that will be amortized over succeeding fiscal periods in proprietary funds.
17. Fund Equity
In the fund financial statements, governmental funds report reservations of fund balance for amounts that are not available for appropriation or are legally restricted by outside parties for use for a specific purpose. Designations of fund balance represent tentative management plans that are subject to change.
_________________________________________________________________________________________________________ Washington State Auditor's Office 40
F. Other Significant Accounting Practices 1. Budgeting, Accounting and Reporting System (BARS)
The State of Washington's Office of State Auditor was granted authority pursuant to the Revised Code of Washington (RCW 43.09.200 and 43.09.230) to prescribe the Budgeting, Accounting and Reporting System (BARS) manual. The purpose of this manual is to provide uniformity in budgeting, accounting and reporting by all local government entities within the State of Washington
NOTE 2 - RECONCILIATION OF GOVERNMENT-WIDE AND FUND FINANCIAL STATEMENTS A. Explanation of Certain Differences between the Governmental Funds Balance
Sheet and the Government-Wide Statement of Net Assets
The governmental funds’ balance sheet includes a reconciliation between fund balance – total governmental funds and net assets-governmental activities as reported in the government-wide statement of net assets. The reconciliation is as follows: 1. Capital Assets used in governmental activities are not financial resources and,
therefore, are not reported in the funds – net effect $28,377,844.
2. Internal service funds are included in governmental activities in the statement of net assets – net effect $3,971,612.
3. Long-term liabilities are not reported in the funds – net effect $(3,602,337). B. Explanation of Certain Differences between the Governmental Funds Statement of
Revenues, Expenditures, and Changes in Fund Balances and the Government-Wide Statement of Activities
The governmental fund statement of revenues, expenditures, and changes in fund balances includes a reconciliation between net changes in fund balances – total governmental funds and changes in net assets of governmental activities as reported in the government-wide statement of activities. The reconciliation is as follows: 1. Net change in fund balances – total governmental funds – net effect $(1,699,140).
2. Governmental funds report capital outlays as expenditures (depreciation in current period) – net effect $1,019,153.
3. The net effect of various miscellaneous transactions involving changes in fund balance – net effect $(258,785).
4. The issuance of long term debt – net effect $220,000.
5. Some expenses reported in the statement of activities do not require the use of current financial resources – net effect $(284,047).
6. The net revenue of certain activities of internal service funds is reported with governmental activities – net effect $126,539.
NOTE 3 – STEWARDSHIP, COMPLIANCE AND ACCOUNTABILITY There have been no material violations of finance-related legal or contractual provisions.
_________________________________________________________________________________________________________ Washington State Auditor's Office 41

NOTE 4 - DEPOSITS AND INVESTMENTS DEPOSITS The City's deposits and certificates of deposit are entirely covered by federal depository insurance (FDIC) or by collateral held in a multiple financial institution collateral pool administered by the Washington Public Deposit Protection Commission (PDPC). INVESTMENTS As required by state law, all investments of the City's funds are obligations of the U.S. Government, U.S. agency issues, general obligations of Washington State municipalities, the State Treasurer's Investment Pool, or certificates of deposit with Washington State banks and savings and loan institutions. All investments are stated at cost plus accrued interest which approximates fair value, as it is the intent of the City to hold all investments until their stated maturities. Also, the interest earned on investments owned by the Cemetery Care Fund is credited to the General Fund, as the operation and maintenance expenditures of the City's cemeteries are included in the General Fund or the Cemetery Expansion Fund for cemetery capital improvements. Other property is shown on the combined balance sheet at cost.
Fair Value City Owned Investments Total Repurchase Agreements $ - $ - U.S. Government Securities 1,575,000 1,575,000 Bankers' Acceptances - - WA Municipal Obligations - - TOTAL $ 1,575,000 $ 1,575,000
During the period covered by this financial statement, there were no exceptions to the City's investment policy, nor did the City use reverse repurchase agreements. During this period, the City did not use, hold nor sell any derivatives or similar instruments, nor did the City participate in any securities lending transactions. There were no sales of securities at other than maturity or call dates that resulted in realized gains or losses. Custodial credit risk is the risk that in event of a failure of the counterparty to an investment transaction the City would not be able to recover the value of the investment or collateral securties. Of the City’s total position of $1,575,000 in investments, $0 is exposed to custodial credit risk because the investments are held by the City’s brokerage firm, which is also the counterparty in those particular securities. NOTE 5 - PROPERTY TAXES The County Treasurer acts as an agent to collect property taxes levied in the County for all taxing authorities. Collections are distributed after the end of each month.
_________________________________________________________________________________________________________ Washington State Auditor's Office 42

Property Tax Calendar
January 1 Taxes are levied and become an enforceable lien against properties. February 14 Tax bills are mailed. April 30 First of two equal installment payments is due. May 31 Assessed value of property established for next year's levy at 100 percent
of market value. October 31 Second installment is due. Property taxes are recorded as a receivable when levied, offset by deferred revenue. During the year, property tax revenues are recognized when cash is collected. At year-end, property tax revenues are recognized for collections to be distributed by the County Treasurer in January. No allowance for uncollectible taxes is established because delinquent taxes are considered fully collectible. The City may levy up to $3.60 per $1,000 of assessed valuation for general governmental services. The Washington State Constitution and Washington State law in RCW 84.55.010 limit the levy rate. For 2008 the City levied the following property taxes on an assessed value of $1,133,131,234. (The special levies identified in the table were approved by the voters and are not subject to the limitations listed above.)
Levy Rate Total
Purpose of Levy per $1,000 Levy Amount
General Government $ 3.0239 $3,426,476
EMS Levy 0.4202 476,142
Special G.O. Bond Levy 0.2602 293,387
TOTALS $ 3.7043 $4,196,005
_________________________________________________________________________________________________________ Washington State Auditor's Office 43

NOTE 6 - CAPITAL ASSETS A summary of changes in capital assets as of December 31, 2008 follows:
Balance Balance 1/1/2008 Increases Decreases 12/31/2008 Governmental Activities: Capital Assets, Not Being
Depreciated: Land $ 1,234,829 $ 66,189 $ - $ 1,301,019 Construction In Progress 1,102,180 1,576,363 56,955 2,621,588 Total Capital Assets, Not
Being Depreciated: 2,337,009 1,642,552 56,955 3,922,607 Capital Assets, Being Depreciated: Buildings 5,135,215 212,618 - 5,347,833 Other Improvements 3,107,511 151,423 - 3,258,933 Machinery and Equipment 6,661,737 542,983 235,802 6,968,918 Infrastructure 24,419,779 - - 24,419,779 Total Capital Assets, Being
Depreciated: 39,324,241 907,024 235,802 39,995,463 Less Accumulated Depreciation For: Buildings (2,393,211) (140,723) - (2,533,934) Other Improvements (1,224,739) (65,119) - (1,289,858) Machinery and Equipment (3,674,915) (683,652) (209,982) (4,148,585) Infrastructure (4,534,826) (636,635) - (5,171,461) Total Accumulated Depreciation (11,827,691) (1,526,129) (209,982) (13,143,838) Total Capital Assets, Being
Depreciated, Net: 27,496,550 (619,105) 25,820 26,851,625 Governmental Activities Capital
Assets, Net: $29,833,560 $ 1,023,447 $ 82,775 $30,774,232
_________________________________________________________________________________________________________ Washington State Auditor's Office 44

Balance Balance 1/1/2008 Increases Decreases 12/31/2008 Business-Type Activities: Capital Assets, Not Being
Depreciated: Land $ 710,979 $ 116,690 $ - $ 827,669 Construction In Progress 7,411,232 6,856,040 2,686,771 11,580,501 Total Capital Assets, Not
Being Depreciated: 8,122,211 6,972,730 2,686,771 12,408,170 Capital Assets, Being Depreciated: Plant in Service 45,353,712 3,425,104 129,017 48,649,799 Total Capital Assets, Being
Depreciated: 45,353,712 3,425,104 129,017 48,649,799 Less Accumulated Depreciation For: Plant in Service (17,462,432) (1,396,693) (116,116) (18,743,009) Total Accumulated Depreciation (17,462,432) (1,396,693) (116,116) (18,743,009) Total Capital Assets, Being
Depreciated, Net: 27,891,280 2,028,411 12,901 29,906,790 Business-Type Activities Capital
Assets, Net: $36,013,491 $ 9,001,141 $ 2,699,672 $42,314,960
Depreciation expense was charged to functions/programs of the primary government as follows:
Governmental Activities: General Government $ 262,475 Safety $ 111,206 Transportation $ 648,340 Culture and Recreation $ 92,827 Total Depreciation – Governmental Activities $1,114,848
Business-Type Activities: Water and Sewer $1,148,669 Transit $ 246,920 Total Depreciation – Business-Type Activities $1,395,589
_________________________________________________________________________________________________________ Washington State Auditor's Office 45
NOTE 7 - PENSION PLANS Substantially all City of Pullman full-time and qualifying part-time employees participate in one of the following statewide retirement systems administered by the Washington State Department of Retirement Systems, under cost-sharing multiple-employer defined benefit public employee retirement plans. The Department of Retirement Systems (DRS), a department within the primary government of the State of Washington, issues a publicly available comprehensive annual financial report (CAFR) that includes financial statements and required supplementary information for each plan. The DRS CAFR may be obtained from the Department of Retirement Systems, Communications Unit, P.O. Box 48380, Olympia, WA 98504-8380. The following disclosures are made pursuant to GASB Statements No. 27, Accounting for Pensions by State and Local Government Employers and No. 50, Pension Disclosures, an Amendment of GASB Statements No. 25 and No. 27. A. Public Employees' Retirement System (PERS) Plans 1, 2, and 3
Plan Description PERS is a cost-sharing multiple-employer retirement system comprised of three separate plans for membership purposes: Plans 1 and 2 are defined benefit plans and Plan 3 is a defined benefit plan with a defined contribution component. Membership in the plan includes elected officials; state employees; employees of the Supreme, Appeals, and Superior courts (other than judges currently in a judicial retirement system); employees of legislative committees; community and technical colleges, college and university employees not participating in national higher education retirement programs; judges of municipal courts; and employees of local government. PERS participants who joined the system by September 30, 1977 are Plan 1 members. Those who joined on or after October 1, 1977 and by either, February 28, 2002 for state and higher education employees, or August 31, 2002 for local government employees, are Plan 2 members unless they exercise an option to transfer their membership to Plan 3. PERS participants joining the system on or after March 1, 2002 for state and higher education employees or August 31, 2002 for local government employees have the irrevocable option of choosing membership in either PERS Plan 2 or PERS Plan 3. The option must be exercised within 90 days of employment. An employee is reported in Plan 2 until a choice is made. Employees who fail to choose within 90 days default to PERS Plan 3. Notwithstanding, PERS Plan 2 and Plan 3 members may opt out of plan membership if terminally ill, with less than five years to live. PERS defined benefit retirement benefits are financed from a combination of investment earnings and employer and employee contributions. PERS retirement benefit provisions are established in state statute and may be amended only by the State Legislature. Plan 1 members are vested after the completion of five years of eligible service. Plan 1 members are eligible for retirement after 30 years of service, or at the age of 60 with 5 years of service, or at the age of 55 with 25 years of service. The annual benefit is two percent of the average final compensation per year of service, capped at 60 percent. The average final compensation is based on the greatest compensation during any 24 eligible consecutive compensation months. Plan 1 members who retire from inactive status prior to the age of 65 may receive actuarially reduced benefits. The benefit is actuarially reduced to reflect the choice of a survivor option. A cost-of-living allowance is
_________________________________________________________________________________________________________ Washington State Auditor's Office 46
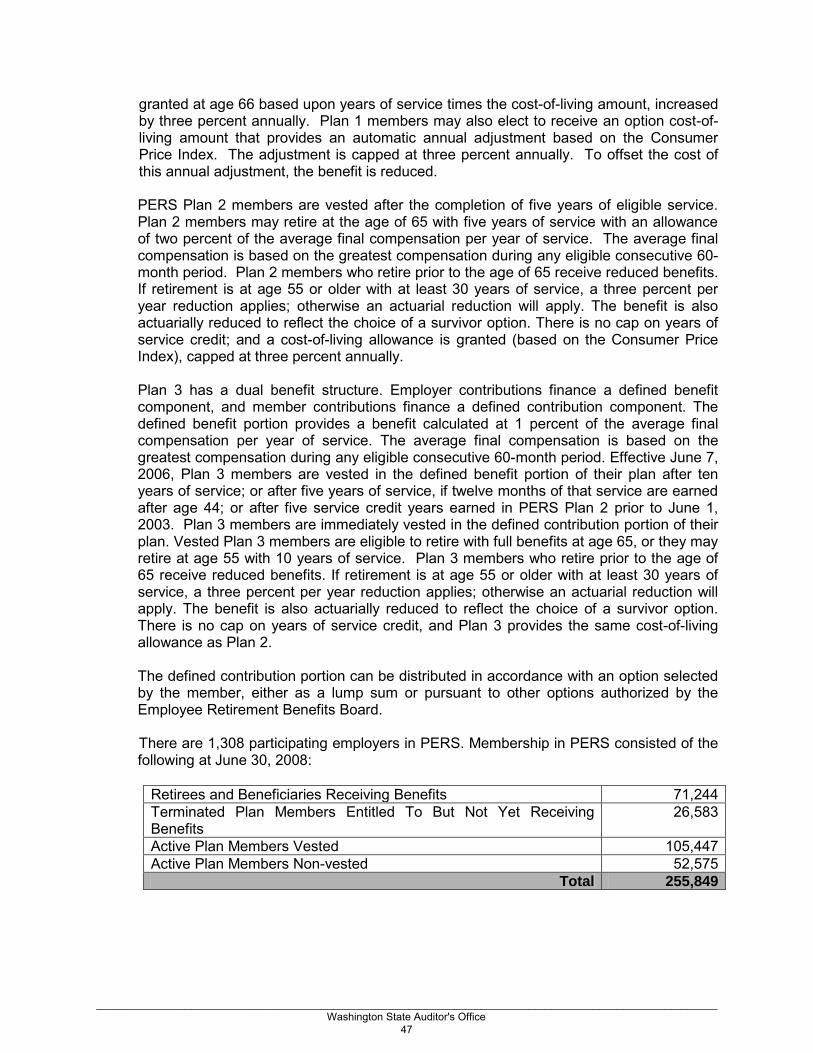
granted at age 66 based upon years of service times the cost-of-living amount, increased by three percent annually. Plan 1 members may also elect to receive an option cost-of-living amount that provides an automatic annual adjustment based on the Consumer Price Index. The adjustment is capped at three percent annually. To offset the cost of this annual adjustment, the benefit is reduced.
PERS Plan 2 members are vested after the completion of five years of eligible service. Plan 2 members may retire at the age of 65 with five years of service with an allowance of two percent of the average final compensation per year of service. The average final compensation is based on the greatest compensation during any eligible consecutive 60-month period. Plan 2 members who retire prior to the age of 65 receive reduced benefits. If retirement is at age 55 or older with at least 30 years of service, a three percent per year reduction applies; otherwise an actuarial reduction will apply. The benefit is also actuarially reduced to reflect the choice of a survivor option. There is no cap on years of service credit; and a cost-of-living allowance is granted (based on the Consumer Price Index), capped at three percent annually.
Plan 3 has a dual benefit structure. Employer contributions finance a defined benefit component, and member contributions finance a defined contribution component. The defined benefit portion provides a benefit calculated at 1 percent of the average final compensation per year of service. The average final compensation is based on the greatest compensation during any eligible consecutive 60-month period. Effective June 7, 2006, Plan 3 members are vested in the defined benefit portion of their plan after ten years of service; or after five years of service, if twelve months of that service are earned after age 44; or after five service credit years earned in PERS Plan 2 prior to June 1, 2003. Plan 3 members are immediately vested in the defined contribution portion of their plan. Vested Plan 3 members are eligible to retire with full benefits at age 65, or they may retire at age 55 with 10 years of service. Plan 3 members who retire prior to the age of 65 receive reduced benefits. If retirement is at age 55 or older with at least 30 years of service, a three percent per year reduction applies; otherwise an actuarial reduction will apply. The benefit is also actuarially reduced to reflect the choice of a survivor option. There is no cap on years of service credit, and Plan 3 provides the same cost-of-living allowance as Plan 2. The defined contribution portion can be distributed in accordance with an option selected by the member, either as a lump sum or pursuant to other options authorized by the Employee Retirement Benefits Board. There are 1,308 participating employers in PERS. Membership in PERS consisted of the following at June 30, 2008:
Retirees and Beneficiaries Receiving Benefits 71,244 Terminated Plan Members Entitled To But Not Yet Receiving Benefits
26,583
Active Plan Members Vested 105,447 Active Plan Members Non-vested 52,575
Total 255,849
_________________________________________________________________________________________________________ Washington State Auditor's Office 47

Funding Policy Each biennium, the state Pension Funding Council adopts Plan 1 employer contribution rates, Plan 2 employer and employee contribution rates, and Plan 3 employer contribution rates. Employee contribution rates for Plan 1 are established by statute at six percent for state agencies and local government unit employees, and at 7.5 percent for state government elected officials. The employer and employee contribution rates for Plan 2 and the employer contribution rate for Plan 3 are developed by the Office of the State Actuary to fully fund Plan 2 and the defined benefit portion of Plan 3. All employers are required to contribute at the level established by the Legislature. Under PERS Plan 3, employer contributions finance the defined benefit portion of the plan, and member contribution finance the defined contribution portion. The Employee Retirement Benefits Board sets Plan 3 employee contribution rates. Six rate options are available ranging from 5 to 15 percent; two of the options are graduated rates dependent on the employee’s age. The methods used to determine the contribution requirements are established under state statute in accordance with Chapters 41.40 and 41.45 RCW. The required contribution rates expressed as a percentage of current year covered payroll, as of December 31, 2008, were:
PERS Plan 1 PERS Plan 2 PERS Plan 3 Employer 8.31%* 8.31%* 8.31%* Employee 6.00% 5.45% 5% to 15%
*The employer rates include the employer administrative expense fee currently set at 0.16% Both the City of Pullman and the employees made the required contributions. The City of Pullman’s required contributions for the years ended December 31, were:
PERS Plan 1 PERS Plan 2 PERS Plan 3 2008 $33,593 $349,210 $75,671 2007 $28,293 $264,731 $49,779 2006 $14,120 $129,226 $25,345 2005 $ 8,666 $ 73,663 $14,047 B. Law Enforcement Officers' and Fire Fighters' Retirement System (LEOFF) Plans 1
and 2
Plan Description LEOFF is a cost-sharing multiple-employer retirement system comprised of two separate defined benefit plans. LEOFF participants who joined the system by September 30, 1977 are Plan 1 members. Those who joined on or after October 1, 1977 are Plan 2 members. Membership in the system includes all full-time, fully compensated, local law enforcement officers, firefighters and, as of July 24, 2005, those emergency medical technicians who were given the option and chose LEOFF Plan 2 membership. LEOFF membership is comprised primarily of non-state employees, with Department of Fish and Wildlife enforcement officers, who were first included prospectively effective July 27, 2003, being an exception.
_________________________________________________________________________________________________________ Washington State Auditor's Office 48

Effective July 1, 2003, the LEOFF Plan 2 Retirement Board was established by Initiative 790 to provide governance of LEOFF Plan 2. The Board’s duties include adopting contribution rates and recommending policy changes to the Legislature for the LEOFF Plan 2 retirement plan. LEOFF defined benefit retirement benefits are financed from a combination of investment earnings, employer and employee contributions, and a special funding situation in which the state pays through state legislative appropriations. LEOFF retirement benefit provisions are established in state statute and may be amended by the State Legislature. LEOFF Plan 1 members are vested after the completion of five years of eligible service. Plan 1 members are eligible for retirement with five years of service at the age of 50. The benefit per year of service calculated as a percent of final average salary (FAS) is as follows:
Term of Service Percent of Final Average
20 or more years 2.0% 10 but less than 20 years 1.5% 5 but less than 10 years 1.0%
The FAS is the basic monthly salary received at the time of retirement, provided a member has held the same position or rank for 12 months preceding the date of retirement. Otherwise, it is the average of the highest consecutive 24 months’ salary within the last ten years of service. A cost-of-living allowance is granted (based on the Consumer Price Index). LEOFF Plan 2 members are vested after the completion of five years of eligible service. Plan 2 members may retire at the age of 50 with 20 years of service, or at the age of 53 with five years of service, with an allowance of two percent of the FAS per year of service. The FAS is based on the highest consecutive 60 months. Plan 2 members who retire prior to the age of 53 receive reduced benefits. Benefits are actuarially reduced for each year that the benefit commences prior to age 53 and to reflect the choice of a survivor option. If the member has at least 20 years of service and is age 50, the reduction is three percent for each year prior to age 53. There is no cap on years of service credit; and a cost-of-living allowance is granted (based on the Consumer Price Index), capped at three percent annually. There are 374 participating employers in LEOFF. Membership in LEOFF consisted of the following as of the latest actuarial valuation date for the plans of June 30, 2008: Retirees and Beneficiaries Receiving Benefits 9,085 Terminated Plan Members Entitled To But Not Yet Receiving Benefits 633 Active Plan Members Vested 12,904 Active Plan Members Non-vested 3,708
Total 26,330 Starting on July 1, 2000, LEOFF Plan 1 employers and employees contribute zero percent as long as the plan remains fully funded. Employer and employee contribution rates are developed by the Office of the State Actuary to fully fund the plan. LEOFF Plan 2 employers and employees are required to pay at the level adopted by the LEOFF Plan
_________________________________________________________________________________________________________ Washington State Auditor's Office 49

2 Retirement Board. All employers are required to contribute at the level required by state law. The Legislature, by means of a special funding arrangement, appropriated money from the state General Fund to supplement the current service liability and fund the prior service costs of LEOFF Plan 2 in accordance with the requirements of the Pension 1 Funding Council and the LEOFF Plan 2 Retirement Board. However, this special funding situation is not mandated by the state constitution and this funding requirement could be returned to the employers by a change of statute. The required contribution rates expressed as a percentage of current-year covered payroll, as of December 31, 2008, were as follows:
LEOFF Plan 1 LEOFF Plan 2
Employer 0.16%* 5.46%* Employee 0.00% 8.83%
State N/A 3.53% *The employer rates include the employer administrative expense fee currently set at 0.16%
Both the City of Pullman and the employees made the required contributions. The City of Pullman’s required contributions for the years ended December 31 were:
LEOFF Plan 1 LEOFF Plan 2 2008 $308 $210,816 2007 $356 $193,128 2006 $460 $160,383 2005 $448 $116,616
C. Other Retirement Systems - Volunteer Fire Fighters' Relief and Pension Fund
The Volunteer Fire Fighters' Relief and Pension Fund is a cost-sharing multiple-employer retirement system that was created by the Legislature in 1945 under Chapter 41.16 RCW. It provides pension, disability, and survivor benefits. Membership in the system requires service with a fire department of an electing municipality of Washington State except those covered by LEOFF. The system is funded through member contributions of $30 per year; employer contributions of $30 per year; 40 percent of the Fire Insurance Premium Tax; and earnings from the investment of monies by the Washington State Investment Board. However, members may elect to withdraw their contribution upon termination.
D. Other Local Government Pension Systems - Firemen's Pension Fund
The City is also the administrator of a pension retirement system called the Firemen's Pension Fund. This system is shown as a trust fund in the financial reports of the City.
As of December 31, 2008, there were a total of two individuals covered by this system one of whom is still employed and one is retired.
The most recent actuarial study of the system was done by Milliman & Robertson, Inc. to determine the funding requirements as of January 1, 2002. As of this date, the value of assets valued at market was $339,000 and the actuarial present value of future benefits was $144,000, leaving an unfunded pension benefit obligation of $ 0.
_________________________________________________________________________________________________________ Washington State Auditor's Office 50

Since 1975 the City has not had any actuarially determined unfunded pension obligation under the Firemen’s Pension Fund.
NOTE 8 - RISK MANAGEMENT Utilizing Chapter 48.62 RCW (self-insurance regulation) and Chapter 39.34 RCW (Interlocal Cooperation Act), nine cities originally formed WCIA on January 1, 1981. WCIA was created for the purpose of providing a pooling mechanism for jointly purchasing insurance, jointly self-insuring, and/or jointly contracting for risk management services. WCIA has a total of 129 members. New members initially contract for a three-year term, and thereafter automatically renew on an annual basis. A one-year withdrawal notice is required before membership can be terminated. Termination does not relieve a former member from its unresolved loss history incurred during membership. Liability coverage is written on an occurrence basis, without deductibles. Coverage includes general, automobile, police, public official’s errors or omissions, stop gap, and employee benefits liability. Limits are $4 million per occurrence self insured layer, and $16 million per occurrence in the re-insured excess layer. The excess layer is insured by the purchase of reinsurance and insurance and is subject to aggregate limits. Total limits are $20 million per occurrence subject to aggregate sublimits in the excess layers. The Board of Directors determines the limits and terms of coverage annually. Insurance coverage for property, automobile physical damage, fidelity, inland marine, and boiler and machinery are purchased on a group basis. Various deductibles apply by type of coverage. Property insurance and auto physical damage are self-funded from the members’ deductible to $500,000, for all perils other than flood and earthquake, and insured above that amount by the purchase of reinsurance. In-house services include risk management consultation, loss control field services, claims and litigation administration, and loss analyses. WCIA contracts for the claims investigation consultants for personnel issues and land use problems, insurance brokerage, and lobbyist services. WCIA is fully funded by its members, who make annual assessments on a prospectively rated basis, as determined by an outside, independent actuary. The assessment covers loss, loss adjustment, and administrative expenses. As outlined in the interlocal, WCIA retains the right to additionally assess the membership for any funding shortfall. An investment committee, using investment brokers, produces additional revenue by investment of WCIA's assets in financial instruments which comply with all State guidelines. These revenues directly offset portions of the membership's annual assessment. A Board of Directors, which governs WCIA, is comprised of one designated representative from each member. The Board elects an Executive Committee and appoints a Treasurer to provide general policy direction for the organization. The WCIA Executive Director reports to the Executive Committee and is responsible for conducting the day to day operations of WCIA. The City of Pullman separately purchases commercial standard property insurance coverage for building and personal property; automobile physical damage, inland marine. Boiler and machinery coverages are also purchased. Various deductibles apply by type of coverage.
_________________________________________________________________________________________________________ Washington State Auditor's Office 51

NOTE 9 – SHORT-TERM DEBT The City had no short-term debt. NOTE 10 - LONG-TERM DEBT A. Long-Term Debt
The City issues general obligation and revenue bonds to finance the acquisition or construction of major capital assets. Bonded indebtedness has also been entered into in prior years to advance refund general obligation and revenue bonds. General obligation bonds have been issued for general government and business-type activities and are being repaid from the applicable resources. Revenue bonds are repaid by proprietary fund revenues. The City is also liable for State of Washington Public Works Trust Fund Loans that were entered into for the purchase of infrastructure improvements and a State of Washington Local Option Capital Asset Lending Program loan for the purchase of fire equipment. These notes are considered obligations of the general government, and are being repaid, with general governmental or proprietary fund revenues, as appropriate.
In proprietary and similar trust funds, unamortized debt issue costs are recorded as deferred charges and bonds are displayed net of premium or discount; annual interest expense is decreased by amortization of debt premium and increased by the amortization of debt issue costs and discount.
General Obligation Bonds and Notes:
DEBT OUTSTANDING
12/31/08 2005: $300,000 G.O. Bonds, maturing serially to 2015; interest rates from 3.25 percent to 4.20 percent; Financed by property tax levy to construct Wawawaii Pedestrian Path and road improvement on Terre View Dr. 240,000
2007: $2,240,000 General Obligation Bonds maturing serially to 2017; interest rates from 4.00 percent to 5.00 percent; approved by voters as Proposition No. 1 on November 7, 2006 for parks, paths, and pedestrian improvements. 2,085,000
Revenue Bonds and Loans:
1999: $622,534 State of Washington Public Works Trust Fund Loan; annual installments until 2009 at 1 percent; proceeds for construction of Water Well #7. Repayment from water/sewer revenues. 72,629
_________________________________________________________________________________________________________ Washington State Auditor's Office 52

2005: $697,543 State of Washington Public Works Trust Fund Loan; annual installments until 2015 at 0.5 percent; proceeds for design of wastewater treatment plant digester. Repayment from water/sewer revenues. 542,533 2005: $1,816,400 State of Washington Public Works Trust Fund Loan; annual installments until 2015 at 0.5 percent; proceeds for construction of wastewater treatment plant digester. Repayment from water/sewer revenues. 1,552,172 2005: $595,000 State of Washington Public Works Trust Fund Loan; annual installments until 2015 at 0.5 percent; proceeds for construction of Water Well #8. Repayment from water/sewer revenues. 504,097 2005: $526,510 State of Washington Local Option Capital Asset Lending (LOCAL) Program Loan; annual installments until 2014 at 3.08 percent and 3.57 percent; proceeds for the purchase of a new fire ladder truck. Repayment from General Fund revenues. 298,836 2006: $1,776,500 State of Washington Public Works Trust Fund Loan; annual installments until 2016 at 0.5 percent; proceeds for construction of wastewater treatment plant digester. Repayment from water/sewer revenues. 1,579,111 2006: $90,000 State of Washington Public Works Trust Fund Loan; annual installments until 2014 at 0.0 percent; proceeds for the general sewer plan update. Repayment from water/sewer revenues. 90,000 At December 31, 2008, the City has $9,497 available in debt service funds to service the general bonded debt. Restricted assets in proprietary funds contain $0 in sinking funds and reserves as required by bond indentures. The annual debt service requirements to maturity for all long-term debt are as follows:
Year Ending Governmental Activities Business-Type Activities December 31 Principal Interest Principal Interest
2009 277,208 105,157 641,275 21,616 2010 293,991 94,510 586,646 18,046 2011 305,834 83,189 586,646 15,203 2012 312,740 71,353 586,646 12,360 2013 324,712 59,216 586,646 9,517
2014-2018 1,109,351 119,520 1,352,682 11,491 TOTALS $ 2,623,836 $ 532,945 $ 4,340,543 $ 88,232
_________________________________________________________________________________________________________ Washington State Auditor's Office 53

B. Refunded Debt
In prior years the City defeased certain general obligation bonds by placing the proceeds of new bonds in an irrevocable trust to provide for all future debt service payments on the old bonds. At December 31, 2008, all defeased general obligation and revenue bonds have been paid in full by the trustee from the proceeds of new bond issues which are shown in Sections A and B above.
C. Conduit Debt
None NOTE 11 - LEASES A. Operating Leases
The City had no operating leases. B. Capital Leases
The City had no capital leases.
_________________________________________________________________________________________________________ Washington State Auditor's Office 54

NOTE 12 – CHANGES TO LONG-TERM LIABILITIES During the year ended December 31, 2008, the following changes occurred in long-term liabilities:
Balance Balance Due Within 1/1/2008 Additions Reductions 12/31/2008 One Year Governmental Activities: General Obligation Bonds $2,545,000 $ - $ 220,000 $2,325,000 $225,000 Special Assessment Debt - - - - - Government, Bank, and
Other Loans 349,321 - 50,485 298,836 52,209 Capital Leases - - - - - Claims and Judgments - - - - - Compensated Absences 374,176 31,951 76,239 329,888 - Governmental Activities
Long-Term Liabilities $3,268,497 $ 31,951 $ 346,724 $2,953,724 $277,209 Business-Type Activities: Bonds:
General Obligation Bonds $ - $ - $ - $ - $ - Revenue Bonds - - - - -
Less Deferred amounts: For Issuance Premiums (Discounts) - - - - -
Special Assessment Debt - - - - - Government, Bank, and
Other Loans 3,946,317 1,035,500 641,276 4,340,541 641,276 Capital Leases - - - - - Claims and Judgments - - - - - Compensated Absences 127,825 6,247 - 134,072 - Business-Type Activities
Long-Term Liabilities $4,074,142 $1,041,747 $ 641,276 $4,474,613 $641,276 Internal service funds predominantly serve the governmental funds. Accordingly, long-term liabilities for them are included as part of the above totals for governmental activities. At year end $32,312 of internal service funds compensated absences are included in the above amounts. Also, for the governmental activities, claims and judgments and compensated absences are generally liquidated by the general fund. NOTE 13 - CONTINGENCIES AND LITIGATION The City has recorded in its financial statements all material liabilities, including any estimates for situations which are not yet resolved but where, based on available information, management believes it is probable that the City will have to make payment. In the opinion of management, insurance policies are adequate to pay all known or pending claims except the claim described below.
_________________________________________________________________________________________________________ Washington State Auditor's Office 55

The City participates in a number of federal-and state-assisted programs. These grants are subject to audit by the grantors or their representatives. Such audits could result in requests for reimbursement to grantor agencies for expenditures disallowed under the terms of the grants. City management believes that such disallowances, if any, will be immaterial. On February 21, 2007, four plaintiffs filed an action against the City of Pullman alleging negligent hiring, supervision and retention of a former transit department employee. The plaintiffs seek a total of $6 million in damages arising from sexual misconduct of the former employee. The lawsuit has been referred to the City’s two self-insurance risk pools and defense counsel has been appointed. The City obtained dismissal of three of the plaintiffs based on the statute of limitations. Only one of the dismissed plaintiffs appealed the order to the Washington State Court of Appeals, Division III. The City is rigorously defending the claim of the sole remaining plaintiff. NOTE 14 – RESTRICTED NET ASSETS The government-wide statement of net assets reports $2,208,865 of restricted net assets, of which $2,208,865 is restricted by enabling legislation. NOTE 15 - INTERFUND BALANCES AND TRANSFERS A. Classification of Interfund Transactions
Interfund transactions are classified as follows:
1. Transactions that would be treated as revenues, expenditures or expenses if they involved external organizations, such as buying goods and services or payments in lieu of taxes, are similarly treated when they involve other funds of the City.
2. Transfers to support the operations of other funds are recorded as "Operating
Transfers" and classified with "Other Financing Sources or Uses."
3. Contributions to the capital to enterprise or internal service funds, transfers to establish or reduce working capital in other funds, and transfers of remaining balances when funds are closed are classified as residual equity transfers and reported as direct additions to or deductions from fund equity.
4. Loans between funds are classified as interfund loans receivable and payable or as
advances to and from other funds on the combined balance sheet depending on the time period for which the loan was made. Interfund loans do not affect total fund equity, but advances to other funds are offset by a reservation of fund equity.
_________________________________________________________________________________________________________ Washington State Auditor's Office 56

The following table displays interfund balances at December 31, 2008:
Due From Due To Interfund Interfund Other Other Loans Loans Fund Type Funds Funds Receivable Payable General Fund $ - $ - $ - $ - Street - - - - Other Gov't Funds - - - - Internal Service - - - - Agency - - - - Fiduciary - - - - Proprietary - - - -
Totals $ - $ - $ - $ -
The following table displays interfund activity during 2008: Operating Transfers Residual Equity Transfers Fund Type In Out In Out General Fund $ - $ 231,915 $ - $ - Street 119,040 - - Other Gov't Funds - 19,040 - - Internal Service 231,915 - - - Agency - - - - Fiduciary - - - - Proprietary - 100,000 - -
Totals $ 350,955 $ 350,955 $ - $ -
_________________________________________________________________________________________________________ Washington State Auditor's Office 57
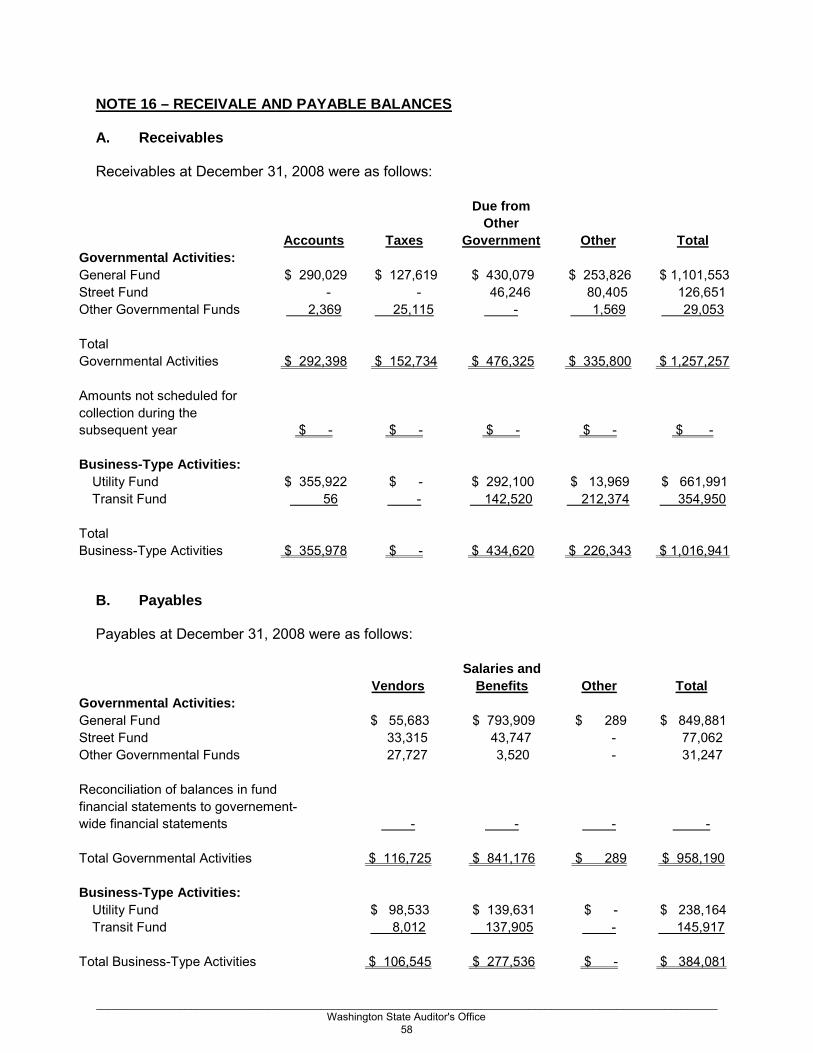
NOTE 16 – RECEIVALE AND PAYABLE BALANCES A. Receivables Receivables at December 31, 2008 were as follows:
Due from Other Accounts Taxes Government Other Total Governmental Activities: General Fund $ 290,029 $ 127,619 $ 430,079 $ 253,826 $ 1,101,553 Street Fund - - 46,246 80,405 126,651 Other Governmental Funds 2,369 25,115 - 1,569 29,053 Total Governmental Activities $ 292,398 $ 152,734 $ 476,325 $ 335,800 $ 1,257,257 Amounts not scheduled for collection during the subsequent year $ - $ - $ - $ - $ - Business-Type Activities:
Utility Fund $ 355,922 $ - $ 292,100 $ 13,969 $ 661,991 Transit Fund 56 - 142,520 212,374 354,950
Total Business-Type Activities $ 355,978 $ - $ 434,620 $ 226,343 $ 1,016,941
B. Payables Payables at December 31, 2008 were as follows:
Salaries and Vendors Benefits Other Total Governmental Activities: General Fund $ 55,683 $ 793,909 $ 289 $ 849,881 Street Fund 33,315 43,747 - 77,062 Other Governmental Funds 27,727 3,520 - 31,247 Reconciliation of balances in fund financial statements to governement- wide financial statements - - - - Total Governmental Activities $ 116,725 $ 841,176 $ 289 $ 958,190 Business-Type Activities:
Utility Fund $ 98,533 $ 139,631 $ - $ 238,164 Transit Fund 8,012 137,905 - 145,917
Total Business-Type Activities $ 106,545 $ 277,536 $ - $ 384,081
_________________________________________________________________________________________________________ Washington State Auditor's Office 58

NOTE 17 – OTHER POSTEMPLOYMENT BENEFIT (OPEB) The City adopted the requirements of GASB Statement No. 45 during the year ended December 31, 2008. Following accrual accounting principles, the City recognizes the cost of postemployment healthcare in the year the when the employee services are received, reports the accumulated liability from prior years, and provides information to determine future demands on future cashflows. A. Plan/Trust Description The City of Pullman Firemen Pension Fund is a single-employer defined benefit pension fund established and administered by the City in accordance with RCW 41.16. Other postemployment benefit plans provide lifetime medical benefits to all firefighters and uniformed police officers who were hired prior to October 1, 1977 (RCW 41.26). There are 3 active police officers and firefighters covered under these plans as of December 31, 2008. There are 15 retirees receiving benefits from the plans. The City is a participating employer in the Association of Washington Cities Employee Benefit Trust (“Trust”), a cost sharing multiple employer welfare benefit plan administered by the Association of Washington Cities. The Trust provides medical benefits to certain eligible retired employees of participating employers and their eligible family members. Under Article VII of the Trust document, the Trustees have the authority and power to amend the amount and the nature of medical and other benefits provided by the Trust. The Trust issues a publicly available financial report that includes financial statements and requires supplementary information for the Trust. That report, along with a copy of the Trust document, may be obtained by writing to the Trust at 1076 Franklin Street SE, Olympia, WA 98501-1346 or by calling 1-800-562-8981. B. Funding Policy The City is obligated by the Revised Code of Washington to make all required contributions to the plans. The major funding sources for these plans are property taxes, retail sales and use tax, investment earnings, and the State fire insurance premium tax. These benefits are funded on a pay-as-you-go basis through the General Fund. The City does not have a funding policy and there are no assets designated for the benefits. Employees are not required to make contributions to the plans. The Association of Washington Cities Employee Benefit Trust (“Trust”) provides that contribution requirements of participating employers and of participating employees, retirees and other beneficiaries, if any, are established and may be amended by the Board of Trustees of the Trust. Retirees of the City receiving medical benefits from the Trust contribute $644.35 per month for non-Medicare enrolled retiree-only coverage, $1,288.70 for non-Medicare enrolled retiree and spouse coverage, $987.25 for Medicare enrolled retiree and non-Medicare enrolled spouse (or non-Medicare enrolled retiree and Medicare enrolled spouse) and $685.80 for Medicare enrolled retiree and spouse coverage. C. OPEB Cost and Obligation The City reimbursed a fixed amount of $96.40 per month in 2008 for a Medicare supplement for 10 retirees eligible for Medicare.
_________________________________________________________________________________________________________ Washington State Auditor's Office 59

Employer validated claims for medical and hospitalization reimbursements are financed on a pay-as-you-go basis. Expenditures for postretirement health care benefits are recognized as retirees report claims. The City also carries nursing-home coverage on all active and retired LEOFF 1 employees. During 2008, expenditures of $9,776.30 were recognized for postretirement health care. D. Funded Status Funded Status OPEB Plan Validation Date January 1, 2008 Actuarial Value of Assets $ - Actuarial Accrued Liability (AAL) $ 4,924,307 Unfunded Actuarial Unfunded Actuarial (UAAL) $ 4,924,307 Funded Ratio 0.00% Covered Payroll N/A UAAL - Percentage of Covered Payroll N/A Actuarial Methods and Assumptions OPEB Plan Validation Date January 1, 2008 Actuarial Cost Method Projected Unit Credit Amortization Method N/A Remaining Amortization Period N/A Asset Valuation Method N/A
NOTE 18 - OTHER DISCLOSURES A. Major Receivables
Washington State University is a major user of the City's wastewater treatment facilities. Through an amended interlocal agreement, it reimburses the City for 36.4 percent of the facility maintenance and operating expenses.
B. Related Party Transactions
There are no significant related party transactions. C. Prior Period Adjustments
The City reports a net prior period adjustment of $24,691 decrease in fund balances. The significant prior period adjustment included a net decrease of $25,000 in the General Fund and a net increase in the Information Systems Fund that occurred as a result of a miscode of miscellaneous revenue.
_________________________________________________________________________________________________________ Washington State Auditor's Office 60
D. Accounting and Reporting Changes
The City implemented GASB Statement No. 45, Accounting and Financial Reporting for Employers for Postemployment Benefits Other Than Pensions, for the fiscal year ending 2008 (See Note 17).
E. Subsequent Events
On February 3, 2009, the Washington State Court of Appeals, Division III dismissed the appeal of the dismissal of the action against the City alleging negligent hiring, supervision and retention of a former transit department employee and affirmed judgment in the favor of the City (See Note 13). No further appeals were filed by the plaintiff and the matter is now concluded.
F. Significant Revenue and Expenditure Changes
There were no significant revenue or expenditure changes.
_________________________________________________________________________________________________________ Washington State Auditor's Office 61

MC
AG
No.
082
0Sc
hedu
le 1
6
Gra
ntor
/Fe
dera
lO
ther
From
From
Pas
s-Th
roug
h G
rant
orC
FDA
Iden
tific
atio
nPa
ss-T
hrou
ghD
irect
Pr
ogra
m T
itle
Num
ber
Num
ber
Aw
ards
Aw
ards
Tota
l
US
Dep
t of J
ustic
e D
irect
Pro
gram
s: V
iole
nce
Aga
inst
Wom
en F
orm
ula
Gra
nts
16.5
8820
02W
FBX0
022
1,09
8
1,09
8
E
dwar
d B
yrne
Mem
oria
l Jus
tice
Ass
ista
nce
Gra
nt16
.738
13,9
41
13,9
41
Tota
l US
Dep
t of J
ustic
e15
,039
$
US
Dep
t of T
rans
porta
tion
Dire
ct P
rogr
am fr
om F
eder
al A
viat
ion
Adm
inis
tratio
n: F
eder
al A
viat
ion
20.1
063-
53-0
051-
2733
,480
33
,480
F
eder
al A
viat
ion
20.1
063-
53-0
051-
2844
5,33
9
44
5,33
9
F
eder
al A
viat
ion
20.1
063-
53-0
051-
3070
8,14
4
70
8,14
4
F
eder
al A
viat
ion
20.1
063-
53-0
051-
3167
6,76
4
67
6,76
4
T
otal
CFD
A N
umbe
r 20
.106
1,86
3,72
7$
Not
e 3
US
Dep
t of T
rans
porta
tion
Indi
rect
Aw
ards
from
WA
ST
DO
T: F
orm
ula
Gra
nts
for O
ther
Tha
n U
rban
ized
Are
as20
.509
400,
000
400,
000
For
mul
a G
rant
s fo
r Oth
er T
han
Urb
aniz
ed A
reas
20.5
09R
TAP
08
1,19
2
1,19
2
T
otal
CFD
A N
umbe
r20
.509
401,
192
$
Tota
l US
Dep
artm
ent o
f Tra
nspo
rtat
ion
$2,2
64,9
19
US
Inst
itute
of M
useu
m a
nd L
ibra
ry S
ervi
ces
Indi
rect
Aw
ard
from
WA
Sta
te
Libr
ary:
Sta
te L
ibra
ry P
rogr
am45
.310
750
750
$
Tota
l US
Inst
itute
of M
useu
m a
nd L
ibra
ry S
ervi
ces
750
$
US
Dep
t of H
omel
and
Sec
urity
Dire
ct P
rogr
am:
Ass
ista
nce
to F
irefig
hter
's G
rant
97.0
67E
07-0
4913
,199
13
,199
$
Tota
l US
Dep
t of H
omel
and
Secu
rity
$13,
199
Tota
l Fed
eral
Aw
ards
2,29
3,90
7$
The
acco
mpa
nyin
g no
tes
to th
e S
ched
ule
of E
xpen
ditu
res
of F
eder
al A
war
ds
are
an in
tegr
al p
art o
f thi
s sc
hedu
le.
SC
HED
ULE
OF
EXPE
ND
ITU
RES
OF
FED
ERA
L A
WA
RD
S
For t
he Y
ear E
ndin
g D
ecem
ber 3
1, 2
008
CIT
Y O
F PU
LLM
AN
, WA
SHIN
GTO
N
_________________________________________________________________________________________________________ Washington State Auditor's Office 62

NOTES TO THE SCHEDULE OF EXPENDITURES OF FEDERAL AWARDS FOR THE YEAR ENDED DECEMBER 31, 2008
Note 1: BASIS OF ACCOUNTING The Schedule of Financial Assistance is prepared on the same basis of accounting as the City's financial statement. The City uses the accrual basis of accounting. Note 2: PROGRAM COSTS The amounts shown as current year expenditures represent only the federal portion of the program costs, including the City's portion, may be more than shown. Note 3: FEDERAL AVIATION ADMINISTRATION GRANTS The City is the primary recipient of all Federal Aviation Administration grants (CFDA 20.106) for its sub recipient, the Pullman-Moscow Regional Airport. As the primary recipient, the City monitors the activities of the sub recipient in accordance with OMB Circular A-133. All other compliance requirements and specific grant terms are tested at the sub recipient level and, as such, are not included in the single audit reports of the City.
_________________________________________________________________________________________________________ Washington State Auditor's Office 63

(SAO FACTS.DOC - Rev. 06/09)
ABOUT THE STATE AUDITOR'S OFFICE The State Auditor's Office is established in the state's Constitution and is part of the executive branch of state government. The State Auditor is elected by the citizens of Washington and serves four-year terms. Our mission is to work in cooperation with our audit clients and citizens as an advocate for government accountability. As an elected agency, the State Auditor's Office has the independence necessary to objectively perform audits and investigations. Our audits are designed to comply with professional standards as well as to satisfy the requirements of federal, state, and local laws. The State Auditor's Office employees are located around the state to deliver our services effectively and efficiently. Our audits look at financial information and compliance with state, federal and local laws on the part of all local governments, including schools, and all state agencies, including institutions of higher education. In addition, we conduct performance audits of state agencies and local governments and fraud, whistleblower and citizen hotline investigations. The results of our work are widely distributed through a variety of reports, which are available on our Web site and through our free, electronic subscription service. We continue to refine our reporting efforts to ensure the results of our audits are useful and understandable. We take our role as partners in accountability seriously. We provide training and technical assistance to governments and have an extensive quality assurance program. State Auditor Brian Sonntag, CGFM Chief of Staff Ted Rutt Deputy Chief of Staff Doug Cochran Chief Policy Advisor Jerry Pugnetti Director of Audit Chuck Pfeil, CPA Director of Special Investigations Jim Brittain, CPA Director for Legal Affairs Jan Jutte, CPA, CGFM Director of Quality Assurance Ivan Dansereau Local Government Liaison Mike Murphy Communications Director Mindy Chambers Public Records Officer Mary Leider Main number (360) 902-0370 Toll-free Citizen Hotline (866) 902-3900 Web Site www.sao.wa.gov Subscription Service https://www.sao.wa.gov/EN/News/Subscriptions/