Embed Size (px)
Citation preview
Washington State
Toxics Monitoring Program:
Freshwater Fish Tissue Component,
2007
January 2009
Publication No. 09-03-003
Publication and Contact Information
This report is available on the Department of Ecology’s website at
www.ecy.wa.gov/biblio/0903003.html
Data for this project are available on Ecology’s Environmental Information Management (EIM)
website at www.ecy.wa.gov/eim/index.htm. Search User Study ID: WSTMP07.
Ecology’s Project Tracker Code for this study is 02-500-01-06.
For more information contact:
Publications Coordinator
Environmental Assessment Program
P.O. Box 47600, Olympia, WA 98504-7600
Phone: (360) 407-6764
Washington State Department of Ecology - www.ecy.wa.gov/
o Headquarters, Olympia (360) 407-6000
o Northwest Regional Office, Bellevue (425) 649-7000
o Southwest Regional Office, Olympia (360) 407-6300
o Central Regional Office, Yakima (509) 575-2490
o Eastern Regional Office, Spokane (509) 329-3400
Cover photo: Skagit River near Burlington.
Any use of product or firm names in this publication is for descriptive purposes only and
does not imply endorsement by the author or the Department of Ecology.
If you need this publication in an alternate format, call Joan LeTourneau at 360-407-6764.
Persons with hearing loss can call 711 for Washington Relay Service.
Persons with a speech disability can call 877-833-6341.

Washington State
Toxics Monitoring Program:
Freshwater Fish Tissue Component,
2007
by
Keith Seiders and Casey Deligeannis
Toxics Studies Unit
Statewide Coordination Section
Environmental Assessment Program
Washington State Department of Ecology
Olympia, Washington 98504-7710
Waterbody Number(s): See Appendix A

This page is purposely left blank
Page 1
Table of Contents
Page
List of Figures and Tables....................................................................................................2
Abstract ................................................................................................................................3
Acknowledgements ..............................................................................................................4
Background ..........................................................................................................................5
Study Design ........................................................................................................................7 Contaminants Assessed ..................................................................................................7
Mercury .................................................................................................................7 PCBs ......................................................................................................................7
Dioxins and Furans (PCDD/Fs) .............................................................................7 Chlorinated Pesticides ...........................................................................................8 PBDE Flame Retardants ........................................................................................8
Site Selection .................................................................................................................8
Field Procedures.............................................................................................................9 Analytical Methods ........................................................................................................9
Data Quality .................................................................................................................10
Water Quality Criteria........................................................................................................11 National Toxics Rule (NTR) ........................................................................................13
EPA Recommended Water Quality Criteria ................................................................13 EPA Screening Values .................................................................................................14
Results and Discussion ......................................................................................................15
Contaminants in Freshwater Fish.................................................................................17
Mercury ...............................................................................................................17 PCBs ....................................................................................................................19 Dioxins and Furans (PCDD/Fs) ...........................................................................19
Chlorinated Pesticides .........................................................................................19 PBDE Flame Retardants ......................................................................................22
Comparisons to Historical Data ...................................................................................22 Water Quality Standards Exceeded .............................................................................26 Site Scoring and Ranking.............................................................................................27
Conclusions and Recommendations ..................................................................................31
References ..........................................................................................................................33
Appendices .........................................................................................................................37 Appendix A. Site and Species Sampled: WSTMP 2007 ............................................39
Appendix B. Data Quality Assessment .......................................................................40 Appendix C. Data Evaluation by Ecology and DOH .................................................45 Appendix D. Summary of Results, WSTMP 2007 .....................................................47 Appendix E. Health Information about Fish ...............................................................50 Appendix F. Glossary, Acronyms, and Abbreviations ...............................................51
Page 2
List of Figures and Tables
Page
Figures
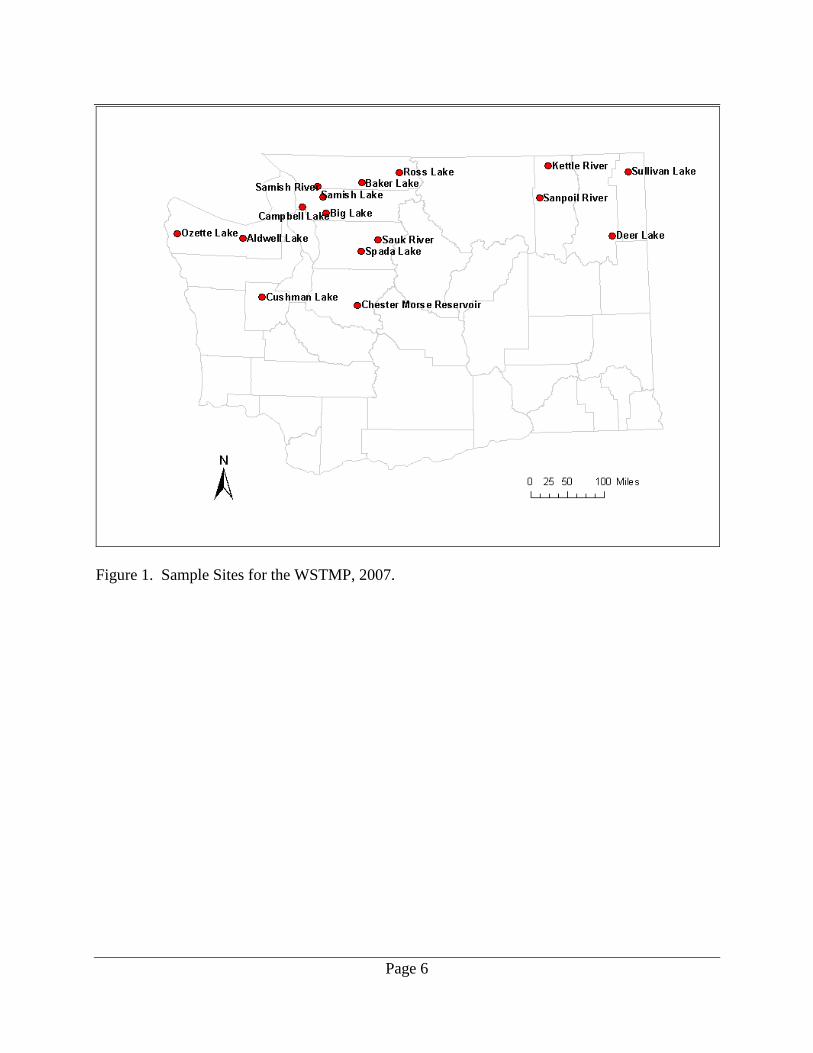
Figure 1. Sample Sites for the WSTMP, 2007............................................................................... 6
Figure 2. Distribution of Mercury in Edible Fish Tissue, WSTMP 2001-2007. ......................... 18
Figure 3. Distribution of Total PCBs in Edible Fish Tissue, WSTMP 2001-2007. .................... 20
Figure 4. Distribution of 2,3,7,8-TCDD TEQ in Edible Fish Tissue, WSTMP 2001-2007. ....... 21
Figure 5. Distribution of Total PBDEs in Edible Fish Tissue, WSTMP 2001-2007. .................. 23
Figure 6. Site Ranking for Fish Tissue Results, WSTMP 2001-2007. ........................................ 30
Tables
Table 1. Analytical Methods for Fish Tissue Samples, WSTMP 2007. ........................................ 9
Table 2. Criteria and Guidelines Used for the Protection of Human Health for Contaminants
Detected in Fish Tissue, WSTMP 2007. ........................................................................ 12
Table 3. Summary Statistics for Fish Tissue Samples, WSTMP 2007. ....................................... 16
Table 4. Comparison of Historical to Recent Fish Tissue Data from Samish Lake. ................... 25
Table 5. Comparison of Historical to Recent Fish Tissue Data from Lake Ozette. .................... 26
Table 6. Recommended 303(d) Listings for Fish Tissue Sample Results, WSTMP 2007. ......... 27
Table 7. Example Calculation of Contaminant Scores for Samples and Sites Using the
Campbell Lake Site near Anacortes, WSTMP 2007. ..................................................... 28
Page 3
Abstract
Results of freshwater fish tissue sampling conducted in 2007 as part of the Washington State
Toxics Monitoring Program (WSTMP) are reported. The “exploratory” monitoring component
is a screening-level effort which targets areas across Washington where historical data are
lacking. Results are used primarily to identify areas of concern for follow-up actions. Because
the program is not designed to assess trends, caution should be used in comparing results from
year to year.
Sixteen sites across Washington State representing 12 resident freshwater species of fish were
sampled in 2007. Contaminants assessed include persistent, bioaccumulative, and toxic
chemicals (PBTs) such as mercury, PCBs, dioxins and furans, chlorinated pesticides, and PBDE
flame retardants.
Most sample results were within the lower range of values found in other studies of fish tissue in
Washington. Mercury was detected in 100%, PBDEs in 97%, and PCBs in 91% of the 35
samples analyzed. Pesticides in the DDT and chlordane groups were detected in 63% and 6%
of the 35 samples, respectively.
Twenty-eight percent of all samples did not meet Washington State water quality standards for
contaminants in fish tissue. Total PCBs and 2,3,7,8-TCDD accounted for most of these
exceedances. Other contaminants exceeding water quality standards were mercury and
hexachlorobenzene.
This study recommends that five lakes and one river be added to the federal Clean Water Act
Section 303(d) List for Washington State. These sites are: Ozette, Samish, Big, Campbell, and
Sullivan Lakes, and the Samish River. Samples collected from the other ten sites met
Washington State water quality standards.
Page 4
Acknowledgements
The authors of this report would like to thank the following people for their contribution to this
study:
Mark Downen, Washington Department of Fish and Wildlife (WDFW), for providing fish
from Ross Lake, and other WDFW staff for providing site information and fish age data.
Dwayne Paige, senior watershed ecologist with Seattle Public Utilities, for providing fish
from Chester Morse Reservoir.
Phil Kincare, Jan Degroat, and Tom Shuhda, U.S. Forest Service, for providing site
information, boat launch access, and bunkhouse lodging.
Pat Crain and Brian Winter, Olympic National Park, for providing site information.
Rick Foster, Washington State Department of Natural Resources, for providing site
information.
Sonia Mumford, U.S. Fish and Wildlife Service, for coordinating fish organ tissue sampling
and supplies.
Marcia House, Northwest Indian Fisheries Commission, for assisting with fish organ tissue
processing.
Ed Chad, Clallam County Stream Keeper, for site information.
Dave King, owner of Olympic Raft and Kayak, for providing site information.
Washington State Department of Ecology Staff:
o Water Quality Program staff for review of the draft report: Christine Hempleman,
Dave Rountry, and Karin Baldwin.
o Manchester Environmental Laboratory staff for analytical services: Myrna Mandjikov,
Debi Case, Dean Momohara, Dolores Montgomery, John Weakland, Kelly Donegan,
Karin Feddersen, Stuart Magoon, Aileen Richmond, and Leon Weiks.
o Environmental Assessment Program staff for sample collection, processing, and data
management: Dave Serdar, Patti Sandvik, Chad Furl, Brandee Era-Miller, Carolyn Lee,
Randy Coots, Art Johnson, Kristin Carmak, Paul Anderson, Callie Meredith,
Chris Moore, Brandon Sloan, and Nuri Mathieu.
o Other Environmental Assessment Program staff: Dale Norton for project guidance
and design and review of the report; Chad Furl for reviewing the report; and Joan
LeTourneau, Cindy Cook, and Gayla Lord for formatting and editing the final report.
Page 5
Background
During the 1980s and 1990s, the Washington State Department of Ecology (Ecology) and other
agencies found toxic contaminants in fish, water, and sediment throughout Washington at varied
levels of concern (www.ecy.wa.gov/toxics.html). In 2000, renewed concern about toxic
contaminants in the environment led Ecology to revitalize a program to address toxic
contaminants: the Washington State Toxics Monitoring Program (WSTMP).
The goals of the WSTMP are to:
Conduct exploratory monitoring to characterize toxic contaminants in freshwater fish across
Washington where historical data are lacking (the subject of this report).
Conduct trend monitoring for persistent toxic chemicals.
Improve access to information about monitoring contaminants in Washington:
www.ecy.wa.gov/programs/eap/toxics/index.html.
Establish cooperative efforts with other agencies and develop monitoring efforts to address
topics of concern.
Between 2001 and 2007, 232 fish tissue samples from 104 sites were analyzed for various
contaminants as part of the WSTMP Exploratory Monitoring component. Five annual reports
have been published (www.ecy.wa.gov/programs/eap/toxics/wstmp.htm). Nearly 40,000 results
are now available in Ecology’s Environmental Information Management database (EIM) at
www.ecy.wa.gov/eim/.
Ecology and the Washington State Department of Health (DOH) are developing strategies to
address persistent, bioaccumulative, and toxic chemicals (PBTs) in our environment. These
strategies involve learning more about the sources, uses, risks, and fate of these compounds.
Mercury and flame retardants were the first PBTs for which chemical action plans were
developed (www.ecy.wa.gov/programs/swfa/pbt/).
Fish are an important indicator of contaminant levels in the environment. Ecology evaluates fish
tissue contaminant data to determine whether Washington State water quality standards are being
met.
Contaminant concentrations in fish tissue that do not meet water quality standards are not
necessarily high enough to warrant a fish consumption advisory to eat less fish. DOH evaluates
the need for consumption advice based on multiple factors, including the benefits of eating fish
as part of a healthy diet (www.doh.wa.gov/ehp/oehas/fish/advisoriesmap.htm).
This report summarizes results of analyses of freshwater fish samples collected from 16 sites in
2007 (Figure 1 and Appendix A).
Page 6
Figure 1. Sample Sites for the WSTMP, 2007.
Page 7
Study Design
This exploratory monitoring component of the WSTMP targets resident freshwater fish from
Washington. The primary purpose is to screen for PBT chemicals from areas with limited data
available on toxic chemicals in fish. The project plan describes the program in more detail
(Seiders and Yake, 2002).
Contaminants Assessed
An overview of target analytes for this component of the program is given below.
Mercury
Mercury occurs in the earth’s crust and is released to the environment from natural events
(e.g., volcanoes, weathering, and forest fires) and human activities (e.g., fossil fuel combustion,
mining, and industrial processes).
Methylmercury is the toxic form of mercury which persists in the environment as it accumulates
in the food web. Eating fish and shellfish contaminated with methylmercury is the primary route
for exposure to mercury for most people (ATSDR, 1999; Ecology and DOH, 2003; EPA, 2007).
PCBs
Polychlorinated biphenyls (PCBs) are synthetic organic compounds historically used as cooling
fluids in electrical equipment, and in inks, paints, and plastics. PCBs are stable, have low
solubility in water, and have a high affinity for sediments and animal fats. The production of
PCBs was banned in the U.S. in 1979 due to their persistence and toxicity (ATSDR, 2000).
There are 209 individual PCBs, or congeners. Commercial mixtures of PCB congeners were
manufactured under various trade names. The most common in the United States used the trade
name Aroclor. PCB Aroclors were analyzed in all 35 WSTMP samples from 2007; individual
PCB congeners were analyzed in 27 (about 68%) of these samples.
Dioxins and Furans (PCDD/Fs)
Dioxins and furans, or polychlorinated dibenzo-p-dioxins and -furans (PCDD/Fs), are
unintentional byproducts of combustion processes (e.g., burning household trash, forest fires,
waste incineration), chlorine bleaching in paper production, and chemical and pesticide
manufacturing. Agent Orange, which was used as a defoliant in the Vietnam War, contained
dioxins (ATSDR, 2006).
Twenty seven of the 35 samples from 2007 were analyzed for the 17 most toxic congeners.
These congeners have different levels of toxicity compared to 2,3,7,8-TCDD, the most toxic
congener. The cumulative toxicity of mixtures of congeners in a sample can be expressed as a
Page 8
toxic equivalent (TEQ) to 2,3,7,8-TCDD. The TEQ is calculated by multiplying the result for
each congener by its congener-specific Toxicity Equivalent Factor (TEF) and then summing
these products to obtain the 2,3,7,8-TCDD TEQ. The 1998 World Health Organization TEFs
(Van den Berg et al., 1998) were used in this report.
Chlorinated Pesticides
Pesticides include insecticides, herbicides, fungicides, and related chemicals used to control
pests. Chlorinated pesticides were analyzed for in this study because of their widespread
occurrence and persistence in the environment.
Many of these pesticides are neurotoxins and are suspected or known carcinogens (EPA, 2000).
Some pesticides were banned from use in the United States during the 1970s and 1980s as their
hazards became evident (e.g., DDT, chlordane, and dieldrin).
PBDE Flame Retardants
Flame retardants, specifically poly-brominated diphenyl ethers (PBDEs), are compounds added
to plastic and foam products such as electronic enclosures, wire insulation, adhesives, textile
coatings, foam cushions, and carpet padding. Increasing concentrations of PBDEs in humans
and wildlife worldwide continue to raise concerns about their health effects. The highest levels
of PBDEs in human tissue have been found in the U.S. and Canada (Ecology and DOH, 2006).
Similar to PCBs, there are theoretically 209 individual congeners of PBDEs. Thirteen of these
congeners were analyzed for during this study: PBDE-47, 49, 66, 71, 99, 100, 138, 153,154, 183,
184, 191, 209.
Site Selection
Sites are selected for sampling by examining various factors, such as the type of species present,
the presence or absence of historical data, the value of the site for fishing, and the ability to
cooperate with other monitoring or watershed planning efforts.
One of these efforts was a study of fish in Ross Lake in eastern Whatcom County. Mark
Downen of the Washington Department of Fish and Wildlife (WDFW) provided bull trout,
rainbow trout, and redside shiner to Ecology for tissue analysis. This is the first time that bull
trout, a threatened species, has been included in Ecology’s fish tissue monitoring efforts.
Appendix A lists the sample site locations and species of fish sampled. Additional site and
sample information, including analytical results, are available in Ecology’s Environmental
Information Management (EIM) database at www.ecy.wa.gov/eim/index.htm. Search User
Study ID: WSTMP07.
Page 9
Field Procedures
Target fish species were chosen based on recommendations from the U.S. Environmental
Protection Agency (EPA, 2000) and previous experience with fish collection efforts. Most fish
were collected in late summer or fall by electro-fishing, gill netting, angling, or trapping.
Fish kept for analyses were given a unique identifying code, measured for length and weight,
individually wrapped in aluminum foil and put in plastic bags, and transported to freezer storage.
Fish were later processed at Ecology facilities. Composite samples were made up of skin-on
fillets from five to ten fish of the same species from the same site. The sex of each fish was
determined. Samples were then sent to laboratories for chemical analyses. Redside shiner from
Ross Lake were processed as whole fish at the request of WDFW. Sample collection and
processing details are described in a standard operating procedure (SOP) (Sandvik, 2006).
Analytical Methods
Table 1 describes analytical methods. Most analyses were performed by Ecology’s Manchester
Environmental Laboratory (MEL). Pace Analytical Services of Minneapolis, MN, conducted
analyses for PCB congeners and PCDD/Fs. At Ecology’s request, PCDD/Fs results were
reported down to the limit of detection, with values qualified as estimates if they were between
the limit of detection and the quantitation limit.
Table 1. Analytical Methods for Fish Tissue Samples, WSTMP 2007.
Parameter Description Method Reporting Limit
PCB Aroclors GC/ECD EPA 8082 0.9 ug/kg, wet wt
PCB Congeners HiRes GC/MS EPA 1668A 0.05 - 1.2 ug/kg, wet wt
Chlorinated pesticides GC/ECD EPA 8081 1 0.25 -15 ug/kg, wet wt
PBDEs GC/MS SIM EPA 8270 2 0.1 - 2.6 ug/kg, wet wt
PCDD/PCDFs HiRes GC/MS EPA 1613B 0.1 - 1.0 ng/kg, wet wt
Mercury (total mercury) CVAA EPA 245.6 0.017 mg/kg, wet wt
Lipids - percent gravimetric MEL SOP 730009 0.1 percent
1. MEL 730073, a modification of EPA 8081 and others, was used in sample analyses.
2. MEL SOP 730096, a modification of EPA 8270, was used in sample analyses.
SOP = Standard Operating Procedure.
GC = Gas Chromatography.
MS = Mass Spectrometry.
ECD = Electron Capture Detection.
SIM = Single Ion Monitoring.
HiRes = High Resolution.
CVAA = Cold Vapor Atomic Absorbance.
Page 10
Fish tissue was analyzed for total mercury because the analytical costs for methylmercury are
prohibitively high. Methylmercury is also the predominant form of mercury found in free-
swimming fish accounting for 95-100% of total mercury (Bloom, 1995). Both mercury and
methylmercury are used as the basis for various water quality criteria or threshold values for the
protection of human health and aquatic life.
Data Quality
Data quality was assessed by reviewing laboratory case narratives, analytical results, and field
replicate data. Case narratives were written by MEL analytical staff. The narratives described
the condition of samples upon receipt, analytical quality control procedures, and data
qualifications. Quality control procedures included a mixture of analyses such as: method
blanks, calibration and control standards, matrix spikes, matrix spike duplicates, surrogate
recoveries, and laboratory and field duplicates.
Overall, the 2007 data met most quality control criteria defined by MEL and the Quality
Assurance Project Plan. All results are usable as qualified. Initial analyses for PCB aroclors did
not meet reporting limits, so samples were re-analyzed and met the desired reporting limits. No
other data were rejected or re-analyzed. Some data were qualified due to challenges encountered
in analyses. Estimates of precision were mixed, ranging from poor to good, and appear typical
for samples of fish tissue.
Appendix B summarizes results from quality control and quality assurance procedures. Other
quality assurance information is available by contacting the authors of this report.

Page 11
Water Quality Criteria
Fish tissue results were compared to Washington’s water quality standards to determine how
sites should be assessed in Washington’s Statewide Water Quality Assessment (the 303(d)
assessment). This assessment also describes sampling requirements and other details about how
environmental results are reviewed (Ecology, 2006).
Washington adopted the National Toxics Rule criteria (NTR) as the water quality standards for
toxic compounds associated with human-health concerns. These criteria are one set of values
that can be used in gauging the potential for human health risks from eating contaminated fish.
EPA developed more recent criteria and guidance values which are described below. (See EPA
Recommended Water Quality Criteria and EPA Screening Values).
The NTR criteria, EPA’s recommended criteria, and EPA’s screening values exist because of
changing knowledge about the toxic effects of chemicals and subsequent risks to consumers of
fish. The various criteria and screening values are often based on different assumptions used in
determining risk, such as daily consumption rates, toxicological data used in calculations, and
risk levels.
Results of this 2007 study are not compared to these other two EPA values because Ecology
lacks authority to begin corrective actions where these criteria are exceeded. Yet the EPA
recommended criteria and screening values can be used by state, tribal, and local health
jurisdictions in evaluating risks to human health from the consumption of contaminated fish.
Appendix C describes how Ecology and DOH evaluate fish tissue data. Table 2 shows the NTR
(Washington’s water quality standards criteria) and other EPA criteria and screening values for
contaminants detected in this study.

Page 12
Table 2. Criteria and Guidelines Used for the Protection of Human Health for Contaminants
Detected in Fish Tissue, WSTMP 2007.
Analyte1
National
Toxics
Rule
National
Recommended
Water Quality
Criteria 2
EPA Screening Values
Subsistence Fishers Recreational Fishers
Non-
carcino-
gens
Carcino-
gens
Non-
carcino-
gens
Carcino-
gens
Mercury 825 300 49 - 400 -
Total PCBs 3 5.3 2.0 9.83 2.45 80 20
2,3,7,8-TCDD 4 0.07 - - - - -
2,3,7,8-TCDD TEQ 4, 5
- 0.026 - 0.0315 - 0.256
4,4'-DDD 45 17 - - - -
4,4'-DDE 32 12 - - - -
4,4'-DDT 32 12 - - - -
Total DDT 6 - - 245 14.4 2000 117
Chlordane 7 8.3 11 245 14.0 2000 114
Chlordane (technical) - - - - - -
Dieldrin 0.65 0.25 24 0.307 200 2.5
DDMU 8 - - - - - -
Hexachlorobenzene 6.7 2.5 393 3.07 3200 25.0
Pentachloroanisole - - - - - -
PBDEs - - - - - -
1. Values in parts per billion wet weight (ug/kg ww) unless otherwise noted.
2. EPA (2001) for methylmercury, EPA (2002) for others.
3. Total PCBs is sum of Aroclors or congeners.
4. Values in parts per trillion wet weight (ng/kg ww).
5. The cumulative toxicity of a mixture of congeners in a sample can be expressed as a Toxic Equivalent (TEQ) to
2,3,7,8-TCDD.
6. Total DDT is the sum of 2,4'- and 4,4'- isomers of DDD, DDE, and DDT. DDD = 4,4'-
dichlorodiphenyldichloroethane. DDE = 4,4'-dichlorodiphenyldichloroethylene. DDT = 4,4'-
dichlorodiphenyltrichloroethane.
7. The NTR criterion for chlordane is interpreted as the sum of five chlordane components: these can be
individually quantified through laboratory analyses while chlordane cannot. The EPA Screening Values are for
"Total Chlordanes" which is the sum of five compounds: cis- and trans- chlordane, cis- and trans- nonachlor, and
oxychlordane.
8. DDMU (1-chloro-2,2-bis(p-chlorophenyl)ethene) is another breakdown product of DDT.
Page 13
National Toxics Rule (NTR) Washington State’s water quality standards for toxic substances (WAC 173-201A-040[5]) define
human health-based water quality criteria by referencing 40 CFR 131.36, also known as the
National Toxics Rule.
The NTR criteria were issued by EPA to Washington State in 1992. These criteria are designed
to minimize the risk of adverse effects occurring to humans from chronic (lifetime) exposure to
toxic substances through the ingestion of drinking water and contaminated fish and shellfish
obtained from surface waters. The NTR criteria are regulatory values used by Ecology for a
number of different purposes, including permitting wastewater discharges and assessing when
waterbodies are adversely impacted by contaminants.
The NTR criteria values are based on a daily fish consumption rate of 6.5 grams/day and a risk
level of 10-6
. A risk level is an estimate of the number of cases of adverse health effects (e.g.
cancer) that could be caused by exposure to a specific contaminant. At a risk level of 10-6
, one
person in a million would be expected to contract cancer due to long-term exposure to a specific
contaminant.
Ecology expresses the NTR water column criteria as tissue concentrations in order to compare
the criteria to laboratory results from fish tissue samples (Ecology, 2006). These tissue
concentrations are derived by multiplying the NTR water quality criterion for “human health for
consumption of organisms only” by the bioconcentration factor (BCF) for the specific
contaminant. The BCFs for specific contaminants are found in EPA’s 1980 Ambient Water
Quality Criteria documents (EPA, 1980).
EPA Recommended Water Quality Criteria EPA has published National Recommended Water Quality Criteria for some substances such as
mercury and pesticides (EPA, 2001, 2002, and 2003). These recommended criteria are updates
to previously developed criteria that occur on an ongoing basis. EPA recommends these criteria
be used when states and tribes revise their regulatory criteria. These EPA recommended criteria
are not regulatory levels. Most of EPA’s Recommended Water Quality Criteria are based on a
daily fish consumption rate of 17.5 grams/day and a risk level of 10-6
.
Page 14
EPA Screening Values
Screening values (SVs) for carcinogenic and non-carcinogenic effects of substances were
developed by EPA to help prioritize areas that may present risks to humans from fish
consumption. The EPA SVs are considered guidance only; they are not regulatory thresholds
(EPA, 2000). The approach in developing the EPA SVs was similar to the approach used for
developing the NTR, yet differs in two key assumptions:
A cancer risk level of 10-5
.
Two consumption rates: 17.5 grams/day for recreational fishers, and 142.4 grams/day for
subsistence fishers.
A difference between the EPA SVs and NTR relating to PCDD/Fs is that the SVs use the
2,3,7,8-TCDD TEQ value while Ecology uses the single congener (2,3,7,8-TCDD) for 303(d)
assessments (Ecology, 2006).

Page 15
Results and Discussion
In 2007 sixteen sites were sampled yielding 35 sample results representing 12 freshwater species
of fish. Most results from the 2007 WSTMP were within the lower range of values found in
other studies of fish tissue in Washington.
Bull trout were included in the 2007 samples and represent the first known case of this species
being analyzed for contaminants in fillet tissue. Contaminant levels were generally low in this
sample except for mercury which was moderately elevated. These fish were from Ross Lake and
were provided by the Washington Department of Fish and Wildlife (WDFW).
The concentrations of contaminants in fish tissue are expressed in wet weight using these units of
measure:
mg/kg = ppm, or parts per million
ug/kg = ppb, or parts per billion
ng/kg = ppt, or parts per trillion
Table 3 shows summary statistics for key contaminants in freshwater fish. Mercury was detected
in 100% of the 35 samples, PBDEs in 97%, and PCBs in 91%. Pesticides in the DDT and
chlordane groups were detected in 63% and 6% of the samples, respectively. Twenty-seven
samples were analyzed for PCB congeners and dioxins/furans with all samples having detectable
levels.
Concentrations of PCBs in 26% of the samples exceeded the NTR criterion. Nineteen percent of
the samples tested for 2,3,7,8-TCDD exceeded the NTR criterion. Total PCBs and 2,3,7,8-TCDD
accounted for most of the NTR exceedances.
Appendix D shows results for key analytes in fish tissue samples.
Page 16
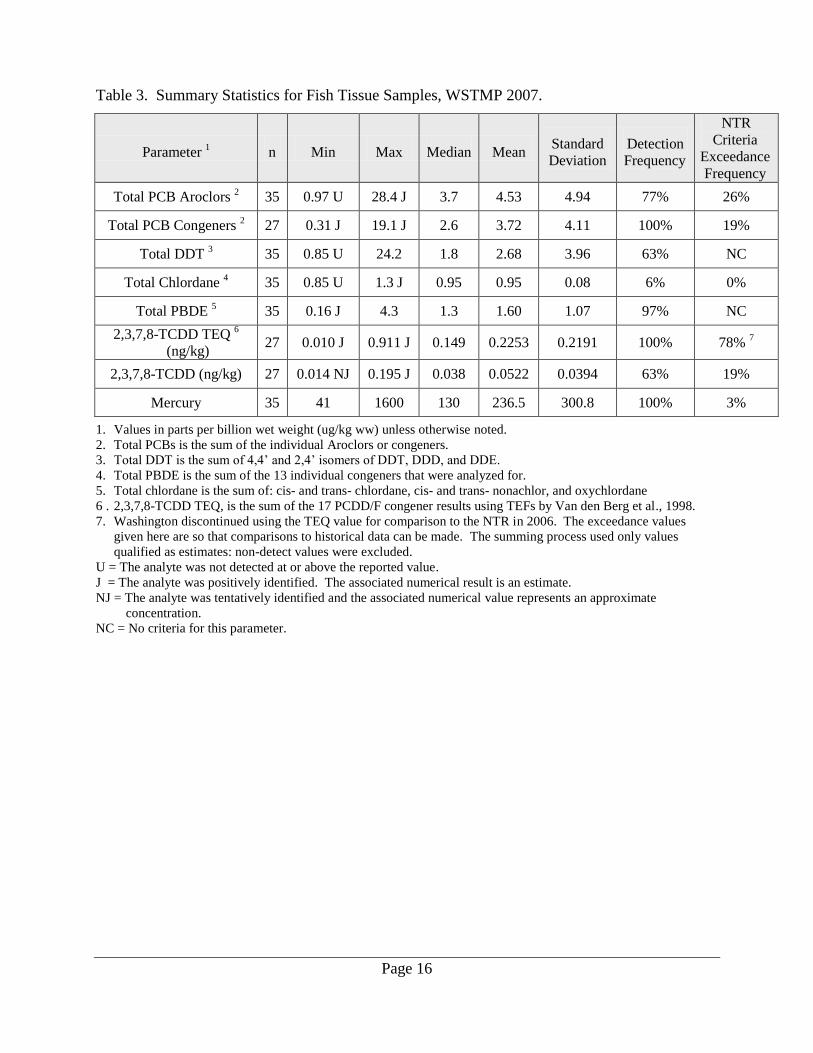
Table 3. Summary Statistics for Fish Tissue Samples, WSTMP 2007.
Parameter 1 n Min Max Median Mean
Standard
Deviation
Detection
Frequency
NTR
Criteria
Exceedance
Frequency
Total PCB Aroclors 2 35 0.97 U 28.4 J 3.7 4.53 4.94 77% 26%
Total PCB Congeners 2 27 0.31 J 19.1 J 2.6 3.72 4.11 100% 19%
Total DDT 3 35 0.85 U 24.2 1.8 2.68 3.96 63% NC
Total Chlordane 4 35 0.85 U 1.3 J 0.95 0.95 0.08 6% 0%
Total PBDE 5 35 0.16 J 4.3 1.3 1.60 1.07 97% NC
2,3,7,8-TCDD TEQ 6
(ng/kg) 27 0.010 J 0.911 J 0.149 0.2253 0.2191 100% 78%
7
2,3,7,8-TCDD (ng/kg) 27 0.014 NJ 0.195 J 0.038 0.0522 0.0394 63% 19%
Mercury 35 41 1600 130 236.5 300.8 100% 3%
1. Values in parts per billion wet weight (ug/kg ww) unless otherwise noted.
2. Total PCBs is the sum of the individual Aroclors or congeners.
3. Total DDT is the sum of 4,4’ and 2,4’ isomers of DDT, DDD, and DDE.
4. Total PBDE is the sum of the 13 individual congeners that were analyzed for.
5. Total chlordane is the sum of: cis- and trans- chlordane, cis- and trans- nonachlor, and oxychlordane
6 . 2,3,7,8-TCDD TEQ, is the sum of the 17 PCDD/F congener results using TEFs by Van den Berg et al., 1998.
7. Washington discontinued using the TEQ value for comparison to the NTR in 2006. The exceedance values
given here are so that comparisons to historical data can be made. The summing process used only values
qualified as estimates: non-detect values were excluded.
U = The analyte was not detected at or above the reported value.
J = The analyte was positively identified. The associated numerical result is an estimate.
NJ = The analyte was tentatively identified and the associated numerical value represents an approximate
concentration.
NC = No criteria for this parameter.

Page 17
Contaminants in Freshwater Fish
Mercury
Mercury was detected in all samples. Only one sample exceeded the NTR criterion of 825 ug/kg
while seven others were greater than EPA’s Recommended Water Quality Criterion for
methylmercury of 300 ug/kg (EPA, 2001). The range of values was similar to those seen in past
WSTMP samples (Figure 2) as well as in other mercury monitoring efforts in Washington (Furl
and Meredith, 2008).
Older and larger piscivorous (fish-eating) fish tended to have higher mercury levels. The highest
levels were found in samples of northern pikeminnow and largemouth bass with mean ages
ranging from 5.8 – 15.8 years old. The highest level of mercury, 1600 ug/kg, was in the northern
pikeminnow sample from Lake Ozette. Largemouth bass from Big, Campbell, and Samish
Lakes had mercury levels of 497-754 ug/kg. Mercury levels in other fish from Samish Lake
were also elevated: 575 ug/kg in northern pikeminnow and 429 ug/kg in peamouth.
Rainbow trout from Chester Morse Reservoir had the highest level of mercury (407 ug/kg) found
in 56 samples of five species of trout analyzed in the WSTMP since 2001. Brook trout from the
Sanpoil River (234 ug/kg) and bull trout from Ross Lake (216 ug/kg) also had some of the
highest mercury levels found in trout species collected thus far (89th
and 88th
percentile,
respectively).

Page 18
10
100
1000
0% 10% 20% 30% 40% 50% 60% 70% 80% 90% 100%
Merc
ury
(p
pb
ww
)
Percentile (n=226)
2001-2006 values
2007 values
NTR Criterion (825 ppb)
EPA SV Recreational Fishers (400 ppb)
EPA Recommended Criterion (300 ppb)
EPA SV Subsistence Fishers (49 ppb)
Figure 2. Distribution of Mercury in Edible Fish Tissue, WSTMP 2001-2007.
Page 19
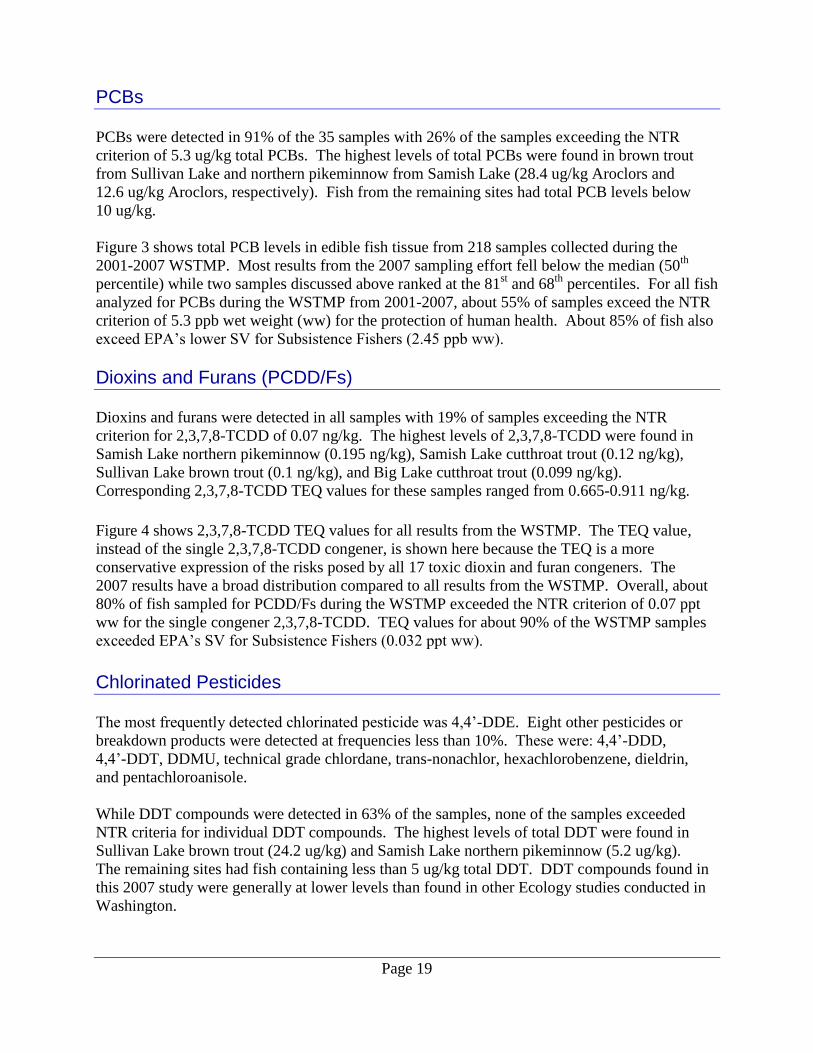
PCBs
PCBs were detected in 91% of the 35 samples with 26% of the samples exceeding the NTR
criterion of 5.3 ug/kg total PCBs. The highest levels of total PCBs were found in brown trout
from Sullivan Lake and northern pikeminnow from Samish Lake (28.4 ug/kg Aroclors and
12.6 ug/kg Aroclors, respectively). Fish from the remaining sites had total PCB levels below
10 ug/kg.
Figure 3 shows total PCB levels in edible fish tissue from 218 samples collected during the
2001-2007 WSTMP. Most results from the 2007 sampling effort fell below the median (50th
percentile) while two samples discussed above ranked at the 81st and 68
th percentiles. For all fish
analyzed for PCBs during the WSTMP from 2001-2007, about 55% of samples exceed the NTR
criterion of 5.3 ppb wet weight (ww) for the protection of human health. About 85% of fish also
exceed EPA’s lower SV for Subsistence Fishers (2.45 ppb ww).
Dioxins and Furans (PCDD/Fs)
Dioxins and furans were detected in all samples with 19% of samples exceeding the NTR
criterion for 2,3,7,8-TCDD of 0.07 ng/kg. The highest levels of 2,3,7,8-TCDD were found in
Samish Lake northern pikeminnow (0.195 ng/kg), Samish Lake cutthroat trout (0.12 ng/kg),
Sullivan Lake brown trout (0.1 ng/kg), and Big Lake cutthroat trout (0.099 ng/kg).
Corresponding 2,3,7,8-TCDD TEQ values for these samples ranged from 0.665-0.911 ng/kg.
Figure 4 shows 2,3,7,8-TCDD TEQ values for all results from the WSTMP. The TEQ value,
instead of the single 2,3,7,8-TCDD congener, is shown here because the TEQ is a more
conservative expression of the risks posed by all 17 toxic dioxin and furan congeners. The
2007 results have a broad distribution compared to all results from the WSTMP. Overall, about
80% of fish sampled for PCDD/Fs during the WSTMP exceeded the NTR criterion of 0.07 ppt
ww for the single congener 2,3,7,8-TCDD. TEQ values for about 90% of the WSTMP samples
exceeded EPA’s SV for Subsistence Fishers (0.032 ppt ww).
Chlorinated Pesticides
The most frequently detected chlorinated pesticide was 4,4’-DDE. Eight other pesticides or
breakdown products were detected at frequencies less than 10%. These were: 4,4’-DDD,
4,4’-DDT, DDMU, technical grade chlordane, trans-nonachlor, hexachlorobenzene, dieldrin,
and pentachloroanisole.
While DDT compounds were detected in 63% of the samples, none of the samples exceeded
NTR criteria for individual DDT compounds. The highest levels of total DDT were found in
Sullivan Lake brown trout (24.2 ug/kg) and Samish Lake northern pikeminnow (5.2 ug/kg).
The remaining sites had fish containing less than 5 ug/kg total DDT. DDT compounds found in
this 2007 study were generally at lower levels than found in other Ecology studies conducted in
Washington.
Page 20
0.1
1
10
100
1000
0% 10% 20% 30% 40% 50% 60% 70% 80% 90% 100%
t-P
CB
(p
pb
ww
)
Percentile (n=218)
2001-2006 values
2007 values
NTR Criterion (5.3 ppb)
EPA SV Subsistence Fishers (2.45 ppb)
EPA SV Recreational Fishers (20 ppb)
Figure 3. Distribution of Total PCBs in Edible Fish Tissue, WSTMP 2001-2007.

Page 21
0.001
0.010
0.100
1.000
10.000
0% 10% 20% 30% 40% 50% 60% 70% 80% 90% 100%
2,3
,7,8
-TC
DD
TE
Q
(pp
t w
w)
Percentile (n=115)
2001-2006 values
2007 values
NTR Criterion for singlecongener 2,3,7,8-TCDD
(0.07 ppt)
EPA SV Subsistence Fishers (0.032 ppt)
EPA SV Recreational Fishers (0.256 ppt)
Figure 4. Distribution of 2,3,7,8-TCDD TEQ in Edible Fish Tissue, WSTMP 2001-2007.

Page 22
Total chlordane was detected in only two samples: Sullivan Lake brown trout (1.3 ug/kg) and
Samish Lake northern pikeminnow (1.1 ug/kg). Neither sample exceeded the NTR criterion of
8.3 ug/kg. However, technical grade chlordane was found at low levels (4.7-7.9 ug/kg) in three
samples: Samish Lake northern pikeminnow and peamouth, and Sullivan Lake brown trout.
Regarding residues in fish tissue, total chlordane and technical grade chlordane can be
considered synonymous based on descriptions by the Agency for Toxic Substances and Disease
Registry (ASTDR, 1994) and EPA’s Substance Registry System (EPA, 2008).
While technical chlordane is a complex mixture of over 100 individual chemicals, EPA (2000)
recommends summing the concentrations of its major components and metabolites to yield a
concentration called “total chlordane”. The major components used in this summing are cis- and
trans-chlordane, cis- and trans-nonachlor, and oxychlordane. These components have been
target analytes and more consistently determined in fish tissue studies in Washington while
technical grade chlordane has not. Ecology employs the total chlordane summing procedure to
determine whether water quality standards are met (Ecology, 2006).
The only detection of hexachlorobenzene was in the cutthroat trout sample from Big Lake. The
concentration of 8.3 ug/kg exceeded the NTR criterion of 6.7 ug/kg.
Dieldrin was found in two samples from the Samish River: cutthroat trout (0.46 ug/kg) and
mountain whitefish (0.61 ug/kg). Both of these results were below the NTR criterion of
0.65 ug/kg.
Pentachloroanisole, a breakdown product of pentachlorophenol, was found in Samish Lake
cutthroat trout (2.8 ug/kg) and peamouth (2.6 ug/kg). There are no regulatory criteria for
Pentachloroanisole.
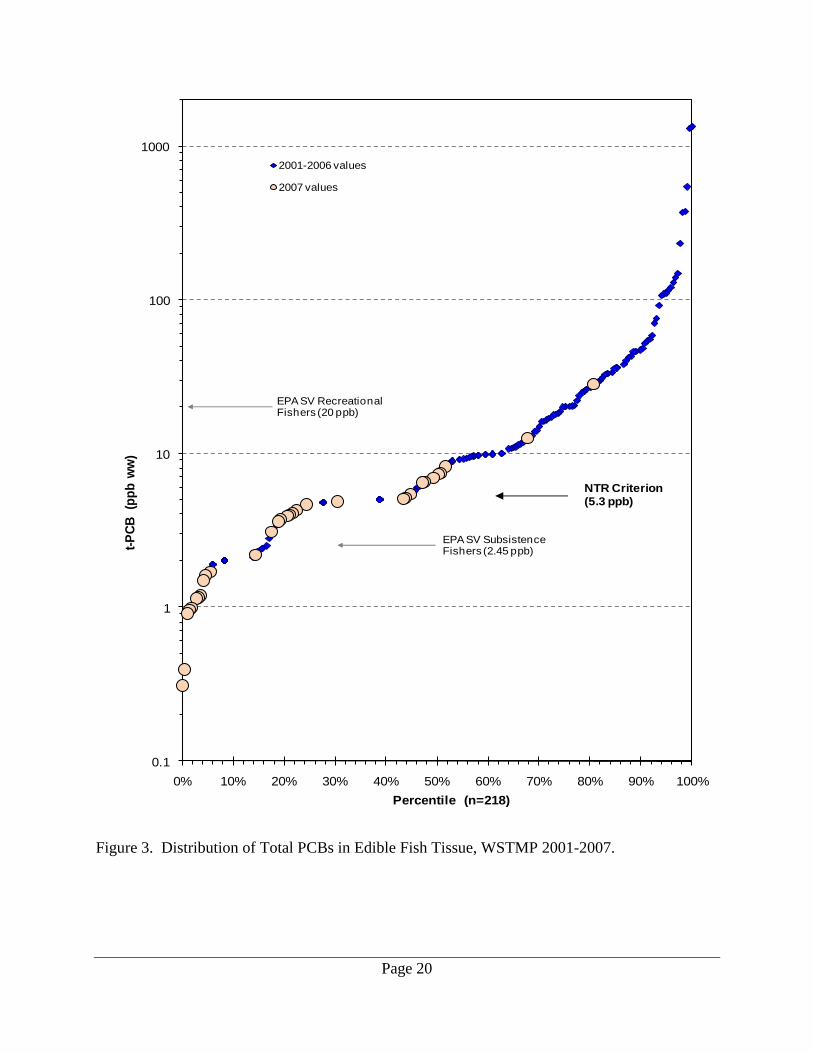
PBDE Flame Retardants
PBDEs were detected in 97% of fish tissue samples at low levels: all samples had less than
5 ug/kg total PBDEs. The highest levels of total PBDEs were in cutthroat trout from Samish
Lake (4.3 ug/kg) and brown trout from Sullivan Lake (3.8 ug/kg). The remaining values were
less than or equal to 3.5 ug/kg which is in the range of the median value of 2.8 ug/kg found
during a survey of PBDEs in Washington (Johnson et al., 2006). The 2007 results were also in
the lower 65% of all results for the WSTMP (Figure 5). About 80% of all WSTMP samples had
PBDE levels below 10 ug/kg.
Comparisons to Historical Data
Only two sites sampled in 2007 had been studied in the past: Samish Lake and Lake Ozette.
Two species from Samish Lake and one species from Lake Ozette can be compared.
Page 23
0.1
1.0
10.0
100.0
0% 10% 20% 30% 40% 50% 60% 70% 80% 90% 100%
t-P
BD
E
(pp
b w
w)
Percentile (n=209)
2001-2006 values
2007 values
Figure 5. Distribution of Total PBDEs in Edible Fish Tissue, WSTMP 2001-2007.
Page 24
Fish from Samish Lake were included in three studies: a statewide survey of 10 lakes in 1989
(Johnson and Norton, 1990); a statewide survey of mercury in fish (Fischnaller et al., 2003); and
as part of the 2001 WSTMP (Seiders, 2003). Results from cutthroat trout samples from the 2001
and 2007 surveys are compared below. Changes in mercury levels in largemouth bass over time
are discussed by Furl and Meredith (2008) as part of a statewide mercury trend monitoring effort.
For Samish Lake, an insignificant difference (1%) was found in mercury levels between bass
collected in 2003 and 2008.
Lake Ozette was initially sampled during the 2004 WSTMP (Seiders et al., 2007). While the
2007 sampling was part of a study to determine levels of PCBs and PCDD/Fs at “background”
sites across the state (Johnson et al., 2007), the WSTMP analyzed one sample of northern
pikeminnow for the same suite of contaminants that were analyzed in 2004. This additional
analysis of a high trophic-level species should improve confidence in the data for this site within
the Olympic National Park.
Differences in contaminant levels in samples can be influenced by many characteristics of the
fish sampled, such as size, age, and lipid content. The greater the similarity among these factors,
the stronger any comparison will be. Sample collection, preparation, and analytical methods
were similar for all samples which also improves the comparability of results.
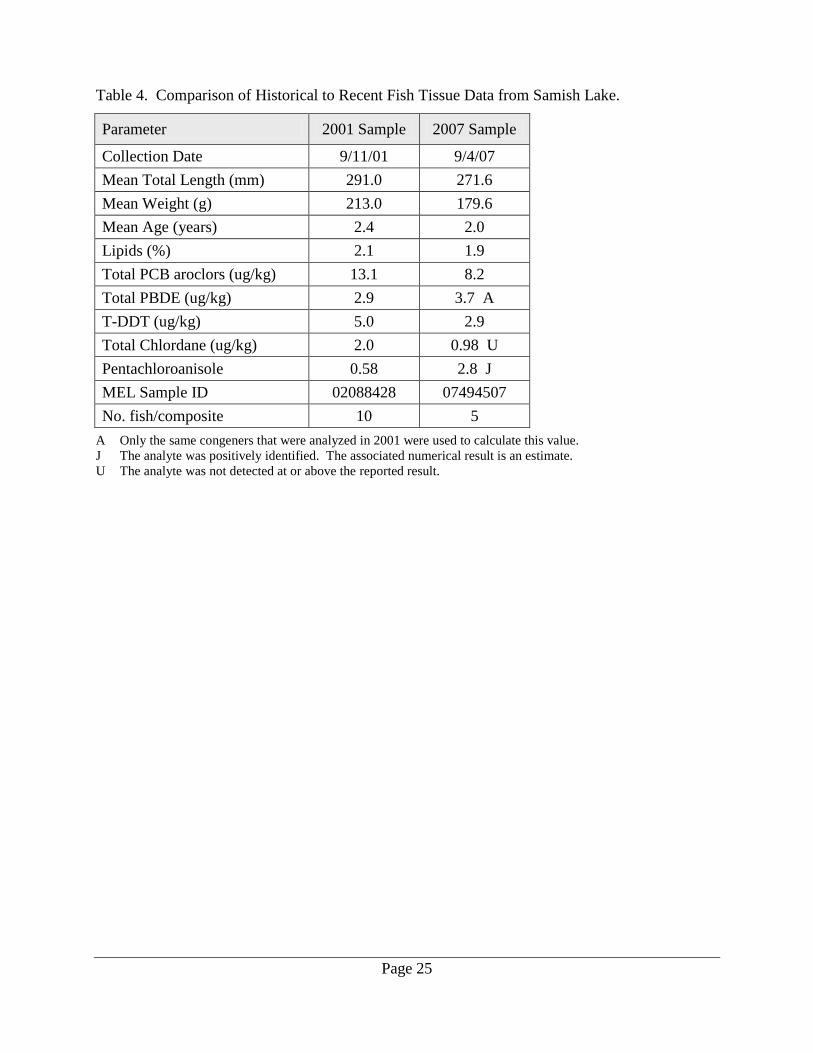
Tables 4 and 5 show that fish size, age, and lipids were similar between samples for each site.
Samples were collected at nearly the same time during the season which helps negate any
influence of seasonality that may affect contaminant levels. Levels of most contaminants were
similar between years. Differences in levels are generally within the variability seen among field
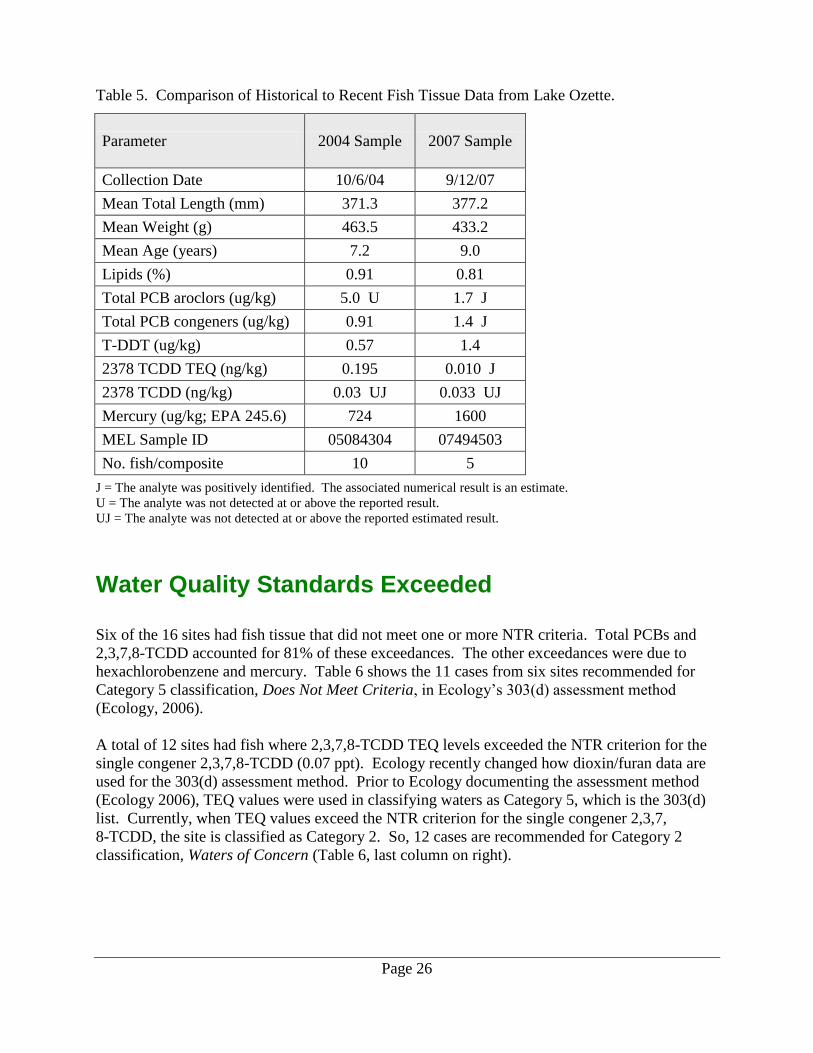
and laboratory duplicate samples. Yet fish from Lake Ozette showed larger differences in
mercury and PCDD/Fs levels.
Mercury levels in both Lake Ozette samples were among the highest seen in Washington. The
2007 sample result (1600 ppb) is more than twice that of the 2004 result (724 ppb). This
difference is likely due in part to the 2007 fish being about 20% older than those from 2004.
Other reasons for the difference could be sampling variability and a real increase in mercury
accumulation in Lake Ozette fish. In 2008, Lake Ozette was added to Ecology’s effort to
examine trends in mercury levels in fish, primarily largemouth bass (Furl and Meredith, 2008).
Future sampling under the trends monitoring effort will provide more information about changes
in mercury levels at Lake Ozette.
The 2,3,7,8-TCDD TEQ result for the 2004 sample is nearly 20 times higher than that for the
2007 sample. This difference is most likely due to changes in analytical detection limits and
reporting practices between years rather than differences in the environment. For example,
results for individual congeners that were near detection limits and reported as estimates may not
be very accurate. Even so, such values were included in calculating the 2,3,7,8-TCDD TEQ.
Page 25
Table 4. Comparison of Historical to Recent Fish Tissue Data from Samish Lake.
Parameter 2001 Sample 2007 Sample
Collection Date 9/11/01 9/4/07
Mean Total Length (mm) 291.0 271.6
Mean Weight (g) 213.0 179.6
Mean Age (years) 2.4 2.0
Lipids (%) 2.1 1.9
Total PCB aroclors (ug/kg) 13.1 8.2
Total PBDE (ug/kg) 2.9 3.7 A
T-DDT (ug/kg) 5.0 2.9
Total Chlordane (ug/kg) 2.0 0.98 U
Pentachloroanisole 0.58 2.8 J
MEL Sample ID 02088428 07494507
No. fish/composite 10 5
A Only the same congeners that were analyzed in 2001 were used to calculate this value.
J The analyte was positively identified. The associated numerical result is an estimate.
U The analyte was not detected at or above the reported result.
Page 26
Table 5. Comparison of Historical to Recent Fish Tissue Data from Lake Ozette.
Parameter 2004 Sample 2007 Sample
Collection Date 10/6/04 9/12/07
Mean Total Length (mm) 371.3 377.2
Mean Weight (g) 463.5 433.2
Mean Age (years) 7.2 9.0
Lipids (%) 0.91 0.81
Total PCB aroclors (ug/kg) 5.0 U 1.7 J
Total PCB congeners (ug/kg) 0.91 1.4 J
T-DDT (ug/kg) 0.57 1.4
2378 TCDD TEQ (ng/kg) 0.195 0.010 J
2378 TCDD (ng/kg) 0.03 UJ 0.033 UJ
Mercury (ug/kg; EPA 245.6) 724 1600
MEL Sample ID 05084304 07494503
No. fish/composite 10 5
J = The analyte was positively identified. The associated numerical result is an estimate.
U = The analyte was not detected at or above the reported result.
UJ = The analyte was not detected at or above the reported estimated result.
Water Quality Standards Exceeded Six of the 16 sites had fish tissue that did not meet one or more NTR criteria. Total PCBs and
2,3,7,8-TCDD accounted for 81% of these exceedances. The other exceedances were due to
hexachlorobenzene and mercury. Table 6 shows the 11 cases from six sites recommended for
Category 5 classification, Does Not Meet Criteria, in Ecology’s 303(d) assessment method
(Ecology, 2006).
A total of 12 sites had fish where 2,3,7,8-TCDD TEQ levels exceeded the NTR criterion for the
single congener 2,3,7,8-TCDD (0.07 ppt). Ecology recently changed how dioxin/furan data are
used for the 303(d) assessment method. Prior to Ecology documenting the assessment method
(Ecology 2006), TEQ values were used in classifying waters as Category 5, which is the 303(d)
list. Currently, when TEQ values exceed the NTR criterion for the single congener 2,3,7,
8-TCDD, the site is classified as Category 2. So, 12 cases are recommended for Category 2
classification, Waters of Concern (Table 6, last column on right).
Page 27
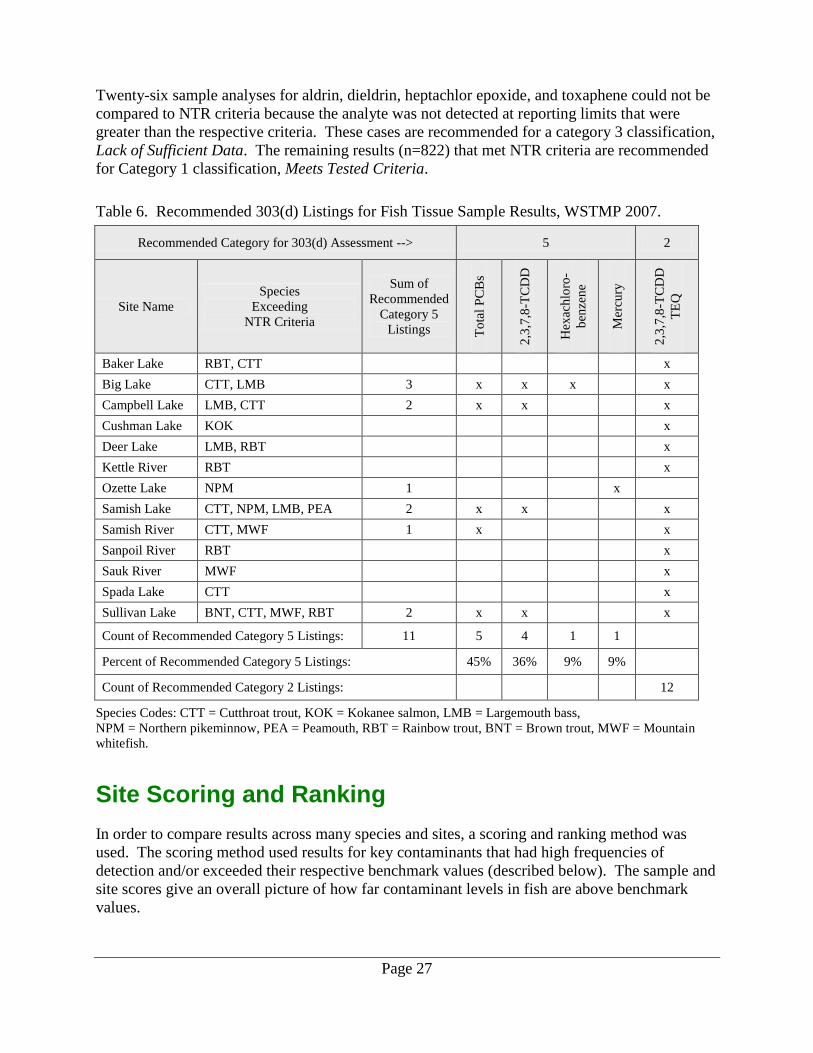
Twenty-six sample analyses for aldrin, dieldrin, heptachlor epoxide, and toxaphene could not be
compared to NTR criteria because the analyte was not detected at reporting limits that were
greater than the respective criteria. These cases are recommended for a category 3 classification,
Lack of Sufficient Data. The remaining results (n=822) that met NTR criteria are recommended
for Category 1 classification, Meets Tested Criteria.
Table 6. Recommended 303(d) Listings for Fish Tissue Sample Results, WSTMP 2007.
Recommended Category for 303(d) Assessment --> 5 2
Site Name
Species
Exceeding
NTR Criteria
Sum of
Recommended
Category 5
Listings To
tal
PC
Bs
2,3
,7,8
-TC
DD
Hex
ach
loro
-
ben
zen
e
Mer
cury
2,3
,7,8
-TC
DD
TE
Q
Baker Lake RBT, CTT
x
Big Lake CTT, LMB 3 x x x
x
Campbell Lake LMB, CTT 2 x x
x
Cushman Lake KOK
x
Deer Lake LMB, RBT
x
Kettle River RBT
x
Ozette Lake NPM 1
x
Samish Lake CTT, NPM, LMB, PEA 2 x x
x
Samish River CTT, MWF 1 x
x
Sanpoil River RBT
x
Sauk River MWF
x
Spada Lake CTT
x
Sullivan Lake BNT, CTT, MWF, RBT 2 x x x
Count of Recommended Category 5 Listings: 11 5 4 1 1
Percent of Recommended Category 5 Listings: 45% 36% 9% 9%
Count of Recommended Category 2 Listings:
12
Species Codes: CTT = Cutthroat trout, KOK = Kokanee salmon, LMB = Largemouth bass,
NPM = Northern pikeminnow, PEA = Peamouth, RBT = Rainbow trout, BNT = Brown trout, MWF = Mountain
whitefish.
Site Scoring and Ranking
In order to compare results across many species and sites, a scoring and ranking method was
used. The scoring method used results for key contaminants that had high frequencies of
detection and/or exceeded their respective benchmark values (described below). The sample and
site scores give an overall picture of how far contaminant levels in fish are above benchmark
values.
Page 28
This scoring and ranking was applied only to sites sampled by the WSTMP from 2001 through
2007. Scoring and ranking results from other fish tissue studies conducted in Washington to gain
a broader perspective is beyond the scope of this project’s reporting effort.
Scoring
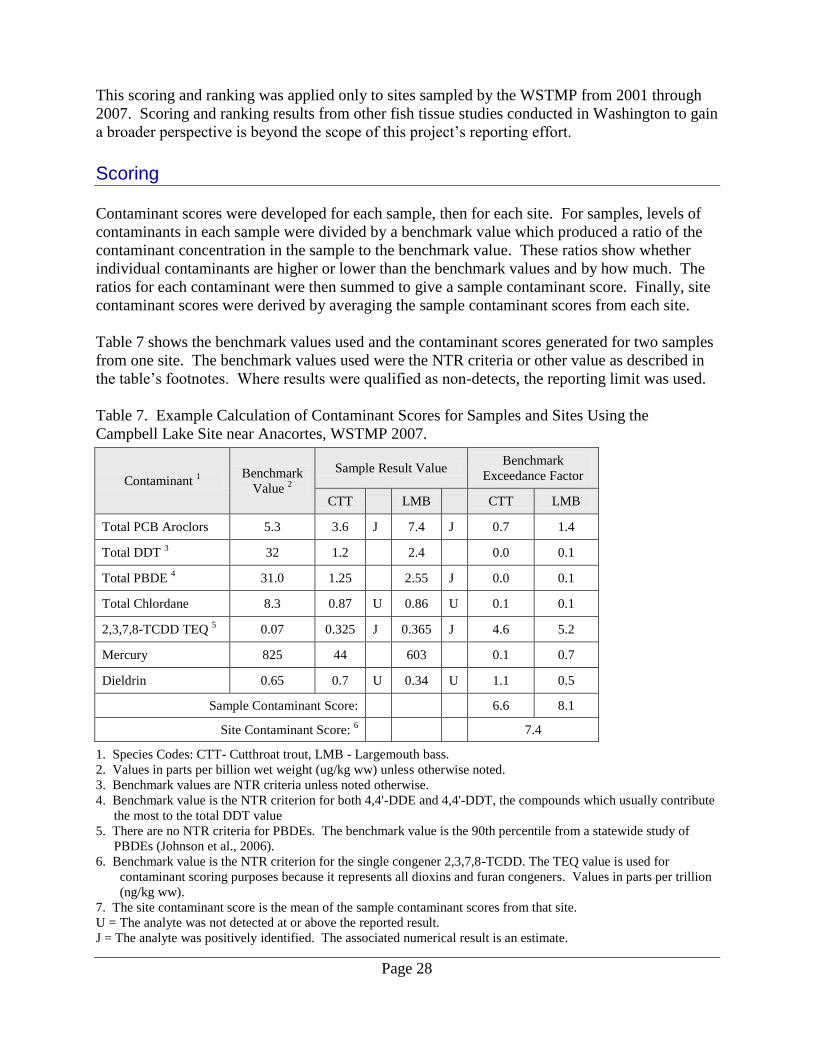
Contaminant scores were developed for each sample, then for each site. For samples, levels of
contaminants in each sample were divided by a benchmark value which produced a ratio of the
contaminant concentration in the sample to the benchmark value. These ratios show whether
individual contaminants are higher or lower than the benchmark values and by how much. The
ratios for each contaminant were then summed to give a sample contaminant score. Finally, site
contaminant scores were derived by averaging the sample contaminant scores from each site.
Table 7 shows the benchmark values used and the contaminant scores generated for two samples
from one site. The benchmark values used were the NTR criteria or other value as described in
the table’s footnotes. Where results were qualified as non-detects, the reporting limit was used.
Table 7. Example Calculation of Contaminant Scores for Samples and Sites Using the
Campbell Lake Site near Anacortes, WSTMP 2007.
Contaminant 1
Benchmark
Value 2
Sample Result Value Benchmark
Exceedance Factor
CTT
LMB
CTT LMB
Total PCB Aroclors 5.3 3.6 J 7.4 J 0.7 1.4
Total DDT 3 32 1.2
2.4
0.0 0.1
Total PBDE 4 31.0 1.25
2.55 J 0.0 0.1
Total Chlordane 8.3 0.87 U 0.86 U 0.1 0.1
2,3,7,8-TCDD TEQ 5 0.07 0.325 J 0.365 J 4.6 5.2
Mercury 825 44
603
0.1 0.7
Dieldrin 0.65 0.7 U 0.34 U 1.1 0.5
Sample Contaminant Score:
6.6 8.1
Site Contaminant Score: 6 7.4
1. Species Codes: CTT- Cutthroat trout, LMB - Largemouth bass.
2. Values in parts per billion wet weight (ug/kg ww) unless otherwise noted.
3. Benchmark values are NTR criteria unless noted otherwise.
4. Benchmark value is the NTR criterion for both 4,4'-DDE and 4,4'-DDT, the compounds which usually contribute
the most to the total DDT value
5. There are no NTR criteria for PBDEs. The benchmark value is the 90th percentile from a statewide study of
PBDEs (Johnson et al., 2006).
6. Benchmark value is the NTR criterion for the single congener 2,3,7,8-TCDD. The TEQ value is used for
contaminant scoring purposes because it represents all dioxins and furan congeners. Values in parts per trillion
(ng/kg ww).
7. The site contaminant score is the mean of the sample contaminant scores from that site.
U = The analyte was not detected at or above the reported result.
J = The analyte was positively identified. The associated numerical result is an estimate.
Page 29
For site contaminant scoring, sample results for some areas were consolidated to represent one
site. For example, sample results from Lake Washington were associated with three areas (north,
south, and entire lake) so samples from these areas were combined to represent Lake Washington
as a single site. Similarly, samples from four areas along the Spokane River between river miles
64 and 85 were combined to represent the Spokane River as a single site. Other consolidations
were for sites on the Wenatchee and Palouse Rivers.
Overall, the 2007 sample contaminant scores were in the lower range of all scores from the 2001
through 2007 samples. The lowest contaminant scores for 2007 were for Cushman Lake
rainbow trout (1.0) and Big Lake yellow perch (1.0). These samples did not exceed any
benchmark values. The highest contaminant scores were for Samish Lake northern pikeminnow
(17.1) and Sullivan Lake brown trout (17.8) where benchmark values were exceeded for three of
the seven key contaminants.
The median score for all 2007 samples was 3.5. As in previous years, PCBs and 2,3,7,8-TCDD
TEQ contributed most to these scores. For example, the Samish Lake northern pikeminnow
sample had a 2,3,7,8-TCDD TEQ level which exceeded the benchmark value of 0.07 ng/kg by a
factor of 13, accounting for about 75% of that sample’s contaminant score of 17.1. The PCB
level in this same sample accounted for nearly 14% of the contaminant score.
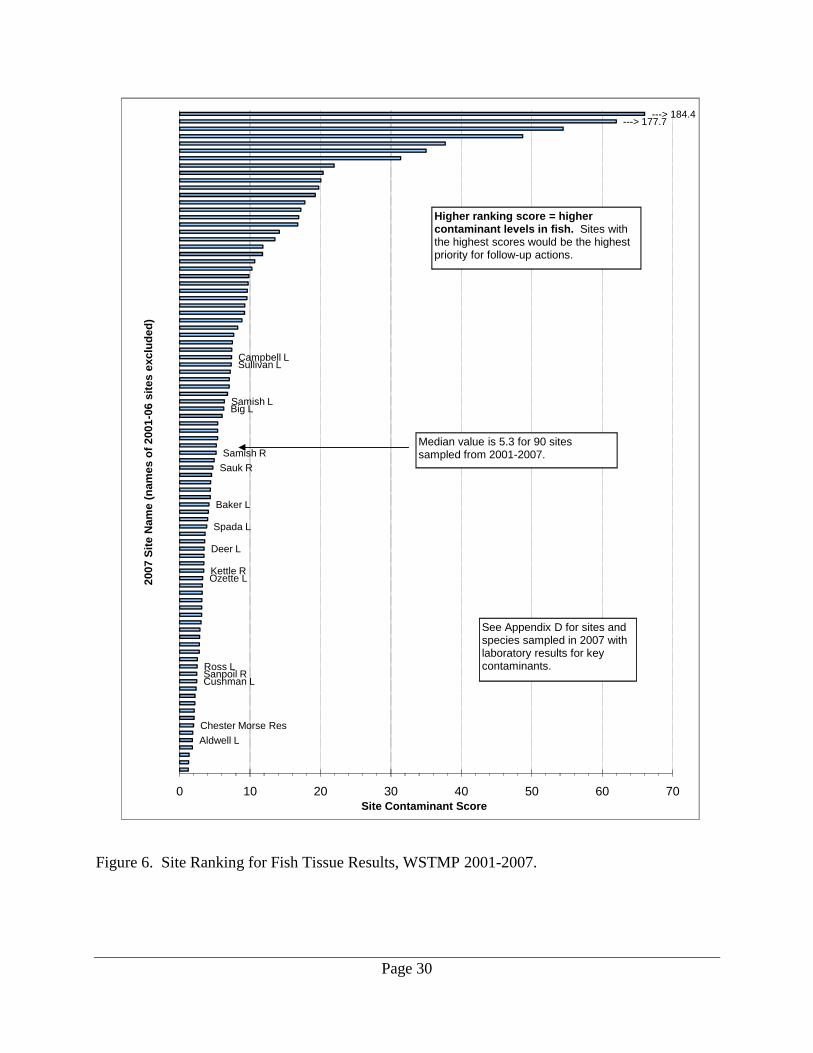
Ranking
Site contaminant scores were ranked from high to low to show the relative amount of
contamination in fish from sampled sites. Figure 6 shows site contaminant scores for the
2001-2007 results with the 2007 sites identified. Site contaminant scores ranged from 1.8
(Aldwell Lake) to 7.4 (Campbell Lake) with the median score being 3.7. Thirteen of the 16 sites
had at least one sample that exceeded NTR criteria as described earlier and shown in Table 6.
Overall, the 2007 site contaminant scores were in the lower half of the ranking for all 2004-2006
sites except for Campbell, Sullivan, Samish, and Big Lakes. These four sites ranked in the
55th
to 63rd
percentile of all sites sampled from 2001-2007. The species from these four sites that
had higher levels of contamination included cutthroat trout, largemouth bass, brown trout, and
northern pikeminnow. These four sites were near urbanized areas or had older fish that were
sampled.
The site ranking presented here was done using PCDD/F data in scoring, although only about
half of the samples were analyzed for PCDD/Fs. Sites were also scored without using PCDD/F
data to see how much scores would change. The scores for 90% of all sites changed by no more
than 5 points when PCDD/F data were excluded which is a minor effect on overall scores. While
the effect on ranking was more pronounced, the general pattern of ranking for the majority of
sites changed little.
Page 30
Median Site CS is 5.3 (between 1 and 2 scores between above Samish R towards Big L)
Average Site CS is 12.5 (between 18th and 19th from highest)
Median value is 5.3 for 90 sites sampled from 2001-2007
See Appendix D for sites and species sampled in 2007 with laboratory results for key contaminants.
Aldwell L
Chester Morse Res
Cushman LSanpoil RRoss L
Ozette LKettle R
Deer L
Spada L
Baker L
Sauk R
Samish R
Big LSamish L
Sullivan LCampbell L
---> 177.7---> 184.4
0 10 20 30 40 50 60 70
Aldwell L
Chester Morse Res
Cushman L
Ross L
Ozette L
Deer L
Baker L
Samish L
Campbell L
---> 177.7
Site Contaminant Score
2007 S
ite N
am
e (
nam
es o
f 2001
-06 s
ites e
xclu
ded
)
Higher ranking score = higher contaminant levels in fish. Sites with the highest scores would be the highest priority for follow-up actions.
Median value is 5.3 for 90 sites sampled from 2001-2007.
See Appendix D for sites and species sampled in 2007 with laboratory results for key contaminants.
Figure 6. Site Ranking for Fish Tissue Results, WSTMP 2001-2007.
Conclusions and Recommendations
Conclusions
During 2007, PCBs, dioxin/furans, chlorinated pesticides, PBDE flame retardants, and mercury
were frequently detected in 35 samples of fish from 16 lakes and rivers across Washington State.
A total of 10 of the 35 samples, from six of the 16 lakes, did not meet Washington State water
quality standards for contaminants in fish tissue. Total PCBs and 2,3,7,8-TCDD accounted for
most of these exceedances. Other contaminants exceeding water quality standards were mercury
and hexachlorobenzene.
Overall, the 2007 site contaminant scores ranked in the lower half of all sites sampled between
2001 and 2007 for the WSTMP except for Campbell, Sullivan, Samish, and Big Lakes. These
four sites ranked in the 55th
to 63rd
percentile of all sites sampled from 2001-2007. These four
sites were near urbanized areas or had older and larger fish that were sampled.
Levels of mercury and 2,3,7,8-TCDD TEQ in the 2007 samples has a wide spread of values
which was representative of all sample results from 2001-2007. Northern pikeminnow from
Lake Ozette had the highest level of mercury found at WSTMP sites since 2001. Levels of PCBs
and PBDEs in the 2007 samples were in the low to median range of all WSTMP samples since
2001.
Bull trout from Ross Lake were sampled in 2007, representing the first known case of this
species being analyzed for contaminants in Washington. Contaminant levels in this bull trout
sample were generally low except for mercury, which was among the highest level found in trout
species collected thus far in Washington.
Recommendations
Because the WSTMP is a screening-level assessment only, the Washington State Department of
Health, local health jurisdictions, and affected tribes should evaluate the need for more detailed
assessment of risks to human health from the consumption of contaminated fish. The initial
focus should be on the six sites where contaminant levels did not meet the NTR criteria
(Category 5 sites in Table 6).
Ecology should determine what follow-up actions to take for the most contaminated sites
identified in 2007: Campbell, Sullivan, Samish, and Big Lakes. Levels of PCBs and TCDD in
fish from these sites were the main chemicals of concern.
Ecology should review the tissue data from the 13 lakes and rivers listed in Table 6 for
placement of these sites in Categories 5 and 2 of Washington State’s 303(d) assessment. Other
results from this 2007 sampling effort should be reviewed and the remaining three lakes placed
in Categories 1 and 3 of the 303(d) assessment.

Page 32
This page is purposely left blank
Page 33
References
ATSDR, 1994. Toxicological Profile for Chlordane. Agency for Toxic Substances and Disease
Registry, Atlanta, GA. U.S. Department of Health and Human Services, Public Health Service.
www.atsdr.cdc.gov/toxprofiles/tp31.html.
ATSDR, 1999. Toxicological Profile for Mercury. Agency for Toxic Substances and Disease
Registry, Atlanta, GA. U.S. Department of Health and Human Services, Public Health Service.
www.atsdr.cdc.gov/toxprofiles/tp46.html
ATSDR, 2000. Toxicological Profile for Polychlorinated Biphenyls (PCBs). Agency
for Toxic Substances and Disease Registry, Atlanta, GA. U.S. Department of Health and Human
Services, Public Health Service. www.atsdr.cdc.gov/toxprofiles/tp17.html
ATSDR, 2006. Dioxins. ToxFAQs™: Chemical Agent Briefing Sheets (CABS). Agency for
Toxic Substances and Disease Registry, Atlanta, GA: U.S. Department of Health and Human
Services, Public Health Service. www.atsdr.cdc.gov/cabs/dioxins/index.html
Bloom, N., 1995. Considerations in the analysis of water and fish for mercury. In National
Forum on Mercury in Fish: Proceedings. U.S. Environmental Protection Agency, Office of
Water, Washington D.C. EPA Publication 823-R-95-002.
Ecology, 2006. Water Quality Program Policy 1-11: Assessment of Water Quality for the
Clean Water Act Sections 303(d) and 305(b) Integrated Report. September 6, 2006. Water
Quality Program, Washington State Department of Ecology, Olympia, WA.
http://www.ecy.wa.gov/programs/wq/303d/wqp01-11-ch1Final2006.pdf
Ecology and DOH, 2003. Washington State Mercury Chemical Action Plan. Washington
State Department of Ecology and Washington State Department of Health, Olympia, WA.
Ecology Publication No. 03-03-001. www.ecy.wa.gov/biblio/0303001.html
Ecology and DOH, 2005. Washington State Polybrominated Diphenyl Ether (PBDE) Chemical
Action Plan: Final Plan. Washington State Department of Ecology and Washington State
Department of Health, Olympia, WA. Ecology Publication No. 05-07-048.
www.ecy.wa.gov/biblio/0507048.html
EPA, 1980. Ambient Water Quality Criteria Documents. U.S. Environmental Protection
Agency, Office of Water, Washington, D.C. Various EPA publication numbers.
www.epa.gov/waterscience/criteria/library/ambientwqc/index.html
EPA, 2000. Guidance for Assessing Chemical Contaminant Data for Use in Fish Advisories -
Volume 1: Field Sampling and Analysis, Third Edition. U.S. Environmental Protection Agency,
Office of Water, Washington, D.C. Publication No. EPA-823-B-00-007.
www.epa.gov/ost/fishadvice/volume1/
Page 34
EPA, 2001. Water Quality Criterion for the Protection of Human Health: Methylmercury.
U.S. Environmental Protection Agency, Office of Science and Technology, Washington, D.C.
Publication No. EPA-823-R-01-001.
EPA, 2002. National Recommended Water Quality Criteria: 2002. U.S. Environmental
Protection Agency, Office of Science and Technology, Washington, D.C. Publication No.
EPA-823-R-02-047.
EPA, 2003. Revised National Recommended Water Quality Criteria for the Protection of
Human Health. U.S. Environmental Protection Agency, Washington, D.C.
www.epa.gov/waterscience/criteria/humanhealth/15table-fs.htm
EPA, 2007. Mercury. U.S. Environmental Protection Agency, Washington, D.C.
www.epa.gov/pesticides/ Accessed February 2007.
EPA, 2008. Substance Registry System.
http://iaspub.epa.gov/sor_internet/registry/substreg/home/overview/home.do Accessed
September 2008.
Fischnaller, S., P. Anderson, and D. Norton, 2003. Mercury in Edible Fish Tissue and Sediments
from Selected Lakes and Rivers of Washington State. Washington State Department of Ecology,
Olympia, WA. Publication No. 03-03-026. www.ecy.wa.gov/biblio/0303026.html
Furl, C. and C. Meredith, 2008. Measuring Mercury Trends in Freshwater Fish in Washington
State: 2007 Sampling Results. Washington State Department of Ecology, Olympia, WA.
Publication No. 08-03-027. www.ecy.wa.gov/biblio/0803027.html
Johnson, A., 2008. Quality Assurance Project Plan: PCB and Dioxin Levels in Resident Fish
from Washington Background Lakes and Rivers. Washington State Department of Ecology,
Olympia, WA. Publication Number 08-03-102. www.ecy.wa.gov/biblio/0803102.html
Johnson, A. and D. Norton, 1990. 1989 Lakes and Reservoir Water Quality Assessment
Program: Survey of Chemical Contaminants in Ten Washington Lakes. Washington State
Department of Ecology, Olympia, WA. Publication Number 90-e35.
www.ecy.wa.gov/biblio/90e35.html
Johnson, A., K. Seiders, C. Deligeannis, K. Kinney, P. Sandvik, B. Era-Miller, and D. Alkire,
2006. PBDEs Flame Retardants in Washington Rivers and Lakes: Concentrations in Fish
and Water, 2005-06. Washington State Department of Ecology, Olympia, WA.
Publication No. 06-03-027. www.ecy.wa.gov/biblio/0603027.html
McBride, D., 2006. Personal communication. Overview of Health’s and Ecology’s approach
to fish tissue evaluation. March 16, 2006. Washington State Department of Health, Olympia,
WA.
Page 35
Sandvik, P., 2006. Standard Operating Procedures for Resecting Finfish Whole Body, Body
Parts or Tissue Samples, Version 1.0. Washington State Department of Ecology, Olympia, WA.
SOP Number EAP007.
http://www.ecy.wa.gov/programs/eap/qa/docs/ECY_EAP_SOP_007ResectingFinfishWholeBod
yPartsTissueSamples.pdf
Seiders, K., 2003. Washington State Toxics Monitoring Program: Toxic Contaminants in Fish
Tissue and Surface Water in Freshwater Environments, 2001. Washington State Department of
Ecology, Olympia, WA. Publication No. 03-03-012. www.ecy.wa.gov/biblio/0303012.html
Seiders, K. and B. Yake, 2002. Washington State Toxics Monitoring Program: Exploratory
Monitoring of Toxic Contaminants in Edible Fish Tissue and Freshwater Environments of
Washington State. Quality Assurance Project Plan. Washington State Department of Ecology,
Olympia, WA. Publication No. 02-03-065. www.ecy.wa.gov/biblio/0203065.html
Seiders, K., C. Deligeannis, and P. Sandvik, 2007. Washington State Toxics Monitoring
Program: Contaminants in Fish Tissue from Freshwater Environments in 2004 and 2005.
Washington State Department of Ecology, Olympia, WA. Publication No. 07-03-024.
www.ecy.wa.gov/biblio/0703024.html
Van den Berg, M., L. Birnbaum, A. Bosveld et al., 1998. Toxic equivalency factors (TEFs) for
PCBs, PCDDs, PCDFs, for humans and wildlife. Environmental Health Perspectives, 106 (12):
775-792.
Previous reports in this series
Seiders, K., C. Deligeannis, and P. Sandvik, 2008. Washington State Toxics Monitoring
Program: Contaminants in Fish Tissue from Freshwater Environments, 2006. Washington State
Department of Ecology, Olympia, WA. Publication No. 08-03-002.
www.ecy.wa.gov/biblio/0803002.html
Seiders, K., C. Deligeannis, and P. Sandvik, 2007. Washington State Toxics Monitoring
Program: Contaminants in Fish Tissue from Freshwater Environments in 2004 and 2005.
Washington State Department of Ecology, Olympia, WA. Publication No. 07-03-024.
www.ecy.wa.gov/biblio/0703024.html
Seiders, K., C. Deligeannis, and K. Kinney, 2006. Washington State Toxics Monitoring
Program: Toxic Contaminants in Fish Tissue and Surface Water in Freshwater Environments,
2003. Washington State Department of Ecology, Olympia, WA. Publication No. 06-03-019.
www.ecy.wa.gov/biblio/0603019.html
Seiders, K. and K. Kinney, 2004. Washington State Toxics Monitoring Program: Toxic
Contaminants in Fish Tissue and Surface Water in Freshwater Environments, 2002.
Washington State Department of Ecology, Olympia, WA. Publication No. 04-03-040.
www.ecy.wa.gov/biblio/0403040.html
Page 36
Seiders, K., 2003. Washington State Toxics Monitoring Program: Toxic Contaminants in Fish
Tissue and Surface Water in Freshwater Environments, 2001. Washington State Department of
Ecology, Olympia, WA. Publication No. 03-03-012. www.ecy.wa.gov/biblio/0303012.html
Page 37
Appendices

Page 38
This page is purposely left blank

Page 39
Appendix A. Site and Species Sampled: WSTMP 2007
Table A-1. Site and Species Sampled: WSTMP 2007.
Sample Site County WRIA Species Sampled Longitude Latitude WBID
Aldwell Lake Clallam 18 BKT, RBT -123.5730 48.0781 WA-18-9010
Baker Lake Whatcom 4 CTT, RBT -121.6555 48.7218 WA-04-9010
Big Lake Skagit 3 CTT, LMB, YP -122.2300 48.3792 WA-03-9020
Campbell Lake Skagit 3 CTT, LMB -122.6211 48.4390 WA-03-9040
Chester Morse
Reservoir King 8 RBT -121.6979 47.3861 WA-08-9060
Cushman Lake Mason 16 KOK, MWF, RBT,
SS -123.2240 47.4501 WA-16-9010
Deer Lake Stevens 59 LMB, RBT -117.5881 48.1116 WA-59-9040
Kettle River Ferry 60 RBT -118.5996 48.8884 WA-60-1020
Ozette Lake Clallam 20 NPM -124.6338 48.0967 WA-20-9040
Ross Lake Whatcom 4 BLT, RBT, RSS -121.0417 48.8333 WA-04-9180
Samish Lake Whatcom 3 CTT, LMB, NPM,
PEA, YP -122.3861 48.6666 WA-03-9160
Samish River Skagit 3 CTT, MWF -122.2900 48.5571 WA-03-2010
Sanpoil River Ferry 52 BKT, RBT -118.7477 48.5442 WA-52-1010
Sauk River Skagit 4 MWF -121.3881 48.0987 WA-04-1080
Spada Lake Snohomish 7 CTT -121.6500 47.9700 WA-07-9710
Sullivan Lake Pend Oreille 62 BNT, CTT, MWF,
RBT -117.2900 48.8000 WA-62-9190
WRIA = Water Resource Inventory Area.
WBID = Ecology's Water Body Identification Number (WBID).
Latitude and longitude coordinates datum is NAD 83 HARN.
Species Codes: BLT = Bull trout, BNT = Brown trout, BKT = Brook trout, CTT = Cutthroat trout, KOK = Kokanee
salmon, LMB = Largemouth bass, MWF = Mountain whitefish, NPM = Northern pikeminnow, PEA = Peamouth,
RBT = Rainbow trout, RSS = Redside shiner (whole fish), SS = Salish sucker, YP = Yellow perch
Page 40
Appendix B. Data Quality Assessment Data quality was assessed by reviewing laboratory case narratives, analytical results, and field
replicate data. Case narratives were written by Manchester Laboratory (MEL) analytical staff.
The narratives described the condition of samples upon receipt, analytical quality control (QC)
procedures, and data qualifications. Quality control (QC) procedures included analysis of
method blanks, calibration and control standards, matrix spikes, matrix spike duplicates,
surrogate recoveries, and laboratory and field duplicates.
Lab duplicate samples were created at the analytical lab by splitting the tissue sample that was
sent to them and analyzing each split. Field duplicate samples consisted of two samples that
were created from different, yet similar-sized, fish of the same species collected from the same
site at the same time. Individual fish were assigned to the two composite samples randomly.
Overall, the 2007 data met most quality control (QC) criteria defined by MEL and the Quality
Assurance Project Plan. Initial analyses for PCB aroclors did not meet reporting limits, so
samples were re-analyzed and met the desired reporting limits. No other data were rejected or
re-analyzed. Some data were qualified due to challenges encountered in analyses. Estimates of
precision appear typical for samples of fish tissue. All results are usable for this project as
qualified. Table B1 summarizes results from quality control (QC) and quality assurance
procedures while data quality for selected parameters is discussed below.
Standard Reference Materials (SRM) were analyzed to help evaluate analytical accuracy. The
SRM 1946 (Lake Superior Fish Tissue) from the National Institute of Standards and Technology
was analyzed for mercury, chlorinated pesticides, and PCB Aroclors. The SRM “Carp-2” (carp
from Saginaw Bay, Lake Huron) obtained from the National Research Council of Canada was
analyzed for dioxin/furan analysis and PCB congeners. Discussion of SRM results are included
below.
Mercury, Chlorinated Pesticides, PCB Aroclors, PBDEs, and Lipids
Results of two SRM analyses for mercury were 7% and 12%, which are outside the 95%
confidence interval (CI) of 2.1%. Results of SRM analyses for 16 chlorinated pesticides had 22
results (71%) outside the SRM’s approximate 95% CI. These 22 results ranged from 2% - 276%
outside the CI. The remaining 9 results (29%) were within the desired CI. Overall, results
suggest that analytical accuracy was moderate to poor for chlorinated pesticides while accuracy
for mercury was moderate.
Several target analytes were detected in two sets of lab and field duplicate samples. Estimates of
precision based on the small number of results met requirements of the lab and the QA Project
Plan, so analytical and sampling precision was deemed adequate.
Estimates of precision for lipids analyses were mixed. Two sets of lab duplicates by MEL had
very good precision with relative percent differences (RPDs) of 1% and 4%. Three sets of lab
duplicates by the contract lab Pace Analytical, Inc. were poor with RPDs of 68% to 148%. Inter-
Page 41
laboratory analyses of 28 samples yielded poor to moderate precision in most cases, with RPDs
ranging from 5% to 130%. Differences in analytical methods and the extraction solvents used by
the different labs likely contribute to poor inter-laboratory precision.
PCB Congeners
Fourteen results for seven PCB congeners were within the SRM’s approximate 95% CI of the
certified or reference values. These results suggest good analytical accuracy at concentrations in
the SRM. Concentrations of the PCB congener in the SRM are one to two orders of magnitude
greater than concentrations found in the 2007 fish tissue samples.
Precision as determined through two lab and one field duplicate analyses was moderate to good.
Interestingly, where field and lab duplicate analyses were done on the same samples, the field
duplicate had better precision than the lab duplicate.
Dioxins and Furans
Sample analysis experienced difficulties that resulted in heavily qualified data with reporting
limits being higher than desired. Technical issues with the initial and second extractions led to
the use of results from the two different extractions. Some results were also affected by
interfering substances or target analytes being found in blanks. Detections that were above the
Limit of Detection (LOD) yet below the Estimated Quantitation Limit (EQL) were qualified as
estimates at request of the project manager: 56% of results fell within this range while 43% of
results were qualified as not detected. Less than 2% of results had no qualifiers attached.
Precision as determined through lab and field duplicate analyses was generally poor due to so
many result values reported between the EQL and LOD. Table B1 summarizes other QA/QC
characteristics of this data set.
Fifteen results for nine dioxins/furans had seven results that were slightly outside the SRM’s
approximate 95% CI. The remaining eight results were within the desired CI. Three results
were qualified as not-detected yet two of the reporting limits for these were outside the 95% CI
of the SRM. Overall, results suggest moderate to good analytical accuracy for dioxin/furans at
the concentrations in the SRM. This SRM has concentrations that are one or more orders of
magnitude greater than concentrations typically found in the 2007 samples. An SRM with lower
concentrations would be more useful in evaluating analytical accuracy at levels typically found
in fish tissue samples from Washington.
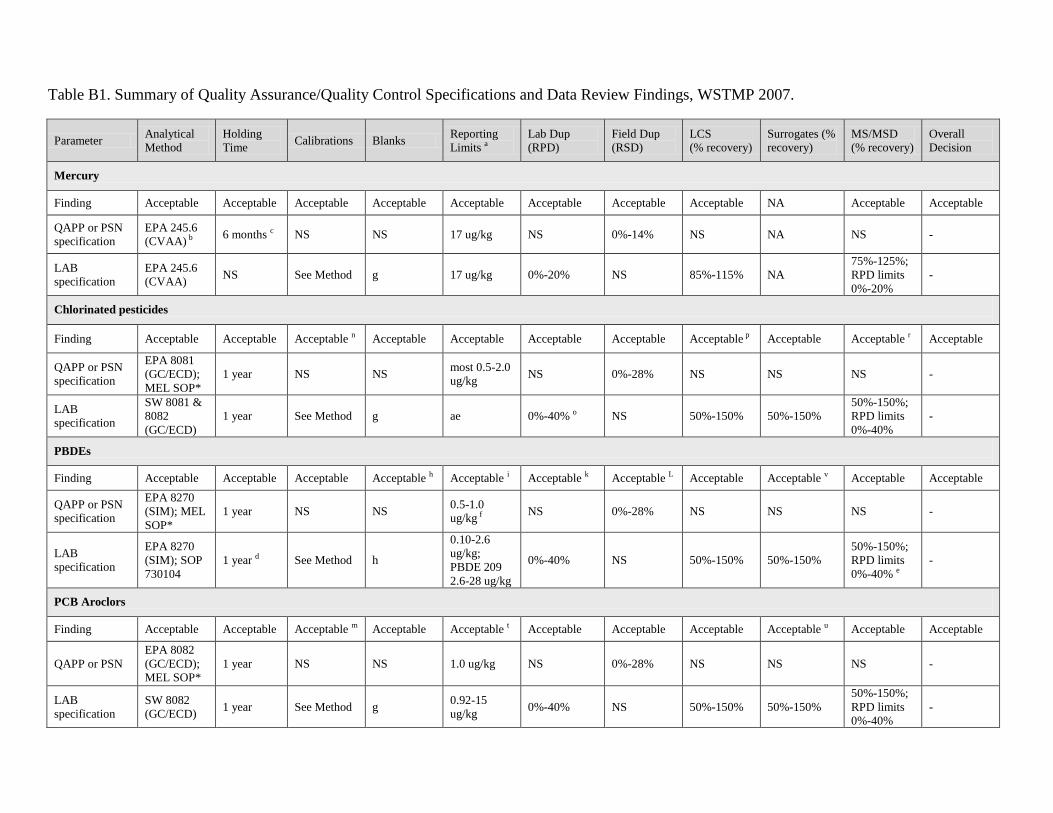
Table B1. Summary of Quality Assurance/Quality Control Specifications and Data Review Findings, WSTMP 2007.
Parameter Analytical
Method
Holding
Time Calibrations Blanks
Reporting
Limits a
Lab Dup
(RPD)
Field Dup
(RSD)
LCS
(% recovery)
Surrogates (%
recovery)
MS/MSD
(% recovery)
Overall
Decision
Mercury
Finding Acceptable Acceptable Acceptable Acceptable Acceptable Acceptable Acceptable Acceptable NA Acceptable Acceptable
QAPP or PSN
specification
EPA 245.6
(CVAA) b 6 months c NS NS 17 ug/kg NS 0%-14% NS NA NS -
LAB
specification
EPA 245.6
(CVAA) NS See Method g 17 ug/kg 0%-20% NS 85%-115% NA
75%-125%;
RPD limits
0%-20%
-
Chlorinated pesticides
Finding Acceptable Acceptable Acceptable n Acceptable Acceptable Acceptable Acceptable Acceptable p Acceptable Acceptable r Acceptable
QAPP or PSN
specification
EPA 8081
(GC/ECD);
MEL SOP*
1 year NS NS most 0.5-2.0
ug/kg NS 0%-28% NS NS NS -
LAB
specification
SW 8081 &
8082
(GC/ECD)
1 year See Method g ae 0%-40% o NS 50%-150% 50%-150%
50%-150%;
RPD limits
0%-40%
-
PBDEs
Finding Acceptable Acceptable Acceptable Acceptable h Acceptable i Acceptable k Acceptable L Acceptable Acceptable v Acceptable Acceptable
QAPP or PSN
specification
EPA 8270
(SIM); MEL
SOP*
1 year NS NS 0.5-1.0
ug/kg f NS 0%-28% NS NS NS -
LAB
specification
EPA 8270
(SIM); SOP
730104
1 year d See Method h
0.10-2.6
ug/kg;
PBDE 209
2.6-28 ug/kg
0%-40% NS 50%-150% 50%-150%
50%-150%;
RPD limits
0%-40% e
-
PCB Aroclors
Finding Acceptable Acceptable Acceptable m Acceptable Acceptable t Acceptable Acceptable Acceptable Acceptable u Acceptable Acceptable
QAPP or PSN
EPA 8082
(GC/ECD);
MEL SOP*
1 year NS NS 1.0 ug/kg NS 0%-28% NS NS NS -
LAB
specification
SW 8082
(GC/ECD) 1 year See Method g
0.92-15
ug/kg 0%-40% NS 50%-150% 50%-150%
50%-150%;
RPD limits
0%-40%
-
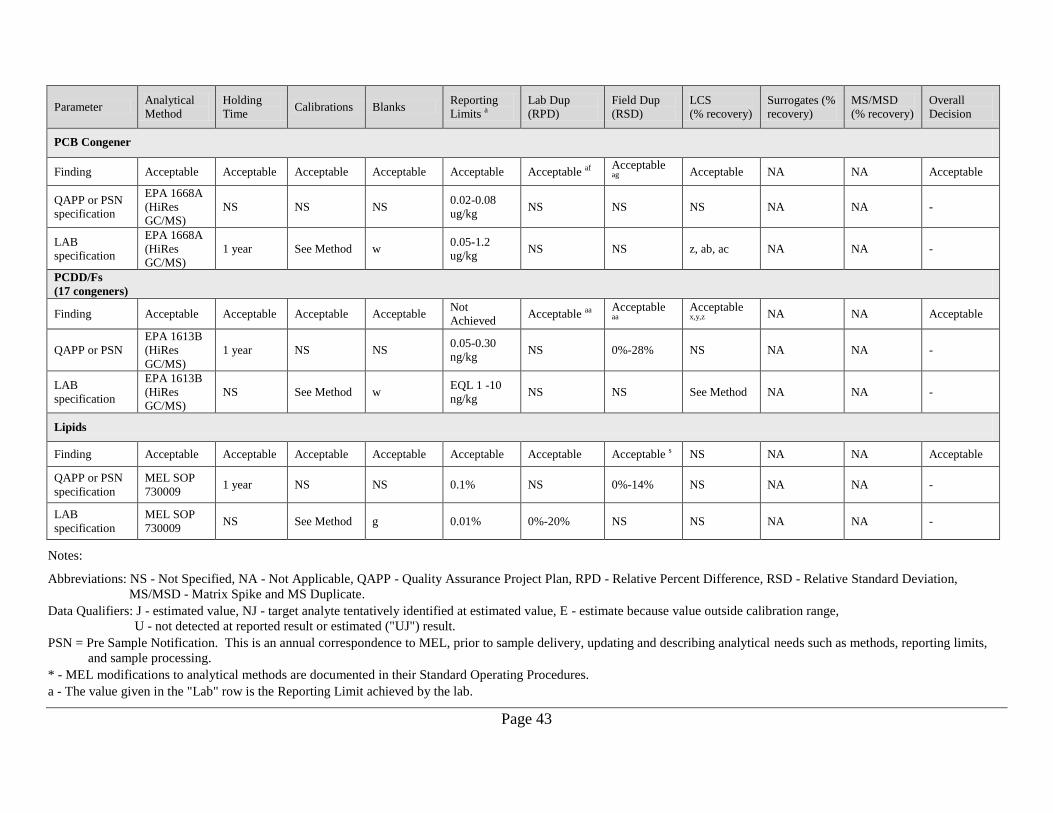
Page 43
Parameter Analytical
Method
Holding
Time Calibrations Blanks
Reporting
Limits a
Lab Dup
(RPD)
Field Dup
(RSD)
LCS
(% recovery)
Surrogates (%
recovery)
MS/MSD
(% recovery)
Overall
Decision
PCB Congener
Finding Acceptable Acceptable Acceptable Acceptable Acceptable Acceptable af Acceptable ag
Acceptable NA NA Acceptable
QAPP or PSN
specification
EPA 1668A
(HiRes
GC/MS)
NS NS NS 0.02-0.08
ug/kg NS NS NS NA NA -
LAB
specification
EPA 1668A
(HiRes
GC/MS)
1 year See Method w 0.05-1.2
ug/kg NS NS z, ab, ac NA NA -
PCDD/Fs
(17 congeners)
Finding Acceptable Acceptable Acceptable Acceptable Not
Achieved Acceptable aa
Acceptable aa
Acceptable x,y,z
NA NA Acceptable
QAPP or PSN
EPA 1613B
(HiRes
GC/MS)
1 year NS NS 0.05-0.30
ng/kg NS 0%-28% NS NA NA -
LAB
specification
EPA 1613B
(HiRes
GC/MS)
NS See Method w EQL 1 -10
ng/kg NS NS See Method NA NA -
Lipids
Finding Acceptable Acceptable Acceptable Acceptable Acceptable Acceptable Acceptable s NS NA NA Acceptable
QAPP or PSN
specification
MEL SOP
730009 1 year NS NS 0.1% NS 0%-14% NS NA NA -
LAB
specification
MEL SOP
730009 NS See Method g 0.01% 0%-20% NS NS NA NA -
Notes:
Abbreviations: NS - Not Specified, NA - Not Applicable, QAPP - Quality Assurance Project Plan, RPD - Relative Percent Difference, RSD - Relative Standard Deviation,
MS/MSD - Matrix Spike and MS Duplicate.
Data Qualifiers: J - estimated value, NJ - target analyte tentatively identified at estimated value, E - estimate because value outside calibration range,
U - not detected at reported result or estimated ("UJ") result.
PSN = Pre Sample Notification. This is an annual correspondence to MEL, prior to sample delivery, updating and describing analytical needs such as methods, reporting limits,
and sample processing.
* - MEL modifications to analytical methods are documented in their Standard Operating Procedures.
a - The value given in the "Lab" row is the Reporting Limit achieved by the lab.
Page 44
b - EPA method 245.5 was used for WSTMP samples from 2001-2003. EPA Method 245.6 has been used once 2004.
c - Holding time of six months was established for WSTMP fish tissue in 2002, after determining that 28-day holding time for tissue was unnecessary.
d - Case narrative: All samples remained frozen until thawed. All samples were analyzed within the required 40 days from extraction.
e - 1 of 26 matrix spike recoveries was above acceptance limits, PBDE 209.
f - Reporting limit for all congeners except PBDE 209 which is 1-6 ug/kg.
g - Case narrative: No analytically significant levels of analyte were detected in the method blanks associated with these samples.
h - No target compounds were detected in method blanks, with the exception of PBDE 209.
i - PBDE 209 in twelve of thirty nine samples had reporting limits of 8-28 ug/kg due to blank contamination.
k - All RPD limits within range except PBDE 49 in one sample which had RPD of 49%.
L - 5 of 6 within QAPP RSD limits. PBDE 49 in one sample had an RSD of 54%.
m - All PCB aroclors were recovered within acceptance limits of 85%-115%, with the exception of PCB aroclor 1016.
n - The following analytes did not meet acceptable independent calibration verifications (ICV) and/or continuing calibration verification (CCV) standards. These samples have
been qualified as estimated reporting limits "UJ", or estimated detection limits "J" in some samples. Toxaphene, Hexachlorobenzene, Endosulfan Sulfate, Methoxychlor, Endrin
Aldehyde, and Endosulfan II.
o - All RPDs were within acceptable limits except sample 07494518 technical chlordane with RPD of 51%, these results were qualified as "J".
p - Recoveries all within acceptable limits. Because of interference from other analytes, the recovery of DDMU was not calculated, "NC".
r - All matrix spike recoveries were within acceptable limits except chlorpyrifos and endrin aldehyde. Due to interference from analytes DDMU was not calculated "NC".
s - RSDs achieved were 30-33%. High RSDs likely due to differences in fish used for field duplicate samples. Lab dup RSDs were very good, less than or equal to 3%.
t - Reporting limits not met with initial analysis. Samples were reanalyzed and RLs were met.
u - All surrogate recoveries were within acceptable limits, except 8 of the 39 samples which were qualified "J" due to high recoveries (153%-166%) - Aroclor 1254 & 1260.
v - All surrogate recoveries were within acceptable limits except one sample which had a low recovery (30%). All results for this sample were qualified as estimates.
w - Few target analytes detected in blanks resulting in some qualifications of data
x - QC limits for Internal Standard recoveries not met in some cases leading to re-analyses of some samples and qualification of some data.
y - On-going Precision and Recovery (OPR) and LCS within limits with few exceptions resulting in qualification of some data and possible bias.
z - Ion Abundance Ratios and Retention Time Criteria were met with few exceptions resulting in qualification of some data.
aa - RPDs achieved for lab dups were 14%-171%. RSDs achieved for field dups were 25-130%. Results were heavily qualified due to being below range of calibration; poor
precision is reasonable.
ab - OPR recoveries within QC limits of 50-100%. Labeled compound recoveries within QC limits of 30-140%.
ac - Internal Standard recoveries within QC limits of 25-150% except several above 150% which were qualified "J" as estimates.
ad - Values for "Lab" reflect the reporting limits that were actually achieved.
ae - Most analytes 0.34-3.4 ug/kg; Chlordane (technical) 3.4-7.8 ug/kg ; Hexachlorobenzene 3.4-4.6 ug/kg; Toxaphene 3.7-20 ug/kg.
af - RPDs achieved were 3%-117%.
ag - RSDs achieved were 0%-59%.
Appendix C. Data Evaluation by Ecology and DOH
Several state and federal agencies collect and evaluate fish tissue data in Washington State.
These include the Washington State Departments of Ecology, Health (DOH), and Fish and
Wildlife; the U.S. Environmental Protection Agency; and the U.S. Geological Survey. Tissue
data are evaluated differently by these agencies because their mandates and roles are varied.
These multiple evaluations often lead to confusion and misunderstanding among agencies and
the public on how fish tissue data are used and interpreted. Adding to potential confusion are the
numerous criteria or screening values derived to provide guidance for determining the risks of
consuming contaminated fish and protecting public health.
Most fish tissue contaminant data from Washington fish, regardless of who conducted the study,
make their way to DOH for evaluation regarding the safety of consuming fish. Appendix E has
information about health benefits of eating fish and potential risks from consuming contaminated
fish. The following is an overview of how Ecology and DOH evaluate fish tissue data to meet
different needs.
For the WSTMP and many other Ecology studies, fish tissue data are evaluated primarily to
determine if (1) Washington State water quality standards are being met, and (2) potential risks
to human health from consuming contaminated fish warrant further study and/or development of
a fish consumption advisory. Ecology’s role is to determine whether water quality standards are
met and to begin the process to correct problems where standards are not met. DOH and local
health departments are responsible for developing fish consumption advisories in Washington.
There is some overlap in these evaluations because the water quality standards that fish tissue
data are compared to were developed for the protection of human health.
Washington State Water Quality Standards
Washington’s water quality standards criteria for toxic contaminants were issued to the state in
EPA’s 1992 National Toxics Rule (NTR) (40CFR131.36). The human health-based NTR
criteria are designed to minimize the risk of effects occurring to humans from chronic (lifetime)
exposure to substances through the ingestion of drinking water and consumption of fish obtained
from surface waters. The NTR criteria, if met, will generally ensure that public health concerns
do not arise, and that fish advisories are not needed.
The NTR criteria are thresholds that, when exceeded, may lead to regulatory action. When water
quality criteria are not met (exceeded), the federal Clean Water Act requires that the waterbody
be put on a list and that a water cleanup plan be developed for the pollutant causing the problem.
This list is known as the 303(d) list, and the water cleanup plan results from a Total Maximum
Daily Load (TMDL) study and public involvement process. Ecology uses the TMDL program to
control sources of the particular pollutant in order to bring the waterbody back into compliance
with the water quality standards.

Page 46
Risk Management Decisions
While DOH supports Ecology’s use of the NTR criteria for identifying problems and controlling
pollutant sources so that water quality will meet standards, DOH does not use the NTR criteria to
establish fish consumption advisories (McBride, 2006). DOH uses an approach similar to that in
EPA’s Guidance for Assessing Chemical Contaminant Data for use in Fish Advisories Vol. 1-4
for assessing mercury, PCBs, and other contaminants (EPA, 2000). These guidance documents
provide a framework from which states can evaluate fish tissue data to develop fish consumption
advisories. The framework is based on sound science and established procedures in risk
assessment, risk management, and risk communication. Neither the NTR criteria, nor the
screening values found in the EPA guidance documents above, incorporate the varied risk
management decisions essential to developing fish consumption advisories.
Risk Assessment involves calculating allowable meal limits based on known fish
contaminant concentrations. These calculations are conducted for both non-cancer and
cancer endpoints using the appropriate Reference Dose (RfD) or Cancer Slope Factor (CSF),
if available. These initial calculations are the starting point for evaluating contaminant data
to determine whether a fish advisory is warranted. Additionally, known or estimated fish
consumption rates help determine the potential magnitude of exposure and highlight the
sensitive groups or populations that may exist due to elevated consumption rates.
Risk Management includes (but is not limited to) consideration of contaminant background
concentrations, reduction in contaminant concentrations through preparation and cooking
techniques, known health benefits from fish consumption, contaminant concentrations or
health risks associated with replacement foods, and cultural importance of fish. Other
considerations are the possible health endpoints associated with a contaminant, the strength
or weaknesses of the supporting toxicological or sampling data, and whether effects are
transient or irreversible.
Risk Communication is the outreach component of the fish advisory. The interpretation of
the data from the risk assessment and risk management components drives how and when the
fish advisory recommendations are issued to the public, dependent on whether the message is
targeted toward a sensitive group or a population or the general public. DOH’s dual
objective is (1) how best to provide guidance to the public to increase fish consumption of
fish low in contaminants to gain the benefits of eating fish, while (2) steering the public away
from fish that have high levels of health-damaging contaminants.
Appendix D. Summary of Results, WSTMP 2007
Table D1. Summary of Fish Tissue Sample Results, WSTMP 2007.
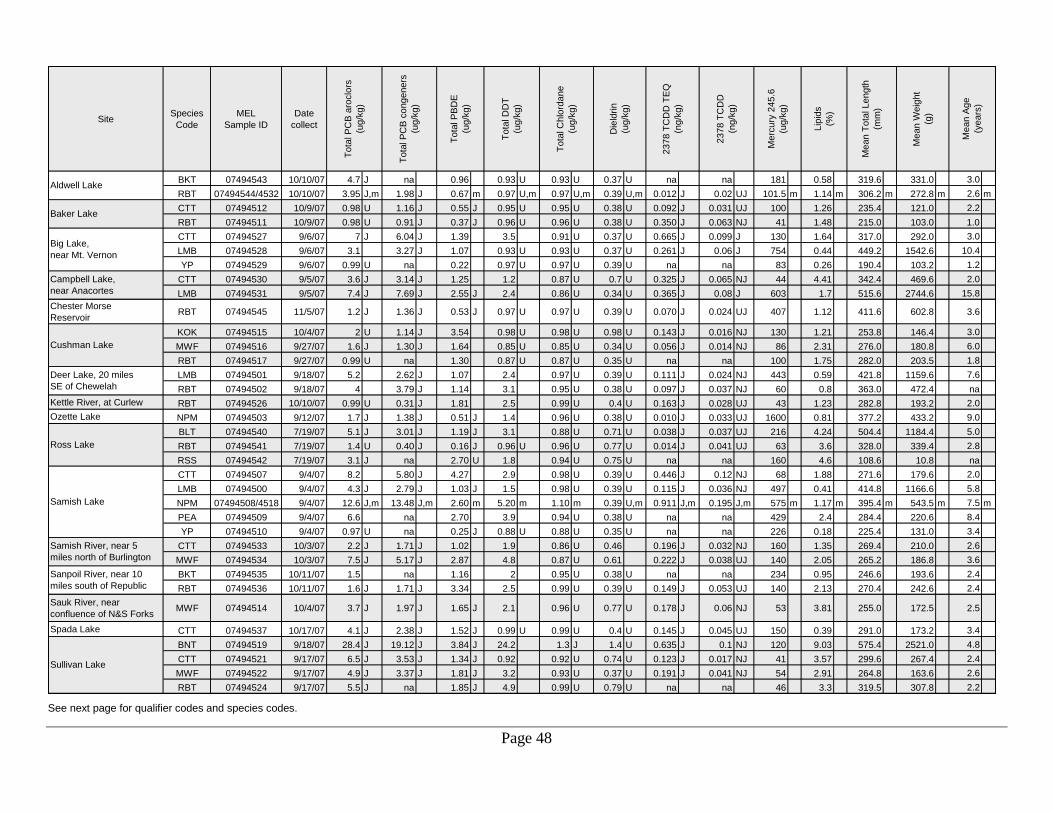
Page 48
SiteSpecies
Code
MEL
Sample ID
Date
collect
BKT 07494543 10/10/07 4.7 J na 0.96 0.93 U 0.93 U 0.37 U na na 181 0.58 319.6 331.0 3.0
RBT 07494544/4532 10/10/07 3.95 J,m 1.98 J 0.67 m 0.97 U,m 0.97 U,m 0.39 U,m 0.012 J 0.02 UJ 101.5 m 1.14 m 306.2 m 272.8 m 2.6 m
CTT 07494512 10/9/07 0.98 U 1.16 J 0.55 J 0.95 U 0.95 U 0.38 U 0.092 J 0.031 UJ 100 1.26 235.4 121.0 2.2
RBT 07494511 10/9/07 0.98 U 0.91 J 0.37 J 0.96 U 0.96 U 0.38 U 0.350 J 0.063 NJ 41 1.48 215.0 103.0 1.0
CTT 07494527 9/6/07 7 J 6.04 J 1.39 3.5 0.91 U 0.37 U 0.665 J 0.099 J 130 1.64 317.0 292.0 3.0
LMB 07494528 9/6/07 3.1 3.27 J 1.07 0.93 U 0.93 U 0.37 U 0.261 J 0.06 J 754 0.44 449.2 1542.6 10.4
YP 07494529 9/6/07 0.99 U na 0.22 0.97 U 0.97 U 0.39 U na na 83 0.26 190.4 103.2 1.2
CTT 07494530 9/5/07 3.6 J 3.14 J 1.25 1.2 0.87 U 0.7 U 0.325 J 0.065 NJ 44 4.41 342.4 469.6 2.0
LMB 07494531 9/5/07 7.4 J 7.69 J 2.55 J 2.4 0.86 U 0.34 U 0.365 J 0.08 J 603 1.7 515.6 2744.6 15.8
Chester Morse
ReservoirRBT 07494545 11/5/07 1.2 J 1.36 J 0.53 J 0.97 U 0.97 U 0.39 U 0.070 J 0.024 UJ 407 1.12 411.6 602.8 3.6
KOK 07494515 10/4/07 2 U 1.14 J 3.54 0.98 U 0.98 U 0.98 U 0.143 J 0.016 NJ 130 1.21 253.8 146.4 3.0
MWF 07494516 9/27/07 1.6 J 1.30 J 1.64 0.85 U 0.85 U 0.34 U 0.056 J 0.014 NJ 86 2.31 276.0 180.8 6.0
RBT 07494517 9/27/07 0.99 U na 1.30 0.87 U 0.87 U 0.35 U na na 100 1.75 282.0 203.5 1.8
LMB 07494501 9/18/07 5.2 2.62 J 1.07 2.4 0.97 U 0.39 U 0.111 J 0.024 NJ 443 0.59 421.8 1159.6 7.6
RBT 07494502 9/18/07 4 3.79 J 1.14 3.1 0.95 U 0.38 U 0.097 J 0.037 NJ 60 0.8 363.0 472.4 na
Kettle River, at Curlew RBT 07494526 10/10/07 0.99 U 0.31 J 1.81 2.5 0.99 U 0.4 U 0.163 J 0.028 UJ 43 1.23 282.8 193.2 2.0
Ozette Lake NPM 07494503 9/12/07 1.7 J 1.38 J 0.51 J 1.4 0.96 U 0.38 U 0.010 J 0.033 UJ 1600 0.81 377.2 433.2 9.0
BLT 07494540 7/19/07 5.1 J 3.01 J 1.19 J 3.1 0.88 U 0.71 U 0.038 J 0.037 UJ 216 4.24 504.4 1184.4 5.0
RBT 07494541 7/19/07 1.4 U 0.40 J 0.16 J 0.96 U 0.96 U 0.77 U 0.014 J 0.041 UJ 63 3.6 328.0 339.4 2.8
RSS 07494542 7/19/07 3.1 J na 2.70 U 1.8 0.94 U 0.75 U na na 160 4.6 108.6 10.8 na
CTT 07494507 9/4/07 8.2 5.80 J 4.27 2.9 0.98 U 0.39 U 0.446 J 0.12 NJ 68 1.88 271.6 179.6 2.0
LMB 07494500 9/4/07 4.3 J 2.79 J 1.03 J 1.5 0.98 U 0.39 U 0.115 J 0.036 NJ 497 0.41 414.8 1166.6 5.8
NPM 07494508/4518 9/4/07 12.6 J,m 13.48 J,m 2.60 m 5.20 m 1.10 m 0.39 U,m 0.911 J,m 0.195 J,m 575 m 1.17 m 395.4 m 543.5 m 7.5 m
PEA 07494509 9/4/07 6.6 na 2.70 3.9 0.94 U 0.38 U na na 429 2.4 284.4 220.6 8.4
YP 07494510 9/4/07 0.97 U na 0.25 J 0.88 U 0.88 U 0.35 U na na 226 0.18 225.4 131.0 3.4
CTT 07494533 10/3/07 2.2 J 1.71 J 1.02 1.9 0.86 U 0.46 0.196 J 0.032 NJ 160 1.35 269.4 210.0 2.6
MWF 07494534 10/3/07 7.5 J 5.17 J 2.87 4.8 0.87 U 0.61 0.222 J 0.038 UJ 140 2.05 265.2 186.8 3.6
BKT 07494535 10/11/07 1.5 na 1.16 2 0.95 U 0.38 U na na 234 0.95 246.6 193.6 2.4
RBT 07494536 10/11/07 1.6 J 1.71 J 3.34 2.5 0.99 U 0.39 U 0.149 J 0.053 UJ 140 2.13 270.4 242.6 2.4
Sauk River, near
confluence of N&S ForksMWF 07494514 10/4/07 3.7 J 1.97 J 1.65 J 2.1 0.96 U 0.77 U 0.178 J 0.06 NJ 53 3.81 255.0 172.5 2.5
Spada Lake CTT 07494537 10/17/07 4.1 J 2.38 J 1.52 J 0.99 U 0.99 U 0.4 U 0.145 J 0.045 UJ 150 0.39 291.0 173.2 3.4
BNT 07494519 9/18/07 28.4 J 19.12 J 3.84 J 24.2 1.3 J 1.4 U 0.635 J 0.1 NJ 120 9.03 575.4 2521.0 4.8
CTT 07494521 9/17/07 6.5 J 3.53 J 1.34 J 0.92 0.92 U 0.74 U 0.123 J 0.017 NJ 41 3.57 299.6 267.4 2.4
MWF 07494522 9/17/07 4.9 J 3.37 J 1.81 J 3.2 0.93 U 0.37 U 0.191 J 0.041 NJ 54 2.91 264.8 163.6 2.6
RBT 07494524 9/17/07 5.5 J na 1.85 J 4.9 0.99 U 0.79 U na na 46 3.3 319.5 307.8 2.2
Sullivan Lake
Tota
l P
CB
aro
clo
rs
(ug/k
g)
Tota
l P
CB
congeners
(ug/k
g)
Tota
l P
BD
E
(ug/k
g)
Tota
l D
DT
(ug/k
g)
Deer Lake, 20 miles
SE of Chewelah
Ross Lake
Samish Lake
Samish River, near 5
miles north of Burlington
Sanpoil River, near 10
miles south of Republic
Aldwell Lake
Baker Lake
Big Lake,
near Mt. Vernon
Campbell Lake,
near Anacortes
Cushman Lake
Lip
ids
(%)
Mean T
ota
l Length
(mm
)
Mean W
eig
ht
(g)
Mean A
ge
(years
)
Tota
l C
hlo
rdane
(ug/k
g)
Die
ldrin
(ug/k
g)
2378 T
CD
D T
EQ
(ng/k
g)
2378 T
CD
D
(ng/k
g)
Merc
ury
245.6
(ug/k
g)
See next page for qualifier codes and species codes.
Page 49
Qualifier Codes
J The analyte was positively identified. The associated numerical result is an estimate.
NJ The analyte was tentatively identified and the associated numerical value represents an approximate concentration.
U The analyte was not detected at or above the reported value.
UJ The analyte was not detected at or above the reported estimated result.
m Mean value from analyses of field duplicates where two results are available. Where both values were non-detect, the highest value was usually used. Where one duplicate was qualified as a non-detect (U, UJ), the reported value was used in determining the mean value. For some duplicate pairs, analysis for PCDD/Fs and PCB congeners was done on only one of the samples; these results are not qualified with an "m".
Species Codes
BKT Brook trout
BLT Bull trout
BNT Brown trout
CTT Cutthroat trout,
KOK Kokanee salmon
LMB Largemouth bass
MWF Mountain whitefish
NPM Northern pikeminnow
PEA Peamouth
RBT Rainbow trout
RSS Redside shiner (whole fish)
YP Yellow perch.
Appendix E. Health Information about Fish
Fish is good food. Trying to balance the health benefits of fish with concerns about contaminant
levels can be challenging, yet information is available to help consumers make healthy choices.
Contaminants are found in most foods, and choosing fish wisely can be an excellent health
choice. The key is to make smart decisions and choose fish that are low in mercury, PCBs, and
other contaminants.
The American Heart Association recommends eating fish twice a week because fish are a great
source of protein, vitamins, and nutrients. Fish are loaded with omega-3 fatty acids, which
provide protection from heart disease and are great “brain food” for adults and children.
A valuable source of information about eating fish is the Washington State Department of Health
(DOH) website:
www.doh.wa.gov/ehp/oehas/fish/default.htm
o Advice for women and children who eat fish.
o Waterbody-specific fish consumption advisories in Washington.
o How contaminants (mercury, PCBs, PBDEs, DDTs) get into fish.
o How you can help reduce contaminants.
www.doh.wa.gov/ehp/oehas/fish/fishchart.htm
o Healthy fish eating guide.
o Checklist to reduce contaminant exposure including the proper way to fillet and
prepare fish meals.
o Health benefits of fish/recipes.
www.doh.wa.gov/ehp/oehas/fish/advisoriesmap.htm
o Fish and shellfish consumption advisories.
The U.S. Environmental Protection Agency (EPA) and the Food and Drug Administration (FDA)
also provide information on health benefits of fish:
www.epa.gov/waterscience/fish/
o What you need to know about mercury - 10 frequently asked questions.
www.cfsan.fda.gov/seafood1.html
o Seafood information and resources.
Page 51
Appendix F. Glossary, Acronyms, and Abbreviations
303(d) list: Section 303(d) of the federal Clean Water Act requires Washington State to
periodically prepare a list of all surface waters in the state for which designated uses of the water
– such as for drinking, recreation, aquatic habitat, and industrial use – are impaired by pollutants.
These are water quality limited estuaries, lakes, and streams that fall short of state surface water
quality standards, and are not expected to improve within the next two years.
Total Maximum Daily Load (TMDL): A distribution of a substance in a waterbody designed
to protect it from exceeding water quality standards. A TMDL is equal to the sum of all of the
following: (1) individual wasteload allocations for point sources, (2) the load allocations for
nonpoint sources, (3) the contribution of natural sources, and (4) a Margin of Safety to allow for
uncertainty in the wasteload determination. A reserve for future growth is also generally
provided.
DDMU 1-chloro-2,2-bis(p-chlorophenyl)ethane
DDD dichloro-diphenyl-dichloroethane
DDE dichloro-diphenyl-trichloroethylene
DDT dichloro-diphenyl-trichloroethane
DOH Washington State Department of Health
Ecology Washington State Department of Ecology
EIM Environmental Information Management
EPA Environmental Protection Agency
MEL Manchester Environmental Laboratory
ng/kg nanograms per kilogram, or parts per trillion (ppt)
NTR National Toxics Rule
mg/kg milligrams per kilogram, or parts per million (ppm)
PBDE polybrominated diphenyl ethers
PBT persistent, bioaccumulative, and toxic substance
PCB polychlorinated biphenyls
PCDD/Fs polychlorinated dibenzo-p-dioxins and -furans
SOP Standard operating procedures
SRM Standard reference materials
SV Screening values
TCDD tetrachlorodibenzo-p-dioxin
TEF Toxicity Equivalent Factor
TEQ Toxic Equivalent
ug/kg micrograms per kilogram, or parts per billion (ppb)
WAC Washington Administrative Code
WDFW Washington Department of Fish and Wildlife
WSTMP Washington State Toxics Monitoring Program
ww wet weight