Embed Size (px)
Citation preview

Washington State Treasurer 2013 Annual Report
James L. mcIntIre, state treasurer

Washington State Treasurer
2013Annual Report
July 1, 2012 through June 30, 2013
Office of the State TreasurerLegislative Building
PO Box 40200Olympia, Washington 98504-0200
(360) 902-9000or
TTY: 7-1-1FAX: (360) 902-9037
Internet Homepagehttp://tre.wa.gov
In accordance with theAmericans with Disabilities Act,
this publication will be made availablein alternate formats upon request.
Publication Editor: Tammy Risner

HISTORICAL LISTINGTerritorial Treasurers Terms of Office
William Cock 1854 to 1858David L. Phillips 1858 to 1859
W. Rutledge 1859 to 1860Uzal G. Warbass 1861 to 1862David L. Phillips 1862 to 1863
William Cock 1863 to 1864Daniel R. Bigelow 1864 to 1865Benjamin Harned 1865 to 1866
James Tilton 1866 to 1867Benjamin Harned 1867 to 1870
Hill Harmon 1871 to 1872J.H. Munson 1872 to 1873
Elisha T. Gunn 1873 to 1874Francis Tarbell 1875 to 1880Thomas N. Ford 1881 to 1886
William McMicken 1886 to 1888Frank I. Blodgett 1888 to Statehood
State Treasurers County Terms of OfficeAddison A. Lindsley Clark 1889 to 1893
Ozro A. Bowen Wahkiakum 1893 to 1897C.W. Young Whitman 1897 to 1901
C.W. Maynard Lewis 1901 to 1905George G. Mills Thurston 1905 to 1909John G. Lewis Grays Harbor 1909 to 1913Edward Meath Pierce 1913 to 1917W.W. Sherman Thurston 1917 to 1921
Clifford L. Babcock Clallam 1921 to 1925W.G. Potts King 1925 to 1929
Charles W. Hinton Thurston 1929 to 1933Otto A. Case King 1933 to 1937
Phil H. Gallagher Spokane 1937 to 1941Otto A. Case King 1941 to 1945
Russell H. Fluent King 1945 to 1949Tom Martin Thurston 1949 to 1953
Charles R. Maybury Thurston 1953 to 1957Tom Martin Thurston 1957 to 1965
Robert S. O’Brien Grant 1965 to 1989Daniel K Grimm Pierce 1989 to 1997
Michael J. Murphy Thurston 1997 to 2009James L. McIntire King 2009 to present
WASHINGTON TREASURERS
WASHINGTON
TREASURERS
Washington Treasurers
i
TABLE OF CONTENTS
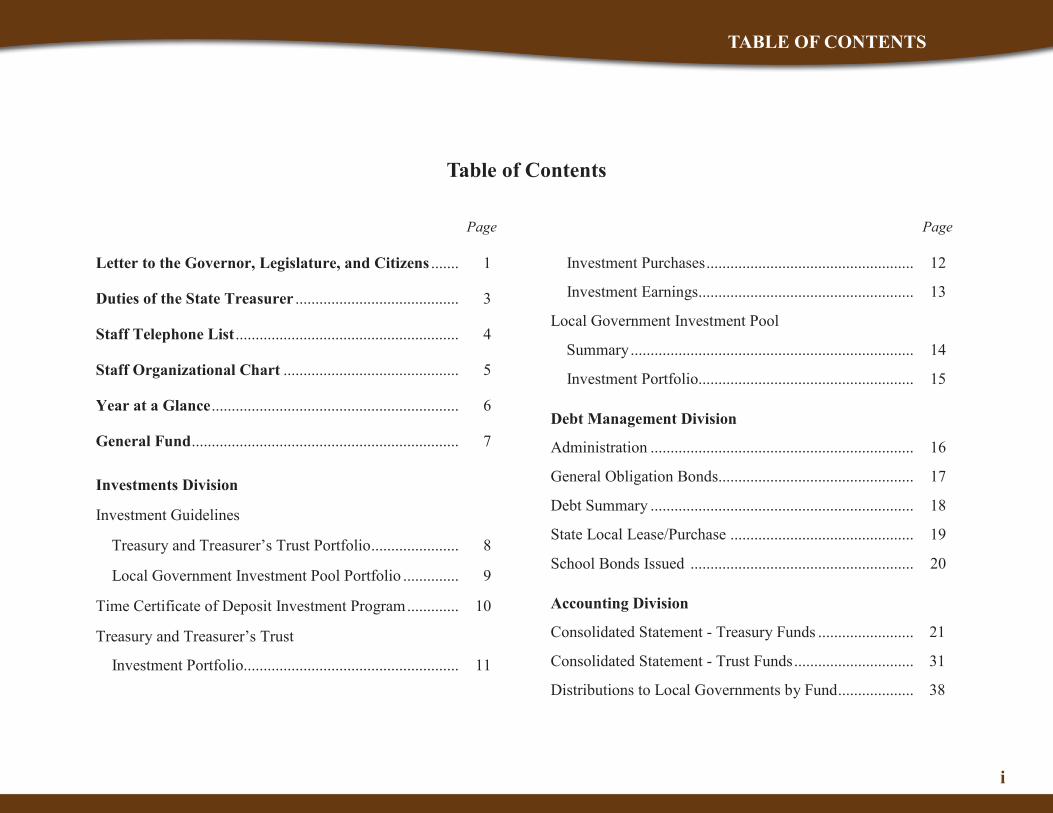
Table of Contents
Page Page
Letter to the Governor, Legislature, and Citizens ....... 1
Duties of the State Treasurer ......................................... 3
Staff Telephone List ........................................................ 4
Staff Organizational Chart ............................................ 5
Year at a Glance.............................................................. 6
General Fund................................................................... 7
Investments Division
Investment Guidelines
Treasury and Treasurer’s Trust Portfolio...................... 8
Local Government Investment Pool Portfolio .............. 9
Time Certificate of Deposit Investment Program............. 10
Treasury and Treasurer’s Trust
Investment Portfolio...................................................... 11
Investment Purchases.................................................... 12
Investment Earnings...................................................... 13
Local Government Investment Pool
Summary....................................................................... 14
Investment Portfolio...................................................... 15
Debt Management Division
Administration .................................................................. 16
General Obligation Bonds................................................. 17
Debt Summary .................................................................. 18
State Local Lease/Purchase .............................................. 19
School Bonds Issued ........................................................ 20
Accounting Division
Consolidated Statement - Treasury Funds ........................ 21
Consolidated Statement - Trust Funds.............................. 31
Distributions to Local Governments by Fund................... 38


1
To: The Honorable Jay Inslee, GovernorThe Honorable Members of the Washington State Legislature andThe Citizens of Washington
I am pleased to report that in Fiscal Year (FY) 2013, the Office of the State Treasurer maintained its strong performance in core functions including investments, cash management and debt issuance to provide the safety, liquidity and capital financing needs for the state.
Debt Management: The state took advantage of historically low interest rates during FY 2013 with three refunding sales. On a present value basis, savings over the life of the refunded bonds total $160.2 million. Debt service savings in the 2011-13 biennium total $6.4 million and savings in the 2013-15 biennium total $11.9 million.
Cash Management and Warrant Processing: Cash Managementadministered a cash flow of over $514.6 billion in FY 2013. Over 7.1million electronic transfers totaling over $51.4 billion were processed through the automated clearinghouse (ACH). In FY 2013, over 2.2 million warrants representing over $5 billion were processed with 86 warrant forgery claims filed.
State Treasury and Treasurer’s Trust: All accounts in the state treasury and in custody of the treasurer are pooled for investment purposes. The captive nature of these accounts allows the portfolio to be invested in longer maturities, where over time they will achieve a higher yield. The continued low targeted fed funds rate led to a decline in earnings from $34 to $30million. The rate fell from 1.14% to 0.76% with an average balance $3.9billion.
Local Government Investment Pool (LGIP) Our pool continues to be a sound investment option for local governments and institutions of higher education. The Fed kept the targeted funds rate at between 0.00% and 0.25% during the fiscal year in an effort to spur economic growth. The FY 2013 average yield of 0.18% was higher than the 0.14% average for FY 2012. The average balance in the LGIP portfolio during the fiscal year was $9.415 billion.
The combination of higher balances and higher yields resulted in earnings of $18.6 million, an increase of $2.2 million over FY 2012. The LGIP serves 545 participants in 755 accounts. The total portfolio at the end of the fiscal year was $10.633 billion. In FY 2013, the LGIP had a netadministrative charge of 0.871 basis points.
Other highlights of 2013:
School Bond Guarantee Program The School Bond Guarantee Programhas grown steadily since its launch in early 2000. The program authorizes the state to guarantee payment on school district general obligation debtbacked by the full faith and credit of the state. Since 2000, bonds totaling approximately $15.2 billion have been issued by 216 school districts through the School Bond Guarantee Program.
Guaranteed Education Tuition (GET) Since 1998, Washington residents have been saving for college with GET, our state’s 529 prepaid tuition plans. As of the end of FY 2013, 152,079 families have opened GET accounts and 30,484 students have already used their GET accounts to attend colleges and universities nationwide. These accounts are valued at more than $2.2 billion.
Sincerely,
James L. McIntireWashington State Treasurer
JAMES L. McINTIREState Treasurer
State of WashingtonOffice of the Treasurer


3
James L. McIntireWashington State Treasurer
ames L. McIntire was elected in 2008 to become Washington’s twenty-second State Treasurer. The State Treasurer has wide-ranging
responsibilities for management of the state’s financial resources and is a constitutional officer in the executive branch. As State Treasurer, Mr. McIntire is third in line of succession to the Governor, after the Lieutenant Governor and Secretary of State. The Treasurer’s office has a staff of 66 and a 2013-15 biennium budget of $15.0 million.
Primary Duty: Protecting the State’s Financial Resourceshe State Treasurer is responsible for the safety and security of state tax dollars now and in the future. As the state’s chief financial officer, the
treasurer provides banking, investment, and cash management services for state government.
In addition, the State Treasurer:
• Manages cash flow of all major state accounts with deposits, withdrawals and transfers totaling over $514.6 billion last year.
• Invests the state's operating cash in short-term, investments that preserve our ability to access the funds.
• Issues and manages all of the state's debt with bond sales that finance major projects, certificates of participation that help state agencies and local governments purchase equipment, and guaranteeing school bonds.
• Provides guidance for the management of long-term debt and investments as a member of a number of boards and commissions including the State Investment Board.
Boards, Committees, and Commissions
Treasurer McIntire is:
• Chairman of the State Investment Board. The board manages $92.1billion (as of March 31, 2013) in state pension and other trust funds.
• Chairman of the State Finance Committee. The committee, which includes the Governor and Lieutenant Governor as members, ad-ministers all state debt programs and is responsible for state bond sales.
• Chairman of the Public Deposit Protection Commission, which is responsible for protecting public deposits in bank and thrift institutions.
• Secretary of the Housing Finance Commission. The commission issues bonds and tax credits to provide financing for low-to-moderate-income housing.
• One of five members of the Washington Committee on Advanced Tuition Payment, which operates the Guaranteed Education Tuition (GET) program.
J
T
DUTIES OF THE STATE TREASURER

4
Staff Telephone List - Area Code (360)
STAFF TELEPHONE LIST
Cash/Warrant Management
Manager, Sue Penley.......................................902-8914Banking Services Manager, Ryan Pitroff .......902-8917Courier, Charles Sutmiller .............................902-8907ACH & Deposits Manager, Lesa Williams.....902-8911Bankcard Services Coordinator, Tami Taylor....................................................902-8906
Fiscal Analysts, Cindy Doughty ............................................902-8908 Deanna Moore .............................................902-8910 Treena Piepgras ..........................................902-8907 Michael Zehner ...........................................902-8909Warrant Services Manager, Mary Ann Johnson * .....................................902-8985Forgery Collections, Toni Howdeshell * ........902-8986Warrant Inquiry ..............................................902-8994Warrant Redemptions, Donelle Lotton*..........................................902-8988 FAX 902-8945* FAX 664-2292
Accounting and Fiscal Services
Director, Darrel Jensen .................................. 902-8903Agency Accounting, Amy Perry ................................................... 902-8958 Alberta Quinlan.......................................... 902-8952Distribution Accounting, Megan Dietz ................................................ 902-8961 James Porter ............................................... 902-8960Fund Accounting, Linda Lund ................................................. 902-8956 Brenda Taylor............................................. 902-8957Investment Accounting, Cindy Shave ................................................ 902-8953 Dixie Layman.............................................. 902-8959 Fang Xu ....................................................... 902-8955 FAX 586-6890
Public Deposit Protection Commission (PDPC)
Administrator, Nancy Adams ......................... 902-9077 FAX 704-5177
InvestmentsDeputy Treasurer, Doug Extine ...................... 902-9012Investment Officer, Jill Gravatt ..................... 902-9011Senior Portfolio Manager,Jim Rosenkoetter ........................................... 902-9010Portfolio Manager, Shawn Reed..................... 902-9014Assistant Portfolio Analyst, Amanda Scott .... 902-9013LGIP/CD Administrator, Kari Sample ........... 902-9015LGIP Toll Free Number ........................1-800-331-3284 FAX 902-9044
Debt ManagementDeputy Treasurer, Ellen Evans ....................... 902-9007Director, Bond Program, Svein Braseth ......... 902-9025Debt Finance Administrator, Pam Johnson .................................................. 902-9021Debt Administrator, Wendy Kancianich........ 902-9022Debt Finance Administrator, Sue Melvin ....... 902-9027Debt Program Specialist, Kate Manley .......... 902-9028COP Financial Analyst, Shelly Sweeney ........ 902-9005Debt Financial Officer, Wendy Weeks........... 902-9020 FAX 902-9045
Information Systems
Director, Marla Kentfield .............................. 902-8902Applications Services Manager, Jeff Sharp.... 902-8920Administrative Assistant, Kristi Wolgamot ... 902-8935Analyst/Programmers, Joe Connolly................................................ 902-8939 Wilson Defiesta ........................................... 902-8930 Brad Grothaus ............................................ 902-8931 Vicki Harrod ............................................... 902-8936 Vallery Kanar ............................................. 902-8928Technical Services Manager, Patrick Bohlig . 902-8924Data Base Administrator, Jerry Berlin........... 902-8925PC Support, Bill Buck .................................... 902-8982Network Security, Paul Felix.......................... 902-8926Software Technician, Judy Kelly.................... 902-8923Exchange Administrator/Network Support,Jeff Sellick ...................................................... 902-8927 FAX 586-6890
AdministrationState Treasurer, James L. McIntire................ 902-9001Assistant Treasurer, Wolfgang Opitz ............. 902-9002Executive Assistant, Andrew Smith ............... 902-9023Budget and Fiscal Director, Dan Mason......... 902-9090Communications Director, Chris McGann .... 902-9033Legal Counsel, Johnna Craig......................... 902-8912Senior Advisor, Rick Peterson ....................... 902-9019Receptionist, Stacy Pierson ............................ 902-9000Communications Consultant 3,Tammy Risner ............................................... 902-9008Policy Director, Scott Merriman .................. 902-9018Director of Community and External Relations, Gina Stark ...................... 902-9003 FAX 902-9037
Operations DivisionCash/Warrant Management, PDPC
Accounting/Fiscal, Information Systems,
Deputy Treasurer, Shad Pruitt ....................... 902-8904Administrative Assistant/Seizure and Forfeiture, Mary Pheasant ............................ 902-8901Human Resources
Human Resource Manager, Rich Jones ..........902-9004Human Resource Consultant, Joyce Norris ....902-9009 FAX 704-5104

5
STAFF ORGANIZATIONAL CHART

6
YEAR AT A GLANCE
Year at a Glance
InvestmentsTreasury &Treasurer’s Trust PortfolioTotal Investment Purchases ............................................................ $ 188,211,140,491Average Investment Balance 1 ..........................................................$ 3,889,864,230Actual Investment Balance, June 30, 2013 1, 2 ..................................$ 4,752,296,215Portfolio Yield .................................................................................. 0.76%Average Weighted Maturity ............................................................. 502 days
Treasury FundsGeneral Fund Earnings .....................................................................$ (10,195,589)Other Funds’ Earnings ......................................................................$ 37,340,071
Treasurer’s Trust FundsGeneral Fund Earnings .....................................................................$ 913,429Other Funds’ Earnings ......................................................................$ 1,402,973
Local Government Investment Pool PortfolioTotal Investment Purchases ............................................................ $201,464,352,490Total Sales ...................................................................................... $ 21,906,107,830Total Maturities .............................................................................. $ 178,250,863,000Average Investment Balance 1 ..........................................................$ 9,415,254,657Actual Investment Balance, June 30, 2013 1t ....................................$ 10,633,377,244Total Net Income ..............................................................................$ 17,758,410Administrative Expenses ..................................................................$ 820,200Average Monthly Portfolio Yield .................................................... 0.17%Average Weighted Maturity ............................................................. 58 daysLocal Government Deposits .............................................................$ 17,487,171,053Local Government Withdrawals .......................................................$ 15,700,259,153
1 Balance excludes securities lending investments and includes certificates of deposit.2 Balance includes securities purchased but not settled.3. Result of structuring changes now reflects all costs of issuance in principal.
Debt ManagementBond Debt Outstanding, June 30, 2013.............................................$ 18,711,578,920New Bond Proposals Approved by 2013 Legislature........................$ 2,036,000,000Authorized Unissued Debt, June 30, 2013 ........................................$ 6,326,461,778Bonds Sold during FY 2013..............................................................$ 2,729,170,000Bond Debt Service Paid (principal & interest) during FY 2013........$ 1,563,438,108Lease/Purchase Balances Outstanding, June 30, 2013
State Equipment Balances Outstanding.............................................. $ 206,068,955 LOCAL Equipment Balances Outstanding.....................................$ 43,062,739 State Real Property Balances Outstanding .....................................$ 420,718,934 LOCAL Real Property Balances Outstanding................................$ 33,005,538 Amortized Costs of Issuance 3 .......................................................$ 26,302 7/1/13 Fiscal Agent Payment collected 6/1/13 ...............................$ 38,356,330School Bond Guarantee Program,
Guaranteed as of June 30, 2013 ......................................................$ 8,547,541,507
AccountingGeneral Fund Book Balance, June 30, 2013 .....................................$ 178,568,014Total Treasury Funds’ Book Balance, June 30, 2013........................$ 3,717,488,888Total Receipts of Treasury Funds .....................................................$ 51,831,594,696Total Disbursements of Treasury Funds ...........................................$ 51,510,166,152Total Treasurer’s Trust Funds’ Book Balance, June 30, 2013...........$ 956,499,575Total Receipts of Treasurer’s Trust Funds ........................................$ 4,572,209,047Total Disbursements of Treasurer’s Trust Funds ..............................$ 4,555,196,596
Public Deposit Protection CommissionAs of June 30, 2013WA Bank / Thrift Public Depositaries .............................................. 74 WA FDIC Insured Public Deposits ................................................$ 340,335,974 WA Uninsured Public Deposits .................................................... $ 5,032,097,678 Securities Pledged to Uninsured Public Deposits.......................... $ 6,586,937,112 Coverage – Uninsured Public Deposits.......................................... 130.90%WA Credit Union Public Depositaries .............................................. 10 WA NCUA Insured Public Deposits..............................................$ 834,152
7
GENERAL FUND
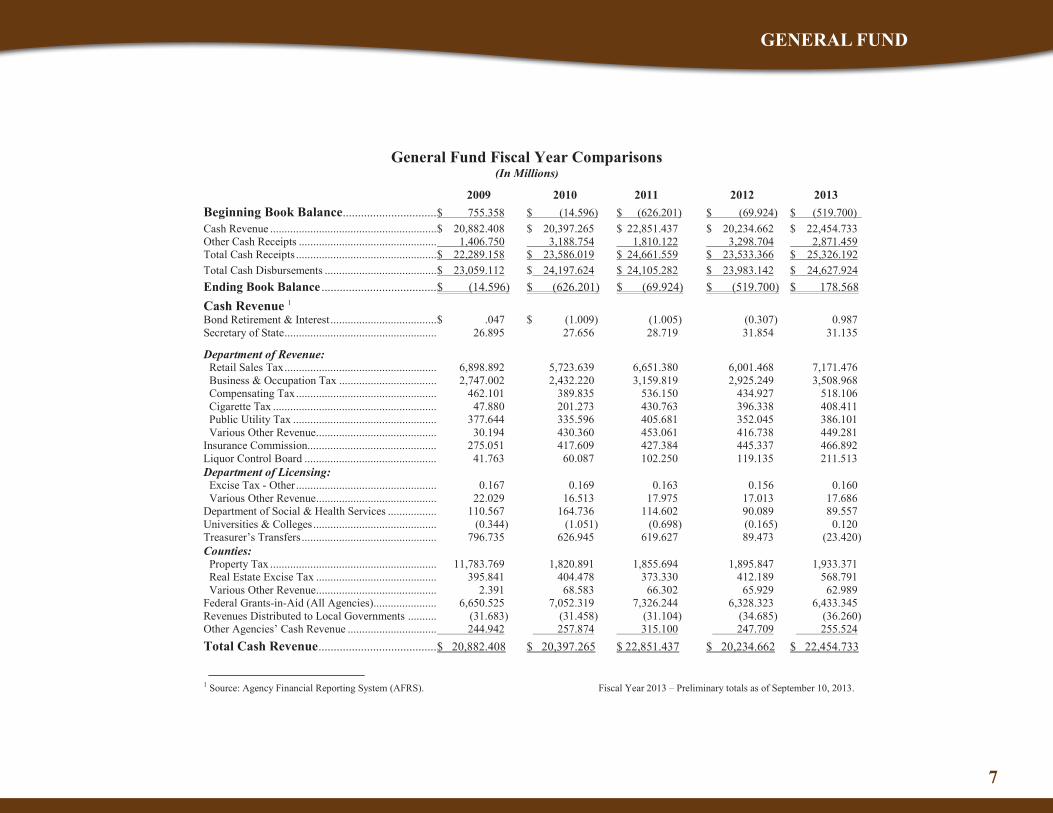
General Fund Fiscal Year Comparisons(In Millions)
2009 2010 2011 2012 2013Beginning Book Balance...............................$ 755.358 $ (14.596) $ (626.201) $ (69.924) $ (519.700)Cash Revenue ..........................................................$ 20,882.408 $ 20,397.265 $ 22,851.437 $ 20,234.662 $ 22,454.733Other Cash Receipts ................................................ 1,406.750 3,188.754 1,810.122 3,298.704 2,871.459Total Cash Receipts .................................................$ 22,289.158 $ 23,586.019 $ 24,661.559 $ 23,533.366 $ 25,326.192Total Cash Disbursements .......................................$ 23,059.112 $ 24,197.624 $ 24,105.282 $ 23,983.142 $ 24,627.924Ending Book Balance ......................................$ (14.596) $ (626.201) $ (69.924) $ (519.700) $ 178.568Cash Revenue 1
Bond Retirement & Interest.....................................$ .047 $ (1.009) (1.005) (0.307) 0.987Secretary of State..................................................... 26.895 27.656 28.719 31.854 31.135
Department of Revenue: Retail Sales Tax..................................................... 6,898.892 5,723.639 6,651.380 6,001.468 7,171.476 Business & Occupation Tax .................................. 2,747.002 2,432.220 3,159.819 2,925.249 3,508.968 Compensating Tax................................................. 462.101 389.835 536.150 434.927 518.106 Cigarette Tax ......................................................... 47.880 201.273 430.763 396.338 408.411 Public Utility Tax .................................................. 377.644 335.596 405.681 352.045 386.101 Various Other Revenue.......................................... 30.194 430.360 453.061 416.738 449.281Insurance Commission............................................. 275.051 417.609 427.384 445.337 466.892Liquor Control Board .............................................. 41.763 60.087 102.250 119.135 211.513Department of Licensing: Excise Tax - Other................................................. 0.167 0.169 0.163 0.156 0.160 Various Other Revenue.......................................... 22.029 16.513 17.975 17.013 17.686Department of Social & Health Services ................. 110.567 164.736 114.602 90.089 89.557Universities & Colleges........................................... (0.344) (1.051) (0.698) (0.165) 0.120Treasurer’s Transfers............................................... 796.735 626.945 619.627 89.473 (23.420)Counties: Property Tax .......................................................... 11,783.769 1,820.891 1,855.694 1,895.847 1,933.371 Real Estate Excise Tax .......................................... 395.841 404.478 373.330 412.189 568.791 Various Other Revenue.......................................... 2.391 68.583 66.302 65.929 62.989Federal Grants-in-Aid (All Agencies)...................... 6,650.525 7,052.319 7,326.244 6,328.323 6,433.345Revenues Distributed to Local Governments .......... (31.683) (31.458) (31.104) (34.685) (36.260)Other Agencies’ Cash Revenue ............................... 244.942 257.874 315.100 247.709 255.524Total Cash Revenue.......................................$ 20,882.408 $ 20,397.265 $ 22,851.437 $ 20,234.662 $ 22,454.733
1 Source: Agency Financial Reporting System (AFRS). Fiscal Year 2013 – Preliminary totals as of September 10, 2013.

8
INVESTMENTS GUIDELINES FOR TREASURY and TREASURER’S TRUST PORTFOLIO
State Treasurer’sInvestment Guidelines for the Treasury and Treasurer’s Trust Portfolio
nvestment of the Treasury and Treasurer’s Trust Portfolio is guided by a policy approved by the State Treasurer and
operates under the standard of a prudent investor. According to this policy:
1. Investments are limited to those authorized by statute. They include:
• U.S. Treasury and agency securities (more precisely, obligations of any government-sponsored corporation eligible for collateral purposes by the Federal Reserve Bank);
• Repurchase agreements; and,
• Certificates of deposit with qualified public depositaries.
2. The Treasury and Treasurer’s Trust Portfolio has been separated into two main portfolios, primarily to manage liquidity risk.
• STIF Portfolio – the main objectives of this portfolio are to meet the daily cash requirements of accounts in the
state treasury and in the custody of the Treasurer, and manage the temporary cash positions of the core portfolio.
• Core Portfolio – this portfolio is comprised of cash that is not reasonably expected to be necessary to meet short- or intermediate-term liquidity needs. Accordingly this cash may be invested further out the yield curve where, over a market cycle, it is expected to provide a higher return than the STIF Portfolio.
3. Investments subject to high price sensitivity or reduced marketability are limited to no more than 15 percent of the portfolio.
4. All security transactions are done on a delivery versus payment basis.
5. All securities are held in the custody of the State Treasurer or the Treasurer's third-party custodian.
I
9
INVESTMENTS GUIDELINES FOR LGIP PORTFOLIO
State Treasurer’sInvestment Guidelines for the Local Government Investment Pool (LGIP) Portfolio
he LGIP invests in a portfolio of securities in a manner generally consistent with Rule 2a-7 money market funds, as
currently recognized by the Securities and Exchange Commission (17CFR.270.2a-7). Rule 2a-7 funds are limited to high quality obligations with limited maximum and average maturities, the effect of which is to minimize both market and credit risk.
Investment activity for the LGIP is guided by an investment policy approved by the State Treasurer and operates under the standard of a prudent investor. According to this policy:
1. Investments are limited to those authorized by statute. They include:
• U.S. Treasury and agency securities (more precisely, ob-ligations of any government-sponsored corporation eligible for collateral purposes by the Federal Reserve Bank);
• Repurchase agreements; and,
• Certificates of deposit with qualified public depositaries.
2. Investments are made with the following objectives in priority order:
• Safety of principal;
• Liquidity; and,
• Maximum yield within the parameters set by the first two objectives.
3. The maximum final expected maturity of securities purchased is 397 days, with the exception of floating or variable rate securities. Floating or variable rates securities, which have reset dates shorter than 397 days and can be reasonably expected to reset at or near par on their reset dates, may have a final expected maturity of 762 days.
4. The weighted average maturity of all securities owned does not exceed 60 days.
5. The weighted average life of all securities owned does not exceed 120 days.
5. Investments subject to high price sensitivity or reduced marketability are limited to no more than 10 percent of the portfolio.
6. All security transactions are done on a delivery versus payment basis.
7. All securities are held in the custody of the State Treasurer or the Treasurer’s third-party custodian.
T

10
INVESTMENTS TIME CERTIFICATE OF DEPOSIT INVESTMENT PROGRAM
Num
ber o
f Fin
anci
al In
stitu
tions 86 82 79 79
21 22
9 9
0
25
50
75
100
125
July 2011 January 2012 July 2012 January 2013
Time Certificate of Deposit Investment Program Fiscal Year 2013 Semiannual Participation
Financial Institutions Offered Time Certificate of DepositFinancial Institutions Accepting Time Certificates of Deposit
$30
$70
$110
$150
$190
$230
$270
$310
$350
$390
Jan-2010 Jul-2010 Jan-2011 Jul-2011 Jan-2012 Jul-2012 Jan-2013
Funds Allocated Semiannual to theTime Certificate of Deposit Investment Program
versusFunds Accepted by Local Financial Institutions
(In Millions)
Funds Allocated to the Time Deposit Investment Program
Funds Accepted by Local Financial Institutions
Time Certificate of Deposit Investment Program
he Time Certificate of Deposit Investment Program has two primary objectives: first, to provide a competitive return on funds placed in
certificates of deposit with local financial institutions; and second, to ensure that locally generated tax dollars are invested throughout the state to help meet local demands for loans.
In accordance with state law, the Time Deposit Investment Program is man-aged as a separate and distinct investment program by the Treasurer. A portion of the funds available for investment by the State Treasurer is set aside semiannually for this program.
or Fiscal Year 2013:
• The average daily invested balance in the Time Certificate of Deposit Investment Program was $44,070 million.
• The average yield was .44%.• The total value on June 30, 2013 of outstanding certificates of deposit
was $40,715 million.• Nine public depositaries in the state had certificates of deposit under this
program as of June 30, 2013.
T F

11
INVESTMENTS TREASURY and TREASURER’S TRUST PORTFOLIO
$2,000 $2,500 $3,000 $3,500 $4,000 $4,500 $5,000 $5,500
2007
2008
2009
2010
2011
2012
2013
Treasury & Treasurer’s Trust Investment Portfolio(Dollars in Millions)
.
Average Daily Invested Balanceby Type
Investment Type Average Balance PercentageRepurchase Agreements $ 1,144.5 29.4%U.S. Agency Securities Coupons 546.6 14.1U.S. Agency Securities Callables 824.8 21.2U.S. Agency Securities Discounts 18.2 0.5U.S. Treasury Securities 611.3 15.7Interest Bearing Bank Deposits 83.3 2.1Investments with LGIP 507.7 13.1Certificates of Deposit 153.5 3.9
$3,889.9 100.0%
Average DailyInvested Balance
12
INVESTMENTS TREASURY and TREASURER’S TRUST PURCHASES
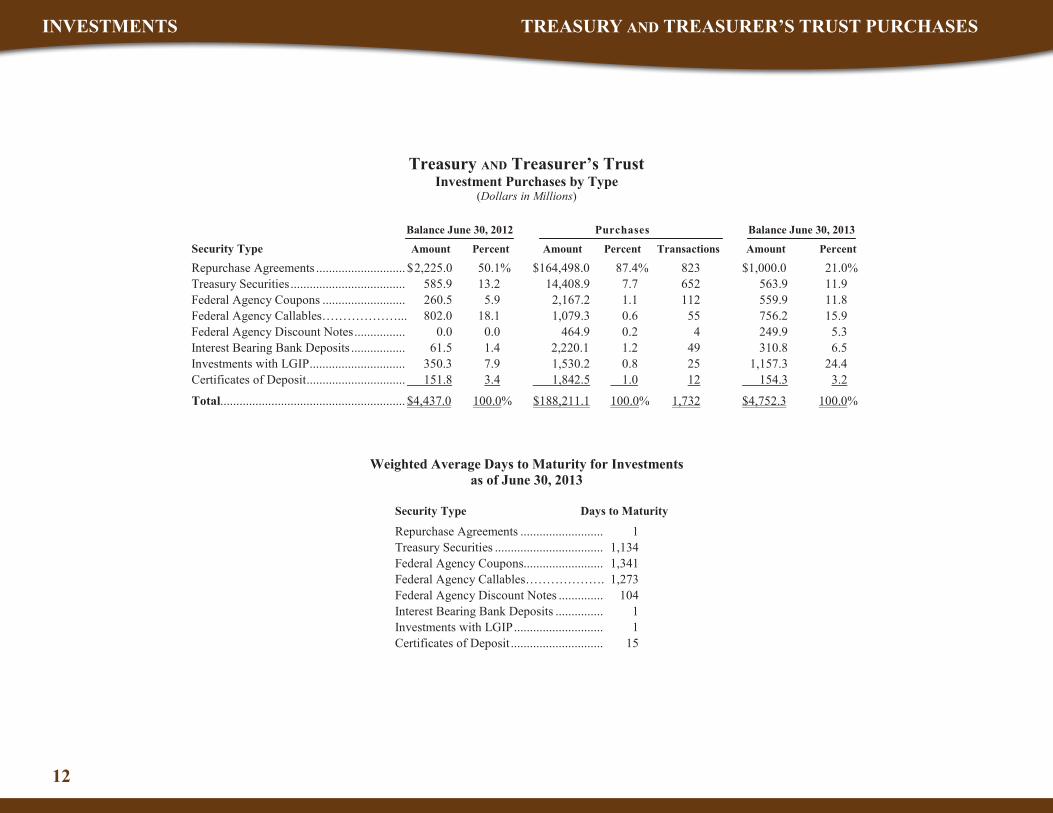
Treasury AND Treasurer’s TrustInvestment Purchases by Type
(Dollars in Millions)
Balance June 30, 2012 Purchases Balance June 30, 2013
Security Type Amount Percent Amount Percent Transactions Amount Percent
Repurchase Agreements ............................ $2,225.0 50.1% $164,498.0 87.4% 823 $1,000.0 21.0%Treasury Securities.................................... 585.9 13.2 14,408.9 7.7 652 563.9 11.9Federal Agency Coupons .......................... 260.5 5.9 2,167.2 1.1 112 559.9 11.8Federal Agency Callables………………... 802.0 18.1 1,079.3 0.6 55 756.2 15.9Federal Agency Discount Notes................ 0.0 0.0 464.9 0.2 4 249.9 5.3Interest Bearing Bank Deposits ................. 61.5 1.4 2,220.1 1.2 49 310.8 6.5Investments with LGIP.............................. 350.3 7.9 1,530.2 0.8 25 1,157.3 24.4Certificates of Deposit............................... 151.8 3.4 1,842.5 1.0 12 154.3 3.2
Total.......................................................... $4,437.0 100.0% $188,211.1 100.0% 1,732 $4,752.3 100.0%
Weighted Average Days to Maturity for Investmentsas of June 30, 2013
Security Type Days to Maturity
Repurchase Agreements .......................... 1Treasury Securities .................................. 1,134Federal Agency Coupons......................... 1,341Federal Agency Callables………………. 1,273Federal Agency Discount Notes .............. 104Interest Bearing Bank Deposits ............... 1Investments with LGIP............................ 1Certificates of Deposit ............................. 15
13
INVESTMENTS TREASURY and TREASURER’S TRUST EARNINGS
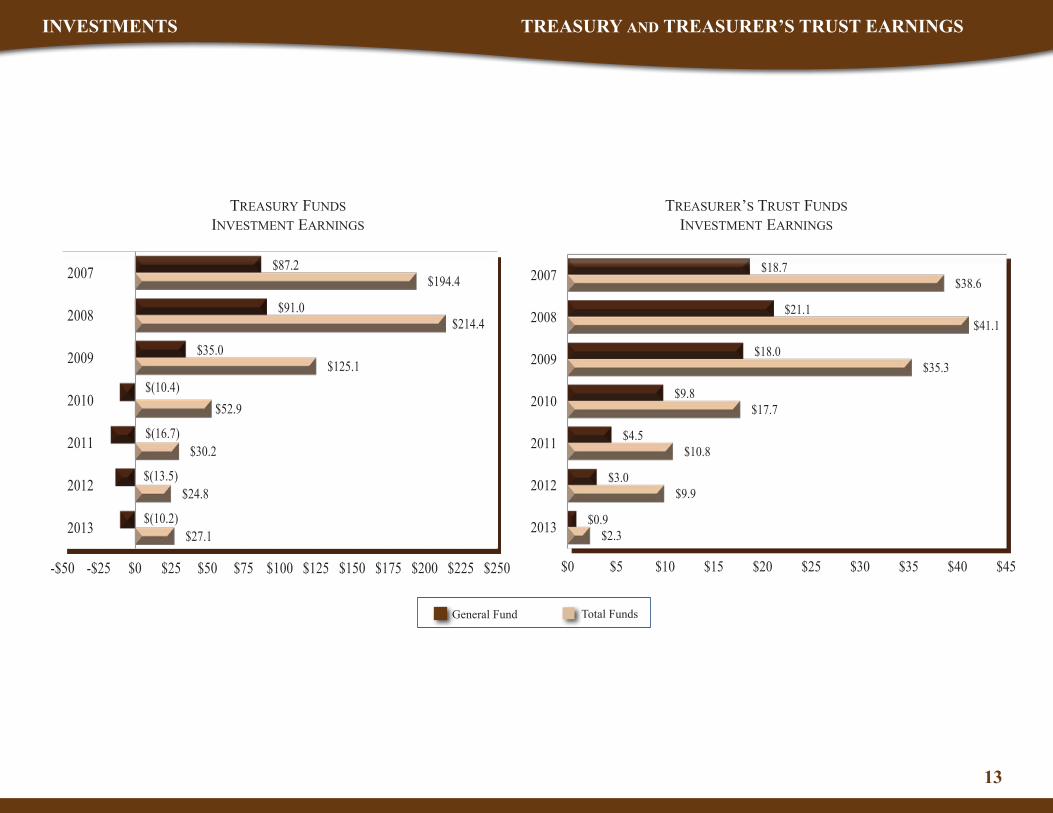
General Fund Total Funds
$87.2
$91.0
$35.0
$(10.4)
$(16.7)
$(13.5)
$(10.2)
$194.4
$214.4
$125.1
$52.9
$30.2
$24.8
$27.1
-$50 -$25 $0 $25 $50 $75 $100 $125 $150 $175 $200 $225 $250
2007
2008
2009
2010
2011
2012
2013
$18.7
$21.1
$18.0
$9.8
$4.5
$3.0
$0.9
$38.6
$41.1
$35.3
$17.7
$10.8
$9.9
$2.3
$0 $5 $10 $15 $20 $25 $30 $35 $40 $45
2007
2008
2009
2010
2011
2012
2013
Treasury FundsInvesTmenT earnIngs
Treasurer’s TrusT FundsInvesTmenT earnIngs
14
INVESTMENTS LGIP SUMMARY
Local Government Investment Pool
ashington’s Local Government Investment Pool (LGIP) was authorized by the 1986 Legislature at the request of the
Treasurer’s office. The LGIP and other local investment pools, currently operating in approximately half of the states, have been successful in providing cash managers in local governments and other political subdivisions an attractive investment option.
The program encourages small and large entities to pool their re-sources to earn a higher return on investments. The State Treasurer oversees the management of the pool in consultation with the LGIP Advisory Committee.
Cash managers previously limited either by relatively small amounts of available funds for investment or the complexities of today’s investment environment can take advantage of the volume and expertise of the State Treasurer’s investment program to maximize earnings. The LGIP:
• Provides flexibility for cash managers;
• Allows local governments to earn competitive rates of return on liquid funds;
• Maintains the safety of funds;
• Utilizes the economies of scale inherent in the securities market;
• Allows the option of direct deposit of revenue to individual pool accounts; and,
• Allows participants to open a separate account for bond pro-ceeds to facilitate the arbitrage calculation process.
From July 1, 2012 through February 28, 2013 the LGIP charged a monthly fee of 3.5 basis points (bp), or 0.035%, to cover the costs of operating the Investment Pool. Administrative fees and overdraft charges in excess of LGIP’s $546,050.81 operating costs were rebated to participants based on their average daily invested balance. The amount rebated to participants was $1,564,033.89.
On March 1, 2013 the LGIP began to operate using a daily expense factor that is based on an estimate of the LGIP actual expenses. This estimate will be adjusted as needed and will result in fees collected equaling expenses, e.g., no rebates in the future. This is significant, especially in this low interest rate environment. In FY 2013 the rebate represents 12% of the LGIP earnings. LGIP participants will now have the use of those earnings monthly, as opposed to waiting for an annual rebate.
The net administrative charge to participants was 0.871 basis points (0.00871 percent) for FY 2013.
W

15
INVESTMENTS LGIP INVESTMENT PORTFOLIO
0.00%
0.05%
0.10%
0.15%
0.20%
0.25%
Jul Aug Sep Oct Nov Dec Jan Feb Mar Apr May Jun
LGIP iMoneyNet Effective Fed Funds
$274.2
$112.4
$34.5
$23.4
$16.4
$18.6
2008
2009
2010
2011
2012
2013
Investment Earnings
$6,744.3
$7,067.8
$8,723.6
$8,976.8
$9,162.7
$9,415.3
$5,300 $6,100 $6,900 $7,700 $8,500 $9,300 $10,100
2008
2009
2010
2011
2012
2013
Average Daily Invested Balance
Investment Type Average Balance Percentage
Repurchase Agreements $2,740.3 29.11%
U.S. Treasury Securities 1,928.4 20.48%
U.S. Agency Coupons 260.9 2.77%
U.S. Agency Discount Notes 2,239.6 23.78%
U.S. Agency Floating Rate Notes 1,154.7 12.26%
U.S. Agency Variable Rate Notes 441.6 4.69%
NOW Accounts 178.5 1.90%
IB Bank Deposit 419.5 4.46%
Certificates of Deposit 11.2 0.12%
Time Certificate of Deposit Investment Program 40.6 0.43%$9,415.3 100.00%
Average Daily Invested Balanceby Type
LGIP nET EaRnInGS RaTEVersus
FEdERaL FUndS and iMoney Net, Inc.Fiscal Year 2013

16
DEBT MANAGEMENT ADMINISTRATION
Debt Administration
State Finance CommitteeThe Debt Management Section of the Office of the State Treasurer provides staff support to the State Finance Committee. The committee is composed of the Governor, Lieutenant Governor, and State Treasurer, the latter being designated by law as chairman. By statutory provision, the committee is delegated authority to supervise and control the issuance of all state bonds.
Bond ProgramDuring fiscal year 2013, the State Finance Committee sold $549.8 million in new money Various Purpose General Obligation bonds and $542.4 million in new Motor Vehicle Fuel Tax General Obligation bonds. Bonds were issued for various capital and transportation projects.
In October 2012, the state issued the third series of bonds for the SR 520 Corridor Program as a Transportation Infrastructure Finance and Innovation Act Bond (TIFIA Bond), which represents a draw-down loan from the Federal Highway Administration. The state does not expect to draw on the loan until 2014. The TIFIA Bond is payable solely from toll revenues.
During fiscal year 2013, the state also executed refunding sales: $1,097.2million various purpose general obligation refunding bonds and $539.8 million motor vehicle fuel tax general obligation refunding bonds. On a present value basis, savings over the life of the refunded bonds total $160.2 million. Debt service savings in the 2011-13 biennium total $6.4 million and savings in the 2013-15 biennium total $11.9 million.
Outstanding long-term bonded debt as of June 30, 2013 totaled $18.7 billion.Included in this total is $518.8 million in “Triple Pledge Bonds” and $500.4 million in Federal Highway Grant Anticipation Revenue (GARVEE) Bonds.Triple Pledge Bonds are first payable from toll revenue, then state excise taxes on motor vehicle and special fuels, and finally from the state’s full faith and credit, while the GARVEE bonds are limited obligations of the state payable from and secured solely by pledged federal aid.
All of the state’s VRDOs were refunded in January 2013. On an annualized basis, FY 2013 variable rate demand obligations (VRDO) all-inclusive interest rates were 0.58% (including 0.44% in remarketing and liquidity costs).
General obligation debt is subject to constitutional limitations as prescribed by the Washington State Constitution. As of June 30, 2013, the aggregate debt contracted by the state did not exceed that amount for which payments of principal and interest in any fiscal year would require the state to expend more than nine percent of the arithmetic mean of its general state revenues for the three immediately preceding fiscal years. The arithmetic mean of its general state revenues for fiscal years 2010, 2011, 2012 is $12,533,089,246. The debt service limitation, nine percent of this mean, is $1,127,978,032. The state’s maximum annual debt service as of June 30, 2013, on debt service subject to the constitutional debt limitation is $1,056,377,583 or $71,600,449 less than the debt service limitation.
Lease Purchase ProgramThe Office of the State Treasurer administers the state Lease-Purchase Program that enables state agencies to realize substantial savings by financing the acquisition of real and personal property at low tax-exempt interest rates.
Since 1998, the Lease-Purchase program has been extended to local governments in the Local Option Capital Asset Lending Program (LOCAL). The LOCAL program provides economies of scale, the state’s COP rating, and standardized documentation. LOCAL has financed 570 equipment transactions totaling $134 million and 70 real estate transactions for $58 million on behalf of more than 300 local governments.
As of June 30, there were $704.9 million in outstanding certificates of participation. Underlying this amount were financing contracts in the amounts of $626.8 million for 47 state agencies and $78.1 million for 163 local governments.
School Bond Guarantee ProgramDuring the 1999 legislative session, the Washington State Legislature created aWashington State school bond credit enhancement program. The program’s purpose is to provide savings to state taxpayers by pledging the full faith and credit of the state of Washington to the payment of voter-approved school district general obligation bonds.
Since its implementation in 2000, the program has been widely used by school districts. As of June 30, bonds totaling over $15.2 billion have been issued by 216 school districts under the program, with $8.55 billion outstanding.

17
DEBT MANAGEMENT GENERAL OBLIGATION BONDS
Washington State BondsPrincipal and Interest Paid
2005 - 2013FiscalYear Principal Interest Total2005 439,622,976$ 456,840,338$ 896,463,314$2006 475,484,229 464,343,519 939,827,7482007 508,188,126 505,214,432 1,013,402,5582008 557,056,495 547,137,880 1,104,194,3762009 592,120,442 634,657,226 1,226,777,6682010 617,172,538 694,673,298 1,311,845,8372011 636,708,541 777,614,949 1,414,323,4892012 651,469,749 830,031,230 1,481,500,9792013 703,601,997 859,836,111 1,563,438,108
Various Purpose General Obligation Bonds
273,460,000$
Motor Vehicle Fuel Tax General Obligation Bonds
173,840,000
Motor Vehicle Fuel Tax General Obligation Bonds
31,510,000
General Obligation Bonds
40,475,000
General Obligation Refunding Bonds
78,295,000
Various Purpose General Obligation Refunding Bonds
352,220,000
Motor Vehicle Fuel Tax General Obligation Refunding Bonds
380,390,000
Various Purpose General Obligation Bonds
235,895,000
Motor Vehicle Fuel Tax General Obligation Bonds
337,000,000
Various Purpose General Obligation Refunding Bonds
666,680,000
Motor Vehicle Fuel Tax General Obligatio Refunding Bonds
159,405,000
2,569,765,000$
Series 2013T (Taxable) ……………………………………………….
Series R-2013C ……………………………………………………….
Series R-2013D ……………………………………………………….
Total Fiscal Year 2013 ………………………………………………..
Series R-2013T (Taxable) …………………………………………….
Series R-2013A ……………………………………………………….
Series R-2013B ………………………………………………………
Series 2013D …………………………………………………………
Series 2013E ………………………………………………………….
True Interest Cost: 2.658401%
True Interest Cost: 2.9679416%
True Interest Cost: 3.2115148%
True Interest Cost: 2.358669%
July 18, 2012
August 7, 2012
January 23, 2013
State of WashingtonGeneral Obligation BondsFiscal Year 2013 Issues*
True Interest Cost: 2.5836028%
True Interest Cost: 2.5112676%
True Interest Cost: 3.2786192%
True Interest Cost: 3.4591282%
True Interest Cost: 2.9598415%
True Interest Cost: 0.857365%
True Interest Cost: 0.4907405%
Series 2013A ………………………………………………………….
Series 2013B-1………………………………………………………..
Series 2013B-2 ……………………………………………………….
Bond Debt Growth as of June 302005 - 2013
Fiscal Authorized PrincipalYear Not Issued Issued Outstanding2005 6,252,784,228$ 1,523,297,666$ 9,980,070,103$2006 10,449,287,372 1,558,261,856 10,584,087,7302007 10,803,926,395 2,452,060,976 11,673,280,5802008 10,182,776,395 1,891,150,000 13,007,374,0852009 12,682,076,395 1,702,700,000 14,117,953,6432010 9,539,631,395 3,865,560,000 16,599,951,1042011 9,376,715,778 2,078,825,000 16,768,450,6652012 7,418,641,778 3,837,580,000 18,353,125,9162013 6,326,461,778 2,729,170,000 18,711,578,920
*Does not incluDe toll Revenue BonD, seRies 2013c (sR 520 : tiFiA – 2012-1001A), which hAs not Been DRAwn.

18
DEBT MANAGEMENT DEBT SUMMARY
SUMMARY - DEBT STRUCTURE BY REVENUE PLEDGE(in dollars)
6/30/2009 6/30/2010 6/30/2011 6/30/2012 6/30/2013OutstandingGeneral Obligation
General State Revenues and Other Sources (1) 9,831,964,833$ 10,410,327,277$ 10,763,996,170$ 10,980,895,035$ 10,980,397,783$Motor Vehicle Fuel Tax Revenue 4,285,988,810 6,189,623,828 6,004,454,495 6,353,055,881 6,712,006,137Toll Revenue on the SR-520 Corridor ........................... ........................... ........................... 518,775,000 518,775,000
14,117,953,643$ 16,599,951,104$ 16,768,450,665$ 17,852,725,916$ 18,211,178,920$Limited ObligationPledged Federal Aid (GARVEE) $........................... $........................... $........................... 500,400,000$ 500,400,000$
14,117,953,643$ 16,599,951,104$ 16,768,450,665$ 18,353,125,916$ 18,711,578,920$
Annual Debt Service Requirements by Fiscal YearGeneral Obligation
General State Revenues and Other Sources Debt Service (1)
Payable from General State Revenues 816,725,594$ 866,032,566$ 904,457,910$ 936,976,816$ 969,603,360$Reimbursed from Other Sources (1) 91,360,751 91,743,874 88,239,461 86,327,135 83,775,821
908,086,345$ 957,776,440$ 992,697,370$ 1,023,303,951$ 1,053,379,180$Motor Vehicle Fuel Tax Revenue Debt Service
Payable from Excise Taxes on Motor Vehicle and Special Fuels 291,775,904$ 319,143,978$ 379,425,700$ 399,676,957$ 420,422,316$Reimbursed from Tolls on the Tacoma Narrows Bridge 26,915,419 34,925,419 42,200,419 43,266,544 45,329,581
318,691,323$ 354,069,397$ 421,626,119$ 442,943,501$ 465,751,897$Toll Revenue Debt Service
Payable from Tolls on the SR-520 Corridor $........................... $........................... $........................... 15,253,527$ 26,024,975$Limited Obligation
Pledged Federal Aid (GARVEE) ........................... ........................... ........................... ........................... 18,282,0561,226,777,668$ 1,311,845,837$ 1,414,323,489$ 1,481,500,979$ 1,563,438,108$
IssuanceNew Money Issuance
Various Purpose General Obligation Bonds 1,274,475,000$ 1,081,625,000$ 917,835,000$ 781,145,000$ 549,830,000$Motor Vehicle Fuel Tax General Obligation Bonds 428,225,000 2,060,820,000 ........................... 528,790,000 542,350,000Triple Pledged Bonds (SR 520 Corridor Program) ........................... ........................... ........................... 518,775,000 ...........................Federal Highway Grant Anticipation Revenue Bonds ........................... ........................... ........................... 500,400,000 ...........................
1,702,700,000$ 3,142,445,000$ 917,835,000$ 2,329,110,000$ 1,092,180,000$Refunding Issuance
Various Purpose General Obligation Refunding Bonds $........................... 601,880,000$ 767,040,000$ 1,195,085,000$ 1,097,195,000$Motor Vehicle Fuel Tax General Refunding Obligation Bonds ........................... 121,235,000 393,950,000 313,385,000 539,795,000
$........................... 723,115,000$ 1,160,990,000$ 1,508,470,000$ 1,636,990,000$1,702,700,000$ 3,865,560,000$ 2,078,825,000$ 3,837,580,000$ 2,729,170,000$
Total - Outstanding …………….…………………………….……….
Total - Annual Debt Service by Fiscal Year …………………………
Total - Issuance ………………………………………………………..
(1)The state may be reimbursed from sources that are not general state revenues, including tuition fees, patient fees, admission taxes, parking taxes, and certain King County sales and uses taxes. Note: Totals may not add due to rounding.

19
DEBT MANAGEMENT STATE LOCAL LEASE/PURCHASE
Equipment Real EstateDated Series Name TIC Local State Local State Series Total8/23/2012 WA COP Pooled EQ and RE, 2012B 2.919% 3,667,102$ 14,367,898$ 1,470,000$ 61,675,000$ 81,180,000$3/19/2013 WA COP Refunding-Pooled State Real Estate, 2013B 1.716% .................... ........................ ................... 25,410,000 25,410,0003/19/2013 WA COP State Personal Property (Taxable), Series 2013C 1.268% .................... 39,315,000 ................... ...................... 39,315,0003/19/2013 WA COP Pooled State & Local EQ, Series LP_2013A 2.311% 2,810,183 57,839,817 ................... ...................... 60,650,000
6,477,284$ 111,522,716$ 1,470,000$ 87,085,000$ 206,555,000$
Fiscal Year 2013 Certificates of Participation Issues
Total .................................................................................................
State AgenciesFiscal Year Equipment Real Estate Equipment Real Estate Costs of Issuance Total Issuance
2009 40,302,651$ 85,255,000$ 9,571,240$ 6,540,000$ 311,110$ 141,980,000$2010 24,821,839 129,690,000 9,636,440 2,435,000 (168,279) 166,415,0002011 34,587,852 43,615,000 6,657,148 1,835,000 n/a* 86,695,0002012 25,048,983 42,640,000 11,351,017 1,005,000 (0.02) 80,045,0002013 111,522,716 87,085,000 6,477,284 1,470,000 n/a* 206,555,000
236,284,040$ 388,285,000$ 43,693,129$ 13,285,000$ 142,831$ 681,690,000$
*Result of structuring changes now reflects all costs of issuance in principal.
Total ...................
Local Agencies
Certificates of Participation Issuance for Fiscal Years 2009 through 2013

20
DEBT MANAGEMENT SCHOOL BONDS GUARANTEED
$0 $200 $400 $600 $800
$1,000 $1,200 $1,400 $1,600 $1,800 $2,000
2005 2006 2007 2008 2009 2010 2011 2012 2013
$ in
Mill
ions
769 School Bonds totaling $15.2 billion issued with Guarantee
21
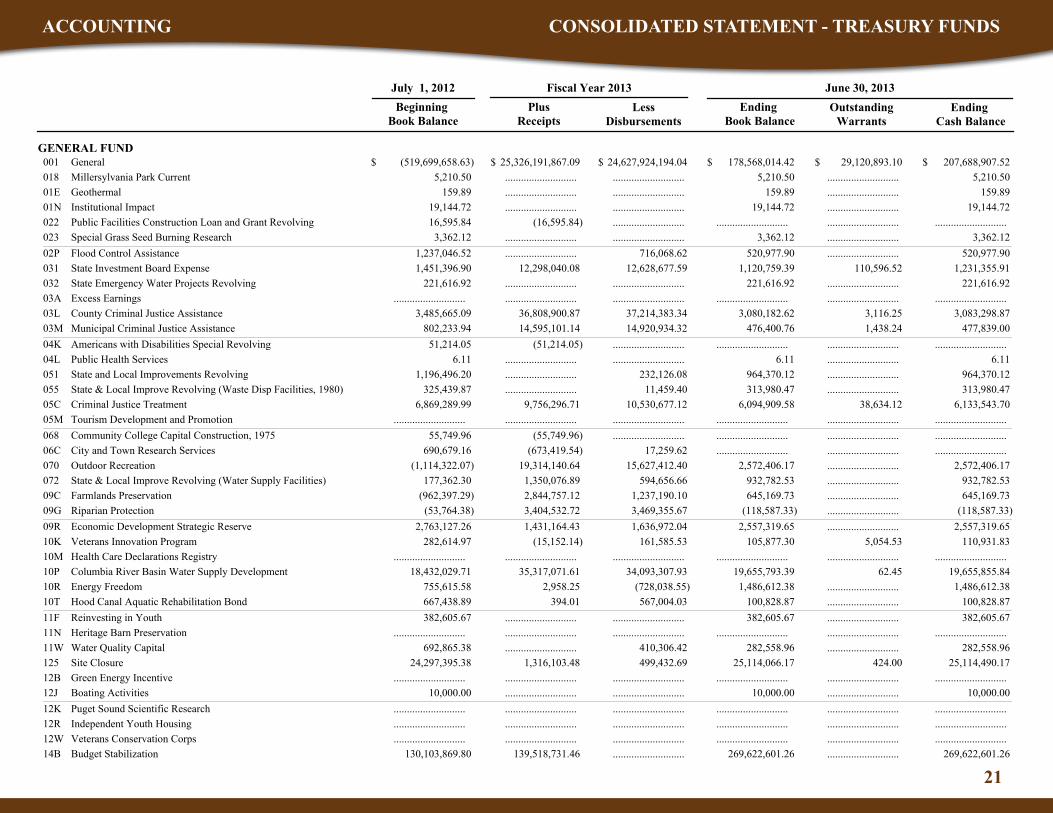
ACCOUNTING CONSOLIDATED STATEMENT - TREASURY FUNDSACCOUNTING CONSOLIDATED STATEMENT - TREASURY FUNDS
July 1, 2012
Outstanding Warrants
Ending Cash Balance
Ending Book Balance
LessDisbursements
Plus Receipts
Beginning Book Balance
Fiscal Year 2013 June 30, 2013
GENERAL FUND 25,326,191,867.09 General001 $ $ $ $ $(519,699,658.63) 24,627,924,194.04 29,120,893.10 178,568,014.42 207,688,907.52 $
...........................Millersylvania Park Current018 5,210.50 ........................... ........................... 5,210.50 5,210.50
...........................Geothermal01E 159.89 ........................... ........................... 159.89 159.89
...........................Institutional Impact01N 19,144.72 ........................... ........................... 19,144.72 19,144.72
(16,595.84)Public Facilities Construction Loan and Grant Revolving022 16,595.84 ........................... ...................................................... ...........................
...........................Special Grass Seed Burning Research023 3,362.12 ........................... ........................... 3,362.12 3,362.12
...........................Flood Control Assistance02P 1,237,046.52 716,068.62 ........................... 520,977.90 520,977.90
12,298,040.08 State Investment Board Expense031 1,451,396.90 12,628,677.59 110,596.52 1,120,759.39 1,231,355.91
...........................State Emergency Water Projects Revolving032 221,616.92 ........................... ........................... 221,616.92 221,616.92
...........................Excess Earnings03A ........................... ........................... ...................................................... ...........................
36,808,900.87 County Criminal Justice Assistance03L 3,485,665.09 37,214,383.34 3,116.25 3,080,182.62 3,083,298.87
14,595,101.14 Municipal Criminal Justice Assistance03M 802,233.94 14,920,934.32 1,438.24 476,400.76 477,839.00
(51,214.05)Americans with Disabilities Special Revolving04K 51,214.05 ........................... ...................................................... ...........................
...........................Public Health Services04L 6.11 ........................... ........................... 6.11 6.11
...........................State and Local Improvements Revolving051 1,196,496.20 232,126.08 ........................... 964,370.12 964,370.12
...........................State & Local Improve Revolving (Waste Disp Facilities, 1980)055 325,439.87 11,459.40 ........................... 313,980.47 313,980.47
9,756,296.71 Criminal Justice Treatment05C 6,869,289.99 10,530,677.12 38,634.12 6,094,909.58 6,133,543.70
...........................Tourism Development and Promotion05M ........................... ........................... ...................................................... ...........................
(55,749.96)Community College Capital Construction, 1975068 55,749.96 ........................... ...................................................... ...........................
(673,419.54)City and Town Research Services06C 690,679.16 17,259.62 ...................................................... ...........................
19,314,140.64 Outdoor Recreation070 (1,114,322.07) 15,627,412.40 ........................... 2,572,406.17 2,572,406.17
1,350,076.89 State & Local Improve Revolving (Water Supply Facilities)072 177,362.30 594,656.66 ........................... 932,782.53 932,782.53
2,844,757.12 Farmlands Preservation09C (962,397.29) 1,237,190.10 ........................... 645,169.73 645,169.73
3,404,532.72 Riparian Protection09G (53,764.38) 3,469,355.67 ...........................(118,587.33) (118,587.33)
1,431,164.43 Economic Development Strategic Reserve09R 2,763,127.26 1,636,972.04 ........................... 2,557,319.65 2,557,319.65
(15,152.14)Veterans Innovation Program10K 282,614.97 161,585.53 5,054.53 105,877.30 110,931.83
...........................Health Care Declarations Registry10M ........................... ........................... ...................................................... ...........................
35,317,071.61 Columbia River Basin Water Supply Development10P 18,432,029.71 34,093,307.93 62.45 19,655,793.39 19,655,855.84
2,958.25 Energy Freedom10R 755,615.58 (728,038.55) ........................... 1,486,612.38 1,486,612.38
394.01 Hood Canal Aquatic Rehabilitation Bond10T 667,438.89 567,004.03 ........................... 100,828.87 100,828.87
...........................Reinvesting in Youth11F 382,605.67 ........................... ........................... 382,605.67 382,605.67
...........................Heritage Barn Preservation11N ........................... ........................... ...................................................... ...........................
...........................Water Quality Capital11W 692,865.38 410,306.42 ........................... 282,558.96 282,558.96
1,316,103.48 Site Closure125 24,297,395.38 499,432.69 424.00 25,114,066.17 25,114,490.17
...........................Green Energy Incentive12B ........................... ........................... ...................................................... ...........................
...........................Boating Activities12J 10,000.00 ........................... ........................... 10,000.00 10,000.00
...........................Puget Sound Scientific Research12K ........................... ........................... ...................................................... ...........................
...........................Independent Youth Housing12R ........................... ........................... ...................................................... ...........................
...........................Veterans Conservation Corps12W ........................... ........................... ...................................................... ...........................
139,518,731.46 Budget Stabilization14B 130,103,869.80 ........................... ........................... 269,622,601.26 269,622,601.26

22
ACCOUNTING CONSOLIDATED STATEMENT - TREASURY FUNDS
July 1, 2012
Outstanding Warrants
Ending Cash Balance
Ending Book Balance
LessDisbursements
Plus Receipts
Beginning Book Balance
Fiscal Year 2013 June 30, 2013
GENERAL FUND (Continued)...........................Puget Sound Recovery14C $ $ $ $ $........................... ........................... ...................................................... ...........................$
...........................Ballast Water Management14G ........................... ........................... ...................................................... ...........................
...........................Community Preservation & Development Auth14H 8,750.00 ........................... ........................... 8,750.00 8,750.00
...........................Freight Congestion Relief14K ........................... ........................... ...................................................... ...........................
24,684,799.02 Streamlined Sales & Use Tax Mitigation14L 21,835.12 24,034,403.71 ........................... 672,230.43 672,230.43
(4,503.36)WA Community Tech Opportunity15C 629,689.47 624,081.02 29,641.52 1,105.09 30,746.61
(200,610.77)Manufacturing Innovation & Modernization15E 200,610.77 ........................... ...................................................... ...........................
...........................Local Public Safety Enhancement15F ........................... ........................... ...................................................... ...........................
...........................Building Communities15J ........................... ........................... ...................................................... ...........................
6,215,797.00 Columbia River Water Delivery15K 16,173.66 6,215,797.00 ........................... 16,173.66 16,173.66
...........................Evergreen Job Training15R ........................... ........................... ...................................................... ...........................
2,102,917.18 Marine Resources Stewardship Trust16P ........................... 741,107.81 292.70 1,361,809.37 1,362,102.07
11,000.00 Water Rights Processing16V 42,000.00 1,796.97 ........................... 51,203.03 51,203.03
...........................Judicial Retirement Administrative177 ........................... ........................... ...................................................... ...........................
(184,051.76)Opportunity Express Account17C 62,171.42 (184,051.76) ........................... 62,171.42 62,171.42
...........................State Efficiency and Restructuring17E ........................... ........................... ...................................................... ...........................
125,510,722.33 Washington Opportunity Pathways17F 10,068,463.49 111,581,422.64 ........................... 23,997,763.18 23,997,763.18
22,000,000.00 Basic Health Plan Stabilization17K ........................... 22,000,000.00 ...................................................... ...........................
10,424,612.80 Columbia River BasinTax Bond Water Supply Development18B ........................... ........................... ........................... 10,424,612.80 10,424,612.80
2,000,058.41 Opportunity Expansion18H 268.23 ........................... ........................... 2,000,326.64 2,000,326.64
...........................Child and Family Reinvestment18T ........................... ........................... ...................................................... ...........................
...........................Decontamination212 ........................... ........................... ...................................................... ...........................
...........................Public Transportation Systems232 ........................... ........................... ...................................................... ...........................
23,074,065.44 Habitat Conservation244 4,854,505.03 20,082,334.24 ........................... 7,846,236.23 7,846,236.23
(399.42)Common School Reimbursable Construction247 399.42 ........................... ...................................................... ...........................
18,245.31 Education Construction253 7,026,364.27 ........................... ........................... 7,044,609.58 7,044,609.58
(14,198.10)Metals Mining258 14,198.10 ........................... ...................................................... ...........................
...........................Washington State Economic Development Commission264 ........................... ........................... ...................................................... ...........................
...........................Growth Management Planning and Environmental Review285 ........................... ........................... ...................................................... ...........................
...........................Education Savings291 (387.04) ........................... ...........................(387.04) (387.04)
30,054,048.10 State Taxable Building Construction355 9,244,610.42 37,556,264.26 339,302.77 1,742,394.26 2,081,697.03
90,260.00 School Constr & Skill Ctrs Bldg359 1,483,336.32 682,521.94 ........................... 891,074.38 891,074.38
(63,891.17)Digital Government Revolving426 63,891.17 ........................... ...................................................... ...........................
...........................Special Personnel Litigation Revolving488 ........................... ........................... ...................................................... ...........................
...........................Pension Funding Stabilization489 ........................... ........................... ...................................................... ...........................
916,881.04 LEOFF System Plan 2 Expense548 94,369.75 956,061.90 46.07 55,188.89 55,234.96
(7,096.36)Tobacco Prevention and Control828 3,719,188.14 1,493,764.70 ........................... 2,218,327.08 2,218,327.08
3,608.60 63.25 1,054,621.41 873,949.70 3,545.35 184,217.06 830 Agricultural College Trust Management
(289,099,254.85) 24,988,605,090.89 602,785,830.14 573,136,264.62 $ $ $ $ $ $ 29,649,565.52 25,850,840,610.36 TOTAL GENERAL FUND
23
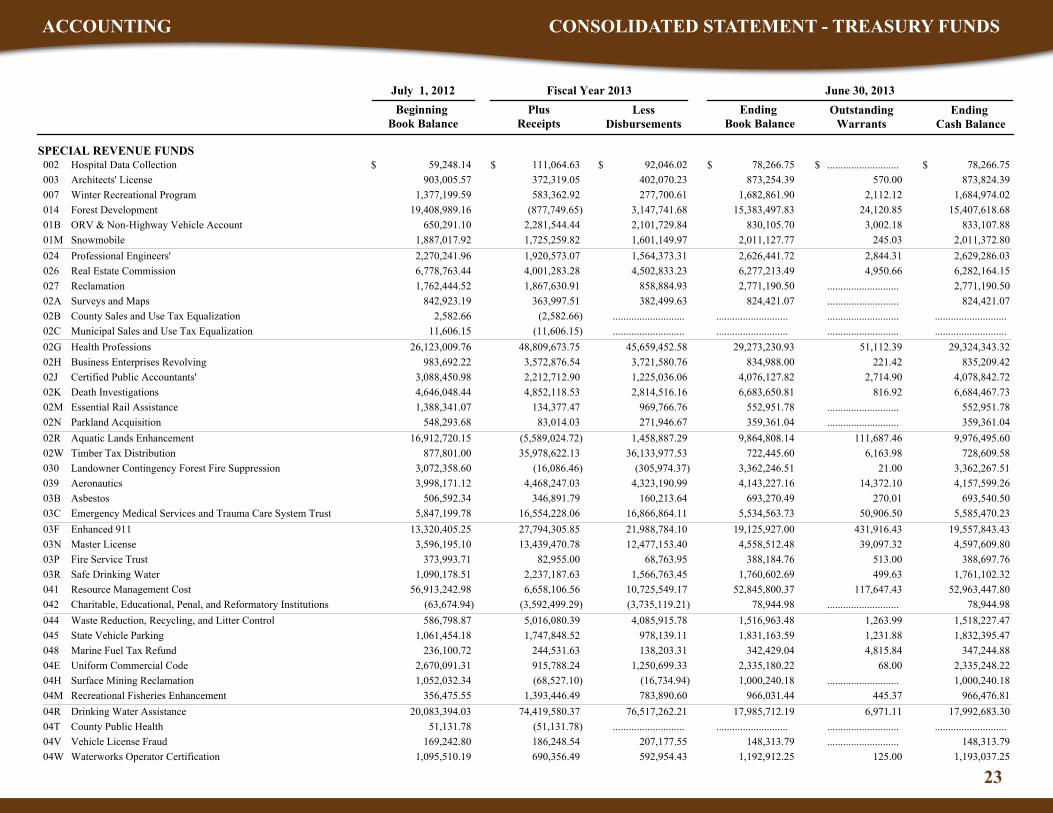
ACCOUNTING CONSOLIDATED STATEMENT - TREASURY FUNDSACCOUNTING CONSOLIDATED STATEMENT - TREASURY FUNDS
July 1, 2012
Outstanding Warrants
Ending Cash Balance
Ending Book Balance
LessDisbursements
Plus Receipts
Beginning Book Balance
Fiscal Year 2013 June 30, 2013
SPECIAL REVENUE FUNDS 111,064.63 Hospital Data Collection002 $ $ $ $ $ 59,248.14 92,046.02 ........................... 78,266.75 78,266.75 $
372,319.05 Architects' License003 903,005.57 402,070.23 570.00 873,254.39 873,824.39
583,362.92 Winter Recreational Program007 1,377,199.59 277,700.61 2,112.12 1,682,861.90 1,684,974.02
(877,749.65)Forest Development014 19,408,989.16 3,147,741.68 24,120.85 15,383,497.83 15,407,618.68
2,281,544.44 ORV & Non-Highway Vehicle Account01B 650,291.10 2,101,729.84 3,002.18 830,105.70 833,107.88
1,725,259.82 Snowmobile01M 1,887,017.92 1,601,149.97 245.03 2,011,127.77 2,011,372.80
1,920,573.07 Professional Engineers'024 2,270,241.96 1,564,373.31 2,844.31 2,626,441.72 2,629,286.03
4,001,283.28 Real Estate Commission026 6,778,763.44 4,502,833.23 4,950.66 6,277,213.49 6,282,164.15
1,867,630.91 Reclamation027 1,762,444.52 858,884.93 ........................... 2,771,190.50 2,771,190.50
363,997.51 Surveys and Maps02A 842,923.19 382,499.63 ........................... 824,421.07 824,421.07
(2,582.66)County Sales and Use Tax Equalization02B 2,582.66 ........................... ...................................................... ...........................
(11,606.15)Municipal Sales and Use Tax Equalization02C 11,606.15 ........................... ...................................................... ...........................
48,809,673.75 Health Professions02G 26,123,009.76 45,659,452.58 51,112.39 29,273,230.93 29,324,343.32
3,572,876.54 Business Enterprises Revolving02H 983,692.22 3,721,580.76 221.42 834,988.00 835,209.42
2,212,712.90 Certified Public Accountants'02J 3,088,450.98 1,225,036.06 2,714.90 4,076,127.82 4,078,842.72
4,852,118.53 Death Investigations02K 4,646,048.44 2,814,516.16 816.92 6,683,650.81 6,684,467.73
134,377.47 Essential Rail Assistance02M 1,388,341.07 969,766.76 ........................... 552,951.78 552,951.78
83,014.03 Parkland Acquisition02N 548,293.68 271,946.67 ........................... 359,361.04 359,361.04
(5,589,024.72)Aquatic Lands Enhancement02R 16,912,720.15 1,458,887.29 111,687.46 9,864,808.14 9,976,495.60
35,978,622.13 Timber Tax Distribution02W 877,801.00 36,133,977.53 6,163.98 722,445.60 728,609.58
(16,086.46)Landowner Contingency Forest Fire Suppression030 3,072,358.60 (305,974.37) 21.00 3,362,246.51 3,362,267.51
4,468,247.03 Aeronautics039 3,998,171.12 4,323,190.99 14,372.10 4,143,227.16 4,157,599.26
346,891.79 Asbestos03B 506,592.34 160,213.64 270.01 693,270.49 693,540.50
16,554,228.06 Emergency Medical Services and Trauma Care System Trust03C 5,847,199.78 16,866,864.11 50,906.50 5,534,563.73 5,585,470.23
27,794,305.85 Enhanced 91103F 13,320,405.25 21,988,784.10 431,916.43 19,125,927.00 19,557,843.43
13,439,470.78 Master License03N 3,596,195.10 12,477,153.40 39,097.32 4,558,512.48 4,597,609.80
82,955.00 Fire Service Trust03P 373,993.71 68,763.95 513.00 388,184.76 388,697.76
2,237,187.63 Safe Drinking Water03R 1,090,178.51 1,566,763.45 499.63 1,760,602.69 1,761,102.32
6,658,106.56 Resource Management Cost041 56,913,242.98 10,725,549.17 117,647.43 52,845,800.37 52,963,447.80
(3,592,499.29)Charitable, Educational, Penal, and Reformatory Institutions042 (63,674.94) (3,735,119.21) ........................... 78,944.98 78,944.98
5,016,080.39 Waste Reduction, Recycling, and Litter Control044 586,798.87 4,085,915.78 1,263.99 1,516,963.48 1,518,227.47
1,747,848.52 State Vehicle Parking045 1,061,454.18 978,139.11 1,231.88 1,831,163.59 1,832,395.47
244,531.63 Marine Fuel Tax Refund048 236,100.72 138,203.31 4,815.84 342,429.04 347,244.88
915,788.24 Uniform Commercial Code04E 2,670,091.31 1,250,699.33 68.00 2,335,180.22 2,335,248.22
(68,527.10)Surface Mining Reclamation04H 1,052,032.34 (16,734.94) ........................... 1,000,240.18 1,000,240.18
1,393,446.49 Recreational Fisheries Enhancement04M 356,475.55 783,890.60 445.37 966,031.44 966,476.81
74,419,580.37 Drinking Water Assistance04R 20,083,394.03 76,517,262.21 6,971.11 17,985,712.19 17,992,683.30
(51,131.78)County Public Health04T 51,131.78 ........................... ...................................................... ...........................
186,248.54 Vehicle License Fraud04V 169,242.80 207,177.55 ........................... 148,313.79 148,313.79
690,356.49 Waterworks Operator Certification04W 1,095,510.19 592,954.43 125.00 1,192,912.25 1,193,037.25

24
ACCOUNTING CONSOLIDATED STATEMENT - TREASURY FUNDS
July 1, 2012
Outstanding Warrants
Ending Cash Balance
Ending Book Balance
LessDisbursements
Plus Receipts
Beginning Book Balance
Fiscal Year 2013 June 30, 2013
SPECIAL REVENUE FUNDS (Continued) 122,102,159.86 Public Works Assistance058 $ $ $ $ $ 7,459,202.94 117,222,393.58 400,809.87 12,338,969.22 12,739,779.09 $
44,137,589.26 Disaster Response05H 13,877,910.45 52,134,781.32 ........................... 5,880,718.39 5,880,718.39
(76,923.76)County Research Services05K 70,517.62 (6,406.14) ...................................................... ...........................
1,193,518.97 Drinking Water Assistance Administrative05R 2,917,946.22 418,112.83 290.21 3,693,352.36 3,693,642.57
(1,295.75)Distressed County Assistance05T 1,295.75 ........................... ...................................................... ...........................
15,596.72 State Drought Preparedness05W 677,001.66 76,560.63 ........................... 616,037.75 616,037.75
(3,800.00)Salmon Recovery06A 67,419.51 3,512.36 ........................... 60,107.15 60,107.15
839,725.28 Real Estate Appraiser Commission06G 558,541.93 890,887.66 38.00 507,379.55 507,417.55
48,293.78 Lead Paint06K 71,828.81 33,846.16 ........................... 86,276.43 86,276.43
8,298,371.17 Business and Professions06L 4,832,577.86 6,961,730.96 7,540.28 6,169,218.07 6,176,758.35
195,870.00 Real Estate Research06R 1,009,951.54 188,772.00 23,451.55 1,017,049.54 1,040,501.09
(1,523,420.46)License Plate Technology06T 1,721,384.83 224.62 7.16 197,739.75 197,746.91
1,092,471.37 Warm Water Game Fish071 374,284.50 1,130,636.83 32.87 336,119.04 336,151.91
88,675.25 Vessel Response07C 146,601.26 128,173.05 ........................... 107,103.46 107,103.46
18,272,848.01 Drinking Water Assistance Repayment07R 66,579,418.50 (1,521,110.37) ........................... 86,373,376.88 86,373,376.88
616,689.87 Domestic Violence Prevention07W 877,431.42 641,210.30 ........................... 852,910.99 852,910.99
115,203.86 Grade Crossing Protective080 513,106.72 359,153.78 77,493.37 269,156.80 346,650.17
223,561,944.59 State Patrol Highway081 12,565,936.12 214,876,913.98 361,308.73 21,250,966.73 21,612,275.46
2,142,515.00 Motorcycle Safety Education082 1,367,491.50 2,353,466.74 10,995.00 1,156,539.76 1,167,534.76
336,276.08 Building Code Council084 887,768.89 830,736.76 ........................... 393,308.21 393,308.21
4,373,472.11 Fire Service Training086 9,149,893.46 5,001,486.83 502,803.29 8,521,878.74 9,024,682.03
1,338,532.13 Park Land Trust Revolving087 117,026.67 1,233,090.74 26.13 222,468.06 222,494.19
103,680,804.30 Education Legacy Trust08A (1,653,307.20) 100,115,485.72 207,106.85 1,912,011.38 2,119,118.23
1,868,500.95 Flexible Spending Administrative08G 1,122,957.53 789,890.40 ........................... 2,201,568.08 2,201,568.08
320,612.44 Military Department Rental and Lease08H 574,777.24 171,042.93 10.00 724,346.75 724,356.75
648,360.85 Problem Gambling08K 511,998.13 689,418.86 57.62 470,940.12 470,997.74
1,928,238.86 Small City Pavement and Sidewalk08M 1,672,219.09 2,342,174.34 26,932.80 1,258,283.61 1,285,216.41
3,674,213.10 Waste Tire Removal08R 3,733,638.42 578,881.79 ........................... 6,828,969.73 6,828,969.73
2,811,941.81 Transportation Infrastructure094 6,135,479.54 1,951,308.67 ........................... 6,996,112.68 6,996,112.68
19,954,820.58 Electrical License095 7,514,406.87 17,061,767.81 18,735.92 10,407,459.64 10,426,195.56
6,178.92 Highway Infrastructure096 2,373,797.21 ........................... ........................... 2,379,976.13 2,379,976.13
645,630.62 Recreational Vehicle097 685,322.01 106.75 3.00 1,330,845.88 1,330,848.88
52,610,529.10 Puget Sound Capital Construction099 13,119,932.84 46,241,976.37 36,040.57 19,488,485.57 19,524,526.14
3,020,800.28 Freight Mobility Investment09E 7,551,510.98 3,887,000.00 ........................... 6,685,311.26 6,685,311.26
3,210.94 High-Occupancy Toll Lanes Operations09F 1,090,843.04 (373,900.27) 14,974.47 1,467,954.25 1,482,928.72
444,330,432.97 Transportation Partnership09H 452,912,173.52 512,603,097.83 2,424,803.72 384,639,508.66 387,064,312.38
125,971.50 Aquatic Invasive Species Enforcement09M 372,622.12 129,876.17 ........................... 368,717.45 368,717.45
420,054.98 Aquatic Invasive Species Prevention09N 203,373.94 400,457.35 5.51 222,971.57 222,977.08
9,904,662.33 City-County Assistance09P 7.53 9,039,725.66 17,521.98 864,944.20 882,466.18
2,000.00 Washington Main Street Trust Fund09T 61,766.71 ........................... ........................... 63,766.71 63,766.71

25
ACCOUNTING CONSOLIDATED STATEMENT - TREASURY FUNDSACCOUNTING CONSOLIDATED STATEMENT - TREASURY FUNDS
July 1, 2012
Outstanding Warrants
Ending Cash Balance
Ending Book Balance
LessDisbursements
Plus Receipts
Beginning Book Balance
Fiscal Year 2013 June 30, 2013
SPECIAL REVENUE FUNDS (Continued) 18,402,003.14 Rural Arterial Trust102 $ $ $ $ $ 22,801,265.53 20,289,682.28 250.00 20,913,586.39 20,913,836.39 $
49,692,905.18 State Wildlife104 20,703,133.02 47,080,029.21 130,686.86 23,316,008.99 23,446,695.85
118,935,450.90 Highway Safety106 13,382,601.16 108,873,316.92 205,644.80 23,444,735.14 23,650,379.94
20,606.94 Liquor Excise Tax107 6,584,813.83 6,605,420.77 ...................................................... ...........................
1,589,775,761.51 Motor Vehicle108 95,369,671.50 1,554,846,263.74 2,516,849.96 130,299,169.27 132,816,019.23
234,725,667.24 Puget Sound Ferry Operations109 28,041,813.06 231,611,321.51 238,842.68 31,156,158.79 31,395,001.47
251,943.00 Aquatic Algae Control10A 165,571.78 186,494.13 ........................... 231,020.65 231,020.65
21,086,171.24 Home Security Fund10B 4,721,594.29 14,260,840.63 41,779.98 11,546,924.90 11,588,704.88
83,330.97 Water Rights Tracking System10G 133,772.86 11,221.74 ........................... 205,882.09 205,882.09
...........................Job Development10H ........................... ........................... ...................................................... ...........................
1,218,522.92 Special Wildlife110 4,095,952.82 887,169.50 894.59 4,427,306.24 4,428,200.83
17,849,458.43 Public Service Revolving111 14,080,830.82 14,245,360.78 523,216.24 17,684,928.47 18,208,144.71
1,305,482.66 Common School Construction113 136,490,392.23 (16,797,106.13) 380,220.72 154,592,981.02 154,973,201.74
84,630.00 Basic Data116 19,387.36 104,010.00 ........................... 7.36 7.36
168,074,414.63 Unemployment Compensation Administration119 (252,392.20) 168,210,232.34 1,066,607.20 (388,209.91) 678,397.29
20,057,164.39 Regional Mobility Grant Program11B 25,726,558.20 25,633,634.33 1,097,353.65 20,150,088.26 21,247,441.91
3,021,793.57 Freight Mobility Multimodal11E 12,085,726.85 6,991,743.07 ........................... 8,115,777.35 8,115,777.35
4,429,328.31 Forest and Fish Support11H 6,081,990.91 3,839,731.37 ........................... 6,671,587.85 6,671,587.85
7,552,825.72 Washington Auto Theft Prevention Authority11K 5,588,788.55 9,961,799.58 ........................... 3,179,814.69 3,179,814.69
11,022,972.24 Administrative Contingency120 1,079,270.25 7,953,212.53 318.84 4,149,029.96 4,149,348.80
4,743,398.71 Affordable Housing For All12C 4,585,009.72 2,584,823.27 3,108.55 6,743,585.16 6,746,693.71
352,230.00 Charitable Organization Education12M 434,236.47 54,843.96 154.30 731,622.51 731,776.81
1,483,657.74 Traumatic Brain Injury12T 1,656,548.79 1,260,021.09 86,531.37 1,880,185.44 1,966,716.81
18,469,312.38 Employment Services Administrative134 7,404,785.75 20,335,419.28 892.00 5,538,678.85 5,539,570.85
24,068,279.98 Insurance Commissioner's Regulatory138 10,550,669.79 23,338,813.71 2,243.77 11,280,136.06 11,282,379.83
85,515,793.67 Transportation Improvement144 51,132,001.76 98,248,851.45 20,012.50 38,398,943.98 38,418,956.48
417,217.15 Firearms Range146 1,067,887.36 305,319.35 7,740.90 1,179,785.16 1,187,526.06
182,340.16 Wildlife Rehabilitation14A 243,247.91 52,598.02 2,293.73 372,990.05 375,283.78
374,005.00 Financial Fraud & ID Theft14M 591,597.03 350,574.86 ........................... 615,027.17 615,027.17
...........................Military Active State Service14R ........................... ........................... ...................................................... ...........................
1,369,020.00 Ignition Interlock Device14V 1,945,020.24 1,237,198.92 ........................... 2,076,841.32 2,076,841.32
831,483.26 Low-Income Weatherization/ Structural Rehabilitation Assistance150 1,941,132.19 231,544.15 ........................... 2,541,071.30 2,541,071.30
7,005,848.96 Rural Mobility Grant Program153 2,544,121.53 8,136,709.04 9,017.29 1,413,261.45 1,422,278.74
608,429.02 New Motor Vehicle Arbitration154 1,127,333.22 388,263.53 ........................... 1,347,498.71 1,347,498.71
(7,236.63)Aquatic Land Dredged Material Disposal Site158 458,727.61 79,276.62 ........................... 372,214.36 372,214.36
28,783.62 Parks Improvement159 232,720.61 (244,382.46) 487.53 505,886.69 506,374.22
5,756,656.07 Cleanup Settlement15H 104,648,231.78 16,230,973.65 10,705.50 94,173,914.20 94,184,619.70
751,718.33 Biotoxin15M 696,777.95 791,901.55 320.00 656,594.73 656,914.73
5,455,788.05 Energy Recovery Act15P 757,825.04 6,491,261.42 512,225.37 (277,648.33) 234,577.04
208,050.00 Wood Stove Education and Enforcement160 21,178.16 (64,733.93) 196.66 293,962.09 294,158.75
26
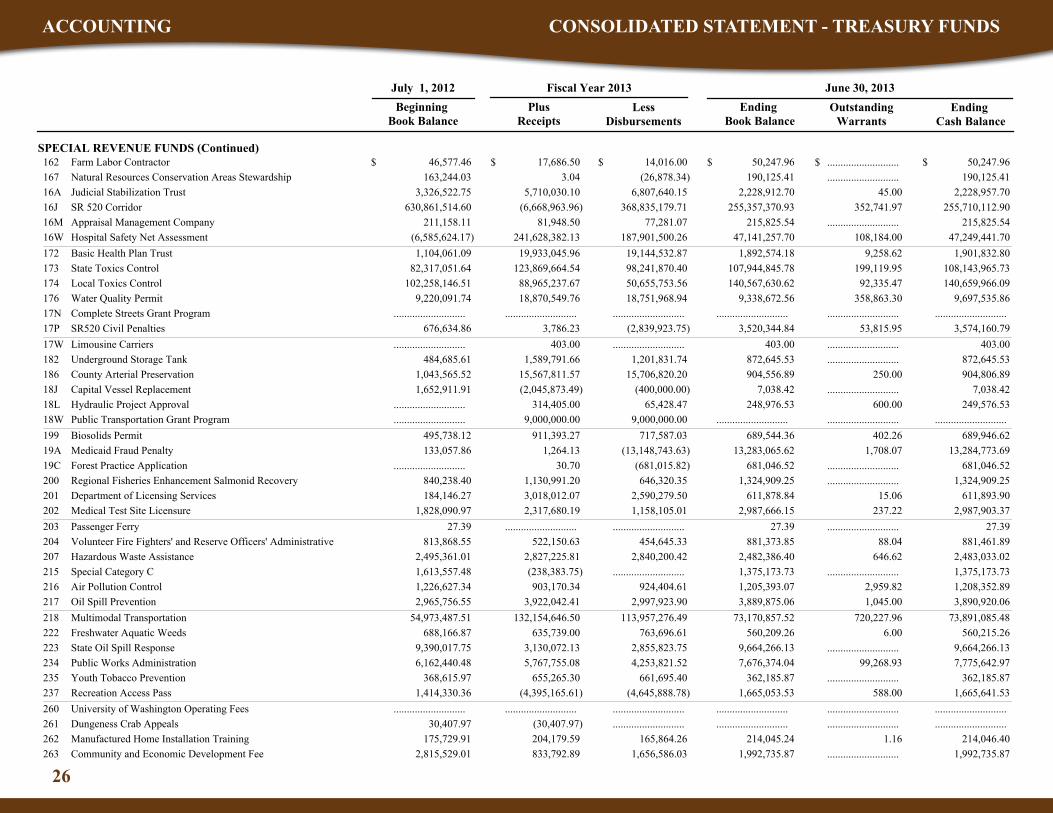
ACCOUNTING CONSOLIDATED STATEMENT - TREASURY FUNDS
July 1, 2012
Outstanding Warrants
Ending Cash Balance
Ending Book Balance
LessDisbursements
Plus Receipts
Beginning Book Balance
Fiscal Year 2013 June 30, 2013
SPECIAL REVENUE FUNDS (Continued) 17,686.50 Farm Labor Contractor162 $ $ $ $ $ 46,577.46 14,016.00 ........................... 50,247.96 50,247.96 $
3.04 Natural Resources Conservation Areas Stewardship167 163,244.03 (26,878.34) ........................... 190,125.41 190,125.41
5,710,030.10 Judicial Stabilization Trust16A 3,326,522.75 6,807,640.15 45.00 2,228,912.70 2,228,957.70
(6,668,963.96)SR 520 Corridor16J 630,861,514.60 368,835,179.71 352,741.97 255,357,370.93 255,710,112.90
81,948.50 Appraisal Management Company16M 211,158.11 77,281.07 ........................... 215,825.54 215,825.54
241,628,382.13 Hospital Safety Net Assessment16W (6,585,624.17) 187,901,500.26 108,184.00 47,141,257.70 47,249,441.70
19,933,045.96 Basic Health Plan Trust172 1,104,061.09 19,144,532.87 9,258.62 1,892,574.18 1,901,832.80
123,869,664.54 State Toxics Control173 82,317,051.64 98,241,870.40 199,119.95 107,944,845.78 108,143,965.73
88,965,237.67 Local Toxics Control174 102,258,146.51 50,655,753.56 92,335.47 140,567,630.62 140,659,966.09
18,870,549.76 Water Quality Permit176 9,220,091.74 18,751,968.94 358,863.30 9,338,672.56 9,697,535.86
...........................Complete Streets Grant Program17N ........................... ........................... ...................................................... ...........................
3,786.23 SR520 Civil Penalties17P 676,634.86 (2,839,923.75) 53,815.95 3,520,344.84 3,574,160.79
403.00 Limousine Carriers17W ........................... ........................... ........................... 403.00 403.00
1,589,791.66 Underground Storage Tank182 484,685.61 1,201,831.74 ........................... 872,645.53 872,645.53
15,567,811.57 County Arterial Preservation186 1,043,565.52 15,706,820.20 250.00 904,556.89 904,806.89
(2,045,873.49)Capital Vessel Replacement18J 1,652,911.91 (400,000.00) ........................... 7,038.42 7,038.42
314,405.00 Hydraulic Project Approval18L ........................... 65,428.47 600.00 248,976.53 249,576.53
9,000,000.00 Public Transportation Grant Program18W ........................... 9,000,000.00 ...................................................... ...........................
911,393.27 Biosolids Permit199 495,738.12 717,587.03 402.26 689,544.36 689,946.62
1,264.13 Medicaid Fraud Penalty19A 133,057.86 (13,148,743.63) 1,708.07 13,283,065.62 13,284,773.69
30.70 Forest Practice Application19C ........................... (681,015.82) ........................... 681,046.52 681,046.52
1,130,991.20 Regional Fisheries Enhancement Salmonid Recovery200 840,238.40 646,320.35 ........................... 1,324,909.25 1,324,909.25
3,018,012.07 Department of Licensing Services201 184,146.27 2,590,279.50 15.06 611,878.84 611,893.90
2,317,680.19 Medical Test Site Licensure202 1,828,090.97 1,158,105.01 237.22 2,987,666.15 2,987,903.37
...........................Passenger Ferry203 27.39 ........................... ........................... 27.39 27.39
522,150.63 Volunteer Fire Fighters' and Reserve Officers' Administrative204 813,868.55 454,645.33 88.04 881,373.85 881,461.89
2,827,225.81 Hazardous Waste Assistance207 2,495,361.01 2,840,200.42 646.62 2,482,386.40 2,483,033.02
(238,383.75)Special Category C215 1,613,557.48 ........................... ........................... 1,375,173.73 1,375,173.73
903,170.34 Air Pollution Control216 1,226,627.34 924,404.61 2,959.82 1,205,393.07 1,208,352.89
3,922,042.41 Oil Spill Prevention217 2,965,756.55 2,997,923.90 1,045.00 3,889,875.06 3,890,920.06
132,154,646.50 Multimodal Transportation218 54,973,487.51 113,957,276.49 720,227.96 73,170,857.52 73,891,085.48
635,739.00 Freshwater Aquatic Weeds222 688,166.87 763,696.61 6.00 560,209.26 560,215.26
3,130,072.13 State Oil Spill Response223 9,390,017.75 2,855,823.75 ........................... 9,664,266.13 9,664,266.13
5,767,755.08 Public Works Administration234 6,162,440.48 4,253,821.52 99,268.93 7,676,374.04 7,775,642.97
655,265.30 Youth Tobacco Prevention235 368,615.97 661,695.40 ........................... 362,185.87 362,185.87
(4,395,165.61)Recreation Access Pass237 1,414,330.36 (4,645,888.78) 588.00 1,665,053.53 1,665,641.53
...........................University of Washington Operating Fees260 ........................... ........................... ...................................................... ...........................
(30,407.97)Dungeness Crab Appeals261 30,407.97 ........................... ...................................................... ...........................
204,179.59 Manufactured Home Installation Training262 175,729.91 165,864.26 1.16 214,045.24 214,046.40
833,792.89 Community and Economic Development Fee263 2,815,529.01 1,656,586.03 ........................... 1,992,735.87 1,992,735.87

27
ACCOUNTING CONSOLIDATED STATEMENT - TREASURY FUNDSACCOUNTING CONSOLIDATED STATEMENT - TREASURY FUNDS
July 1, 2012
Outstanding Warrants
Ending Cash Balance
Ending Book Balance
LessDisbursements
Plus Receipts
Beginning Book Balance
Fiscal Year 2013 June 30, 2013
SPECIAL REVENUE FUNDS (Continued) 6,249,470.29 Recreation Resources267 $ $ $ $ $ 4,928,045.42 6,814,638.70 4,494.34 4,362,877.01 4,367,371.35 $
4,706,451.48 Nonhighway and Off-Road Vehicle Activities (NOVA) Program268 4,674,597.07 2,978,762.43 ........................... 6,402,286.12 6,402,286.12
55,848,485.53 Parks Renewal and Stewardship269 22,253,680.14 55,976,952.54 287,486.14 22,125,213.13 22,412,699.27
...........................Washington State University Operating Fees271 ........................... ........................... ...................................................... ...........................
...........................Central Washington University Operating Fees275 ........................... ........................... ...................................................... ...........................
84,985.53 State Agency Parking277 182,046.86 104,848.96 152.30 162,183.43 162,335.73
179,189.08 Columbia River Basin Water Supply Rev Recovery296 1,133.95 ........................... ........................... 180,323.03 180,323.03
(51,911.27)Nisqually Earthquake309 51,911.27 ........................... ...................................................... ...........................
...........................Dedicated Marijuana Fund315 ........................... ........................... ...................................................... ...........................
1,469,405.26 Public Health Supplemental319 1,456,825.56 1,695,236.25 90.41 1,230,994.57 1,231,084.98
4,361,989.75 State Treasurer's Service404 11,304,786.54 8,305,651.03 16,784.64 7,361,125.26 7,377,909.90
(162,521.13)Coastal Protection408 1,098,941.35 366,194.28 ........................... 570,225.94 570,225.94
4,130,408.74 Local Goverment Archives441 816,800.96 3,467,624.63 57.82 1,479,585.07 1,479,642.89
158,107.85 Perpetual Surveillance and Maintenance500 44,760,588.95 ........................... ........................... 44,918,696.80 44,918,696.80
315,305.66 Oyster Reserve Land507 803,622.69 267,990.37 285.60 850,937.98 851,223.58
(28,708,307.12)Tacoma Narrows Toll Bridge511 3,754,127.34 (33,337,003.48) 126,908.97 8,382,823.70 8,509,732.67
742,916.91 Derelict Vessel Removal513 549,068.25 457,293.71 6.00 834,691.45 834,697.45
6,061,480.69 Washington Housing Trust532 11,929,626.60 7,611,092.85 10,061.54 10,380,014.44 10,390,075.98
...........................Alaskan Way Viaduct Replacement Project535 ........................... ........................... ...................................................... ...........................
671,944.21 Election549 10,257,694.46 2,788,569.03 180.24 8,141,069.64 8,141,249.88
265,648,393.26 Transportation 2003550 87,718,485.08 197,317,409.10 234,852.90 156,049,469.24 156,284,322.14
(40,571.11)Skilled Nursing Facility Safety Net Trust562 1,339,930.80 (754,196.31) ........................... 2,053,556.00 2,053,556.00
...........................Columbia River Crossing Project563 ........................... ........................... ...................................................... ...........................
...........................I-405 Express Toll Lanes Operations595 ........................... ........................... ...................................................... ...........................
22,425,503.16 Department of Retirement Systems Expense600 7,984,602.72 26,037,883.52 19,090.41 4,372,222.36 4,391,312.77
2,415,058.08 Rural Washington Loan689 7,717,264.65 116,563.94 408.00 10,015,758.79 10,016,166.79
110,342,379.64 Water Pollution Control Revolving727 99,743,427.21 73,989,057.13 ........................... 136,096,749.72 136,096,749.72
(3,254,217.00)Capitol Campus Reserve733 115,760.50 (1,079,326.50) ...........................(2,059,130.00) (2,059,130.00)
(2.99)Puyallup Tribal Settlement736 2.99 ........................... ...................................................... ...........................
55,743.40 Prostitution Prevention and Intervention777 60,522.84 ........................... ........................... 116,266.24 116,266.24
14,702,192.52 State Educational Trust Fund785 3,473,186.57 13,164,424.21 27.37 5,010,954.88 5,010,982.25
639.38 Youth Athletic Facility818 245,632.96 ........................... ........................... 246,272.34 246,272.34
...........................Tobacco Settlement825 ........................... ........................... ...................................................... ...........................
145,490.97 OASI Revolving874 218,992.00 143,777.76 6.03 220,705.21 220,711.24
9,309,502.38 Public Facilities Construction Loan Revolving887 26,575,640.16 9,733,161.06 4,094.31 26,151,981.48 26,156,075.79
5,698,058.84 Deferred Compensation Administrative888 1,033,847.47 4,678,855.76 76.08 2,053,050.55 2,053,126.63
334,095.53 867.40 334,095.53 333,228.13 893 Radiation Perpetual Maintenance ........................... ...........................
2,690,087,177.25 5,011,201,094.88 2,601,262,648.97 2,586,684,866.75 $ $ $ $ $ $ 14,577,782.22 4,907,798,784.38 TOTAL SPECIAL REVENUE FUNDS

28
ACCOUNTING CONSOLIDATED STATEMENT - TREASURY FUNDS
July 1, 2012
Outstanding Warrants
Ending Cash Balance
Ending Book Balance
LessDisbursements
Plus Receipts
Beginning Book Balance
Fiscal Year 2013 June 30, 2013
DEBT SERVICE FUNDS 1,111,668,616.35 Highway Bond Retirement303 $ $ $ $ $ 158,090,462.64 1,059,262,362.76 ........................... 210,496,716.23 210,496,716.23 $
15,910,844.11 Ferry Bond Retirement304 7,891,270.17 15,897,481.26 ........................... 7,904,633.02 7,904,633.02
17,774,603.04 Transportation Improvement Board Bond Retirement305 2,578,164.09 13,982,070.74 ........................... 6,370,696.39 6,370,696.39
8,309,759.81 Washington State University Bond Retirement347 11,273,552.39 5,985,093.24 ........................... 13,598,218.96 13,598,218.96
14,451,514.20 University of Washington Bond Retirement348 8,765,165.14 8,618,193.46 ........................... 14,598,485.88 14,598,485.88
1,166,891,256.54 Debt-Limit General Fund Bond Retirement380 400,628.94 1,167,276,816.30 ........................... 15,069.18 15,069.18
1,146,750.00 Debt-Limit Reimbursable Bond Retirement381 ........................... 1,146,750.00 ...................................................... ...........................
...........................Nondebt-Limit General Fund Bond Retirement382 ........................... ........................... ...................................................... ...........................
181,921,581.31 Nondebt-Limit Reimbursable Bond Retirement383 31,729.86 181,950,889.77 ........................... 2,421.40 2,421.40
...........................Nondebt-Limit Proprietary Appropriated Bond Retirement384 ........................... ........................... ...................................................... ...........................
...........................Nondebt-Limit Proprietary Nonappropriated Bond Retirement385 ........................... ........................... ...................................................... ...........................
...........................Nondebt-Limit Revenue Bond Retirement386 ........................... ........................... ...................................................... ...........................
2,185,523.23 26,024,975.00 26,041,747.24 2,185,523.23 2,168,750.99 389 Toll Facility Bond Retirement ...........................
191,199,724.22 2,480,144,632.53 ........................... 255,171,764.29 255,171,764.29 $ $ $ $ $ $ 2,544,116,672.60 TOTAL DEBT SERVICE FUNDS
CAPITAL PROJECTS FUNDS...........................Higher Education Construction01L $ $ $ $ $........................... ........................... ...................................................... ...........................$
(5,073,386.40)Capitol Building Construction036 3,294,837.97 48,168.07 ...........................(1,826,716.50) (1,826,716.50)
1,613.41 State Higher Education Construction056 619,850.17 ........................... ........................... 621,463.58 621,463.58
450,325,042.67 State Building Construction057 290,361,352.38 742,330,248.48 6,052,028.37 (1,643,853.43) 4,408,174.94
38,873,972.44 Community and Technical College Capital Projects060 31,643,647.30 42,764,123.01 ........................... 27,753,496.73 27,753,496.73
6,031,906.41 Eastern Washington University Capital Projects061 5,898,104.56 4,319,761.98 ........................... 7,610,248.99 7,610,248.99
16,902,432.91 Washington State University Building062 3,277,729.32 18,844,377.15 ........................... 1,335,785.08 1,335,785.08
4,848,933.97 Central Washington University Capital Projects063 2,267,685.19 4,074,325.39 ........................... 3,042,293.77 3,042,293.77
29,310,278.23 University of Washington Building064 9,330,689.84 27,926,506.84 ........................... 10,714,461.23 10,714,461.23
5,976,653.32 Western Washington University Capital Projects065 6,841,698.38 9,572,955.54 ........................... 3,245,396.16 3,245,396.16
3,745,194.13 The Evergreen State College Capital Projects066 3,563,672.80 6,343,341.75 ........................... 965,525.18 965,525.18
...........................State Social and Health Services Construction075 5,371.39 ........................... ........................... 5,371.39 5,371.39
...........................Public Safety Reimbursable Bond245 4.12 ........................... ........................... 4.12 4.12
5.73 Community and Technical College Forest Reserve246 583,056.84 (547,045.43) ........................... 1,130,108.00 1,130,108.00
374,867.05 Thurston County Capital Facilities289 257,280.78 124,613.00 ........................... 507,534.83 507,534.83
(75,309.03)Capital Historic District Construction350 75,309.03 ........................... ...................................................... ...........................
...........................Gardner-Evans Higher Education Construction357 3,063,305.94 19,683.16 ........................... 3,043,622.78 3,043,622.78
3,776,172.89 1,593,151.65 4,026,541.88 3,776,172.89 1,342,782.66 364 Military Department Capital ...........................
362,426,378.67 857,414,210.59 66,332,943.17 60,280,914.80 $ $ $ $ $ $ 6,052,028.37 555,268,746.72 TOTAL CAPITAL PROJECTS FUNDS
PERMANENT FUNDS 55,879.03 Natural Resources Real Property Replacement04B $ $ $ $ $ 23,343,541.74 (1,105,587.68) ........................... 24,505,008.45 24,505,008.45 $
456,369.51 Agricultural Permanent601 474,153.40 828,938.90 ........................... 101,584.01 101,584.01
13.94 Millersylvania Park Trust603 5,345.80 ........................... ........................... 5,359.74 5,359.74
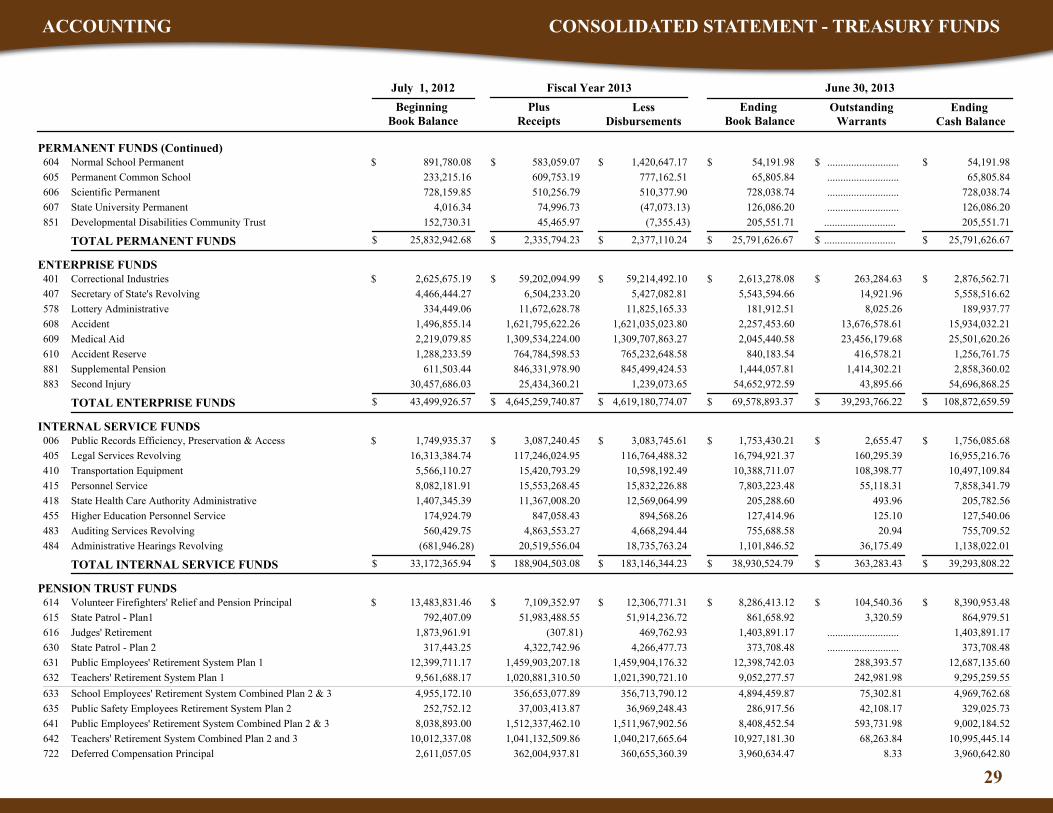
29
ACCOUNTING CONSOLIDATED STATEMENT - TREASURY FUNDSACCOUNTING CONSOLIDATED STATEMENT - TREASURY FUNDS
July 1, 2012
Outstanding Warrants
Ending Cash Balance
Ending Book Balance
LessDisbursements
Plus Receipts
Beginning Book Balance
Fiscal Year 2013 June 30, 2013
PERMANENT FUNDS (Continued) 583,059.07 Normal School Permanent604 $ $ $ $ $ 891,780.08 1,420,647.17 ........................... 54,191.98 54,191.98 $
609,753.19 Permanent Common School605 233,215.16 777,162.51 ........................... 65,805.84 65,805.84
510,256.79 Scientific Permanent606 728,159.85 510,377.90 ........................... 728,038.74 728,038.74
74,996.73 State University Permanent607 4,016.34 (47,073.13) ........................... 126,086.20 126,086.20
205,551.71 (7,355.43) 45,465.97 205,551.71 152,730.31 851 Developmental Disabilities Community Trust ...........................
25,832,942.68 2,377,110.24 ........................... 25,791,626.67 25,791,626.67 $ $ $ $ $ $ 2,335,794.23 TOTAL PERMANENT FUNDS
ENTERPRISE FUNDS 59,202,094.99 Correctional Industries401 $ $ $ $ $ 2,625,675.19 59,214,492.10 263,284.63 2,613,278.08 2,876,562.71 $
6,504,233.20 Secretary of State's Revolving407 4,466,444.27 5,427,082.81 14,921.96 5,543,594.66 5,558,516.62
11,672,628.78 Lottery Administrative578 334,449.06 11,825,165.33 8,025.26 181,912.51 189,937.77
1,621,795,622.26 Accident608 1,496,855.14 1,621,035,023.80 13,676,578.61 2,257,453.60 15,934,032.21
1,309,534,224.00 Medical Aid609 2,219,079.85 1,309,707,863.27 23,456,179.68 2,045,440.58 25,501,620.26
764,784,598.53 Accident Reserve610 1,288,233.59 765,232,648.58 416,578.21 840,183.54 1,256,761.75
846,331,978.90 Supplemental Pension881 611,503.44 845,499,424.53 1,414,302.21 1,444,057.81 2,858,360.02
54,696,868.25 43,895.66 1,239,073.65 25,434,360.21 54,652,972.59 30,457,686.03 883 Second Injury
43,499,926.57 4,619,180,774.07 108,872,659.59 69,578,893.37 $ $ $ $ $ $ 39,293,766.22 4,645,259,740.87 TOTAL ENTERPRISE FUNDS
INTERNAL SERVICE FUNDS 3,087,240.45 Public Records Efficiency, Preservation & Access006 $ $ $ $ $ 1,749,935.37 3,083,745.61 2,655.47 1,753,430.21 1,756,085.68 $
117,246,024.95 Legal Services Revolving405 16,313,384.74 116,764,488.32 160,295.39 16,794,921.37 16,955,216.76
15,420,793.29 Transportation Equipment410 5,566,110.27 10,598,192.49 108,398.77 10,388,711.07 10,497,109.84
15,553,268.45 Personnel Service415 8,082,181.91 15,832,226.88 55,118.31 7,803,223.48 7,858,341.79
11,367,008.20 State Health Care Authority Administrative418 1,407,345.39 12,569,064.99 493.96 205,288.60 205,782.56
847,058.43 Higher Education Personnel Service455 174,924.79 894,568.26 125.10 127,414.96 127,540.06
4,863,553.27 Auditing Services Revolving483 560,429.75 4,668,294.44 20.94 755,688.58 755,709.52
1,138,022.01 36,175.49 18,735,763.24 20,519,556.04 1,101,846.52 (681,946.28)484 Administrative Hearings Revolving
33,172,365.94 183,146,344.23 39,293,808.22 38,930,524.79 $ $ $ $ $ $ 363,283.43 188,904,503.08 TOTAL INTERNAL SERVICE FUNDS
PENSION TRUST FUNDS 7,109,352.97 Volunteer Firefighters' Relief and Pension Principal614 $ $ $ $ $ 13,483,831.46 12,306,771.31 104,540.36 8,286,413.12 8,390,953.48 $
51,983,488.55 State Patrol - Plan1615 792,407.09 51,914,236.72 3,320.59 861,658.92 864,979.51
(307.81)Judges' Retirement616 1,873,961.91 469,762.93 ........................... 1,403,891.17 1,403,891.17
4,322,742.96 State Patrol - Plan 2630 317,443.25 4,266,477.73 ........................... 373,708.48 373,708.48
1,459,903,207.18 Public Employees' Retirement System Plan 1631 12,399,711.17 1,459,904,176.32 288,393.57 12,398,742.03 12,687,135.60
1,020,881,310.50 Teachers' Retirement System Plan 1632 9,561,688.17 1,021,390,721.10 242,981.98 9,052,277.57 9,295,259.55
356,653,077.89 School Employees' Retirement System Combined Plan 2 & 3633 4,955,172.10 356,713,790.12 75,302.81 4,894,459.87 4,969,762.68
37,003,413.87 Public Safety Employees Retirement System Plan 2635 252,752.12 36,969,248.43 42,108.17 286,917.56 329,025.73
1,512,337,462.10 Public Employees' Retirement System Combined Plan 2 & 3641 8,038,893.00 1,511,967,902.56 593,731.98 8,408,452.54 9,002,184.52
1,041,132,509.86 Teachers' Retirement System Combined Plan 2 and 3642 10,012,337.08 1,040,217,665.64 68,263.84 10,927,181.30 10,995,445.14
362,004,937.81 Deferred Compensation Principal722 2,611,057.05 360,655,360.39 8.33 3,960,634.47 3,960,642.80

30
ACCOUNTING CONSOLIDATED STATEMENT - TREASURY FUNDS
July 1, 2012
Outstanding Warrants
Ending Cash Balance
Ending Book Balance
LessDisbursements
Plus Receipts
Beginning Book Balance
Fiscal Year 2013 June 30, 2013
PENSION TRUST FUNDS (Continued) 1,135,375.52 Judicial Retirement Principal729 $ $ $ $ $ 8,945.82 932,110.38 ........................... 212,210.96 212,210.96 $
355,582,423.84 LEOFFS Plan 1 Retirement819 3,474,398.04 355,597,827.45 57,317.59 3,458,994.43 3,516,312.02
370,811,318.48 LEOFFS Plan 2 Retirement829 1,861,442.16 370,562,014.95 29,358.19 2,110,745.69 2,140,103.88
4,069,887.75 9,602,565.68 10,041,216.86 4,069,887.75 3,631,236.57 882 Washington Judicial Retirement System ...........................
73,275,276.99 6,593,470,631.71 72,211,503.27 70,706,175.86 $ $ $ $ $ $ 1,505,327.41 6,590,901,530.58 TOTAL PENSION TRUST FUNDS
AGENCY FUNDS 188,799,303.07 Suspense01P $ $ $ $ $ 8,591,856.50 188,551,914.49 407,385.99 8,839,245.08 9,246,631.07 $
18,506.83 Undistributed Receipts01R ........................... 18,506.83 7,446.82 ........................... 7,446.82
1,910,096.48 Local Leasehold Excise Tax01T 16,150.84 1,879,477.88 ........................... 46,769.44 46,769.44
1,992,042,882.33 Local Sales and Use Tax034 229,370,293.40 2,221,413,175.73 ...................................................... ...........................
4,330,936,991.76 State Payroll Revolving035 23,180,239.13 4,329,584,588.68 2,017,954.99 24,532,642.21 26,550,597.20
25,343,242.33 Salary Reduction165 3,390,499.39 26,061,309.19 ........................... 2,672,432.53 2,672,432.53
6,476,310.97 Local Real Estate Excise Tax768 ........................... 6,476,310.97 ...................................................... ...........................
494.22 State Investment Board Commingled Monthly Bond795 ........................... 494.21 ........................... 0.01 0.01
640,485.16 State Investment Board Commingled Trust865 ........................... 640,485.16 ...................................................... ...........................
877 OASI Contribution ........................... ........................... ........................... ........................... ......................................................
264,549,039.26 6,774,626,263.14 38,523,877.07 36,091,089.27 $ $ $ $ $ $ 2,432,787.80 6,546,168,313.15 TOTAL AGENCY FUNDS
TOTAL TREASURY FUNDS $ $ $ $ $ 3,394,943,576.73 51,831,594,695.97 51,510,166,152.28 3,716,372,120.42 93,874,540.97 3,810,246,661.39 $

31
ACCOUNTING CONSOLIDATED STATEMENT - TRUST FUNDS
July 1, 2012
Outstanding Warrants
Ending Cash Balance
Ending Book Balance
LessDisbursements
Plus Receipts
Beginning Book Balance
Fiscal Year 2013 June 30, 2013
GENERAL FUND...........................Local Tax Administration06N $ $ $ $ $........................... ........................... ...................................................... ...........................$
(5,231.30)Natural Science, Wildlife and Environmental Ed. Partnership06W 5,231.30 ........................... ...................................................... ...........................
...........................Commercial Fisheries Buyback07F ........................... ........................... ...................................................... ...........................
(199,539.97)Foster Care Endowed Scholarship Trust08B 214,777.33 ........................... ........................... 15,237.36 15,237.36
11,393.92 Individual Development Account Program08E 261,842.92 129,357.08 ........................... 143,879.76 143,879.76
313,626,459.43 State Financial Aid08N 4,436,623.91 313,145,891.84 43,435.77 4,917,191.50 4,960,627.27
...........................Transportation Innovative Partnership08T ........................... ........................... ...................................................... ...........................
...........................Health Insurance Partnership10L ........................... ........................... ...................................................... ...........................
...........................Invasive Species Council10V ........................... ........................... ...................................................... ...........................
...........................Family and Medical Leave Enforcement10W ........................... ........................... ...................................................... ...........................
...........................Poet Laureate11M 5,115.55 ........................... ........................... 5,115.55 5,115.55
...........................Hospital Infection Control Grant11R ........................... ........................... ...................................................... ...........................
...........................Tourism Enterprise12A ........................... ........................... ...................................................... ...........................
...........................Outdoor Education and Recreation Prog12L 42,103.42 ........................... ........................... 42,103.42 42,103.42
...........................Geoduck Aquaculture Research12P ........................... ........................... ...................................................... ...........................
1,753,568.30 Fair131 192,513.80 1,800,834.07 ........................... 145,248.03 145,248.03
...........................State Trade Fair132 ........................... ........................... ...................................................... ...........................
826.12 Family Leave Insurance14F 388,318.62 ........................... ........................... 389,144.74 389,144.74
...........................Skeletal Human Remains Assistance14P 423,534.08 23,834.00 ........................... 399,700.08 399,700.08
(60,629.40)Disability Accommodation Revolving152 60,629.40 ........................... ...................................................... ...........................
...........................Food Animal Vet Scholarship15B ........................... ........................... ...................................................... ...........................
...........................Prev/Reduce Owner-Occupied Foreclosure Program15G ........................... ........................... ...................................................... ...........................
...........................Business Assistance15N ........................... ........................... ...................................................... ...........................
...........................Real Estate/Property Tax Admin Assistance16C ........................... ........................... ...................................................... ...........................
1.00 Washington State Flag16F 287.62 (122.34) ........................... 410.96 410.96
...........................Mortgage Recovery16K ........................... ........................... ...................................................... ...........................
121,564.71 Multiagency Permitting Team16R 51,671.81 102,424.03 ........................... 70,812.49 70,812.49
2,521,062.30 Home Visiting Services17B 182,531.22 1,586,825.48 18,200.00 1,116,768.04 1,134,968.04
1,352,421.23 Aerospace Training Student Loan17R 29,200.00 839,343.95 144.56 542,277.28 542,421.84
...........................Native Education Public-Private Partnership18C ........................... ........................... ...................................................... ...........................
...........................High School Completion18F ........................... ........................... ...................................................... ...........................
...........................Opportunity Scholarship Match Transfer18G ........................... ........................... ...................................................... ...........................
...........................Damage Prevention18N ........................... ........................... ...................................................... ...........................
1,000,000.00 Shelter to Housing Project18P ........................... 245,768.85 45,842.86 754,231.15 800,074.01
...........................Science, Technology, Engineering and Math Education Lighthouse18V ........................... ........................... ...................................................... ...........................
...........................Satellite System Management224 ........................... ........................... ...................................................... ...........................
352,697.41 Savings Incentive290 3,567,342.31 55,515.81 61.02 3,864,523.91 3,864,584.93
(1,745.58)Small Business Incubator486 1,745.58 ........................... ...................................................... ...........................
...........................Regional Transportation Investment District490 ........................... ........................... ...................................................... ...........................
...........................Agricultural Conservation Easements514 ........................... ........................... ...................................................... ...........................

32
ACCOUNTING CONSOLIDATED STATEMENT - TRUST FUNDS
July 1, 2012
Outstanding Warrants
Ending Cash Balance
Ending Book Balance
LessDisbursements
Plus Receipts
Beginning Book Balance
Fiscal Year 2013 June 30, 2013
GENERAL FUND (Continued)...........................Washington Graduate Fellowship Trust534 $ $ $ $ $ 489.80 ........................... ........................... 489.80 489.80 $
...........................Homeless Families Services551 124,634.31 ........................... ........................... 124,634.31 124,634.31
38,753.00 Conservation Assistance Revolving552 407,822.97 41,427.00 ........................... 405,148.97 405,148.97
...........................Washington Distinguished Professorship Trust653 ........................... ........................... ...................................................... ...........................
...........................College Faculty Awards Trust743 186.14 ........................... ........................... 186.14 186.14
1,140,252.57 Health Professional Loan Repayment & Scholarship Program747 4,819,835.88 1,961,815.01 ........................... 3,998,273.44 3,998,273.44
...........................Higher Education Coord. Board for Innovation and Quality748 ........................... ........................... ...................................................... ...........................
...........................Cross-State Trail781 473.10 ........................... ........................... 473.10 473.10
...........................Health Insurance Pool793 ........................... ........................... ...................................................... ...........................
...........................Stadium and Exhibition Center Construction817 ........................... ........................... ...................................................... ...........................
75,450.00 Four Year Student Child Care in Higher Education835 21,263.77 92,472.34 ........................... 4,241.43 4,241.43
7.85 0.04 7.85 7.81 837 Washington's Promise Scholarship ........................... ...........................
15,238,182.65 320,025,387.12 17,047,783.52 16,940,099.31 $ $ $ $ $ $ 107,684.21 321,727,303.78 TOTAL GENERAL FUND
SPECIAL REVENUE FUNDS 1,960,758.05 Crime Victims' Compensation01F $ $ $ $ $ 1,545,708.41 1,568,971.00 ........................... 1,937,495.46 1,937,495.46 $
752,006.76 Pilotage025 791,155.43 539,708.75 68.07 1,003,453.44 1,003,521.51
2,076,614.57 Industrial Insurance Premium Refund03K 1,089,902.77 1,147,842.84 146.73 2,018,674.50 2,018,821.23
16,287.49 Real Estate Education Program04F 905,744.57 33,510.36 ........................... 888,521.70 888,521.70
84,752.02 Oral History, State Library, and Archives06H 74,806.18 81,467.17 81.00 78,091.03 78,172.03
181,898.61 Securities Prosecution06J 240,162.96 107,510.19 1,824.61 314,551.38 316,375.99
350,507.68 Mortgage Lending Fraud Prosecution07A 995,148.65 338,098.08 ........................... 1,007,558.25 1,007,558.25
285,987.53 Organ and Tissue Donation Awareness07B 97,202.27 279,707.00 ........................... 103,482.80 103,482.80
(12,102.85)Contract Harvesting Revolving07E 5,945,046.86 809,440.66 84,292.54 5,123,503.35 5,207,795.89
26,221.96 "Helping Kids Speak"07J ........................... 22,266.98 3,409.00 3,954.98 7,363.98
...........................Special License Plate Applicant Trust07K ........................... ........................... ...................................................... ...........................
1,750.00 Legislative International Trade07L 5,002.13 2,024.40 ........................... 4,727.73 4,727.73
192.06 Produce Railcar Pool07N 90,263.85 ........................... ........................... 90,455.91 90,455.91
6.85 Commemorative Works07T 3,222.04 ........................... ........................... 3,228.89 3,228.89
456,705.52 Fish and Wildlife Enforcement Reward07V 1,007,929.02 727,236.58 78.98 737,397.96 737,476.94
39,414.67 Gonzaga University Alumni Association08C 4,105.37 39,071.66 3,273.67 4,448.38 7,722.05
104,703.67 Lighthouse Environmental Programs08F 11,752.96 103,504.32 ........................... 12,952.31 12,952.31
516.00 Prescription Drug Consortium08J 53,613.73 ........................... ........................... 54,129.73 54,129.73
42,081.67 "Ski & Ride Washington"08L 3,902.89 42,121.33 ........................... 3,863.23 3,863.23
103,241.91 State Parks Education and Enhancement08P 414,177.53 100,000.00 ........................... 417,419.44 417,419.44
434,461.48 Veterans Stewardship08V 631,980.91 441,207.68 1,286.24 625,234.71 626,520.95
133,874.88 "Washington's National Park Fund"08W 13,078.26 131,028.23 11,197.64 15,924.91 27,122.55
314,854.42 Eastern Washington Pheasant Enhancement098 561,079.54 262,561.46 ........................... 613,372.50 613,372.50
64,738.29 We Love Our Pets09A 7,774.58 60,687.64 5,399.31 11,825.23 17,224.54
243,698.00 Boating Safety Education Certification09B 122,829.89 69,451.10 545.00 297,076.79 297,621.79
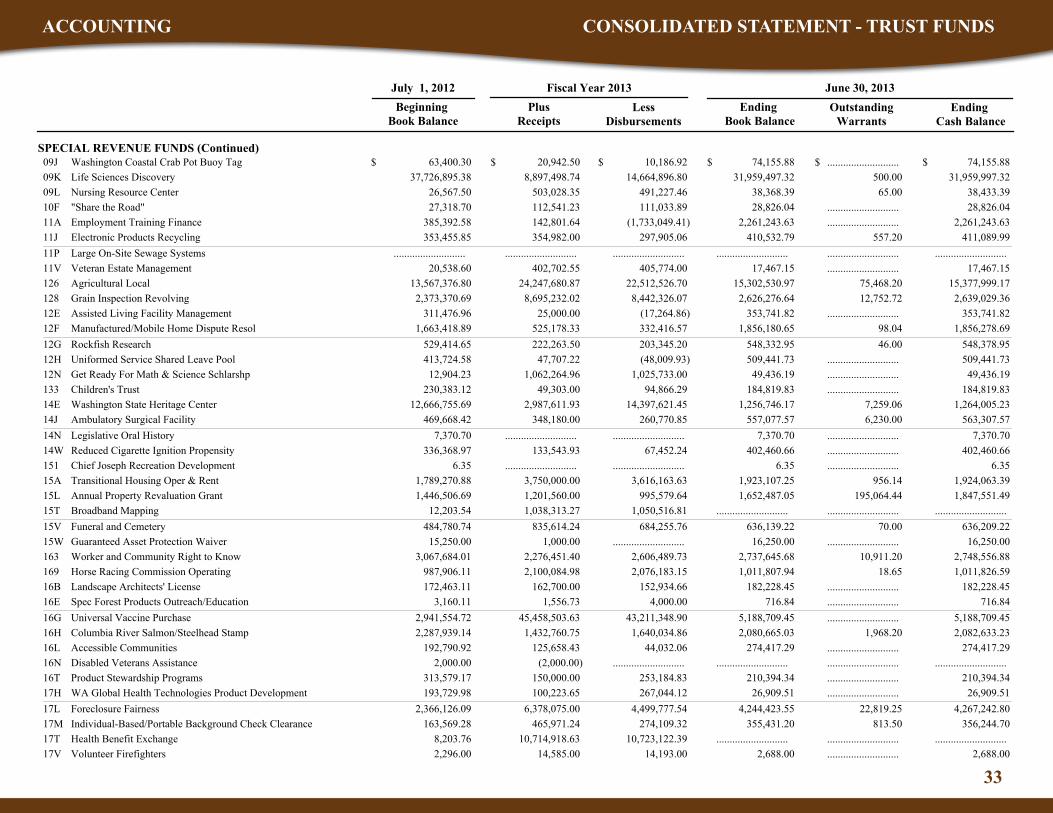
33
ACCOUNTING CONSOLIDATED STATEMENT - TRUST FUNDS
July 1, 2012
Outstanding Warrants
Ending Cash Balance
Ending Book Balance
LessDisbursements
Plus Receipts
Beginning Book Balance
Fiscal Year 2013 June 30, 2013
SPECIAL REVENUE FUNDS (Continued) 20,942.50 Washington Coastal Crab Pot Buoy Tag09J $ $ $ $ $ 63,400.30 10,186.92 ........................... 74,155.88 74,155.88 $
8,897,498.74 Life Sciences Discovery09K 37,726,895.38 14,664,896.80 500.00 31,959,497.32 31,959,997.32
503,028.35 Nursing Resource Center09L 26,567.50 491,227.46 65.00 38,368.39 38,433.39
112,541.23 "Share the Road"10F 27,318.70 111,033.89 ........................... 28,826.04 28,826.04
142,801.64 Employment Training Finance11A 385,392.58 (1,733,049.41) ........................... 2,261,243.63 2,261,243.63
354,982.00 Electronic Products Recycling11J 353,455.85 297,905.06 557.20 410,532.79 411,089.99
...........................Large On-Site Sewage Systems11P ........................... ........................... ...................................................... ...........................
402,702.55 Veteran Estate Management11V 20,538.60 405,774.00 ........................... 17,467.15 17,467.15
24,247,680.87 Agricultural Local126 13,567,376.80 22,512,526.70 75,468.20 15,302,530.97 15,377,999.17
8,695,232.02 Grain Inspection Revolving128 2,373,370.69 8,442,326.07 12,752.72 2,626,276.64 2,639,029.36
25,000.00 Assisted Living Facility Management12E 311,476.96 (17,264.86) ........................... 353,741.82 353,741.82
525,178.33 Manufactured/Mobile Home Dispute Resol12F 1,663,418.89 332,416.57 98.04 1,856,180.65 1,856,278.69
222,263.50 Rockfish Research12G 529,414.65 203,345.20 46.00 548,332.95 548,378.95
47,707.22 Uniformed Service Shared Leave Pool12H 413,724.58 (48,009.93) ........................... 509,441.73 509,441.73
1,062,264.96 Get Ready For Math & Science Schlarshp12N 12,904.23 1,025,733.00 ........................... 49,436.19 49,436.19
49,303.00 Children's Trust133 230,383.12 94,866.29 ........................... 184,819.83 184,819.83
2,987,611.93 Washington State Heritage Center14E 12,666,755.69 14,397,621.45 7,259.06 1,256,746.17 1,264,005.23
348,180.00 Ambulatory Surgical Facility14J 469,668.42 260,770.85 6,230.00 557,077.57 563,307.57
...........................Legislative Oral History14N 7,370.70 ........................... ........................... 7,370.70 7,370.70
133,543.93 Reduced Cigarette Ignition Propensity14W 336,368.97 67,452.24 ........................... 402,460.66 402,460.66
...........................Chief Joseph Recreation Development151 6.35 ........................... ........................... 6.35 6.35
3,750,000.00 Transitional Housing Oper & Rent15A 1,789,270.88 3,616,163.63 956.14 1,923,107.25 1,924,063.39
1,201,560.00 Annual Property Revaluation Grant15L 1,446,506.69 995,579.64 195,064.44 1,652,487.05 1,847,551.49
1,038,313.27 Broadband Mapping15T 12,203.54 1,050,516.81 ...................................................... ...........................
835,614.24 Funeral and Cemetery15V 484,780.74 684,255.76 70.00 636,139.22 636,209.22
1,000.00 Guaranteed Asset Protection Waiver15W 15,250.00 ........................... ........................... 16,250.00 16,250.00
2,276,451.40 Worker and Community Right to Know163 3,067,684.01 2,606,489.73 10,911.20 2,737,645.68 2,748,556.88
2,100,084.98 Horse Racing Commission Operating169 987,906.11 2,076,183.15 18.65 1,011,807.94 1,011,826.59
162,700.00 Landscape Architects' License16B 172,463.11 152,934.66 ........................... 182,228.45 182,228.45
1,556.73 Spec Forest Products Outreach/Education16E 3,160.11 4,000.00 ........................... 716.84 716.84
45,458,503.63 Universal Vaccine Purchase16G 2,941,554.72 43,211,348.90 ........................... 5,188,709.45 5,188,709.45
1,432,760.75 Columbia River Salmon/Steelhead Stamp16H 2,287,939.14 1,640,034.86 1,968.20 2,080,665.03 2,082,633.23
125,658.43 Accessible Communities16L 192,790.92 44,032.06 ........................... 274,417.29 274,417.29
(2,000.00)Disabled Veterans Assistance16N 2,000.00 ........................... ...................................................... ...........................
150,000.00 Product Stewardship Programs16T 313,579.17 253,184.83 ........................... 210,394.34 210,394.34
100,223.65 WA Global Health Technologies Product Development17H 193,729.98 267,044.12 ........................... 26,909.51 26,909.51
6,378,075.00 Foreclosure Fairness17L 2,366,126.09 4,499,777.54 22,819.25 4,244,423.55 4,267,242.80
465,971.24 Individual-Based/Portable Background Check Clearance17M 163,569.28 274,109.32 813.50 355,431.20 356,244.70
10,714,918.63 Health Benefit Exchange17T 8,203.76 10,723,122.39 ...................................................... ...........................
14,585.00 Volunteer Firefighters17V 2,296.00 14,193.00 ........................... 2,688.00 2,688.00

34
ACCOUNTING CONSOLIDATED STATEMENT - TRUST FUNDS
July 1, 2012
Outstanding Warrants
Ending Cash Balance
Ending Book Balance
LessDisbursements
Plus Receipts
Beginning Book Balance
Fiscal Year 2013 June 30, 2013
SPECIAL REVENUE FUNDS (Continued) 22,631.21 Local Government Administrative Hearings180 $ $ $ $ $ 188,725.53 ........................... ........................... 211,356.74 211,356.74 $
(0.01)Clarke-McNary189 ........................... (0.01) ...................................................... ...........................
6,333,990.05 Investing In Innovation18A 2,925,950.59 6,498,414.74 379.60 2,761,525.90 2,761,905.50
1,100,811.61 Educator Certification Processing18E 345,612.41 876,061.22 184.72 570,362.80 570,547.52
33,889.32 Music Matters Awareness18M 2,492.00 32,685.32 ........................... 3,696.00 3,696.00
(1,002,610.56)Forest Fire Protection Assessment190 3,800,605.91 (2,167,489.32) 29,010.98 4,965,484.67 4,994,495.65
(336,663.47)State Forest Nursery Revolving193 2,661,197.33 1,457,869.54 20,771.42 866,664.32 887,435.74
771.97 Energy195 437,810.61 213,626.57 480.00 224,956.01 225,436.01
386,135.61 Statute Law Committee Publications197 691,981.46 319,629.02 77.27 758,488.05 758,565.32
(498,663.47)Access Road Revolving198 8,558,808.17 2,260,025.57 55,784.83 5,800,119.13 5,855,903.96
1,357,488.80 School for the Blind19B 214,660.57 815,659.70 ........................... 756,489.67 756,489.67
2,601.67 4-H Program19E ........................... 2,321.67 ........................... 280.00 280.00
19,554.69 Center for Childhood Deafness and Hearing Loss19H ........................... 250.00 ........................... 19,304.69 19,304.69
404,696.82 Mobile Home Park Relocation205 201,136.17 114,620.87 ........................... 491,212.12 491,212.12
1,050,025.34 Cost of Supervision206 1,188,040.33 1,554,904.90 485.50 683,160.77 683,646.27
1,175,306.64 Regional Fisheries Enhancement Group209 2,079,597.38 1,441,754.31 468.16 1,813,149.71 1,813,617.87
...........................State Flower20A ........................... ........................... ...................................................... ...........................
536,113.35 Fire Protection Contractor License210 1,020,266.03 685,447.79 3,922.00 870,931.59 874,853.59
6,923.00 Veterans' Emblem213 12,076.45 16.00 ........................... 18,983.45 18,983.45
7,256.85 Temporary Worker Housing214 149,382.65 26,760.49 824.00 129,879.01 130,703.01
1,122,951.77 Air Operating Permit219 774,657.33 1,231,533.50 ........................... 666,075.60 666,075.60
9,174,744.85 Fingerprint Identification225 3,831,453.90 8,598,309.45 244,352.78 4,407,889.30 4,652,242.08
33,740.00 Coastal Crab259 111,757.45 40,942.41 ........................... 104,555.04 104,555.04
(363.97)Adult Family Home274 84,246.32 (312,392.01) ........................... 396,274.36 396,274.36
2,132,023.95 Impaired Driving Safety281 200,736.34 1,982,161.50 ........................... 350,598.79 350,598.79
447,041.31 Juvenile Accountability Incentive283 1,447,636.73 770,798.28 ........................... 1,123,879.76 1,123,879.76
66,078.30 Sea Cucumber Dive Fishery294 112,791.12 ........................... ........................... 178,869.42 178,869.42
37,306.95 Sea Urchin Dive Fishery295 29,377.18 36,112.00 ........................... 30,572.13 30,572.13
1,907,645.20 Pipeline Safety297 1,689,070.44 2,417,485.52 655.78 1,179,230.12 1,179,885.90
188,353.50 Geologists'298 609,091.31 250,775.45 270.00 546,669.36 546,939.36
25,766,704.54 Financial Services Regulation300 10,191,647.72 22,787,537.79 21,787.78 13,170,814.47 13,192,602.25
5,243.00 Puget Sound Crab Pot Buoy Tag320 17,042.08 4,374.08 ........................... 17,911.00 17,911.00
10,305,726.55 Surplus and Donated Food Commodities Revolving416 4,502,848.77 9,865,326.16 ........................... 4,943,249.16 4,943,249.16
409,708.09 Anti-Trust Revolving424 3,392,321.96 877,435.38 ........................... 2,924,594.67 2,924,594.67
10,065.00 Financial Education Public-Private Partnership480 122,324.96 93,961.76 ........................... 38,428.20 38,428.20
899,364.69 Horse Racing Owners' Bonus/Breeder Awards485 301,153.57 934,531.01 1,287.72 265,987.25 267,274.97
109,768,422.49 Toll Collection495 8,513,865.57 108,706,899.60 23,705.40 9,575,388.46 9,599,093.86
833,704.82 Future Teachers Conditional Scholarship496 2,532,494.16 448,961.73 ........................... 2,917,237.25 2,917,237.25
82,112.84 Horse Racing Commission Class C Purse Fund497 43,683.63 85,655.75 ........................... 40,140.72 40,140.72
123,599.01 Washington State Council of Fire Fighters Benevolent498 12,444.38 123,627.02 ........................... 12,416.37 12,416.37

35
ACCOUNTING CONSOLIDATED STATEMENT - TRUST FUNDS
July 1, 2012
Outstanding Warrants
Ending Cash Balance
Ending Book Balance
LessDisbursements
Plus Receipts
Beginning Book Balance
Fiscal Year 2013 June 30, 2013
SPECIAL REVENUE FUNDS (Continued) 294,963.65 Law Enforcement Memorial499 $ $ $ $ $ 43,102.00 290,646.91 26,058.76 47,418.74 73,477.50 $
88,581,838.61 Liquor Revolving501 21,961,825.80 100,430,576.18 266,604.42 10,113,088.23 10,379,692.65
228,709.16 Tuition Recovery503 4,977,948.32 50,502.79 1.21 5,156,154.69 5,156,155.90
438,835.18 DNA Data Base515 744,946.31 377,518.20 1,055.44 806,263.29 807,318.73
14,509,677.89 Fruit and Vegetable Inspection516 2,409,857.68 13,853,988.15 13,538.83 3,065,547.42 3,079,086.25
53,670,301.53 Federal Food Service Revolving536 2,165,302.13 53,269,967.09 10,854.23 2,565,636.57 2,576,490.80
3,418,794.39 Telephone Assistance539 1,707,448.11 3,773,479.50 158,233.84 1,352,763.00 1,510,996.84
4,156,317.93 Telecommunication Devices for the Hearing & Speech Impaired540 1,934,399.98 4,659,342.87 1,035.21 1,431,375.04 1,432,410.25
12,107,191.16 Performance Audits of Government553 5,316,859.27 13,253,710.69 50.70 4,170,339.74 4,170,390.44
24,456,521.18 Community Technical College Innovation561 7,035,057.62 19,963,856.44 ........................... 11,527,722.36 11,527,722.36
591.05 Rural Rehabilitation687 282,587.41 10,000.00 ........................... 273,178.46 273,178.46
433.40 Federal Local Rail Service Assistance688 75,940.09 ........................... ........................... 76,373.49 76,373.49
334,403.83 Child Care Facility Revolving731 764,606.60 366,680.54 ........................... 732,329.89 732,329.89
...........................Nursing Home Civil Penalties732 1,143,777.02 (297,162.26) ........................... 1,440,939.28 1,440,939.28
91,210.82 Hanford Area Economic Investment746 86,750.20 130,308.27 ........................... 47,652.75 47,652.75
16,145.62 Governor's Interagency Committee of State Employed Women749 44,359.93 19,880.68 ........................... 40,624.87 40,624.87
22,378,054.52 Basic Health Plan Subscription761 2,651,976.30 21,502,255.78 9,944.14 3,527,775.04 3,537,719.18
(69,364.74)Center for the Improvement of Student Learning763 106,994.42 ........................... ........................... 37,629.68 37,629.68
51,200.00 Commission on Higher Ed Prof Student Ex Program773 ........................... ........................... ........................... 51,200.00 51,200.00
221,540.59 University of Washington License Plate774 60,101.97 261,407.88 ........................... 20,234.68 20,234.68
524,031.56 Washington State University License Plate776 44,286.66 522,059.89 ........................... 46,258.33 46,258.33
22,869.00 Western Washington University License Plate778 2,377.67 23,312.33 ........................... 1,934.34 1,934.34
29,192.29 Eastern Washington University License Plate779 23,714.59 32,748.00 ........................... 20,158.88 20,158.88
722,718.98 School Zone Safety Account780 619,475.02 493,678.40 ........................... 848,515.60 848,515.60
18,001.68 Central Washington University License Plate783 1,267.00 12,975.66 ........................... 6,293.02 6,293.02
262,906,836.73 Miscellaneous Transportation Programs784 (6,973,494.68) 250,002,556.15 82,838.58 5,930,785.90 6,013,624.48
4,095.01 The Evergreen State College License Plate786 12,326.51 4,500.00 ........................... 11,921.52 11,921.52
74,991.60 Advanced Environmental Mitigation Revolving789 579,821.07 (961,344.55) ........................... 1,616,157.22 1,616,157.22
1,688,954.38 Stadium and Exhibition Center816 24,459,833.78 266,794.26 ........................... 25,881,993.90 25,881,993.90
1,502,175.00 Impaired Physician821 274,687.62 1,516,602.12 100.00 260,260.50 260,360.50
2,950.00 Livestock Nutrient Management823 63,964.71 (3,104.93) ........................... 70,019.64 70,019.64
3,645,789.27 Developmental Disabilities Endowment Trust833 471,125.99 3,667,400.88 ........................... 449,514.38 449,514.38
17,484.35 Capitol Furnishings Preservation Committee834 67,104.92 20,985.44 ........................... 63,603.83 63,603.83
20,097,012.86 Federal Forest Revolving878 3,711.40 20,098,482.32 ........................... 2,241.94 2,241.94
(1,797,719.26)Advance Right-of-Way Revolving880 2,189,776.09 10,066.69 ........................... 381,990.14 381,990.14
14,402,255.39 Gambling Revolving884 3,971,552.57 14,262,563.58 9,674.84 4,111,244.38 4,120,919.22
863,064.95 Plumbing Certificate885 222,787.63 753,644.28 276.05 332,208.30 332,484.35
1,320,165.64 1,730.54 1,834,544.98 1,841,175.03 1,318,435.10 1,311,805.05 892 Pressure Systems Safety
246,111,367.28 838,092,166.10 247,468,134.16 246,034,489.04 $ $ $ $ $ $ 1,433,645.12 838,015,287.86 TOTAL SPECIAL REVENUE FUNDS
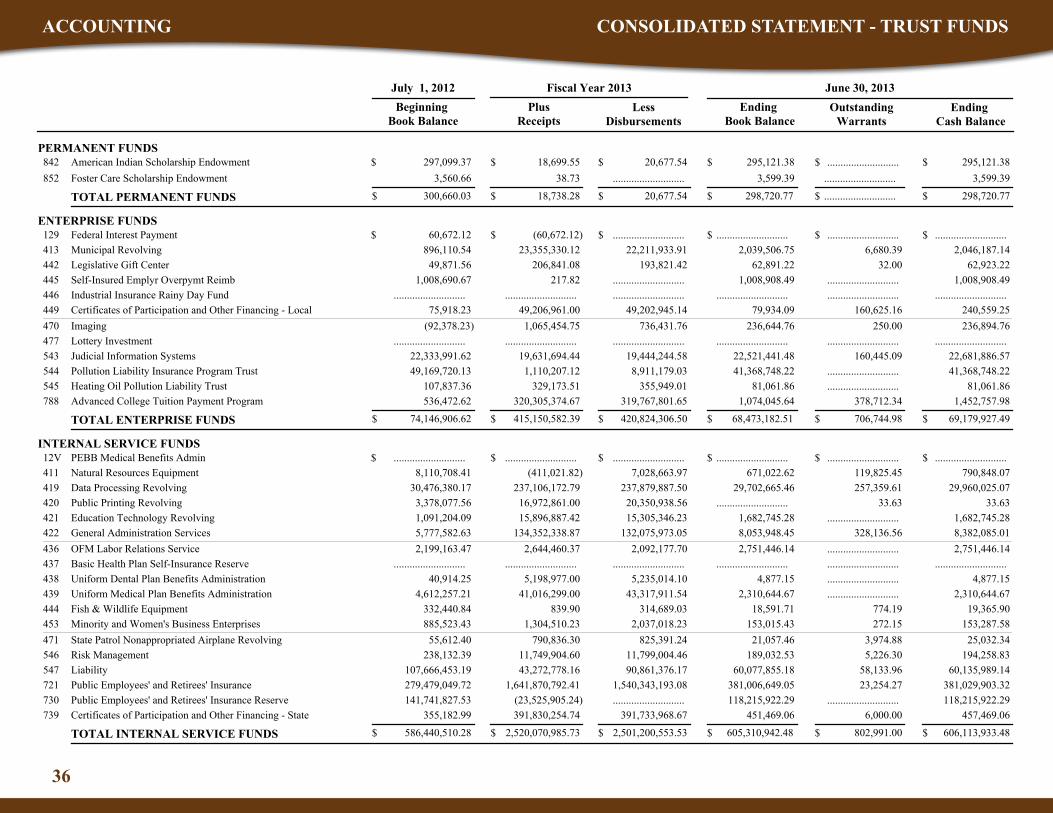
36
ACCOUNTING CONSOLIDATED STATEMENT - TRUST FUNDS
July 1, 2012
Outstanding Warrants
Ending Cash Balance
Ending Book Balance
LessDisbursements
Plus Receipts
Beginning Book Balance
Fiscal Year 2013 June 30, 2013
PERMANENT FUNDS 18,699.55 American Indian Scholarship Endowment842 $ $ $ $ $ 297,099.37 20,677.54 ........................... 295,121.38 295,121.38 $
3,599.39 38.73 3,599.39 3,560.66 852 Foster Care Scholarship Endowment ........................... ...........................
300,660.03 20,677.54 ........................... 298,720.77 298,720.77 $ $ $ $ $ $ 18,738.28 TOTAL PERMANENT FUNDS
ENTERPRISE FUNDS(60,672.12)Federal Interest Payment129 $ $ $ $ $ 60,672.12 ........................... ...................................................... ...........................$
23,355,330.12 Municipal Revolving413 896,110.54 22,211,933.91 6,680.39 2,039,506.75 2,046,187.14
206,841.08 Legislative Gift Center442 49,871.56 193,821.42 32.00 62,891.22 62,923.22
217.82 Self-Insured Emplyr Overpymt Reimb445 1,008,690.67 ........................... ........................... 1,008,908.49 1,008,908.49
...........................Industrial Insurance Rainy Day Fund446 ........................... ........................... ...................................................... ...........................
49,206,961.00 Certificates of Participation and Other Financing - Local449 75,918.23 49,202,945.14 160,625.16 79,934.09 240,559.25
1,065,454.75 Imaging470 (92,378.23) 736,431.76 250.00 236,644.76 236,894.76
...........................Lottery Investment477 ........................... ........................... ...................................................... ...........................
19,631,694.44 Judicial Information Systems543 22,333,991.62 19,444,244.58 160,445.09 22,521,441.48 22,681,886.57
1,110,207.12 Pollution Liability Insurance Program Trust544 49,169,720.13 8,911,179.03 ........................... 41,368,748.22 41,368,748.22
329,173.51 Heating Oil Pollution Liability Trust545 107,837.36 355,949.01 ........................... 81,061.86 81,061.86
1,452,757.98 378,712.34 319,767,801.65 320,305,374.67 1,074,045.64 536,472.62 788 Advanced College Tuition Payment Program
74,146,906.62 420,824,306.50 69,179,927.49 68,473,182.51 $ $ $ $ $ $ 706,744.98 415,150,582.39 TOTAL ENTERPRISE FUNDS
INTERNAL SERVICE FUNDS...........................PEBB Medical Benefits Admin12V $ $ $ $ $........................... ........................... ...................................................... ...........................$
(411,021.82)Natural Resources Equipment411 8,110,708.41 7,028,663.97 119,825.45 671,022.62 790,848.07
237,106,172.79 Data Processing Revolving419 30,476,380.17 237,879,887.50 257,359.61 29,702,665.46 29,960,025.07
16,972,861.00 Public Printing Revolving420 3,378,077.56 20,350,938.56 33.63 ........................... 33.63
15,896,887.42 Education Technology Revolving421 1,091,204.09 15,305,346.23 ........................... 1,682,745.28 1,682,745.28
134,352,338.87 General Administration Services422 5,777,582.63 132,075,973.05 328,136.56 8,053,948.45 8,382,085.01
2,644,460.37 OFM Labor Relations Service436 2,199,163.47 2,092,177.70 ........................... 2,751,446.14 2,751,446.14
...........................Basic Health Plan Self-Insurance Reserve437 ........................... ........................... ...................................................... ...........................
5,198,977.00 Uniform Dental Plan Benefits Administration438 40,914.25 5,235,014.10 ........................... 4,877.15 4,877.15
41,016,299.00 Uniform Medical Plan Benefits Administration439 4,612,257.21 43,317,911.54 ........................... 2,310,644.67 2,310,644.67
839.90 Fish & Wildlife Equipment444 332,440.84 314,689.03 774.19 18,591.71 19,365.90
1,304,510.23 Minority and Women's Business Enterprises453 885,523.43 2,037,018.23 272.15 153,015.43 153,287.58
790,836.30 State Patrol Nonappropriated Airplane Revolving471 55,612.40 825,391.24 3,974.88 21,057.46 25,032.34
11,749,904.60 Risk Management546 238,132.39 11,799,004.46 5,226.30 189,032.53 194,258.83
43,272,778.16 Liability547 107,666,453.19 90,861,376.17 58,133.96 60,077,855.18 60,135,989.14
1,641,870,792.41 Public Employees' and Retirees' Insurance721 279,479,049.72 1,540,343,193.08 23,254.27 381,006,649.05 381,029,903.32
(23,525,905.24)Public Employees' and Retirees' Insurance Reserve730 141,741,827.53 ........................... ........................... 118,215,922.29 118,215,922.29
457,469.06 6,000.00 391,733,968.67 391,830,254.74 451,469.06 355,182.99 739 Certificates of Participation and Other Financing - State
586,440,510.28 2,501,200,553.53 606,113,933.48 605,310,942.48 $ $ $ $ $ $ 802,991.00 2,520,070,985.73 TOTAL INTERNAL SERVICE FUNDS

37
ACCOUNTING CONSOLIDATED STATEMENT - TRUST FUNDS
July 1, 2012
Outstanding Warrants
Ending Cash Balance
Ending Book Balance
LessDisbursements
Plus Receipts
Beginning Book Balance
Fiscal Year 2013 June 30, 2013
PRIVATE PURPOSE FUNDS 68,962,566.00 Unclaimed Personal Property196 $ $ $ $ $ 567,856.43 68,672,314.40 6,729,355.24 858,108.03 7,587,463.27 $
...........................Department of Social and Health Services Trust738 53,654.52 ........................... ........................... 53,654.52 53,654.52
750 Rural Health Access ........................... ........................... ........................... ........................... ......................................................
621,510.95 68,672,314.40 7,641,117.79 911,762.55 $ $ $ $ $ $ 6,729,355.24 68,962,566.00 TOTAL PRIVATE PURPOSE FUNDS
PENSION TRUST FUNDS 4,699,517.98 Higher Ed Retirement Plan Supplemental Benefit646 $ $ $ $ $ 13,930.05 4,703,080.10 ........................... 10,367.93 10,367.93 $
13,930.05 4,703,080.10 ........................... 10,367.93 10,367.93 $ $ $ $ $ $ 4,699,517.98 TOTAL PENSION TRUST FUNDS
AGENCY FUNDS 69,742,083.52 County Enhanced 911 Excise Tax17A $ $ $ $ $ 5,823,396.20 69,733,173.64 ........................... 5,832,306.08 5,832,306.08 $
4,263,659.31 Washington State Combined Fund Drive525 1,248,498.73 4,316,375.07 21,686.29 1,195,782.97 1,217,469.26
318,351,029.10 Natural Resources Deposit660 6,958,071.08 317,132,273.38 338,526.62 8,176,826.80 8,515,353.42
3,789,037.03 Centennial Document Preservation and Modernization734 3,037,146.34 3,037,146.34 ........................... 3,789,037.03 3,789,037.03
...........................High Occupancy Vehicle737 ........................... ........................... ...................................................... ...........................
16,978.58 Maritime Historic Restoration and Preservation757 17,057.65 17,311.98 ........................... 16,724.25 16,724.25
7,402,217.75 Local Tourism Promotion797 645,713.75 7,421,830.00 ........................... 626,101.50 626,101.50
(940.00) 940.00 798 Real Estate Excise Tax Electronic Technology ........................... ........................... ......................................................
17,730,823.75 401,658,110.41 19,996,991.54 19,636,778.63 $ $ $ $ $ $ 360,212.91 403,564,065.29 TOTAL AGENCY FUNDS
TOTAL TREASURER'S TRUST FUNDS $ $ $ $ $ 940,603,891.61 4,572,209,047.31 4,555,196,595.70 957,616,343.22 10,140,633.46 967,756,976.68 $

38
ACCOUNTING DISTRIBUTIONS TO LOCAL GOVERNMENTS BY FUND
STATE TREASURER'S REVENUE DISTRIBUTION PROGRAM
Amount toCities/Towns/DistrictsUniversities/Colleges
FundNo.
Amount toCounties
Amount Distributed Increase or Decrease
Amount Percent2013 2012
State-Collected Revenue 19.46 $Annexation Tax State Share ......................... 14,334,246.19 14,334,246.19 2,335,038.36 11,999,207.83 034 $ $ $$Annexation Tax State Share
(3.47)Autopsy Cost Reimbursements ......................... 1,381,414.39 1,381,414.39 (49,612.47) 1,431,026.86 02KAutopsy Cost Reimbursements
2.41 Beer Tax 20,624.88 14,219.31 34,844.19 818.68 34,025.51 001Beer Tax
(30.56)Brokered Natural Gas ......................... 7,364,315.28 7,364,315.28 (3,241,675.49) 10,605,990.77 034Brokered Natural Gas
65.71 Business Licensing Service ......................... 5,827,817.94 5,827,817.94 2,310,972.33 3,516,845.61 03NBusiness Licensing Service
(6.80)Centennial Document Preservation ......................... 3,037,146.34 3,037,146.34 (221,691.17) 3,258,837.51 734Centennial Document Preservation
39.69 City Assistance Account ......................... 4,498,919.92 4,498,919.92 1,278,327.16 3,220,592.76 09PCity Assistance Account
2.58 Columbia River Water Delivery ......................... 6,215,797.00 6,215,797.00 156,220.00 6,059,577.00 15KColumbia River Water Delivery
47.84 Communications Tax ......................... 37,010,859.85 37,010,859.85 11,975,784.32 25,035,075.53 034Communications Tax
5,202.89 Congestion Reduction Charge1 ......................... 26,847,554.95 26,847,554.95 26,341,273.15 506,281.80 108Congestion Reduction Charge
N/A County Adult Court Costs .................................................. 331,000.00 331,000.00 331,000.00 03LCounty Adult Court Costs
1.34 County Arterial Preservation ......................... 15,166,460.67 15,166,460.67 200,644.54 14,965,816.13 186County Arterial Preservation
N/ACounty Arterial Preservation - Highway Safety Acct2 .................................................. 3,500,000.00 3,500,000.00 3,500,000.00 106County Arterial Preservation - Highway Safety Acct
39.69 County Assistance Account ......................... 4,498,919.90 4,498,919.90 1,278,327.16 3,220,592.74 09PCounty Assistance Account
2.39 County Enhanced 911 ......................... 69,748,045.03 69,748,045.03 1,630,483.81 68,117,561.22 17ACounty Enhanced 911
4.55 Criminal Justice Assistance ......................... 35,210,421.60 35,210,421.60 1,533,659.35 33,676,762.25 03LCriminal Justice Assistance
4.58 Criminal Justice Assistance ......................... 13,954,152.96 13,954,152.96 611,135.72 13,343,017.24 03MCriminal Justice Assistance
14.81 Deferred Property Taxes 20,673.72 1,696,447.45 1,717,121.17 221,481.46 1,495,639.71 001Deferred Property Taxes
5.57 DNR PILT NAP/NRCA ......................... 1,448,689.77 1,448,689.77 76,468.15 1,372,221.62 001DNR PILT NAP/NRCA
104.86 Federal Forest Interest ......................... 3,714.84 3,714.84 1,901.46 1,813.38 878Federal Forest Interest
5.74 Fire Insurance Premium Tax ......................... 4,048,996.57 4,048,996.57 219,629.51 3,829,367.06 001Fire Insurance Premium Tax
9.62 Forest Excise Tax ......................... 33,437,636.01 33,437,636.01 2,934,371.39 30,503,264.62 02WForest Excise Tax
(20.04)Harbor Leases ......................... 65,707.56 65,707.56 (16,469.61) 82,177.17 02RHarbor Leases
1.56 High Capacity Transp - MVET ......................... 67,413,711.11 67,413,711.11 1,036,786.82 66,376,924.29 108High Capacity Transp - MVET
7.67 High Capacity Transportation Sales/Rentcar ......................... 563,464,084.13 563,464,084.13 40,154,477.34 523,309,606.79 034High Capacity Transportation Sales/Rentcar
N/A Hospital Benefit Zone .................................................. 2,000,000.00 2,000,000.00 2,000,000.00 034Hospital Benefit Zone
(4.90)Impaired Driving 793,000.00 1,188,500.00 1,981,500.00 (102,000.00) 2,083,500.00 281Impaired Driving
4.52 Juvenile Criminal Justice ......................... 40,076,944.88 40,076,944.88 1,734,714.44 38,342,230.44 034Juvenile Criminal Justice
5.15 Liquor Control Board Receipts 39,519,539.21 9,918,460.79 49,438,000.00 2,420,109.00 47,017,891.00 501Liquor Control Board Receipts
(74.56)Liquor Excise Tax 5,268,515.76 1,317,128.95 6,585,644.71 (19,303,728.65) 25,889,373.36 107Liquor Excise Tax
6.42 Local Criminal Justice (Sales Tax) 71,849,431.26 46,333,232.34 118,182,663.60 7,124,580.43 111,058,083.17 034Local Criminal Justice (Sales Tax)
N/A Local Gov. Financial Assist. - Health Dist. .................................................. 24,000,000.00 24,000,000.00 24,000,000.00 001Local Gov. Financial Assist. - Health Dist.
(7.40)Local Infrastructure Financing Tool Program 1,119,094.00 1,000,000.00 2,119,094.00 (169,252.00) 2,288,346.00 034Local Infrastructure Financing Tool Program
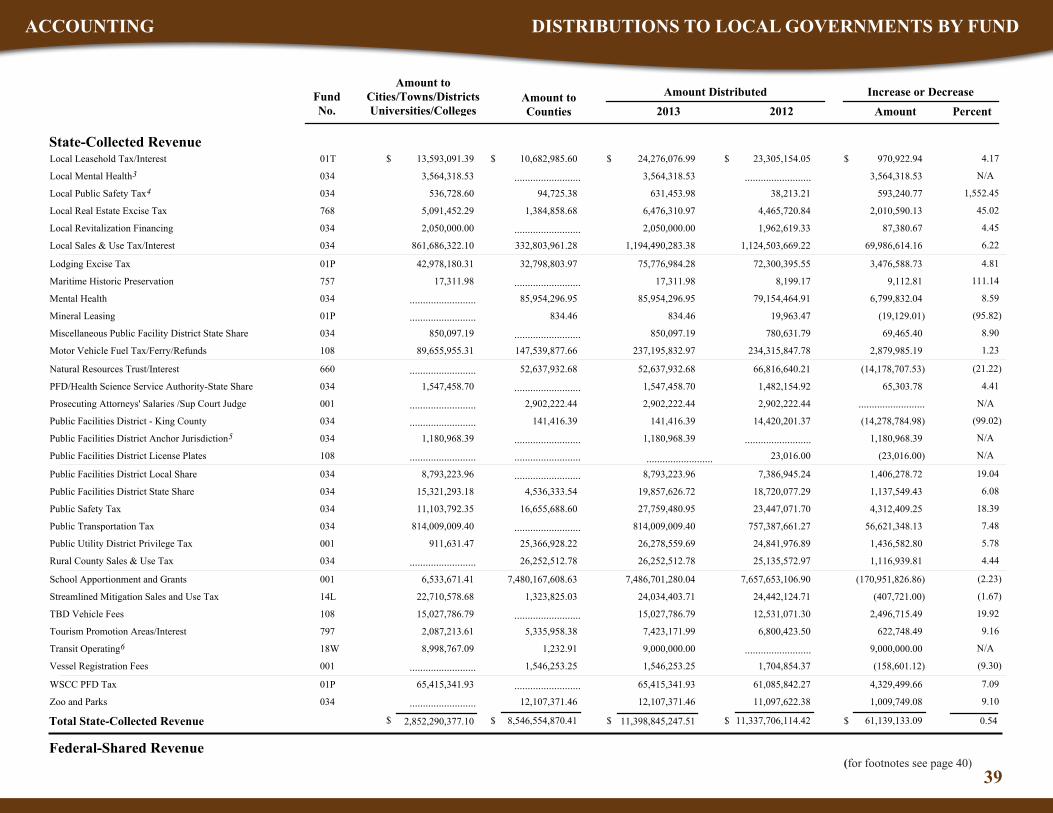
39
ACCOUNTING DISTRIBUTIONS TO LOCAL GOVERNMENTS BY FUND
(for footnotes see page 40)
Amount toCities/Towns/DistrictsUniversities/Colleges
FundNo.
Amount toCounties
Amount Distributed Increase or Decrease
Amount Percent2013 2012
State-Collected Revenue 4.17 $Local Leasehold Tax/Interest 13,593,091.39 10,682,985.60 24,276,076.99 970,922.94 23,305,154.05 01T $ $ $$Local Leasehold Tax/Interest
N/ALocal Mental Health3 ......................... ......................... 3,564,318.53 3,564,318.53 3,564,318.53 034Local Mental Health
1,552.45 Local Public Safety Tax4 536,728.60 94,725.38 631,453.98 593,240.77 38,213.21 034Local Public Safety Tax
45.02 Local Real Estate Excise Tax 5,091,452.29 1,384,858.68 6,476,310.97 2,010,590.13 4,465,720.84 768Local Real Estate Excise Tax
4.45 Local Revitalization Financing ......................... 2,050,000.00 2,050,000.00 87,380.67 1,962,619.33 034Local Revitalization Financing
6.22 Local Sales & Use Tax/Interest 861,686,322.10 332,803,961.28 1,194,490,283.38 69,986,614.16 1,124,503,669.22 034Local Sales & Use Tax/Interest
4.81 Lodging Excise Tax 42,978,180.31 32,798,803.97 75,776,984.28 3,476,588.73 72,300,395.55 01PLodging Excise Tax
111.14 Maritime Historic Preservation ......................... 17,311.98 17,311.98 9,112.81 8,199.17 757Maritime Historic Preservation
8.59 Mental Health ......................... 85,954,296.95 85,954,296.95 6,799,832.04 79,154,464.91 034Mental Health
(95.82)Mineral Leasing ......................... 834.46 834.46 (19,129.01) 19,963.47 01PMineral Leasing
8.90 Miscellaneous Public Facility District State Share ......................... 850,097.19 850,097.19 69,465.40 780,631.79 034Miscellaneous Public Facility District State Share
1.23 Motor Vehicle Fuel Tax/Ferry/Refunds 89,655,955.31 147,539,877.66 237,195,832.97 2,879,985.19 234,315,847.78 108Motor Vehicle Fuel Tax/Ferry/Refunds
(21.22)Natural Resources Trust/Interest ......................... 52,637,932.68 52,637,932.68 (14,178,707.53) 66,816,640.21 660Natural Resources Trust/Interest
4.41 PFD/Health Science Service Authority-State Share ......................... 1,547,458.70 1,547,458.70 65,303.78 1,482,154.92 034PFD/Health Science Service Authority-State Share
N/A Prosecuting Attorneys' Salaries /Sup Court Judge .................................................. 2,902,222.44 2,902,222.44 2,902,222.44 001Prosecuting Attorneys' Salaries /Sup Court Judge
(99.02)Public Facilities District - King County ......................... 141,416.39 141,416.39 (14,278,784.98) 14,420,201.37 034Public Facilities District - King County
N/APublic Facilities District Anchor Jurisdiction5 ......................... ......................... 1,180,968.39 1,180,968.39 1,180,968.39 034Public Facilities District Anchor Jurisdiction
N/APublic Facilities District License Plates .................................................. ......................... (23,016.00) 23,016.00 108Public Facilities District License Plates
19.04 Public Facilities District Local Share ......................... 8,793,223.96 8,793,223.96 1,406,278.72 7,386,945.24 034Public Facilities District Local Share
6.08 Public Facilities District State Share 15,321,293.18 4,536,333.54 19,857,626.72 1,137,549.43 18,720,077.29 034Public Facilities District State Share
18.39 Public Safety Tax 11,103,792.35 16,655,688.60 27,759,480.95 4,312,409.25 23,447,071.70 034Public Safety Tax
7.48 Public Transportation Tax ......................... 814,009,009.40 814,009,009.40 56,621,348.13 757,387,661.27 034Public Transportation Tax
5.78 Public Utility District Privilege Tax 911,631.47 25,366,928.22 26,278,559.69 1,436,582.80 24,841,976.89 001Public Utility District Privilege Tax
4.44 Rural County Sales & Use Tax ......................... 26,252,512.78 26,252,512.78 1,116,939.81 25,135,572.97 034Rural County Sales & Use Tax
(2.23)School Apportionment and Grants 6,533,671.41 7,480,167,608.63 7,486,701,280.04 (170,951,826.86) 7,657,653,106.90 001School Apportionment and Grants
(1.67)Streamlined Mitigation Sales and Use Tax 22,710,578.68 1,323,825.03 24,034,403.71 (407,721.00) 24,442,124.71 14LStreamlined Mitigation Sales and Use Tax
19.92 TBD Vehicle Fees ......................... 15,027,786.79 15,027,786.79 2,496,715.49 12,531,071.30 108TBD Vehicle Fees
9.16 Tourism Promotion Areas/Interest 2,087,213.61 5,335,958.38 7,423,171.99 622,748.49 6,800,423.50 797Tourism Promotion Areas/Interest
N/ATransit Operating6 ......................... 8,998,767.09 1,232.91 9,000,000.00 9,000,000.00 18WTransit Operating
(9.30)Vessel Registration Fees ......................... 1,546,253.25 1,546,253.25 (158,601.12) 1,704,854.37 001Vessel Registration Fees
7.09 WSCC PFD Tax ......................... 65,415,341.93 65,415,341.93 4,329,499.66 61,085,842.27 01PWSCC PFD Tax
9.10 Zoo and Parks ......................... 12,107,371.46 12,107,371.46 1,009,749.08 11,097,622.38 034Zoo and Parks
2,852,290,377.10 8,546,554,870.41 11,398,845,247.51 11,337,706,114.42 61,139,133.09 Total State-Collected Revenue $ 0.54$ $ $ $
Federal-Shared Revenue

40
ACCOUNTING DISTRIBUTIONS TO LOCAL GOVERNMENTS BY FUND
(continued from page 39)Amount to
Cities/Towns/DistrictsUniversities/Colleges
FundNo.
Amount toCounties
Amount Distributed Increase or Decrease
Amount Percent2013 2012
Federal-Shared Revenue(5.66)$Federal Forest Receipts/CMIA Interest ......................... 20,095,781.48 20,095,781.48 (1,205,080.39) 21,300,861.87 878 $ $ $$Federal Forest Receipts/CMIA Interest
151.33 Flood Control Receipts ......................... 45,835.43 45,835.43 27,598.23 18,237.20 001Flood Control Receipts
(27.60)Military Forest Receipts ......................... 630,915.43 630,915.43 (240,484.83) 871,400.26 001Military Forest Receipts
(5.69)Taylor Grazing Receipts ......................... 21,174.77 21,174.77 (1,276.67) 22,451.44 001Taylor Grazing Receipts
......................... 20,793,707.11 20,793,707.11 22,212,950.77 (1,419,243.66)Total Federal-Shared Revenue $ -6.39$ $ $ $
2,852,290,377.10
1 Per RCW 46.68.470; first distributed in May 20122 Per Chapter 86, Laws of 2012, Section 703; first distributed in July 20123 Per RCW 82.14.460; first distributed in September 20124 Per RCW 82.14.450; first distributed in March 20125 Per RCW 82.14.048; first distributed in September 20126 Per Chapter 86, Laws of 2012, Section 708; first distributed in December 2012
Grand Total Distributions 8,567,348,577.52 11,419,638,954.62 11,359,919,065.19 59,719,889.43 0.53$ $ $ $ $


JAMES L. McINTIRESTATE TREASURER
PO BOX 40200OLYMPIA WA 98504-0200