Embed Size (px)
Citation preview
SOFTWARE Open Access
WASP: a versatile, web-accessible single cellRNA-Seq processing platformAndreas Hoek1* , Katharina Maibach1,2, Ebru Özmen1, Ana Ivonne Vazquez-Armendariz3, Jan Philipp Mengel4,Torsten Hain4,5, Susanne Herold3 and Alexander Goesmann1,5
Abstract
Background: The technology of single cell RNA sequencing (scRNA-seq) has gained massively in popularity as itallows unprecedented insights into cellular heterogeneity as well as identification and characterization of (sub-)cellular populations. Furthermore, scRNA-seq is almost ubiquitously applicable in medical and biological research.However, these new opportunities are accompanied by additional challenges for researchers regarding dataanalysis, as advanced technical expertise is required in using bioinformatic software.
Results: Here we present WASP, a software for the processing of Drop-Seq-based scRNA-Seq data. Our softwarefacilitates the initial processing of raw reads generated with the ddSEQ or 10x protocol and generatesdemultiplexed gene expression matrices including quality metrics. The processing pipeline is realized as aSnakemake workflow, while an R Shiny application is provided for interactive result visualization. WASP supportscomprehensive analysis of gene expression matrices, including detection of differentially expressed genes,clustering of cellular populations and interactive graphical visualization of the results. The R Shiny application canbe used with gene expression matrices generated by the WASP pipeline, as well as with externally provided datafrom other sources.
Conclusions: With WASP we provide an intuitive and easy-to-use tool to process and explore scRNA-seq data. Tothe best of our knowledge, it is currently the only freely available software package that combines pre- and post-processing of ddSEQ- and 10x-based data. Due to its modular design, it is possible to use any gene expressionmatrix with WASP’s post-processing R Shiny application. To simplify usage, WASP is provided as a Docker container.Alternatively, pre-processing can be accomplished via Conda, and a standalone version for Windows is available forpost-processing, requiring only a web browser.
Keywords: Single cell, RNA-Seq, UMI, Barcode, ddSEQ, 10x, Snakemake, R shiny
BackgroundSince its first application in 2009 [1], single cell RNA se-quencing (scRNA-seq) has experienced a steep develop-ment. One of the main reasons for this is theunprecedented resolution to analyze cellular heterogen-eity. This technology allows evaluation of gene expres-sion for each cell in a sample individually, while
traditional (“bulk”) RNA-seq only allowed generation ofa mean expression profile of all cells in a sample. As aversatile method scRNA-seq can be applied in variousfields of research, e.g. in tumor studies, detection andcharacterization of previously unknown cell types, ana-lysis of cellular differentiation during development, andmany more [2]. Over the last decade, several scRNA-seqprotocols have been developed that differ in terms oftranscript coverage, sensitivity, cost per cell, throughput,and other parameters. Despite the large number of pro-tocols, an increasing number of studies focus on data
© The Author(s). 2021 Open Access This article is licensed under a Creative Commons Attribution 4.0 International License,which permits use, sharing, adaptation, distribution and reproduction in any medium or format, as long as you giveappropriate credit to the original author(s) and the source, provide a link to the Creative Commons licence, and indicate ifchanges were made. The images or other third party material in this article are included in the article's Creative Commonslicence, unless indicated otherwise in a credit line to the material. If material is not included in the article's Creative Commonslicence and your intended use is not permitted by statutory regulation or exceeds the permitted use, you will need to obtainpermission directly from the copyright holder. To view a copy of this licence, visit http://creativecommons.org/licenses/by/4.0/.The Creative Commons Public Domain Dedication waiver (http://creativecommons.org/publicdomain/zero/1.0/) applies to thedata made available in this article, unless otherwise stated in a credit line to the data.
* Correspondence: [email protected] and Systems Biology, Justus Liebig University Giessen, 35392Giessen, GermanyFull list of author information is available at the end of the article
Hoek et al. BMC Genomics (2021) 22:195 https://doi.org/10.1186/s12864-021-07469-6
obtained by applying Drop-Seq-based protocols [3]which process cells by encapsulating them in aqueousdroplets. The main benefit of Drop-Seq-based protocolsis a high throughput of thousands of individual cells thatreduces the cost per cell, allows simultaneous analysis oflarger cohorts of cells and increases the chance to iden-tify rare cell types. Furthermore, commercial implemen-tations of the Drop-Seq method have simplified andexpanded its scope of application. However, a highernumber of cells makes subsequent data analysis a morecomplex task. While some steps like mapping or featureextraction are performed in a similar way to bulk ana-lyses and might only show different quality results, amajor difference to typical bulk RNA-seq analysis is theneed to assign each read to its cell of origin based on abarcode sequence added during the Drop-Seq procedure- also called demultiplexing. This step is critical, becausean unsuccessful assignment of reads, e.g. due to sequen-cing errors, could negatively bias the subsequent analysissteps. Also, demultiplexing needs to be algorithmicallytailored to the used implementation of Drop-Seq as thestructure of the reads for 10x-based data and BioRadddSEQ-based data is different.Another important aspect is the processing of unique
molecular identifiers (UMI) used in many Drop-Seq-based experiments. These are unique sequences addedto each mRNA fragment to reduce the quantitative amp-lification bias. Like barcode sequences, they also differdepending on the Drop-Seq implementations and haveto be checked as well for e.g. sequencing errors to re-cover as much information as possible for further ana-lysis steps. The result of this pre-processing is usually agene expression matrix, in which each row represents agene and each column corresponds to a cell (barcode).Each entry contains the expression level of the gene inthe given cell according to the unique UMIs detected.Post-processing analyses of single-cell data differ funda-mentally from bulk RNA-seq data since the results foreach individual cell have to be validated to remove lowquality cells. Furthermore, a typical aim of scRNA-seqanalysis is to cluster cells into cell type specific popula-tions. This poses a completely new challenge comparedto a bulk RNA-seq analysis. Following data clustering,the results also need to be visualized with sophisticatedalgorithms particularly suitable for scRNA-seq data like,for example, t-Distributed Stochastic Neighbour Embed-ding (t-SNE) [4] or Uniform Manifold Approximationand Projection (UMAP) [5].These specific requirements show that there is a need
for software solutions that are specifically tailored to sin-gle cell analysis. Consequently, a variety of software toolshave been developed offering a wide range of uses. How-ever, there are a number of potential stumbling blocksthat may limit their usability in practice. Several post-
processing approaches are implemented as web applica-tions, such as ASAP [6], Granatum [7] or alona [8]. Al-though this simplifies user handling as these toolsprovide a graphical user interface (GUI), it also meansthat users need to upload their data to a remote serverwhich might not be suitable for all experimental datadue to the size of the data sets or because of data privacyand protection concerns, especially in medical research.Furthermore, to analyze their data users are dependenton the maintenance of such web servers, which in somecases might result in problems regarding the reproduci-bility of their analyses.Other tools are command-line-based, such as ddSeeker
[9] or zUMIs [10]. However, these tools only take care ofdemultiplexing of reads or several pre-processing steps,and naturally they require a certain level of command lineknowledge which poses a challenge for many scientists inthe life sciences. A third category of tools are softwarepackages typically performing post-processing analysis.There are several Python-based packages like scanpy [11]or Scedar [12]. Other packages are R-based, such as scater[13], SingleCellExperiment (https://bioconductor.org/packages/release/bioc/html/SingleCellExperiment.html) orSeurat [14]. These packages combine a variety of sophisti-cated algorithms and visualizations, their drawback is,however, that they require users to have advanced know-ledge in either Python or R programming. As a result, theyare not suitable for most wet bench scientists. Addition-ally, to our knowledge, there is currently no freely avail-able tool that covers the whole process of pre-processingand post-processing for ddSEQ-based data.To address the current limitations described above, we
have developed the Web-Accessible Single cell RNA-Seqprocessing Platform (WASP). WASP comprises an auto-mated pre-processing pipeline based on Snakemake [15]and interactive websites implemented with R Shiny(https://shiny.rstudio.com) for result visualizations andpost-processing. In order to provide intuitive usage, thesoftware uses a GUI whenever applicable to enable sci-entists to conveniently process and explore their data.WASP includes an automatic workflow with appropriatedefault settings for inexperienced users while, at thesame time, allowing experienced researchers to adjust allsettings in the various processing steps to generate pro-cessing pipelines tailored to their specific scientificquestions.
ImplementationWASP is separated into two modules for primary dataprocessing and result visualization, which are imple-mented in Snakemake and R Shiny. Snakemake is aworkflow management system which utilizes a Python-based description language. Thanks to the usage ofConda (https://docs.conda.io/en/latest/) environments,
Hoek et al. BMC Genomics (2021) 22:195 Page 2 of 11
Snakemake ensures reproducibility and facilitates scal-able execution of analyses adaptable to the used hard-ware. Shiny is an R package that allows users to visualizeresults and dynamically re-calculate them after userinteraction. Results and graphics are displayed as inter-active web pages which can be further modified usingHTML, CSS and JavaScript. These features significantlylower the required level of expertise necessary to analyzedata sets with WASP.
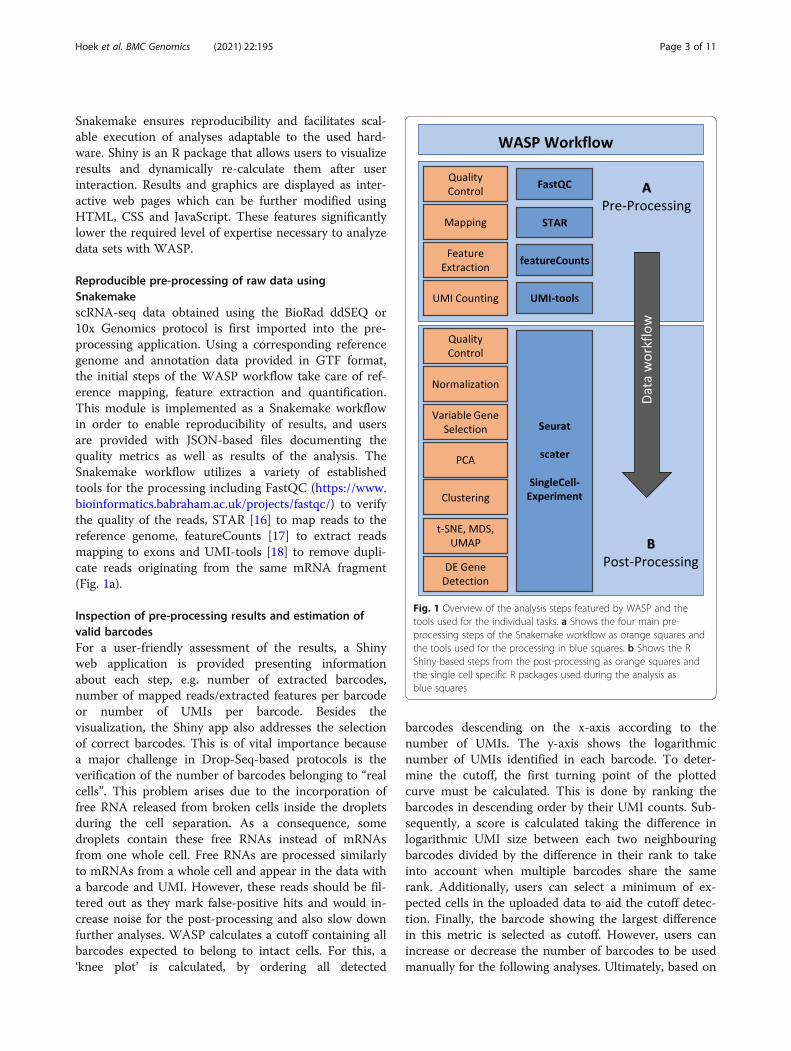
Reproducible pre-processing of raw data usingSnakemakescRNA-seq data obtained using the BioRad ddSEQ or10x Genomics protocol is first imported into the pre-processing application. Using a corresponding referencegenome and annotation data provided in GTF format,the initial steps of the WASP workflow take care of ref-erence mapping, feature extraction and quantification.This module is implemented as a Snakemake workflowin order to enable reproducibility of results, and usersare provided with JSON-based files documenting thequality metrics as well as results of the analysis. TheSnakemake workflow utilizes a variety of establishedtools for the processing including FastQC (https://www.bioinformatics.babraham.ac.uk/projects/fastqc/) to verifythe quality of the reads, STAR [16] to map reads to thereference genome, featureCounts [17] to extract readsmapping to exons and UMI-tools [18] to remove dupli-cate reads originating from the same mRNA fragment(Fig. 1a).
Inspection of pre-processing results and estimation ofvalid barcodesFor a user-friendly assessment of the results, a Shinyweb application is provided presenting informationabout each step, e.g. number of extracted barcodes,number of mapped reads/extracted features per barcodeor number of UMIs per barcode. Besides thevisualization, the Shiny app also addresses the selectionof correct barcodes. This is of vital importance becausea major challenge in Drop-Seq-based protocols is theverification of the number of barcodes belonging to “realcells”. This problem arises due to the incorporation offree RNA released from broken cells inside the dropletsduring the cell separation. As a consequence, somedroplets contain these free RNAs instead of mRNAsfrom one whole cell. Free RNAs are processed similarlyto mRNAs from a whole cell and appear in the data witha barcode and UMI. However, these reads should be fil-tered out as they mark false-positive hits and would in-crease noise for the post-processing and also slow downfurther analyses. WASP calculates a cutoff containing allbarcodes expected to belong to intact cells. For this, a‘knee plot’ is calculated, by ordering all detected
barcodes descending on the x-axis according to thenumber of UMIs. The y-axis shows the logarithmicnumber of UMIs identified in each barcode. To deter-mine the cutoff, the first turning point of the plottedcurve must be calculated. This is done by ranking thebarcodes in descending order by their UMI counts. Sub-sequently, a score is calculated taking the difference inlogarithmic UMI size between each two neighbouringbarcodes divided by the difference in their rank to takeinto account when multiple barcodes share the samerank. Additionally, users can select a minimum of ex-pected cells in the uploaded data to aid the cutoff detec-tion. Finally, the barcode showing the largest differencein this metric is selected as cutoff. However, users canincrease or decrease the number of barcodes to be usedmanually for the following analyses. Ultimately, based on
Fig. 1 Overview of the analysis steps featured by WASP and thetools used for the individual tasks. a Shows the four main pre-processing steps of the Snakemake workflow as orange squares andthe tools used for the processing in blue squares. b Shows the RShiny-based steps from the post-processing as orange squares andthe single cell specific R packages used during the analysis asblue squares
Hoek et al. BMC Genomics (2021) 22:195 Page 3 of 11
the selected cutoff a gene expression matrix is generated,in which rows represent the genes and columns corres-pond to the selected cells (barcodes). The entries containexpression levels according to the number of uniqueUMIs per gene per cell. To enhance reproducibility,users may also download a table containing all parame-ters of the tools used during the Snakemake analysis aswell as the selected number of barcodes. The gene ex-pression matrix can then be transferred to the post-processing application for downstream analysis. Ofcourse, the post-processing can also handle similarly for-matted gene expression matrices generated by other pre-processing pipelines.
User-friendly visualization of results using R shinyThe post-processing of the filtered scRNA-seq results isbased on an additional R Shiny-based application, whichrequires input of a gene expression matrix obtainedfrom the pre-processing step (for BioRad ddSEQ and10x Genomics protocol-based experiments) or obtainedfrom other sources (Fig. 2). After uploading the corre-sponding data analysis files, the user is offered access totwo different types of analysis: an automatic mode ormanual analysis. The automatic mode is designed forless experienced users, calculating all analyses in onerun with default parameters and storing the results fromeach step for later visualization. After the analysis, theuser can browse the results in interactive web pages.More experienced users can select the manual modewhich calculates the analyses stepwise, giving users the
opportunity to change parameters between steps. Finally,all results are presented as an interactive web page, simi-lar to the automatic analysis.Before starting the analysis various filter options can
be selected, such as thresholds for the amount of UMIsand genes per cell or the number of transcripts per gene,thereby allowing removal of cells with low quality.WASP provides different means in order to normalizethe UMI counts between cells, cluster cells into subpop-ulations, and also facilitates the identification of differen-tially expressed genes based on the Seurat R package.This includes selecting highly variable genes to reducenoise in the further analysis and dimensionality reduc-tion based on principal component analysis (PCA). Con-venient visualizations such as t-SNE, UMAP andmultidimensional scaling (MDS) enable assessment ofdetails such as cluster assignment or expression of spe-cific genes in all cells/clusters. All obtained results areprovided as publication-ready high-quality charts in PDFformat or as CSV-based data exports for additional pro-cessing with external applications such as MS Excel.Additionally, a CSV-based file is generated documentingall used parameters to support reproducible analyses(Fig. 1b).
Separate processing provides flexibilityThe separation of WASP into two modules offers severalbenefits. One key advantage is that this enables optimaladaptation of the software to the different hardware andsoftware requirements involved in pre-processing and
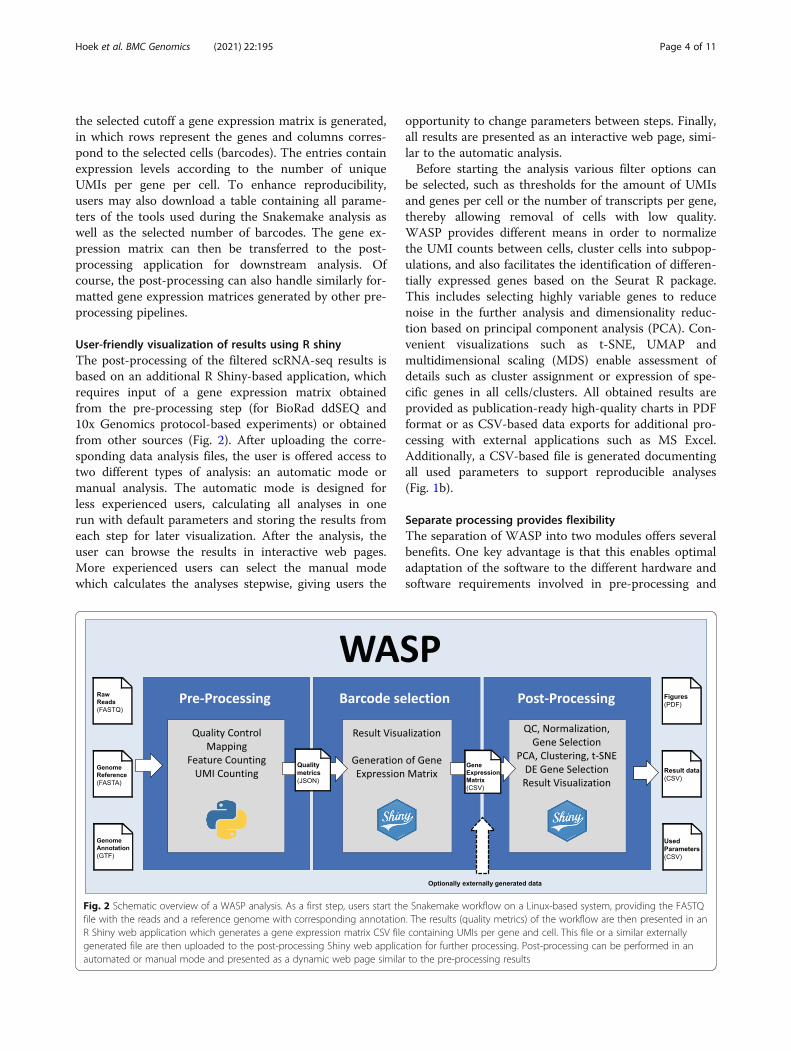
Fig. 2 Schematic overview of a WASP analysis. As a first step, users start the Snakemake workflow on a Linux-based system, providing the FASTQfile with the reads and a reference genome with corresponding annotation. The results (quality metrics) of the workflow are then presented in anR Shiny web application which generates a gene expression matrix CSV file containing UMIs per gene and cell. This file or a similar externallygenerated file are then uploaded to the post-processing Shiny web application for further processing. Post-processing can be performed in anautomated or manual mode and presented as a dynamic web page similar to the pre-processing results
Hoek et al. BMC Genomics (2021) 22:195 Page 4 of 11
post-processing. Pre-processing includes a mapping stepas one of the main processing tasks. Because scRNA-seqdata is normally based on eukaryotic organisms, oftenhuman or mouse cells, mapping usually requires ahigher amount of memory (RAM). Another critical andcomputationally intensive step is the demultiplexing asevery mapped read has to be checked for a valid barcodeand UMI sequence. We provide tailored pre-processingroutines to extract ddSeq- and 10x-specific barcode andUMI sequences. In order to speed up the demultiplex-ing, we implemented this step as a parallel process whilemaintaining reproducibility using Snakemake (Fig. 2).Another aspect is the usage of well-established tools toyield the best possible results from the input data assome of these tools are designed to work on Linux-based systems only. Therefore, the pre-processing sig-nificantly benefits from a Linux-based environment withmultiple cores and a high amount of RAM such as acompute cluster or workstation.In contrast to this, post-processing is implemented
with R-based scripts and packages, allowing it to be usedon other operating systems as well. Also, post-processing generally does not require such a highamount of RAM like the pre-processing and does notbenefit as much from a high number of CPU cores, asits calculation is typically performed within minutes on astandard laptop. Furthermore, the post-processing startswith a gene expression matrix making it independentfrom the protocol used for the scRNA-seq data gener-ation (Fig. 2). Since scRNA-seq is still a relatively newtechnology, there are some specific problems duringpost-processing in some data sets. Experienced users,however, might be able to solve these issues and retrievemore information by changing specific parameters.To fulfill these requirements and to offer users the
highest possible flexibility, we have separated the pre-processing and post-processing into two parts. This al-lows users to easily process ddSeq- and 10x-based readswhile benefitting from established tools during the pre-processing. In addition, users are able to use the post-processing on normal computers or even laptops basedon Linux or other platforms such as Windows orMacOS. The separation further expands the applicationof WASP to include scRNA-seq data from protocolssuch as 10x Genomics. Also, the post-processing enablesexperienced users to modify parameters in order to ex-tract as much information as possible from challengingdata sets.To allow easy use, both pre-processing and post-
processing are available via Docker, eliminating the needto install further dependencies. Moreover, the pre-processing can easily be installed using Conda and thepost-processing is available as a standalone version forWindows, requiring only an installed web browser.
Results and discussionGeneration of a gene expression matrix for ddSEQ-baseddataIn order to use the pre-processing pipeline, the user needsto provide a reference genome with an annotation and theraw FASTQ files (Read 1 and Read 2) generated withBioRad’s ddSeq or 10x Genomics protocol. For this, a ded-icated directory structure is used, that can be obtainedfrom the git repository (Figure S1). After preparing the in-put data, the Snakemake pipeline can be started by a sin-gle command line, with the two mandatory parametersbeing the number of cores to be used and the scRNA-seqprotocol.Following the Snakemake run, the result data is visual-
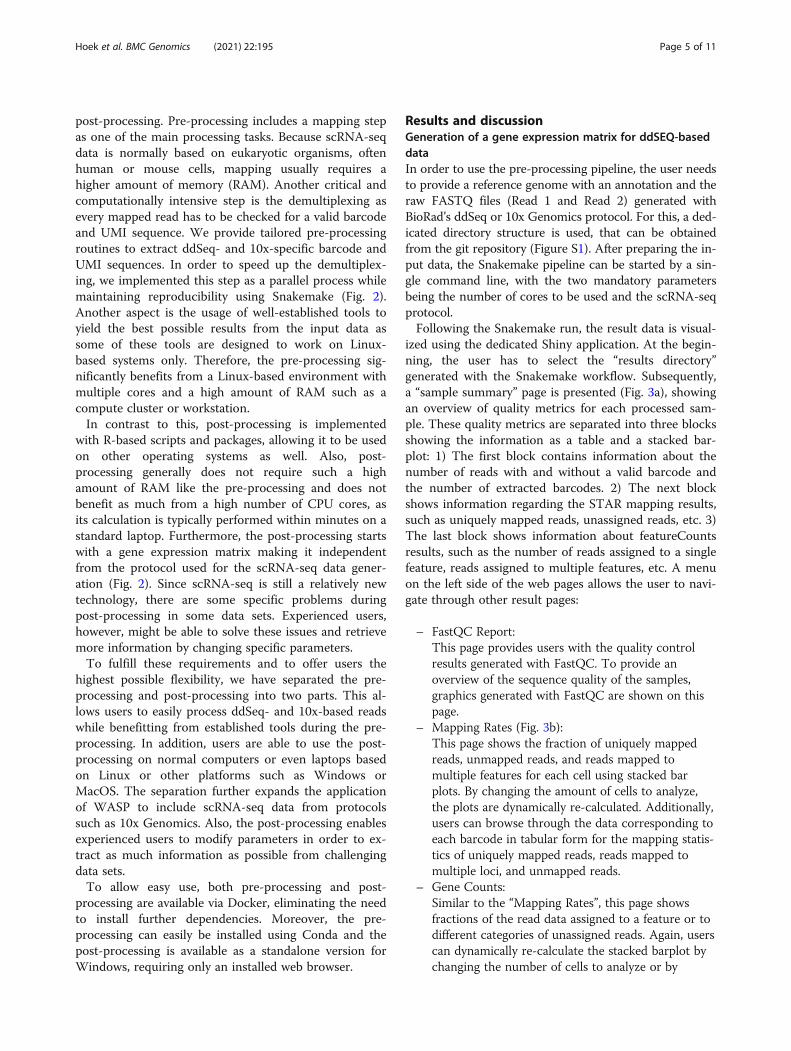
ized using the dedicated Shiny application. At the begin-ning, the user has to select the “results directory”generated with the Snakemake workflow. Subsequently,a “sample summary” page is presented (Fig. 3a), showingan overview of quality metrics for each processed sam-ple. These quality metrics are separated into three blocksshowing the information as a table and a stacked bar-plot: 1) The first block contains information about thenumber of reads with and without a valid barcode andthe number of extracted barcodes. 2) The next blockshows information regarding the STAR mapping results,such as uniquely mapped reads, unassigned reads, etc. 3)The last block shows information about featureCountsresults, such as the number of reads assigned to a singlefeature, reads assigned to multiple features, etc. A menuon the left side of the web pages allows the user to navi-gate through other result pages:
– FastQC Report:This page provides users with the quality controlresults generated with FastQC. To provide anoverview of the sequence quality of the samples,graphics generated with FastQC are shown on thispage.
– Mapping Rates (Fig. 3b):This page shows the fraction of uniquely mappedreads, unmapped reads, and reads mapped tomultiple features for each cell using stacked barplots. By changing the amount of cells to analyze,the plots are dynamically re-calculated. Additionally,users can browse through the data corresponding toeach barcode in tabular form for the mapping statis-tics of uniquely mapped reads, reads mapped tomultiple loci, and unmapped reads.
– Gene Counts:Similar to the “Mapping Rates”, this page showsfractions of the read data assigned to a feature or todifferent categories of unassigned reads. Again, userscan dynamically re-calculate the stacked barplot bychanging the number of cells to analyze or by
Hoek et al. BMC Genomics (2021) 22:195 Page 5 of 11
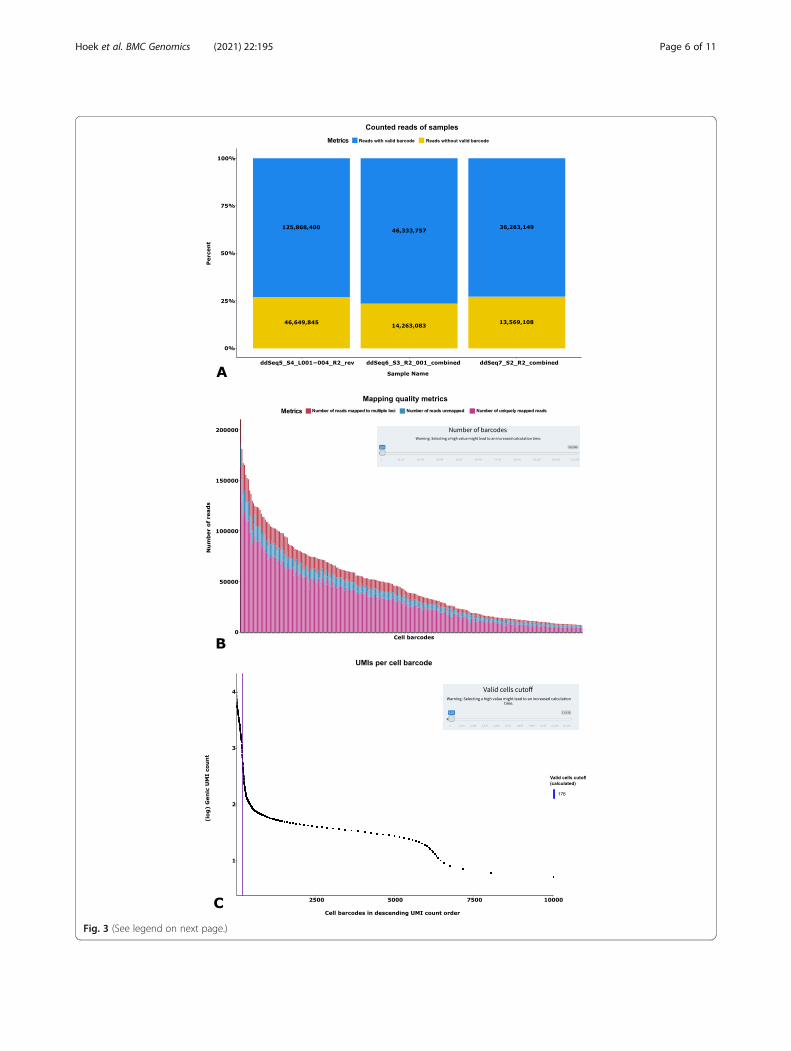
Fig. 3 (See legend on next page.)
Hoek et al. BMC Genomics (2021) 22:195 Page 6 of 11
selecting the categories of reads to be shown. At thebottom of the page, users can browse identified bar-codes in tabular form.
– Valid Cells (Fig. 3c):As mentioned before (“Inspection of pre-processingresults and estimation of valid barcodes”, Implemen-tation), a major challenge in Drop-Seq-based proto-cols is the discrimination of barcodes added to freemRNA fragments from barcodes added to mRNAfragments of a whole cell. This page shows the ‘kneeplot’ and the automatically computed cutoff. Add-itionally, pie charts below the knee plot show thedistribution of mapped reads and identified genes inthe selected barcodes. When the number of validbarcodes or expected number of cells is changed,these plots are updated. Also, users can browsethrough the barcodes in tabular form to get a de-tailed view of identified UMIs and genes perbarcode.
After selecting a number of barcodes to be used forfurther analysis, users can simply download the gene ex-pression matrix and a list of used parameters by clickinga button (Figure S2). The gene expression matrix canthen be used with the post-processing WASP applicationfor additional analysis.
Customizable analysis and dynamic visualization ofscRNA-seq post-processingTo make the WASP software also applicable for datasetswhich were created using a protocol not supported bythe pre-processing pipeline, the post-processing was de-signed as a stand-alone module. The post-processingShiny application can be started either as a Docker con-tainer or as a standalone application on a Windows-based PC. A main advantage of the latter is that it doesnot require the installation of any additional software orpackages, only a standard web browser is needed. Afterthe application is started, the user is provided with aweb page similar to the Shiny pre-processing page. Thispage also contains examples of how the input data hasto be structured. As a first step, the user has to uploadthe gene expression matrix file. Where applicable, it ispossible to upload an additional annotation file contain-ing all cell barcodes and their assigned type. This can beuseful if data from several experiments are combined tolabel each cell with its origin. Another option is to addalready known cell type information, e.g. if cells have
previously been selected from specific tissues. When anannotation file is provided, WASP shows users theadded cell information in plots allowing to check for e.g.batch effects. After the upload is completed, users canchoose between an automatic and a manual analysismode. The first mode was integrated to allow less expe-rienced users to gain easy insight into their data. For thismode, we evaluated parameters from previous analysesto select default values suitable for most data sets. In theautomatic analysis mode, WASP calculates all analysissteps and presents the graphical results on a new webpage. The manual mode however allows users to changeparameters before each step. Therefore, WASP calcu-lates the results step-by-step and presents the user onlywith the results of the current step, such that the usercan decide which parameters to use for the next step.To simplify the usage, default parameters will be used ifthe user continues to the next step without changing thevalues. Similar to the automatic mode, WASP presentsall generated visualizations on one page after all process-ing steps have been executed. A menu on the left side al-lows users to select each analysis step and to re-calculatethe analysis with new parameters from this step on.Since WASP uses the newest version 3.1 of the Seurat Rpackage internally for many analyses, its workflow ishighly similar to the Seurat workflow. In addition toSeurat, WASP uses the R packages ‘SingleCellEx-periment‘and ‘scater‘to provide users with add-itional analyses and information about their data set. Forscientists without a certain level of expertise in R pro-gramming the usage of the three mentioned packageswould be challenging, even more so if they wanted tocombine the results of several packages to enhance theiranalysis results. The R Shiny GUI-based web interface ofWASP offers users an easy-to-use tool to perform post-processing scRNA-seq analysis (Fig. 4).The analysis steps cover a typical scRNA-seq work-
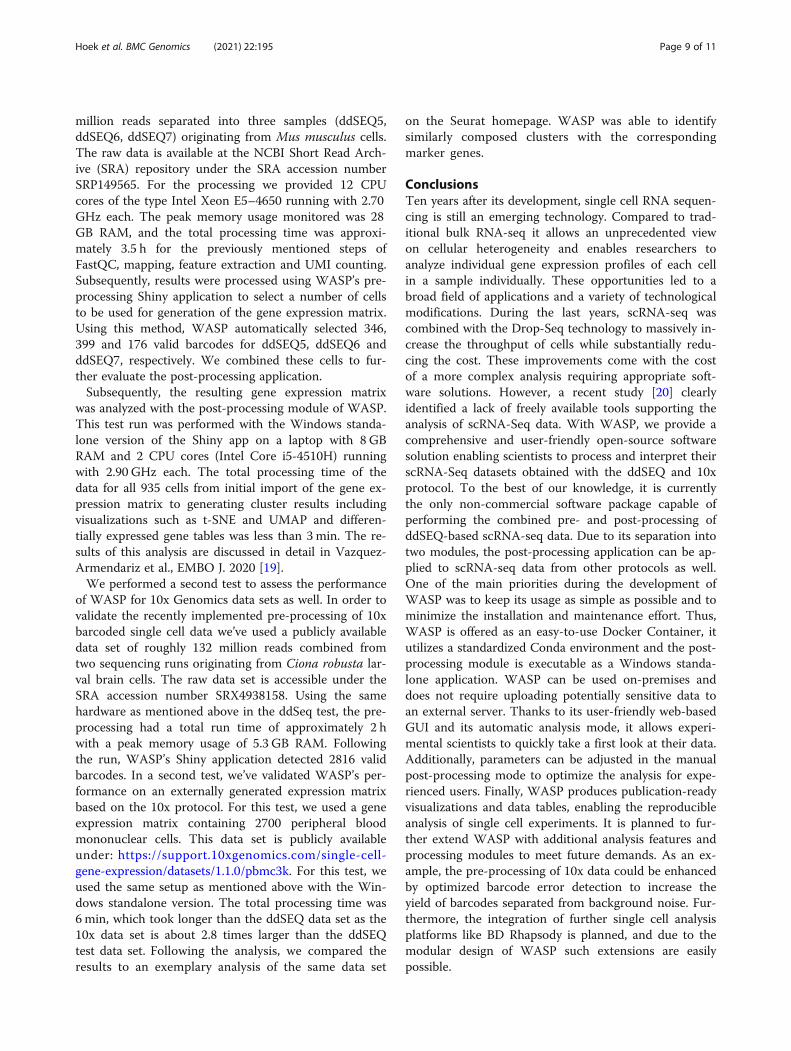
flow, beginning with quality control to remove low qual-ity cells from the data, e.g. cells with a very low amountof UMIs or detected genes (Fig. 4a). To account fortechnical noise and focus on biological variability, thedata is normalized, scaled, and genes with a high vari-ation are used for dimensionality reduction of the dataset via principal component analysis. During the manualworkflow, a user has to decide how many of the calcu-lated components will be used in the following analyses.This step is important, as selecting a value too low couldnegatively affect the results and might cause a loss of
(See figure on previous page.)Fig. 3 Examples of WASP pre-processing quality metrics. a A summary page shows quality metrics about identified barcodes, STAR mapping andfeatureCounts analyses. b Results for each analysis step, e.g. the STAR mapping, are presented in a detailed page as well with interactive selectionof metrics (e.g. categories of mapped and unmapped reads) c On the last page, users select the number of barcodes to be used for furtheranalysis. By calculating a knee plot, WASP provides users with a suggested number of detected true-positive barcodes
Hoek et al. BMC Genomics (2021) 22:195 Page 7 of 11
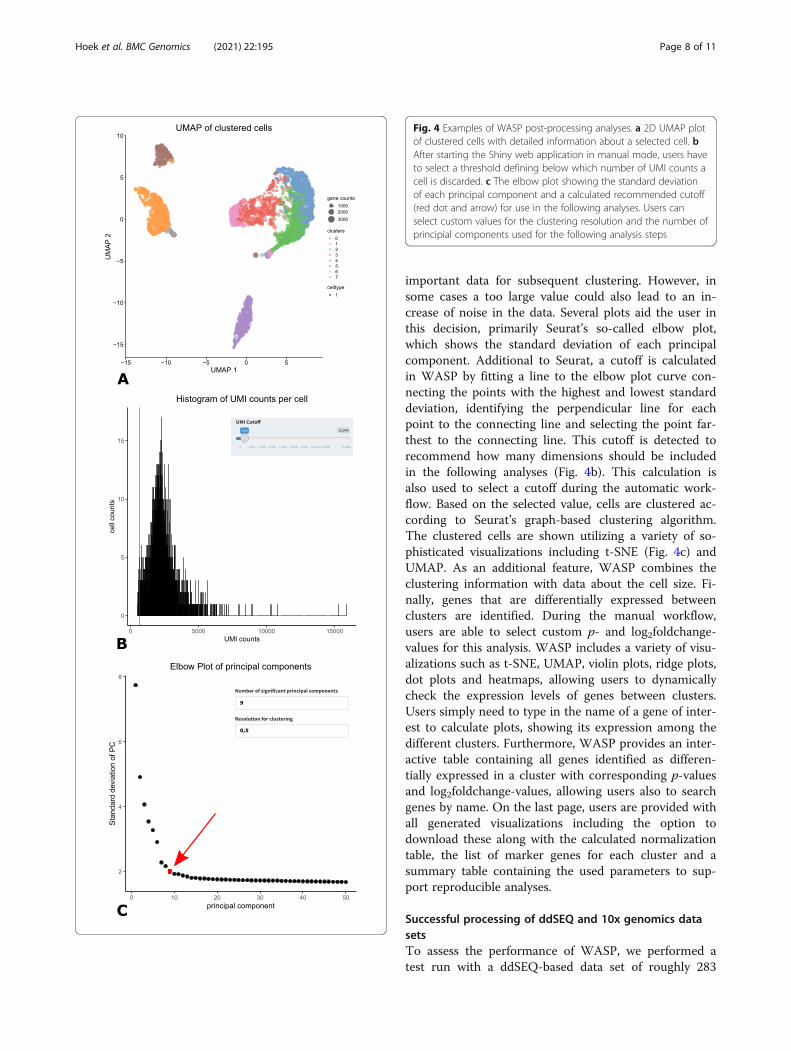
important data for subsequent clustering. However, insome cases a too large value could also lead to an in-crease of noise in the data. Several plots aid the user inthis decision, primarily Seurat’s so-called elbow plot,which shows the standard deviation of each principalcomponent. Additional to Seurat, a cutoff is calculatedin WASP by fitting a line to the elbow plot curve con-necting the points with the highest and lowest standarddeviation, identifying the perpendicular line for eachpoint to the connecting line and selecting the point far-thest to the connecting line. This cutoff is detected torecommend how many dimensions should be includedin the following analyses (Fig. 4b). This calculation isalso used to select a cutoff during the automatic work-flow. Based on the selected value, cells are clustered ac-cording to Seurat’s graph-based clustering algorithm.The clustered cells are shown utilizing a variety of so-phisticated visualizations including t-SNE (Fig. 4c) andUMAP. As an additional feature, WASP combines theclustering information with data about the cell size. Fi-nally, genes that are differentially expressed betweenclusters are identified. During the manual workflow,users are able to select custom p- and log2foldchange-values for this analysis. WASP includes a variety of visu-alizations such as t-SNE, UMAP, violin plots, ridge plots,dot plots and heatmaps, allowing users to dynamicallycheck the expression levels of genes between clusters.Users simply need to type in the name of a gene of inter-est to calculate plots, showing its expression among thedifferent clusters. Furthermore, WASP provides an inter-active table containing all genes identified as differen-tially expressed in a cluster with corresponding p-valuesand log2foldchange-values, allowing users also to searchgenes by name. On the last page, users are provided withall generated visualizations including the option todownload these along with the calculated normalizationtable, the list of marker genes for each cluster and asummary table containing the used parameters to sup-port reproducible analyses.
Successful processing of ddSEQ and 10x genomics datasetsTo assess the performance of WASP, we performed atest run with a ddSEQ-based data set of roughly 283
Fig. 4 Examples of WASP post-processing analyses. a 2D UMAP plotof clustered cells with detailed information about a selected cell. bAfter starting the Shiny web application in manual mode, users haveto select a threshold defining below which number of UMI counts acell is discarded. c The elbow plot showing the standard deviationof each principal component and a calculated recommended cutoff(red dot and arrow) for use in the following analyses. Users canselect custom values for the clustering resolution and the number ofprincipial components used for the following analysis steps
Hoek et al. BMC Genomics (2021) 22:195 Page 8 of 11
million reads separated into three samples (ddSEQ5,ddSEQ6, ddSEQ7) originating from Mus musculus cells.The raw data is available at the NCBI Short Read Arch-ive (SRA) repository under the SRA accession numberSRP149565. For the processing we provided 12 CPUcores of the type Intel Xeon E5–4650 running with 2.70GHz each. The peak memory usage monitored was 28GB RAM, and the total processing time was approxi-mately 3.5 h for the previously mentioned steps ofFastQC, mapping, feature extraction and UMI counting.Subsequently, results were processed using WASP’s pre-processing Shiny application to select a number of cellsto be used for generation of the gene expression matrix.Using this method, WASP automatically selected 346,399 and 176 valid barcodes for ddSEQ5, ddSEQ6 andddSEQ7, respectively. We combined these cells to fur-ther evaluate the post-processing application.Subsequently, the resulting gene expression matrix
was analyzed with the post-processing module of WASP.This test run was performed with the Windows standa-lone version of the Shiny app on a laptop with 8 GBRAM and 2 CPU cores (Intel Core i5-4510H) runningwith 2.90 GHz each. The total processing time of thedata for all 935 cells from initial import of the gene ex-pression matrix to generating cluster results includingvisualizations such as t-SNE and UMAP and differen-tially expressed gene tables was less than 3 min. The re-sults of this analysis are discussed in detail in Vazquez-Armendariz et al., EMBO J. 2020 [19].We performed a second test to assess the performance
of WASP for 10x Genomics data sets as well. In order tovalidate the recently implemented pre-processing of 10xbarcoded single cell data we’ve used a publicly availabledata set of roughly 132 million reads combined fromtwo sequencing runs originating from Ciona robusta lar-val brain cells. The raw data set is accessible under theSRA accession number SRX4938158. Using the samehardware as mentioned above in the ddSeq test, the pre-processing had a total run time of approximately 2 hwith a peak memory usage of 5.3 GB RAM. Followingthe run, WASP’s Shiny application detected 2816 validbarcodes. In a second test, we’ve validated WASP’s per-formance on an externally generated expression matrixbased on the 10x protocol. For this test, we used a geneexpression matrix containing 2700 peripheral bloodmononuclear cells. This data set is publicly availableunder: https://support.10xgenomics.com/single-cell-gene-expression/datasets/1.1.0/pbmc3k. For this test, weused the same setup as mentioned above with the Win-dows standalone version. The total processing time was6 min, which took longer than the ddSEQ data set as the10x data set is about 2.8 times larger than the ddSEQtest data set. Following the analysis, we compared theresults to an exemplary analysis of the same data set
on the Seurat homepage. WASP was able to identifysimilarly composed clusters with the correspondingmarker genes.
ConclusionsTen years after its development, single cell RNA sequen-cing is still an emerging technology. Compared to trad-itional bulk RNA-seq it allows an unprecedented viewon cellular heterogeneity and enables researchers toanalyze individual gene expression profiles of each cellin a sample individually. These opportunities led to abroad field of applications and a variety of technologicalmodifications. During the last years, scRNA-seq wascombined with the Drop-Seq technology to massively in-crease the throughput of cells while substantially redu-cing the cost. These improvements come with the costof a more complex analysis requiring appropriate soft-ware solutions. However, a recent study [20] clearlyidentified a lack of freely available tools supporting theanalysis of scRNA-Seq data. With WASP, we provide acomprehensive and user-friendly open-source softwaresolution enabling scientists to process and interpret theirscRNA-Seq datasets obtained with the ddSEQ and 10xprotocol. To the best of our knowledge, it is currentlythe only non-commercial software package capable ofperforming the combined pre- and post-processing ofddSEQ-based scRNA-seq data. Due to its separation intotwo modules, the post-processing application can be ap-plied to scRNA-seq data from other protocols as well.One of the main priorities during the development ofWASP was to keep its usage as simple as possible and tominimize the installation and maintenance effort. Thus,WASP is offered as an easy-to-use Docker Container, itutilizes a standardized Conda environment and the post-processing module is executable as a Windows standa-lone application. WASP can be used on-premises anddoes not require uploading potentially sensitive data toan external server. Thanks to its user-friendly web-basedGUI and its automatic analysis mode, it allows experi-mental scientists to quickly take a first look at their data.Additionally, parameters can be adjusted in the manualpost-processing mode to optimize the analysis for expe-rienced users. Finally, WASP produces publication-readyvisualizations and data tables, enabling the reproducibleanalysis of single cell experiments. It is planned to fur-ther extend WASP with additional analysis features andprocessing modules to meet future demands. As an ex-ample, the pre-processing of 10x data could be enhancedby optimized barcode error detection to increase theyield of barcodes separated from background noise. Fur-thermore, the integration of further single cell analysisplatforms like BD Rhapsody is planned, and due to themodular design of WASP such extensions are easilypossible.
Hoek et al. BMC Genomics (2021) 22:195 Page 9 of 11
Availability and requirementsProject name: WASP - Web-based single cell RNA-Seqanalysis platformProject home page: http://www.computational.bio/
software/waspRepository: https://github.com/andreashoek/waspOperating system(s): Pre-Processing: Linux; Post-
Processing: Windows, Linux, MacOSProgramming language: R, Python/SnakemakeOther requirements: Pre-Processing: Linux, Docker
or Conda, > 28 GB RAM; Post-Processing: web browser(e.g. Mozilla Firefox or Google Chrome), Standalone ver-sion on Windows, Docker on Linux or MacOSLicense: GNU GPL version 3Any restrictions to use by non-academics: None.
AbbreviationsGUI: Graphical user interface; MDS: Multidimensional scaling; PCA: Principalcomponent analysis; scRNA-Seq: Single cell RNA sequencing; SRA: Short ReadArchive; t-SNE: t-Distributed Stochastic Neighbour Embedding;UMAP: Uniform Manifold Approximation and Projection; UMI: Uniquemolecular identifier; WASP: Web-accessible single cell RNA-Seq platform
Supplementary InformationThe online version contains supplementary material available at https://doi.org/10.1186/s12864-021-07469-6.
Additional file 1: Figure S1. Schematic overview of the directorystructure required for the WASP pre-processing workflow. The structurecan be obtained from the git repository. Users only have to provide thereference genome FASTA file and the reference genome annotation GTFfile in the Reference directory as well the raw FASTQ read files in theSamples directory.
Additional file 2: Figure S2. Screenshot of the summary.csv file. Thisshows used parameters during a WASP post-processing run, enabling toperform reproducible analyses.
AcknowledgementsThe authors would like to thank Patrick Blumenkamp, Raphael Müller andJochen Blom for their helpful advice and constructive feedback during thedevelopment of the software and preparation of the manuscript. WASP hasbeen previously presented as a poster on the ISMB 2019.
Authors’ contributionsAH, KM and EÖ designed, implemented, and tested the software, KM and EÖcontributed to the user manual. AH and AG conceived and designed thesoftware, AIV, JPM, SH and TH validated the software results. AIV, JPM, TH, SHand AG provided valuable input for the requirement specification of thesoftware. AIV, JPM, TH and SH participated in the scRNA-seq data set acquisi-tion and data generation. AH wrote the manuscript, AG, SH and TH substan-tially revised the manuscript. All authors read and approved the manuscript.
Authors’ informationNone applicable.
FundingThis study was supported by the German Research Foundation (DFG KFO309 P2/P5/P6/P7/P8/Z01, SFB1021 Z02, SFB-TR84 B/08) and the BMBF grantFKZ 031A533 to the BiGi center within the de. NBI network. Open Accessfunding enabled and organized by Projekt DEAL.
Availability of data and materialsThe ddSeq and 10x dataset used for assessing the pre- and post-processingare available at the NCBI Short Read Archive repository under the SRA
accession number SRP149565 (ddSeq) and SRX4938158 (10x). Used referencegenomes and annotations are available at the UCSC database under the ver-sion mm10 (ddSeq) and at the NCBI assembly database under the RefSeq ac-cession number GCF_000224145.3 (10x). The 10x gene expression matrixused for testing the post-processing with externally generated datasets isavailable under https://support.10xgenomics.com/single-cell-gene-expression/datasets/1.1.0/pbmc3k
Declarations
Ethics approvalNone applicable.
Consent for publicationNot applicable.
Competing interestsThe authors declare that they have no competing interests.
Author details1Bioinformatics and Systems Biology, Justus Liebig University Giessen, 35392Giessen, Germany. 2Algorithmic Bioinformatics, Justus Liebig UniversityGiessen, 35392 Giessen, Germany. 3Department of Internal Medicine II, andCardio-Pulmonary Institute (CPI), Universities of Giessen and Marburg LungCenter (UGMLC), Member of the German Center for Lung Research (DZL)and The Institute of Lung Health (ILH), 35392 Giessen, Germany. 4Institute ofMedical Microbiology, Justus Liebig University Giessen, 35392 Giessen,Germany. 5Center for Infection Research (DZIF), Justus-Liebig-UniversityGiessen, Partner Site Giessen-Marburg-Langen, 35392 Giessen, Germany.
Received: 2 November 2020 Accepted: 23 February 2021
References1. Tang F, Barbacioru C, Wang Y, Nordman E, Lee C, Xu N, Wang X, Bodeau J,
Tuch B, Siddiqui A, Lao K, Surani M. mRNA-Seq whole-transcriptome analysisof a single cell. Nat Methods. 2009;6:377–82.
2. Tang X, Huang Y, Lei J, Luo H, Zhu X. The single-cell sequencing: newdevelopments and medical applications. Cell Biosci. 2019;9(1):53.
3. Angerer P, Simon L, Tritschler S, Wolf F, Fischer D, Theis F. Single cells makebig data: new challenges and opportunities in transcriptomics. Curr OpinSyst Biol. 2017;4:85–91.
4. Van Der Maaten L, Hinton G. Visualizing Data using t-SNE. J Mach Learn Res.2008;9:2579–605.
5. McInnes L & Healy J. UMAP: uniform manifold approximation andprojection for dimension reduction. 2018 Preprint at https://arxiv.org/abs/1802.03426.
6. Gardeux V, David FPA, Shajkofci A, Schwalie PC, Deplancke B. ASAP: a web-based platform for the analysis and interactive visualization of single-cellRNA-seq data. Bioinformatics. 2017;33(19):3123–5.
7. Zhu X, Wolfgruber TK, Tasato A, Arisdakessian C, Garmire DG, Garmire LX.Granatum: A graphical single-cell RNA-Seq analysis pipeline for genomicsscientists. Genome Med. 2017;9:108.
8. Franzén O, Björkegren JLM. alona: a web server for single cell RNA-seqanalysis. Bioinformatics. 2020;36(12):3910–2.
9. Romagnoli D, Boccalini G, Bonechi M, Biagioni C, Fassan P, Bertorelli R, DeSanctis V, Di Leo A, Migliaccio I, Malorni L, Benelli M. ddSeeker: A tool forprocessing Bio-Rad ddSEQ single cell RNA-seq data. BMC Genomics. 2018;19:960.
10. Parekh S, Ziegenhain C, Vieth B, Enard W, Hellmann I. zUMIs - A fast andflexible pipeline to process RNA sequencing data with UMIs. GigaScience.2018;7(6):giy059.
11. Wolf AF, Angerer P, Theis FJ. SCANPY: Large-scale single-cell geneexpression data analysis. Genome Biology. 2018;19(1):15.
12. Zhang Y, Kim MS, Reichenberger ER, Stear B, Taylor DM. Scedar: A scalablePython package for single-cell RNA-seq exploratory data analysis. PLoSComput Biol. 2020;16(4):e1007794.
13. Mccarthy DJ, Campbell KR, Lun ATL, Wills QF. Scater: pre-processing, qualitycontrol, normalization and visualization of single-cell RNA-seq data in R.Bioinformatics. 2017;33(8):1179–86.
Hoek et al. BMC Genomics (2021) 22:195 Page 10 of 11
14. Butler A, Hoffman P, Smibert P, Papalexi E, Satija R. Integrating single-celltranscriptomic data across different conditions, technologies, and species.Nat Biotechnol. 2018;36(5):411–20.
15. Köster J, Rahmann S. Snakemake-a scalable bioinformatics workflow engine.Bioinformatics. 2012;28(19):2520–2.
16. Dobin A, Davis CA, Schlesinger F, Drenkow J, Zaleski C, Jha S, Batut P,Chaisson M, Gingeras TR. STAR: Ultrafast universal RNA-seq aligner.Bioinformatics. 2013;29(1):15–21.
17. Liao Y, Smyth GK, Shi W. FeatureCounts: an efficient general purposeprogram for assigning sequence reads to genomic features. Bioinformatics.2014;30(7):923–30.
18. Smith T, Heger A, Sudbery I. UMI-tools: modeling sequencing errors inunique molecular identifiers to improve quantification accuracy. GenomeRes. 2017;27(3):491–9.
19. Vazquez-Armendariz AI, Heiner M, El Agha E, Salwig I, Hoek A, Hessler MC,Shalashova I, Shrestha A, Carraro G, Mengel JP, Günther A, Morty RE, VadászI, Schwemmle M, Kummer W, Hain T, Goesmann A, Bellusci S, Seeger W,Braun T, Herold S. Multilineage murine stem cells generate complexorganoids to model distal lung development and disease. EMBO J. 2020;39:e103476.
20. Eisenstein M. Single-cell RNA-seq analysis software providers scramble tooffer solutions. Nat Biotechnol. 2020;38(3):254–7.
Publisher’s NoteSpringer Nature remains neutral with regard to jurisdictional claims inpublished maps and institutional affiliations.
Hoek et al. BMC Genomics (2021) 22:195 Page 11 of 11