Embed Size (px)
Citation preview

Waste Minimization &>e-
In putting together any waste minimization program, it is essential that a methodical step-by-step approach be adopted to bring the various groups together and ensure effective implementation. Such an approach also ensures the exploitation of maximum waste minimization and reduction opportunities.
Louis Staff
;e Ferrante Editor, TNEJ
I WORKSHEET 1 General Information
Name of the Compan : Waste Minimization Team
Name Designation 1 . II 2.
I 3. A. Major Raw Materials Consumption
i)
;; 2) ;;
ii) Chemicals
C )
a7 Electricafenerg y b) Fuel for boilers c) Others
B. Energ Consum tion
C. Water Consumption D. Production
Installed Capacity
Actual Production
E. Type of Effluent Treatment Primary Secondary No treatment
F. Any Other Relevant Information
Getting Started - Step 1 waste minimization team is essen- tial for coordinating the program A to get the various measures imple-
mented and to bear overall responsibility. The team should comprise personnel from operating, design engineering, manage- ment personnel.
Depending on the need, external experts can also be included. General information regarding the unit or facility and record is shown in Worksheet 1 (note that each audit study is unique and industry- or plant-specific).
Waste minimization activities require several documents and information. If these are not available, they should be gen- erated and updated. The checklist given in Worksheet 2 would help in assessing the level of information available.
List Process Steps, Identify Wasteful Streams
Dl.!ring the first study, the team shau!d identify input and output streams. Major and obvious waste generating areas should be marked as shown in Worksheet 3. Labelling the waste streams with respect to their physical state (solid, liquid or gaseous) is a subsequent help at the waste quantification stage. If possible, the rea- sons for the generation of wastes should also be identified and recorded. The exam- ple shown in Worksheet 3 is for a specific papermaking operation.
~
36 The National Environmental Journal September/October 1995
The WP803 Water Quality Monitor is a hand-held device dedicated for use with Solomat's 803PS multi-parameter Sonde to measure temperature; pH; ORP; conductiv- ity/salinity/TDS; dissolved oxygen; turbidity/TSS; ammonia and ion concentration. The watertxoof
monitor has full data logging, analysis and reporting capabilities to store up to 50,000 read- ings with a maximum of 50 files. Solomat- Neotronics, Norwalk, CT, 800-765-6628.
CIRCLE 232 ON CARD FOR FREE INFO.
Solomat's portable 520c multi-function water quality meter is a cost-effective solution to measuring water quality and chemistry parameters. The hand-held meter is flexible to measure dissolved oxygen, pH, conductiv- ity/salinity/total dissolved solids (TDS), turbid- ity/total suspended solids (TSS), open
channel flow, temperature and ion concentra- tion. The 520c has many features including a site code facility, data logging, simple calibra- tion and much more. Solomat-Neotronics, Norwalk, CT, 800-765-6628.
CIRCLE 233 ON CARD FOR FREE INFO. ,j
Introducing the MiniGas 4, the latest advance in pocket size gas detection and dat- alogging for flammable, Oxygen deficiency, Carbon Monoxide and Hydrogen Sulfide. It has instantaneous, STEL and TWA alarms as well as a peak reading function. The data log- ging facility stores up to 40 hours of exposure profiles and session peaks on a rotating log. NiCd rechargeable and dry cell battery packs are interchangeable (even in a hazardous atmosphere!). It offers incredibly easy cali-
bration, autozero and span function. Neotronics, Gainesville, GA, 800-535-0606.
CIRCLE 234 ON CARD FOR FREE INFO.
This new indoor environmental meas le- ment instrument . . . the MPM-4100 can ea- sure, display and log data for a broadlange
$
of parame- ters for lab- oratory and industr ial a p p l i c a - tions. This r u g g e d , p o r t a b l e and easily opera ted instrument accepts a w i d e choice of probes for measuring relative humidity, air velocity, differential pressure, carbon diox- ide, carbon monoxide, volumetric airflow, temperature, dew point, gage pressure, RPM and more. Solomat-Neotronics, Norwalk, CT, 800-765-6628.
CIRCLE 235 ON CARD FOR FREE INFO.
CIRCLE 236 ON CARD FOR FREE INFO.

I WORKSHEET 2 Available Information 4
Information Availability Remarks Process flow diagram Material balance Energy balance Water balance
Poor housekeeping alone may
of waste. This often neglected contribute a significant amount
area can be the simplest and most attractive starting point to effect waste minimization. While con- ducting the first shop-floor study, the waste minimization team should pay special attention to
WORKSHEET 3 Process Flow Diagram Indicating Waste Streams
Paper Mill Example
Plant layout Waste analysis Emission records Production log sheets Maintenance log sheets Any other information
Inputs Process Steps Waste Streams Argo residue - > > - Wet cleaning
wastewater (L)
(screening rejectslpith)
> - Others
areas with poor housekeeping. Worksheet 4 could be used to record the housekeeping status in each section. Some commonly encountered housekeeping short- comings are indicated, and many more can often be identified.
Caustic - > > - Leakages, spills, Cooking aids - floor wash (L)
Pulping section
Water - >
Steam - >
Additives - > 1 1 >-I Dyes -
> - Pulp wash
> - Bleach wash
> - Screening rejects (S)
> - Centricleaner
> - Rejects (L)
- > - Decker filterate (L) - > - Others
> - Others Fillers -
Stock preparation > - Spills (additivesldyes) (L) t
> - Floor wash (L)
> - Excess wire pit water (L) Kerosene-LL Bioaids - > > - Centricleaner reject (L)
Alum -
> - Saveall excess water
> - Couch decker filterate Steam - >
Water - > > - Others
z - DG Set flue gas (G)
> - Boiler flue gas (G)
> - Boiler ash (S) t Utilities
= Liquid = Gas
(L > - Hypo section sludge (S)
= Solids > - Other wastes
~
It would now be possible and desirable to record some basic cost data. At this stage, it would suffice to obtain the cost of direct input materials (purchase cost), which would be easily available from purchase and store records. A sample Worksheet 5 for the pulp mill section is shown, and similar worksheets can eas- ily be worked out for other plant sections, by replacing the first column in Worksheet 5 with the appropriate input materials for each section. A list of commonly used input materials in other sections is given below; this could be appropriately amended if necessary.
Raw material preparation Stock preparation Process equipment
Analyzing Process Steps - Preparing Process Flow Charts
The preparation of a detailed process flow diagram is the first step in the entire analysis, forming the basis for compilation of the material and energy bal- ance. A flow chart should list and characterize (if possible) input and output streams. Special care should be taken to identify recycle streams. Free or cheap inputs for water, air, and other resources should be particularly highlighted, as these often end up being a major cause of waste. Materials that are used occasionally and/or do not appear in output streams also should be highlighted.
WORKSHEET 4 Housekeeping Status Paper Mill Example
Sections Raw material (RM)
preparation
Stock preparation
Production
Laoses in Housekeeping RM spillage from conveyor/screens Dust spillage from screens Others RM spillage during loading/unloading
Leakage/spillage of chemicals Spillage of rejects and its interference
Loss of material due to defective equipment Other
with product stream
Spillage of additives due to improper handling Overflow due to high level Splashing to low level Others Open water hoses Overflow from fan pump pit/wire pit Overflow of water Others
The National Envivonmental Jouvnal September/October 1995 37

Chemicals Cost /Ton Annual Consumption
Chemicals Chemicals Steam Electricity Water
Material and Energy Balances The second important step is to draw a
material/energy balance of the selected unit or section. Material and energy balances are important for any waste minimization pro- gram, as they make it possible to identify and quantify previously unknown losses or emis- sions. These balances are also useful for mon- itoring the advances made in a prevention program and evaluating its costs and benefits.
While it is not possible to lay down compre- hensive guidelines for establishing material bal- ances, certain pointers might be useful.
*It is better to first draw up the overall material balance across each major section: raw material preparation processing.
When splitting up the total system, simple subsystems should be chosen.
The following measurement guidelines could be useful to avoid pitfalls while prepar- ing the material balance:
*The measurements should be carried out on a per-day basis.
*The values could then be expressed of per pound or ton produced. Wherever required, these can be extrapolated to a per-year basis, keeping a note of variations in raw material, quality, and the like, to determine annual fig- ures for a feasibility analysis.
*All measurements of raw material should be converted to dry basis. This would simplify calculations due to varia- tions in moisture content.
Making a Component Balance It may be useful to evolve the component
balance from the overall and section-wise material and energy balance. The most useful component balances are a total solid balance and a water balance, which provide a direct indication of the efficiency of utilization of fibrous raw material, chemicals and water. They give the relative importance of different waste streams in terms of quantum of loss, and enable prioritization of various streams for developing waste minimization measures.
38
Consumption/ Ton of Product
~~
WORKSHEET 6A Material Balance
RAW MATERIALS:
1 ....... ...... 2. ...... ...... 3. ...... ......
Quantity
AUXILIARY MATERIALS: Item Quantity 1. Catalysts ...... 2. Lubricant ...... 3. ...... ......
PROCESS
PRODUCTS: Item Quantity 1 ....... ...... 2. ...... ...... 3. ...... ......
I I
SOLID WASTE:
1 ....... ...... Quantity
....... ...... I I
I I WASTEWATER: Item Qty Contaminant 1. Process ...... ...... 2. Condensate ...... 3. Cooling ...... ...... 4. Overflow ...... ...... 5. Cleaning ...... ......
......
WATER CONSUMPTION: Item Quantity 1. Showers ...... 2. Washing ...... 3. Dilution ...... 4. Cleaning ...... 5. ...... ......
AIR EMISSIONS: Item Qty Contaminant 1 ....... ...... ...... 2. ...... ...... ......
WORKSHEET 6B Energy Balance
I I I STEAM: PRODUCTS: Quality Quantity Item Heat Content Quantity
...... 1. ... ...... ...... ...... ...... 2. ... ...... ...... ...... ...... 3. ... ...... ......
1 2. 3.
.......
I I I
ELECTRICITY: ENERGY LOSSES: Quantity 71 PROCESS 1. ... ......
...... ...... 2. ... ...... I FUEL CONSUMPTION: Item 1. Coal 2. Oil 3. Agroresidues ...... 4. ...... ......
WASTEWATER:
...... 2. Condensate ...... 3. Cooling
The National Environmental Journal September/October 1995

The preferred choice. Proven hazmat safety at thousands of locations worldwi de...
Hazmat storage professionals around the world have found that they can trust us to deliver a quality product and respon- sive customer support. They know that our broad standard and engineered product
line will give them the flexibility to meet their specific hazardous materials storage, handling, and dispensing needs. They know that when you specify Safety Storage, you get more than just a hazmat building.
First, you get a safe, convenient way to deal with your hazardous materials, reducing your risk and liability. You can be assured of full compliance with all federal, state, and local environmental
regulations. Then, you get our more than 12 years
of experience in designing and manufac- turing hazmat buildings and lockers, more experience than anyone else in the indus- try. You get our wide range of engineering
and compliance know how. You get quality and cost benefits accruing from our more than 250,000 square feet of manu-
California Indiana Mexico
facturing space in three different plants.
staggering-they can shut you down and put you perma- nently out of business.
Our number one objective is to pro- vide you with a cost-effective way to reduce your hazardous materials risk and liability. Safety Storage is the confident choice-
the hazmat buildings and lockers that are trusted by the Fortune 2000 and the U S . Government. Whether your need is simply for storage or for a dedicated hazmat building engineered and built to safely isolate and contain a potentially vola-
tile process, Safety Storage is the safe buy. Your best buy. Call us today for complete details.
Unexpected hazmat clean-up costs and fines can be
. . .professional huzmat solutions!
1-800-344-6539 SAFETY STORAGE, INC. 2301 Bert Drive Hollister, CA 95023 Phone: 408-637-5955
@ @ @ ( a c AS , /E”
Evwg Sqfetg Storage buzldang %s buzlt wath quabty matenals and componmts, and anspected at every step an thepmduetumprocess Selected models are Factotory Mutual System (FM) agq)med or pmdang, U n d e m t e r s Laboratoms (UL)
Fax: 408-637-7405 SAFETY
classtfzed, and state certzfied STORAGE’“ CIRCLE 237 ON CARD FOR FREE INFO.
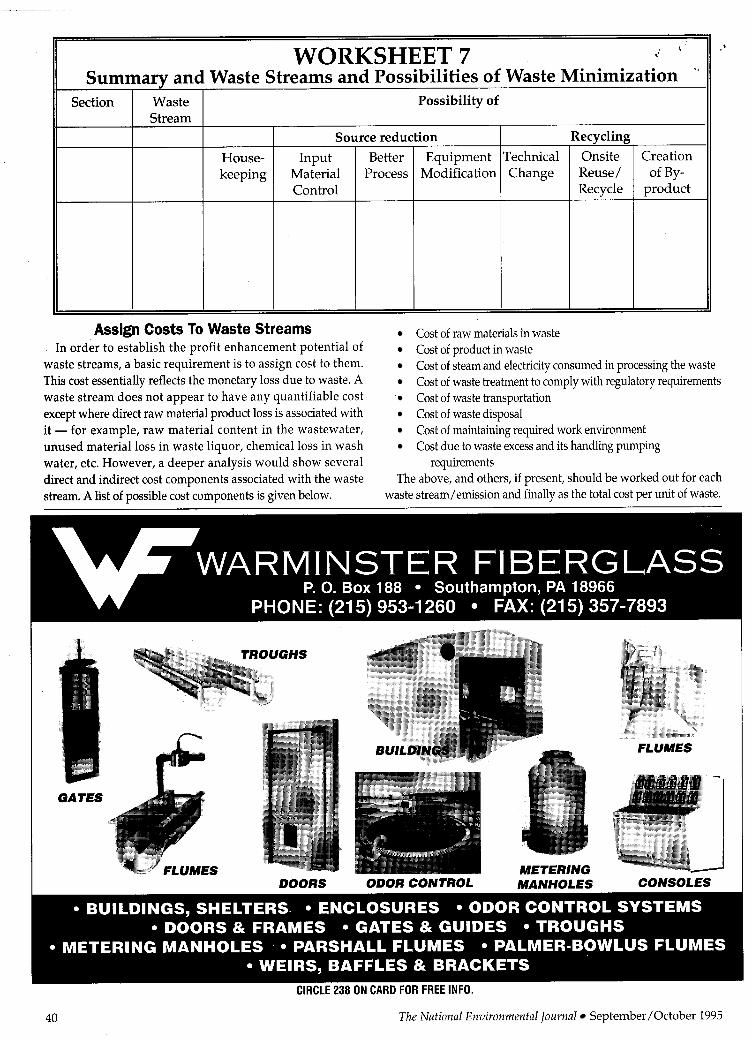
WORKSHEET 7 Summary and Waste Streams and Possibilities of Waste Minimization
L
* ’
Section I Waste I Possibility of Stream
I
Source reduction Recycling
House- Input Better Equipment Technical Onsite Creation keeping Material Process Modification Change Reuse/ of By-
Control Recycle product
I Assign Costs To Waste Streams
In order to establish the profit enhancement potential of waste streams, a basic requirement is to assign cost to them. This cost essentially reflects the monetary loss due to waste. A waste stream does not appear to have any quantifiable cost except where direct raw material product loss is associated with it - for example, raw material content in the wastewater, unused material loss in waste liquor, chemical loss in wash water, etc. However, a deeper analysis would show several direct and indirect cost components associated with the waste stream. A list of possible cost components is given below.
Cost of waste transportation Cost of waste disposal
The above, and others, if present, should be worked out for each waste stream/emission and finally as the total cost per unit of waste.
Cost of raw materials in waste Cost of product in waste Cost of steam and electricity consumed in processing the waste Cost of waste treatment to comply with regulatory requirements
Cost of maintaining required work environment Cost due to waste excess and its handling pumping
requirements
GATES
DOORS ODOR CONTROL MANHOLES
FLUMES
CONSOLES
40 The National Environmental Journal September/October 1995

Review of Process to Identify Causes The process can be reviewed in the context of most cost-inten-
sive wastes. Through the material and energy balances developed, a cost analysis should be carried out to locate and pinpoint the causes of waste generation. These causes would subsequently become the tools for evolving waste minimization measures. There could be a wide variety of causes for waste generation ranging from simple housekeeping lapses to complex technological rea- sons, as indicated below:
Poor Housekeeping Leaking taps/valves/flanges
Overflowing tanks
Spillage of chemicals. Operational and Maintenance Negligence
Low bath ratios Suboptimal loading of reactors
Unnecessary running of equipment Improper maintenance
',
Continuous running of hose pipes Excess water and or raw material uses
Spillage of raw material from worn-out transfer belts Contamination due to spillage of raw material
Sub-optimal conditions - improper temperature control
Wearing out/absence of insulation of reactors, steam pipes,
Improper maintenance of steam traps Worn out wire mesh, resulting in leakage/loss of materials
condensate pipes
Low and uncontrolled pressure of water in nozzles and cleaning showers
Continuance of worn-out press rolls with uneven surface, resulting in increased press picking and consequent production loss
Improper maintenance of condensate removal system from steam dryers
Poor Raw Material Quality
Poor layout Unplanned expansion Improper collection and handling Location of equipment
pressure drop Managerial Cases
Inadequately Trained Personnel
Employee demotivatinn Lack of appreciation Absence of reward/punishment policies Emphasis only on production
Use of dirty and degraded raw materials Use of low grade chemicals Improper storage of raw material.
Improper routing of steam pipes, resulting in unnecessary
Increased dependence on contract labor Lack of a formal training system and/or training facilities High turnover of senior technical personnel Understaffing at the technical personnel level
Lack of commitment and attention by top management
Developing Opportunities Having identified and assigned causes to waste genera-
tion, waste minimization measures can be determined. Sum- marizing waste streams as shown in Worksheet 7 would help in making a quick qualitative estimate of the possibili- ties of waste minimization.
work? How soon can it start? What will it cost?
With over 20 years' experience,
superior technical know-how in
removing organic contaminants, mobile air I and water adsorption systems of all sizes, and expert
I I A personnel, Calgon Carbon Express is ready
to help you immediately. For urgent temporary
solutions, and pemanent satifaction, count on Calgon
Carbon Express. Call 1 -800-4-CARBON today. ' I A CALGON CARBON CORPORATION
THE WORLD LEADER IN ACTIVATED CARBON TECHNOLOGY
P . O . B O X 7 1 7 , P I T T S B U R G H , P A 1 5 2 3 0 P"HA CIRCLE 239 ON CARD FOR FREE INFO.
The National Environmental Jouvnal September/October 1995 41

Waste Minimization Opportunity
Raw material section Material preparation section Stock preparation Production section
In this step, techniques such as brainstorming and group discussions can be used to determine all the possible options. Finding the potential options depends on the knowledge and creativity of team members. The range of waste minimization mea- sures could also be of help in developing specific opportunities. Some other sources of help in devel- oping waste minimization opportunities might be other personnel from similar plants, associations of task groups, and outside consultants.
Workable Waste Minimization Selection
The options developed are subsequently examined to assess their technical and economic feasibility. The weeding-out process should be simple, fast, and straightforward, and is often only qualitative. There should not be any ambi- guity or bias. Objectives should be to avoid the unnecessary effort of undertaking detailed feasi- bility analyses of opportunities that are impracti- cal or non-feasible.
Worksheet 8 would help in identifying which waste minimization opportunities:
*Can be implemented without any feasibility analysis (obvious measures).
*Require further detailed feasibility analysis. *Can be rejected. The selection of a waste minimization solution
for implementation requires that it should not only be technically and economically viable, but also environmentally desirable. The shortlisted oppor- tunities that require further detailed analysis should be studied from the following perspectives.
Determining Technical Feasibility The technical evaluation determines whether
a proposed waste minimization option will work for a specific application. The evaluation often begins with an examination of the impact of the proposed measure on process, product, production rate,and safety. In case there is sig- nificant deviation from the present process practices, laboratory testing and trial runs might be required to assess the technical feasi-
Category Direct Requires Reject
Implementable Further Analysis
Manufactured in the U.S.A. by: AEROMIX Systems, Incorporated 261 1 North Second Street MinneaDolis, Minnesota 5541 1-1634 U.S.A. I 800-879-3677 612-521-851 9 fax: 612-521 -1455
bilcy. A typical checklist for technical evalua-
42 The National Environmental Journal September/October 1995

WORKSHEET 9 Technical Feasibility Analysis
I
Requirement - YedNo I Indigenous Availability
4. Shutdown B. Technical Impact
. Area Impact
Equipment Instrumentation Technology
2. Space 3. Manpower
I Production Capacity Product Quality Energy Conservation
Steam Electrical
Chemical Consumption Safety Maintenance Operational Flexibility Others
II I Positive I Neeative
cally attractive. Such a strategy helps in creating more interest and commitment. The economic analysis can be conducted using a variety of meth- ods, including the payback period method, internal rate of return method, or net present value method. For low-investment, short-duration measures with attractive economic viability, the simplest-the pay back period method-is usually good enough.
A typical worksheet (Worksheet 10) that would help in working out techno-economic viability is given. It may have to be modified to suit different options, but care should be taken to keep it as sim-
are not economically viable should not be dropped out. It could be possible that some of these options might have a significant impact on the environment and may therefore warrant implementation even if they are economically unattractive.
ple and transparent as possible. Even measures that ~~
Environmental Aspects The measures that are technically not feasible due to unavail- able technology, equipment, space, or other reasons should be listed separately for future studies by technical personnel. Tech- nically feasible should next be subjected to an eco- nomic analysis.
The options for waste minimization must be assessed with respect to their impact On the environment. In many the environmental advantage is obvious: there is a net reduction in the toxicity and/or quantity of waste. Other effects could be changes in treatability of the waste or changes in applicability of environmental regulations. In the initial stages, environmental Economic Viability
Economic viability often becomes the key parameter for
sure. For a smooth takeoff, it is essential that the first few waste minimization measures reported to management are economi-
aspects may not appear to be as compelling as the economic
aspects may be the most important consideration, regardless of the economic
accepting or rejecting the proposed waste minimization mea- aspects. However, it should be realized that environmental
TERMSTM software is the latest program available to help you meet many of the EPA's most demanding regulations. TERMS (The Environmental Regulations Managemelzt system), is a logca1, easy-to-operate program that drastically reduces the time, paperwork and trouble it takes to 0 Air Tracking and comply with EPA, OSHA and state requirements. It also improves accuracy and increases peace-of-
Here's what TERMS provides - Q EPA-approve(l Form R, Tier 11
and CERCLA Spill Reporting
State Re1)orts CI Replatory Datahase Updates CI Query Systrms
Customer Satisfaction TERMS is offered hy Corl)usTM, a recognized leader in the field of environmental compliance. Not only (lo we offer the software programs you need, hut we also give on-site consultation and outstanding support services to provide your organization
L! MSDS Services, I d d i n g Scanning
The benefits of using TERMS - tl Saves time U Reduces the personnel required to
file reports U Cuts clown on paperwork
Decreases liability
with Y comp!ete, proactive com;r!iance program. A full money-back guarantee completes the package.
For more information : T M about TERMS,
contact Corbus at 1-800-5247096. coRsusTM
CIRCLE 241 ON CARD FOR FREE INFO.
The National Environmental Journal September/October 1995 43

Implementation Solution Following the technical, economical, and environmental
assessment, waste minimization measures may be selected for implementation. Understandably, the most attractive ones would be those with the greatest financial benefits, provided technical feasibility is favorable. However, in a growing num- ber of cases, specially when active pressure groups are present, environmental factor can take priority.
stopped, etc); several others, though, might require a sy$temati$- plan of implementation. The waste minimization t2am needs to prepare itself to take on the job of implementation. The prepa?ation would include seeking financial approvals, obtaining concurrence from concerned departments, establishing linkages in case of multi- department solutions, etc. These tasks require, in addition to the technical aspects, a careful handling of the concerned persons to ensure their support and cooperation throughout implementation.
Good liaison, awareness, and information dissem- WORKSHEET 10
Economic Viability Analysis Name/Description of the Waste Minimization Measure
Water
Land
Investment
Hardware Pumps Piping Civil Circulation tank Holding tank Equipment (specify) Land requirement Others Total
Annual Operating Cost
Interest (8.11%) Depreciation Maintenance (2.4%) Manpower Skilled Unskilled Energy Steam Electricity Chemicals Cost due to shutdown Others
Total
Gaseous Others BOD COD TS Others Solid Waste Organic In or e ani c
Savings
Energy Steam Electrical Chemicals Caustic Bleaching chemicals Additives Fiber Raw material Manpower Due to increased production Reduced environmental costs Treatment cost Waste transport cost Waste disposal cost Others
Total
Net Savings = (Savings - Operating cost)
PAYBACK = (Investment/Net Savings) x 12 = ... Months
In cases where a large number of waste minimization measures have been developed, it could be confusing to decide and allocate priority to them with respect to implementation. It would help in rating and prioritizing the measures for implementation. It would also be useful in determining the resources required (finances, manpower, time, etc.) and in evolving an implementation plan. A certain amount of subjectivity is intentionally introduced to enable the team to grade the measures even if they fall in the same cate- gory during the feasibility analysis.
It would be desirable to document the work done so far. Apart from becoming a reference document for seeking approvals and in implementation, the document would also be useful in obtaining finances from external institutions, report- ing status to other agencies and establishing base levels for per- formance evaluation review.
The selected solutions should next be taken up for implemen- tation. A large number of solutions can be implemented as soon as they are identified (leakages sealed, taps closed, idle running
ination assist implementation. Checklists of tasks involved, agencies/departments to be approached, contacts need, and the like also pro- vide useful help.
Implementing waste minimization solutions is analogous to any other industrial modification and does not require elaboration here. The tasks com- prise layout and drawing preparation, equipment fabrication/procurement, transportation to the site, installation and commissioning. Whenever required, simultaneous training of manpower should be undertaken, for an excellent measure may fail miserably if not backed by adequately trained people. To the extent possible, the imple- mentation team should be aware of the job and its purpose, as several useful suggestions have often emerged from the implementation crew.
Monitor and Evaluate Results Finally, the solutions implemented need to be
monitored for performance evaluation. The results obtained should be matched with those esti- mated/worked out during technical evaluation; any causes for deviation should be established.
Shortcomings shouid be specifically highlighted and taken care of. A comprehensive report should be prepared to inform manage- ment and concerned personnel should be made aware of the results. Implementation is considered to be over only after success- ful commissioning and sustained stable performance over a reason- able length of time.
The biggest challenge in waste minimization in small industry lies in sustaining a program. The euphoria of a waste minimization program soon dies out and the situation returns to where it started. The zeal of the waste minimization team also tends wane. Often, top management is responsible for such lackluster ends. Backing out on commitments, emphasizing production at any cost, absence of rewards, and appreciation for performers and shifting priorities are some of the commonly encountered reasons that need to be checked and avoided.
The monitoring and review of the implemented measures should be presented so that the desire to minimize waste is encouraged. Efforts should be made to integrate waste minimization with the
WORKSHEET 11 Environmental Aspects Analysis
Namemescription of the Waste Minimization Measure Medium I Parameter I Impact on Environment
Qualitative Quantitative Air I Particulates I I
normal planning process of the company. The involvement of as large a number of employees as possible and rewarding the deserving is a sure key to long-term sustenance. In a nutshell, a philosophy of minimizing waste must be devel- oped within the organization so that waste mini- mization becomes an integrated part of the organization’s activities.
For additional information, contact the author, Louise Ferrante, The National Environmental Journal, 230 Terrace Avenue, Has-
cl brouck Heights, NJ 07604, Phone: 201 -288-5992.
44 The National Environmental Journal September/October 1995