Embed Size (px)
Citation preview
WASTEWATER TREATMENT USING MICROALGAE
AZNA BINTI ABDUL AZIZ
THESIS SUBMITTED TO FULLFILL THE REQUIREMENT FOR
MASTER OF BIOTECHNOLOGY
FACULTY OF SCIENCE
UNIVERSITY OF MALAYA
KUALA LUMPUR
JANUARY 2013
ii
Abstract
Three species of selected microalgae isolated from Tasik Taman Jaya, Oscillatoria
limnosa, Scenedesmus quadricauda and Pediastrum duplex, were cultured in Chu no.
10 defined medium. After the microalgae reached their optimum growth they were
grown in wastewater to observe their capability to remove inorganic nutrients in
wastewater. The microalgae showed steady increase in cell density for the duration of
laboratory observation of eighteen days. As the cell density of the microalgae increased,
both nitrate and phosphate concentration in wastewater decreased. This study showed
that all the three species of microalgae have the ability to reduce the nutrients. Among
them, Pediastrum duplex was most efficient in reducing inorganic nutrients in
wastewater. It reduced 60% and 75% of the total nutrients of wastewater from Station A
and Station B respectively. By using this biological wastewater treatment, less chemical
and physical treatment is needed to improve wastewater quality. The biologically
treated wastewater can then be discharged into the reservoirs, rivers or streams.
iii
Abstrak
Tiga spesies mikroalga yang diasingkan dari Tasik Taman Jaya iaitu Oscillatoria
limnosa, Scenedesmus quadricauda dan Pediastrum duplex telah dikulturkan di dalam
media pertumbuhan Chu no. 10 di dalam makmal. Setelah mikroalga tersebut mencapai
pertumbuhan yang optima, ia telah membiak di dalam air kumbahan, seterusnya
menunjukkan keupayaannya untuk menyingkirkan nutrien tak organik dalam air sisa.
Selepas 18 hari pemerhatian makmal dilakukan, ia menunjukkan peningkatan yang agak
stabil dari sudut kepadatanya. Ketika kepadatan sel mengalami peningkatan, kandungan
nitrat dan fosfat di dalam air sisa menunjukkan bacaan yang menurun. Dapatan dari
kajian menunjukkan bahawa Pediastrum duplex ialah sel yang paling berkesan untuk
mengurangkan kandungan nutrien tak organik di antara ketiga-tiga spesies mikroalga
ini. Hasil dari bacaan makmal ke atas Stesen A dan B, ia menunjukkan bahawa
sebanyak 60% dan 75% jumlah kandungan nutrien air sisa telah dikurangkan
kepekatannya. Sehubungan itu, dengan mengaplikasikan kaedah rawatan secara biologi
ke atas air sisa ia juga mampu mengurangkan kebergantungan ke atas kaedah rawatan
secara kimia dan fizikal untuk memastikan kualiti air terjamin. Seterusnya, apabila
proses rawatan secara biologi dilaksanakan maka penyaliran air sisa ke dalam kawasan
reserviour dan sungai dapat disalirkan.

iv
ACKNOWLEDGEMENT
In the name of Allah, The Most Gracious, Most Merciful. Praise is to Allah, The
Cherisher and Sustainers of the Worlds for without Him nothing is possible.
This dissertation would not have been possible without the assistance, support
and guidance from a number of people. Thus, I would like to express my
deepest appreciation and gratitude to those individuals.
First of all, I would like to give my thankful to my supervisor Prof. Datin Dr.
Aishah Salleh for her helpful and give me ideas to build up my project. Thanks
are also to my lab mate at MUCED; Kak Nadia, Kak Zan, Sarini and Diana as
they help me in my lab work and identification of the microalgae.
Nevertheless, to Saiful, the lab assistant, in helping me providing the sampling
apparatus and lab apparatus.
To my beloved family (abah, mak, angah, cik and adik) thank you so much for
supporting me during my studies and during my research. Nothing is more
precious than a family love.
And also to my husband, Mohd Hanafia thank you for everything as you never
gives up supporting me and always gives a motivational advice to me………
AZNA BINTI ABDUL AZIZ
SGF 040026
2012/2013
v
List of Contents
Abstracts ii
Abstrak iii
Acknowledgement iv
List of Content v
List of Figures viii
List of Tables ix
List of Plate xi
List of Abbreviation xii
List of Symbols xiii
List of Appendices xiv
Chapter 1
1 :Introduction 1
1.1 : Objectives 5
Chapter 2
2 : Literature review 6
2.1 : Water Pollution 6
2.2 : Eutrophication 11
2.3 : Phytoplankton 15
2.3.1) Growth Factors for Phytoplankton 20
2.4 : Microalgae and Environment 25
2.5 : Application of microalgae in wastewater using various
way of treatment 28
vi
Chapter 3
3 : Methodology 31
3.1 : Tasik Taman Jaya and collection of water sample 31
3.2 : Microalgae identification 35
3.3 : Water Quality 35
a) Nitrate 36
b) Phosphate 36
c) Silica 36
3.3.1 : Water quality data analysis 37
3.4 : Culture Preparation 37
3.4.1) Media 37
3.4.2) Isolation 38
3.4.3) Culture Method 39
3.5 : Nutrients Removal 39
3.6 : Growth 40
Chapter 4
4 : Results and Discussion 41
4.1 : Species of microalgae at Tasik Taman Jaya 41
4.2 : Water quality analysis 42
4.2.1) Nitrate Removal 47
4.2.2) Phosphate Removal 48
4.2.3) Silica Removal 49

vii
4.3 : Growth 50
4.4 : Relation between growth of wastewater and nutrient removal 53
Chapter 5
5 : Conclusion 66
References 67
viii
List of Figures
Figure 4.1 : Growth of Oscillatoria limnosa in water sample from Station
A and Station B during the experiment period
51
Figure 4.2 : Growth of Scenedesmus quadricauda in water sample from
Station A and Station B during the experiment period
52
Figure 4.3 : Growth of Pediastrum duplex in water sample from Station A
and Station B during the experiment period
53
Figure 4.4 : Nutrients reduction vs. growth of Oscillatoria limnosa in
water sample from Station A
55
Figure 4.5 : Nutrients reduction vs. growth of Oscillatoria limnosa in
water sample from Station A
56
Figure 4.6 : Nutrients reduction vs. growth of Pediastrum duplex in water
sample from Station B
58
Figure 4.7 : Nutrients reduction vs. growth of Pediastrum duplex in water
sample from Station A
59
Figure 4.8 : Nutrients reduction vs. growth of Scenedesmus quadricauda
in water sample from Station B
61
Figure 4.9 : Nutrients reduction vs. growth of Scenedesmus quadricauda
in water sample from Station A
62

ix
List of Tables
Table 2.1 : Type of pollutants 7
Table 2.2 : The physical characteristics of wastewater 11
Table 2.3 : The general characteristic of oligotrophic and eutrophic lake 12
Table 2.4 : Type of nutrition found in the algae 17
Table 4.1 : Microalgae composition in Tasik Taman Jaya 42
Table 4.2 : Nutrients concentration of water collected from Station A and
inoculated with Oscillatoria limnosa
43
Table 4.3 : Nutrients concentration of water collected from Station A and
inoculated with Scenedesmus quadricauda
43
Table 4.4 : Nutrients concentration of water collected from Station A and
inoculated with Pediastrum duplex
43
Table 4.5 : Nutrients concentration of water collected from Station A
without inoculated
44
Table 4.6 : Nutrients concentration of water collected from Station B and
inoculated with Oscillatoria limnosa
44
Table 4.7 : Nutrients concentration of water collected from Station B and
inoculated with Scenedesmus quadricauda
44
Table 4.8 : Nutrients concentration of water collected from Station B and
inoculated with Pediastrum duplex
45
Table 4.9 : Nutrients concentration of water collected from B without
inoculated
45
Table 4.10 : Amount of nitrate in water sample from Station A 45
Table 4.11 : Amount of phosphate in water sample from Station A 46
Table 4.12 : Amount of silica in water sample from Station A 46

x
Table 4.13 : Amount of nitrate in water sample from Station B 46
Table 4.14 : Amount of phosphate in water sample from Station B 47
Table 4.15 : Amount of silica in water sample from Station B 47
xi
List of Plate
Plate 3.1 : Sampling location at Tasik Taman Jaya 32
Plate 3.2 : Station A showing the first inlet of the lake 33
Plate 3.3 : Station B showing the second inlet of the lake 33
Plate 3.4 : Outlet of the lake 34
Plate 3.5 : The apparatus for sampling (plankton net, bottles and vials) 34
Plate 3.6 : The computer and microscope used for identification of
microalgae
35
Plate 3.7 : Hach Spectrometre for measuring water quality 37
xii
List of Abbreviation
BOD = Biological Oxygen Demand
TSS = Total Suspended Solid
Cd = Cadmium
Hg = Mercury
Co = Cobalt
Pb = Plumbum
Cu = Cuprum
Cr = Chromium
Fe = Ferum
N = Nitrogen
P = Phosphorous
sp. = species
mg/L = milligram per liter
g/L = gram per liter
µm = micrometer
µg = microgram
xiii
List of Symbols
β = beta
°C = degree
± = plus minus
% = percent
pH = power of Hydrogen
m2 = meter square
m3 = meter cube
Mg2+
= Magnesium ion
Na+ = Natrium ion
K+ = Kalium ion
Ca+ = Calcium ion
xiv
List of Appendices
Appendix 1 : Nutrients removal in water sample from Station A 75
Appendix 2 : Nutrients removal in water sample from Station B 77
Appendix 3 : Growth of microalgae 79
Appendix 4 : Statistical Analysis for Oscillatoria limnosa from
Station A
80
Appendix 5 : Statistical Analysis for Oscillatoria limnosa from
Station B
81
Appendix 6 : Statistical Analysis for Scenedesmus quadricauda
from Station A
82
Appendix 7 : Statistical Analysis for Scenedesmus quadricauda
from Station B
83
Appendix 8 : Statistical Analysis for Pediastrum duplex from
Station A
84
Appendix 9 : Statistical Analysis for Pediastrum duplex from
Station B
85
1
Chapter 1
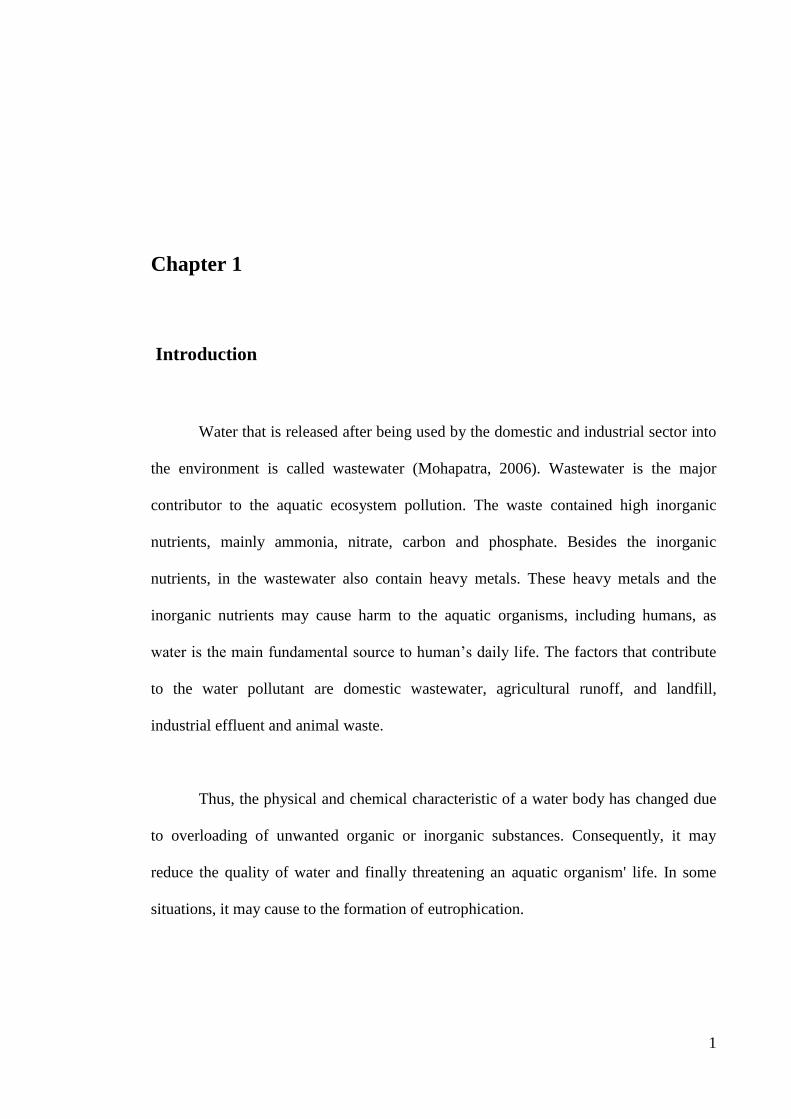
Introduction
Water that is released after being used by the domestic and industrial sector into
the environment is called wastewater (Mohapatra, 2006). Wastewater is the major
contributor to the aquatic ecosystem pollution. The waste contained high inorganic
nutrients, mainly ammonia, nitrate, carbon and phosphate. Besides the inorganic
nutrients, in the wastewater also contain heavy metals. These heavy metals and the
inorganic nutrients may cause harm to the aquatic organisms, including humans, as
water is the main fundamental source to human’s daily life. The factors that contribute
to the water pollutant are domestic wastewater, agricultural runoff, and landfill,
industrial effluent and animal waste.
Thus, the physical and chemical characteristic of a water body has changed due
to overloading of unwanted organic or inorganic substances. Consequently, it may
reduce the quality of water and finally threatening an aquatic organism' life. In some
situations, it may cause to the formation of eutrophication.
2
Eutrophication occurs when a lake is rich in phosphate and nitrate. This is
indicated by existence of aquatic plants and algal biomass. Eutrophication changes the
biodiversity cycle and biological communities mostly at all levels in the food web as
well as entire communities (Hall and Smol, 1999). Phosphate and nitrate are the major
nutrients that cause eutrophication in water bodies were treated sewage effluents are
discharged into the lake (Shushu and Chipeta, 2002). These nutrients might produce an
algal bloom as the nutrients overload the water bodies. Hutchinson (1967) noted that
water clarity often indicates the overall lake’s water quality and species of algae
inhabiting it.
Nowadays, there are many ways to treat wastewater whether by chemical or
biological methods. To be environmental friendly, a biological treatment has been
chosen as an alternative way to treat wastewater. In biological treatments organisms are
used. The organisms that are often used in this method are bacteria, fungi and
microalgae. In some biological treatments, combinations of organisms are used in order
to be more effective and give a good outcome. Besides using the microorganisms,
aquatic plants are also useful in treating aquatic problems.
According to Tchobanoglous and Burton (1991), chemical and physical based
technologies are more convenient to remove nutrients and metals from wastewater.
However, these technologies are very costly and consumed a high magnitude of energy
as well as chemicals. Therefore, through chemical treatment, it may cause other major
problems such as an increasing of elements in the wastewater and high cost for
operation (Hoffmann, 1998).
3
The purpose of this study is to investigate the effectiveness of microalgae in
reducing the inorganic matter in the wastewater as well as to create an environmental
friendly to the ecosystem without involve any chemicals in the treatment process.
Algae are aquatic organisms that are photosynthetic, oxygenic autotroph that are
typically smaller and have less complex of structure compared to terrestrial plants
(Graham and Wilcox, 2000). Algae can be divided into microalgae and macroalgae.
Microalgae are also called phytoplankton, microphytes or planktonic algae, while
macroalgae are commonly known as seaweed. Phytoplanktons are those plants that float
aimless or swim freely to maintain a constant position against the water current
(Graham and Wilcox, 2000). Freshwater phytoplankton forms the base of the aquatic
food chain, and without it, the freshwater fisheries could not exist.
There are various types of shapes and sizes of the planktonic algae. Some of
them occur as a single cell or unicell and some of them from a colony. A colony is a
group of individual cells in which they may be either a variable number of cells that
remain constants throughout the life of the individual. Some colony is referring to as
coenobium (Graham and Wilcox, 2000). Another form of planktonic algae is the
filament. It may be branched or un-branched, and it may form a single series of the cells
(uniseriate) or multi series (pluriseriate). Although the planktonic algae have varied in
structure forms, it can be either motile or non-motile. Mortality conferred in various
ways; from swimming or creeping, pushing or by floating device. However, many non-
motile planktonic algae are reproduced by the motile cells (Canter-Lund and Lund,
1995).
4
Becker (1994) noted that under natural condition, most of the algae grow as
mixed communities, which include various species and genera. Thus, the successful
growth of microalgae in a culture is depending of the environment factors. It may be
either physical; such as temperature and light, or chemical; which provides all the raw
materials use for their development of the algal cell (Becker, 1994). Wastewater
treatment with microalgae offered a simpler solution than culture intended for the
production of clean biomass and highly valuable material (De la Noüe et.al., 1992).
Microalgae were selected as the wastewater treated owing to their effectiveness
in reducing the nutrient in the water bodies by utilizing the inorganic nutrients as for
survival. Laliberté et. al (1994) found that the use of microalgae for wastewater
treatment is affected by environmental condition including pH, temperature, light,
inorganic carbon, effluent composition and retention time.
The wastewater treatment using microalgae, had been done about 40 years ago,
which has been described by Oswald and Gotaas (1957). The focused was suspended
microalgae growing in shallow, artificial ponds containing sewage (Hoffmann, 1998).
According to Hoffmann (1998), non-suspended algae was used either as unialgal
cultures immobilized in a polymeric matrix or as attached algal communities, which are
grown in shallow, artificial streams or on the surface of rotating biological contractors
(RBC/biodiscs).
There are several advantages of applying microalgae in the biological treatment
compared to conservative treatments. The microalgae are very effective in consuming
the inorganic nitrogen and phosphorus for their growth developments. In addition, they
could purify waste by producing oxygen and removing heavy metals as well as
5
xenobiotic substance (Martínez et.al., 2000). Other than that, by using biological
treatment, it also does not cause a secondary pollution if the biomass produce is re-used.
1.1 Objectives
Tasik Taman Jaya is a highly polluted lake. Therefore, a lot of effort must be taken to
reduce the inorganic nutrients in the water bodies before the water can be discharged
into rivers. Previous studies reported that this lake experienced an eutrophication
process (Norhayati, 1995; Saravanamuthu, 1977). Having said that the researcher would
like to extend this study by emphasizing the following objectives:
1. To study the composition and abundance of microalgae in the lake.
2. To identify algae species that are associated with the water pollution that can be
used for wastewater treatment.
3. To examine the efficiency and the growth of the different selected microalgae in
the wastewater and their ability to remove inorganic nutrients.
6
Chapter 2
Literature review
2.1 Water Pollution
Water plays a significant role in the development of the society due to adequate
supply as well as safety for the humankind. Instead of man, animals and plants also
need water for their survival. Approximately, 70 % of the component on the earth is
water. However, only 3% is the freshwater and the rest is salty water. The freshwater
can be finding either as the glacier (2.997%) or natural water at 0.003% (Abdul Aziz,
1999a). Thus it is important to maintain a very little quantity of natural water, because it
most essential for daily uses. Recently, our water supply has become a problem. There
are many polluted matters in the water bodies. This happens due to lack of awareness to
protect the environment, especially aquatic environment.
According to The Malaysian Environmental Quality Act 1974 pollution is
defined as" any direct or indirect alteration of the physical, thermal, chemical, biological
or radioactive properties of any part of the environment by discharging, emitting or
depositing waste to affect any beneficial use adversely, to cause a condition that is
hazardous to public health, safety or welfare or to animals, birds, wildlife, fish or
7
aquatic life or plants to cause a contravention of any condition, limitation or restriction
to which a license under the act is subject” (Abdul Salam, 1999).
Pollutions are usually classified into water pollution, air pollution, land
pollution, thermal pollution as well as sound pollution. Pollution mostly results from
human activities. Pollution problems become the worst year by year is due to the
growing population as well as expanding per-capita use of materials and energy have
increased the amount of by-product that comes into environment (Wright, 2005). Most
of the materials used in home and industries are non-biodegradable; examples are
aluminum cans, plastic packaging and synthetic organic chemicals. Thus, these
materials cannot breakdown by the detritus feeder and decomposers. Due to this reason,
the non-biodegradable is accumulated in the environment and causes the pollutions.
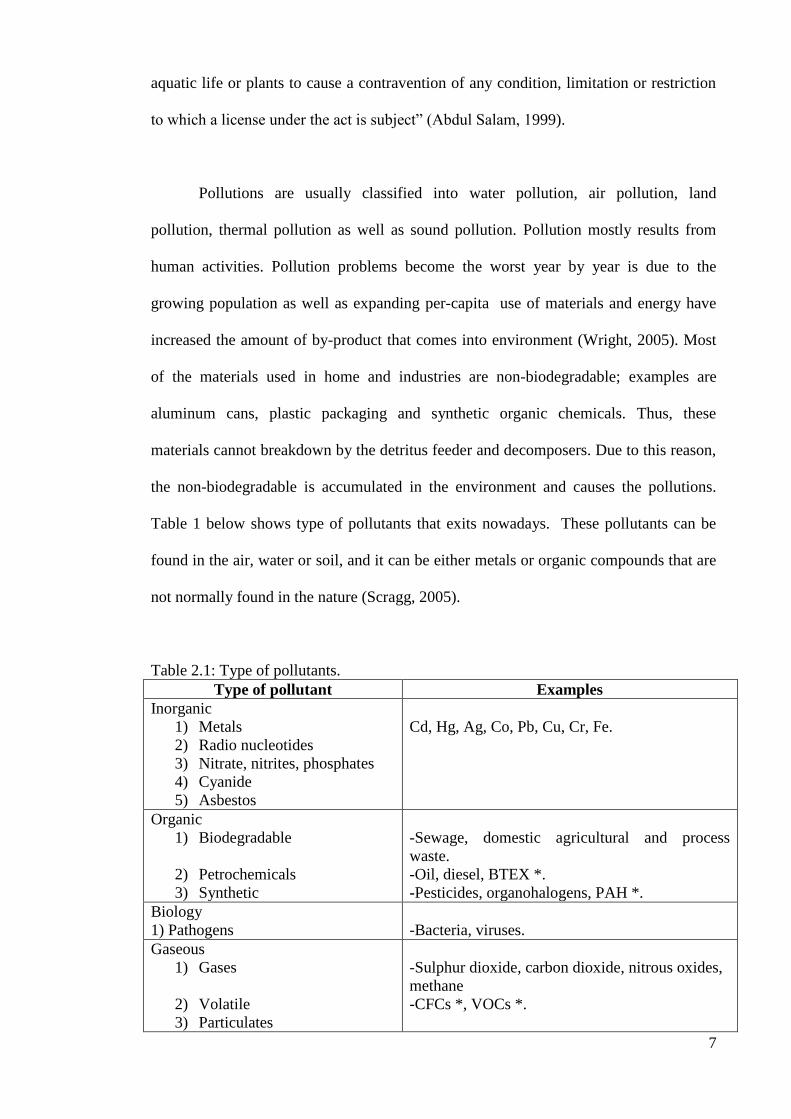
Table 1 below shows type of pollutants that exits nowadays. These pollutants can be
found in the air, water or soil, and it can be either metals or organic compounds that are
not normally found in the nature (Scragg, 2005).
Table 2.1: Type of pollutants.
Type of pollutant Examples
Inorganic
1) Metals
2) Radio nucleotides
3) Nitrate, nitrites, phosphates
4) Cyanide
5) Asbestos
Cd, Hg, Ag, Co, Pb, Cu, Cr, Fe.
Organic
1) Biodegradable
2) Petrochemicals
3) Synthetic
-Sewage, domestic agricultural and process
waste.
-Oil, diesel, BTEX *.
-Pesticides, organohalogens, PAH *.
Biology
1) Pathogens
-Bacteria, viruses.
Gaseous
1) Gases
2) Volatile
3) Particulates
-Sulphur dioxide, carbon dioxide, nitrous oxides,
methane
-CFCs *, VOCs *.
8
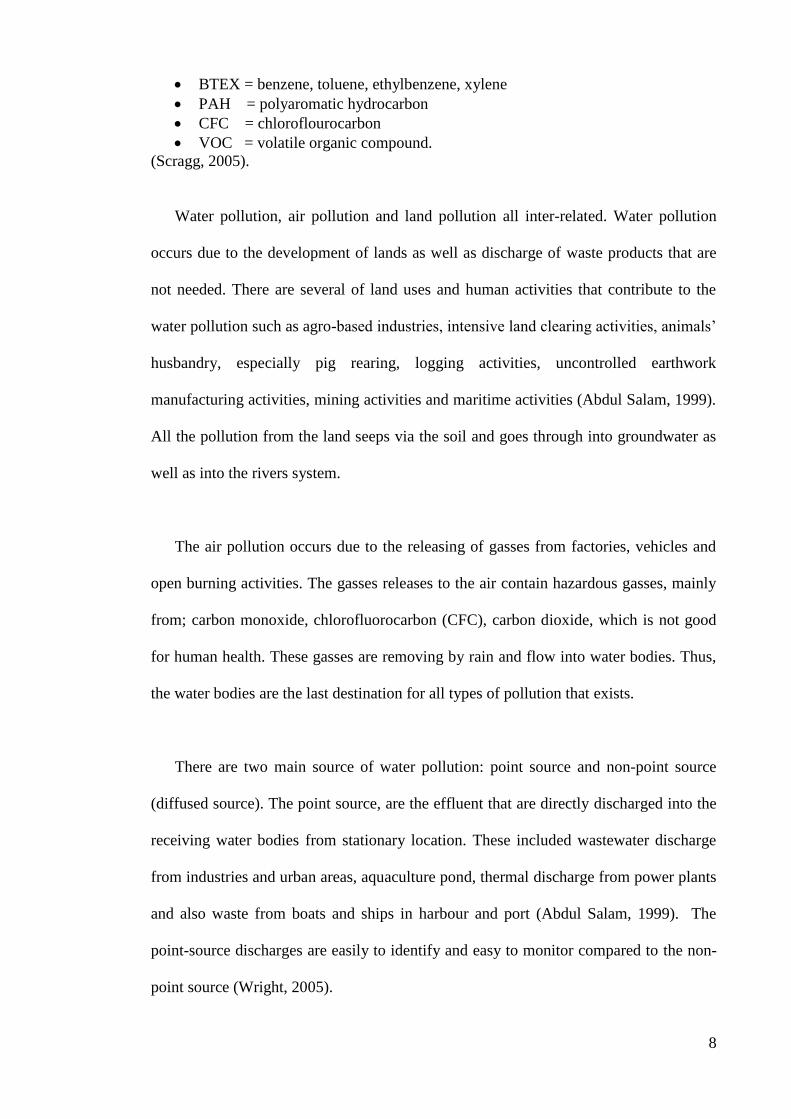
BTEX = benzene, toluene, ethylbenzene, xylene
PAH = polyaromatic hydrocarbon
CFC = chloroflourocarbon
VOC = volatile organic compound.
(Scragg, 2005).
Water pollution, air pollution and land pollution all inter-related. Water pollution
occurs due to the development of lands as well as discharge of waste products that are
not needed. There are several of land uses and human activities that contribute to the
water pollution such as agro-based industries, intensive land clearing activities, animals’
husbandry, especially pig rearing, logging activities, uncontrolled earthwork
manufacturing activities, mining activities and maritime activities (Abdul Salam, 1999).
All the pollution from the land seeps via the soil and goes through into groundwater as
well as into the rivers system.
The air pollution occurs due to the releasing of gasses from factories, vehicles and
open burning activities. The gasses releases to the air contain hazardous gasses, mainly
from; carbon monoxide, chlorofluorocarbon (CFC), carbon dioxide, which is not good
for human health. These gasses are removing by rain and flow into water bodies. Thus,
the water bodies are the last destination for all types of pollution that exists.
There are two main source of water pollution: point source and non-point source
(diffused source). The point source, are the effluent that are directly discharged into the
receiving water bodies from stationary location. These included wastewater discharge
from industries and urban areas, aquaculture pond, thermal discharge from power plants
and also waste from boats and ships in harbour and port (Abdul Salam, 1999). The
point-source discharges are easily to identify and easy to monitor compared to the non-
point source (Wright, 2005).
9
The non-point sources are typically generated from human's activities that cannot be
traced and difficult to monitor and control. The bases to the non-point source polluted
are sediment, nutrient, fecal, bacteria, pesticides and herbicides. According to Abdul
Salam (1999), all of these causes are come from a number of sources that include runoff
from urban area, agricultural land and waste disposal site (landfills). However, the
wastewaters contribute more to the water pollution nowadays.
Wastewater is defined as liquid waste from the residential, institutions, public areas,
commercials and industries. The liquid waste originated from the toilets, bathrooms,
tabs, kitchens and others. According to Abdul Aziz (1999a), about 70 to 80 % of the
water supply has become wastewater. Overall, 99.9% of wastewater is water and 0.1%
is solid. The solid component consists of organic and inorganic matter such as soaps and
soil solids, urines, food residues, feces, papers and miscellaneous substances (Metcalf
and Eddy, 1991) as well as rich in microorganisms. Therefore, by good management,
wastewater can be used as fertilizer as well as to feed the microorganisms.
In urban areas, wastewater is usually classified as municipal or industrial
wastewater. This municipal sewage is an unbalanced medium and is overly rich in
phosphorus that is the essential nutrient for the algae. The nutrient content of the
industry's waste is much more variable than that is from the domestic waste. Some
industries discharge waste of low nutrient's content, which may require the addition of
nutrient to facilitate biological treatment (Rohlich and Littormark, 1972).
Wastewater can be characterized according to its chemical constituents (nitrogen,
phosphorus, sulfur, chloride) and pH. The pH of wastewater is usually more than 7.0.
However, it becomes more acidic if it experiences an anaerobic process. This is due to
10
the process that produces methane (CH4), carbon dioxide (CO2) and hydrogen sulfide
(H2S) which give the acidic environment to the sewage. The anaerobic process occurred
when organic matter is degraded by bacteria in oxygen lacking environment to release
acidic gasses.
In wastewater, the main nutrient source is nitrogen. Usually in wastewater nitrogen
will undergoes nitrification process converting ammonia to nitrate and nitrite. Besides,
nitrogen, phosphate is another main nutrient that can be finding in the wastewater.
Phosphate is the main nutrient for the oxidation process (Jackson et. al., 1990). It is
occurred at level 5-15 mg/L.
The sulfate comes from many sources, but mainly from detergent. It causes
problems to the culvert system as it releases hydrogen sulfide (H2S) in anaerobic
condition. As the H2S combine with the water, it may form sulphuric acid, and it may
cause erosion to the culvert (Abdul Aziz, 1999b). Chloride usually occurs at the level
50-100 mg/L in the sewage (Nicoll, 1988). It originated from urea. Wastewater can also
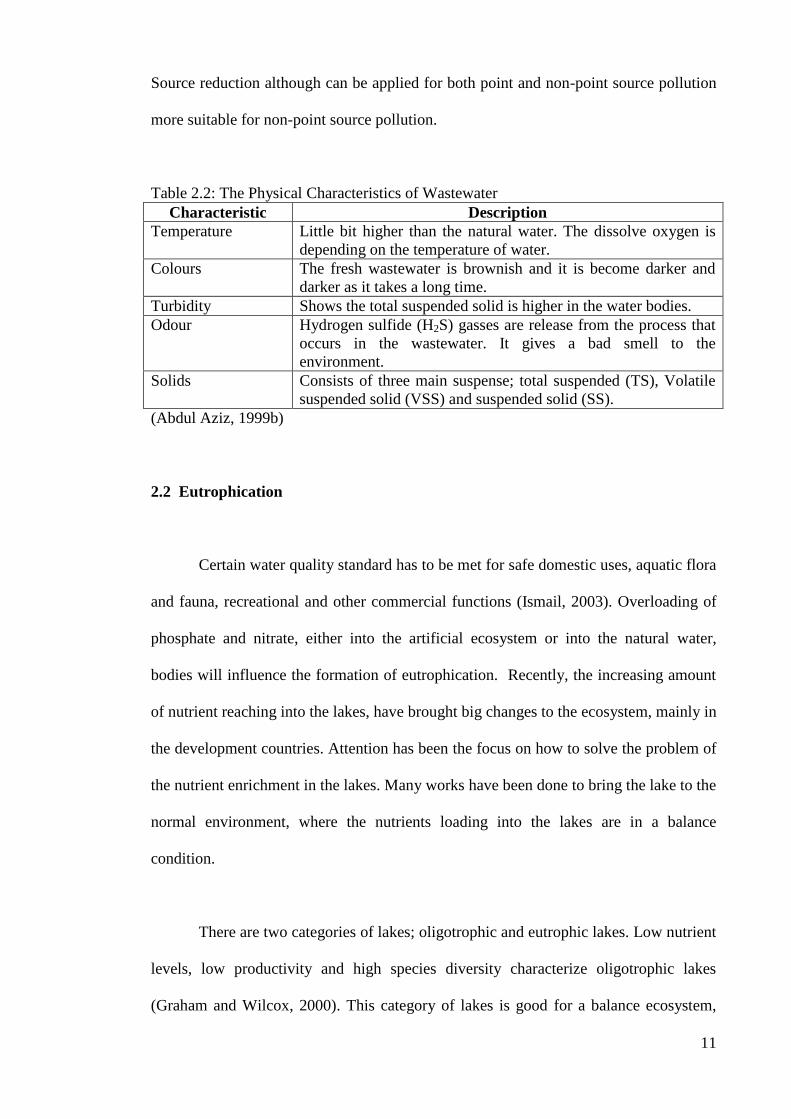
be analyzed by occurrence of organic matter and metals. The physical characteristic of
the wastewater are influenced by the environmental surrounding. The physical
characteristics of the wastewater are shown in the Table 2.2 below.
According to Wright (2005), there are two basic strategies to bring water
pollution under control. The first strategy is to reduce or remove the source. The next
strategy is to treat the water by removing pollutants or converting them to harmless
forms. The best solution to solve the point-source water pollution is by water treatment.
Organic matter + bacteria CO2 + CH4 + H2S + new cells
(In sewage) (Without oxygen)
11
Source reduction although can be applied for both point and non-point source pollution
more suitable for non-point source pollution.
Table 2.2: The Physical Characteristics of Wastewater
Characteristic Description
Temperature Little bit higher than the natural water. The dissolve oxygen is
depending on the temperature of water.
Colours The fresh wastewater is brownish and it is become darker and
darker as it takes a long time.
Turbidity Shows the total suspended solid is higher in the water bodies.
Odour Hydrogen sulfide (H2S) gasses are release from the process that
occurs in the wastewater. It gives a bad smell to the
environment.
Solids Consists of three main suspense; total suspended (TS), Volatile
suspended solid (VSS) and suspended solid (SS).
(Abdul Aziz, 1999b)
2.2 Eutrophication
Certain water quality standard has to be met for safe domestic uses, aquatic flora
and fauna, recreational and other commercial functions (Ismail, 2003). Overloading of
phosphate and nitrate, either into the artificial ecosystem or into the natural water,
bodies will influence the formation of eutrophication. Recently, the increasing amount
of nutrient reaching into the lakes, have brought big changes to the ecosystem, mainly in
the development countries. Attention has been the focus on how to solve the problem of
the nutrient enrichment in the lakes. Many works have been done to bring the lake to the
normal environment, where the nutrients loading into the lakes are in a balance
condition.
There are two categories of lakes; oligotrophic and eutrophic lakes. Low nutrient
levels, low productivity and high species diversity characterize oligotrophic lakes
(Graham and Wilcox, 2000). This category of lakes is good for a balance ecosystem,
12
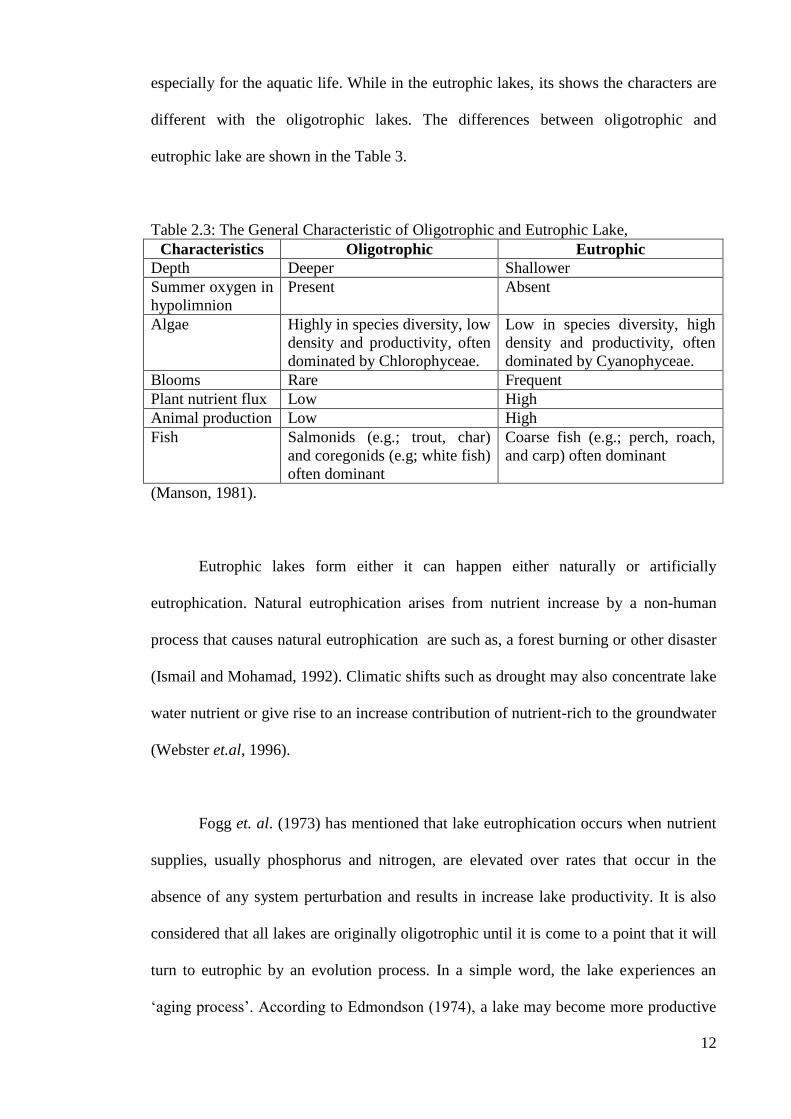
especially for the aquatic life. While in the eutrophic lakes, its shows the characters are
different with the oligotrophic lakes. The differences between oligotrophic and
eutrophic lake are shown in the Table 3.
Table 2.3: The General Characteristic of Oligotrophic and Eutrophic Lake,
Characteristics Oligotrophic Eutrophic
Depth Deeper Shallower
Summer oxygen in
hypolimnion
Present Absent
Algae Highly in species diversity, low
density and productivity, often
dominated by Chlorophyceae.
Low in species diversity, high
density and productivity, often
dominated by Cyanophyceae.
Blooms Rare Frequent
Plant nutrient flux Low High
Animal production Low High
Fish Salmonids (e.g.; trout, char)
and coregonids (e.g; white fish)
often dominant
Coarse fish (e.g.; perch, roach,
and carp) often dominant
(Manson, 1981).
Eutrophic lakes form either it can happen either naturally or artificially
eutrophication. Natural eutrophication arises from nutrient increase by a non-human
process that causes natural eutrophication are such as, a forest burning or other disaster
(Ismail and Mohamad, 1992). Climatic shifts such as drought may also concentrate lake
water nutrient or give rise to an increase contribution of nutrient-rich to the groundwater
(Webster et.al, 1996).
Fogg et. al. (1973) has mentioned that lake eutrophication occurs when nutrient
supplies, usually phosphorus and nitrogen, are elevated over rates that occur in the
absence of any system perturbation and results in increase lake productivity. It is also
considered that all lakes are originally oligotrophic until it is come to a point that it will
turn to eutrophic by an evolution process. In a simple word, the lake experiences an
‘aging process’. According to Edmondson (1974), a lake may become more productive
13
with time. This is due to the effect shallowing of the lake which affects the way it
converts nutrients into the organism rather than an increase input of nutrient.
Artificial eutrophication is also known as cultural eutrophication. The cultural
eutrophication occurs due to the loading of nutrients from humans’ activities.
Eutrophication may also happen by rapid development and density of human
population, in a large urban settlement. Loading of additional nutrients such as food and
modern detergent contribute to the changes in the catchments-lake (Reynolds, 1984).
When outcomes of eutrophication are undesirable to human, it is considered as a form
of pollution.
Eutrophication defined as nutrient or organic matter enrichment, or both that
result in high biological productivity and a decrease volume within an ecosystem
(Likens, 1972). It is occurred when the lakes are high in phosphorous concentration and
exhibit increase plants and algal blooms as well as reduce biodiversity. The most
important feature of a eutrophic lake is the concentration of oxygen in the hypolimnion
become significantly reduces (Reynold, 1984) as well as the depth of the lake became
shallower.
The lake ecosystem nutrient may exchange between three general compartments.
Those are available nutrients, organic matter as well as primary and secondary minerals.
According to Likens and Bormann, (1971), available nutrients are those dissolve in
water or on exchange surface of pelagic particulate matter or bottom sediment. While
the organic matter, are those nutrients that incorporated in living or dead organic matter.
Both are in the pelagic region or in the sediment. The primary and secondary minerals
14
are those nutrients integrated in rock, which exists in the sediment or suspended in the
water.
Eutrophication may also cause changes to biochemical cycles and biological
communities. For instant, changes in the ratio of nitrogen and phosphate (N: P), often
results in primary production shifting from primarily diatom and other smaller edible
algae toward larger cyanobacteria that are better competitor for nitrogen (Tilman et.al.,
1986).
There are several factors that contribute to eutrophication. They are mostly
consequences of human activities. Opening of land for the development for residential
or industries cause water run-off that brings soils into rivers or lakes. This causes lakes
or rivers to become shallow. Industrial waste, such as from the electronic, chemicals,
foods and textile and paper industries, where the wastes contain high in hazardous
components also contribute to eutrophication. Eutrophication can also indirectly brought
by air. For example, the oxidation nitrogen comes from the toxic gases of the vehicles,
which bring along by the rain (Ismail and Mohamad, 1992).
Dung from the animal husbandry such as chickens, ducks, goats or cows,
contain highly in phosphate and nitrogen has been dispose thrown into the water body
from farms. In Malaysia, the animal husbandry management system is not well
organized. The owners simply throw the dung into the stream or lakes nearby. As the
result, many lakes and streams experience eutrophication. According to Reynolds
(1984), other factors that influence the changing of the lake are due to the uses of the
modern inorganic fertilizers, forest clearance and the implementation of agricultural
alter terrestrial nutrient.
15
Ismail and Mohamad (1992) said lakes with the high phosphate and nitrate
content would trigger the development of the algae, mainly the blue-green algae. The
rapid development of the algae may cause many problems. Some of the blue-green
algae that can be finding are Microcystis, Spirulina, and Nodularia. These algae give an
odour and smell to water. Besides, they also produce a toxic and release chemicals
matter. Other effect causes by the eutrophication, such as the increasing of the turbidity;
rate of the sedimentation will increase and shortening the life span of the lake; anoxic
condition may develop as well as the diversity of the aquatic organisms decrease and the
dominant of biota will change (Manson, 1981).
Eutrophication is a costly economic problem. When the massive algal bloom, it
may increase water treatment cost, and sometimes it may cause treatment facilities to
malfunction (Vaughn, 1961; Hayes and Greene, 1984). The polluted water may cause a
disease such as the skin problem to human when they use or drink the water. The
polluted lake is not suitable for recreational activity. The existence abundant with the
algae may reduce the oxygen supply. A lack of oxygen, gives a negative impact to the
aquatic life, particularly to the fish. Besides, due to this problem, many of the
commercially important species may disappear and the amenity value of the water may
decrease (Mason, 1981).
2.3 Phytoplankton
Sze (1998) pointed that lifestyles divide algae living submerged in either
freshwater or marine environment into planktonic (floating) or benthic (bottom living).
Benthic algae are associated with submerged substrate and water moves past them (Sze,
1998). Planktonic algae are also known as phytoplankton.
16
The first use of the term plankton is attributed to the German biologist, Viktor
Hensen (Ruttner, 1953; Hutchinson, 1967). According to Hensen’s (1887), plankton
included all organic particles ‘which float freely and involuntarily in open water,
independent of shores and bottom’ (Reynolds, 1984). However, the term of plankton by
Hensen cannot be used nowadays due to many investigations shows that plankton do
not float and most of them are dense than the water they inhabit.
According to Wright (2005), phytoplankton consists of numerous species of
photosynthetic algae, protista and chlorophyll-a containing bacterium known as blue-
green algae. They grow as microscopic single cells or small groups of cells.
Phytoplankton lives suspended in water and are found wherever light and nutrient are
available. They have to remain to the water surface to receive sufficient light for
photosynthesis. They are mostly finding in few meters top of water bodies, and they
tend to rise toward the surface in the early morning, depending on the light condition
according to some species (Bowe, 2002).
Phytoplanktons have a variety of adaptations for floating. Some of them move
with water flow, but some of them have flagella. The flagella allow them to swim for
short distance but lack sufficient power to swim against the water (Sze, 1998). Although
they do not exhibit the phenomenal size range of their marine relative, freshwater algae,
nonetheless, display a wide diversity of form and function (Graham and Wilcox, 2000).
Phytoplanktons are classified into two groups; autotrophic and heterotrophic.
Generally, the phytoplanktons are considered as autotrophic. The autotrophic algae
requiring inorganic nutrient such as carbon dioxide, water, phosphate, inorganic
nitrogen with light as the energy source (Sze, 1998). While the heterotrophic algae use
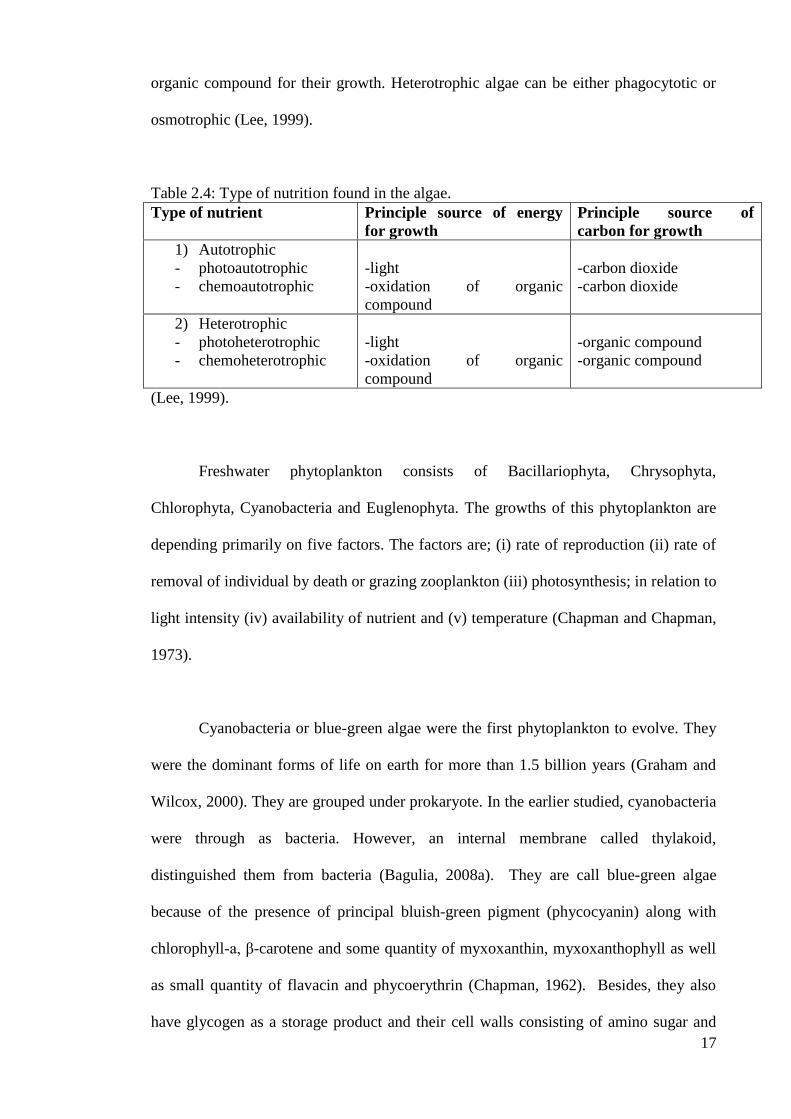
17
organic compound for their growth. Heterotrophic algae can be either phagocytotic or
osmotrophic (Lee, 1999).
Table 2.4: Type of nutrition found in the algae.
Type of nutrient Principle source of energy
for growth
Principle source of
carbon for growth
1) Autotrophic
- photoautotrophic
- chemoautotrophic
-light
-oxidation of organic
compound
-carbon dioxide
-carbon dioxide
2) Heterotrophic
- photoheterotrophic
- chemoheterotrophic
-light
-oxidation of organic
compound
-organic compound
-organic compound
(Lee, 1999).
Freshwater phytoplankton consists of Bacillariophyta, Chrysophyta,
Chlorophyta, Cyanobacteria and Euglenophyta. The growths of this phytoplankton are
depending primarily on five factors. The factors are; (i) rate of reproduction (ii) rate of
removal of individual by death or grazing zooplankton (iii) photosynthesis; in relation to
light intensity (iv) availability of nutrient and (v) temperature (Chapman and Chapman,
1973).
Cyanobacteria or blue-green algae were the first phytoplankton to evolve. They
were the dominant forms of life on earth for more than 1.5 billion years (Graham and
Wilcox, 2000). They are grouped under prokaryote. In the earlier studied, cyanobacteria
were through as bacteria. However, an internal membrane called thylakoid,
distinguished them from bacteria (Bagulia, 2008a). They are call blue-green algae
because of the presence of principal bluish-green pigment (phycocyanin) along with
chlorophyll-a, β-carotene and some quantity of myxoxanthin, myxoxanthophyll as well
as small quantity of flavacin and phycoerythrin (Chapman, 1962). Besides, they also
have glycogen as a storage product and their cell walls consisting of amino sugar and
18
amino acids (Lee, 1999). Their photosynthetic pigments are located in the thylakoid,
which lie free in the cytoplasm. In thylakoids, it contains chlorophyll- a but absent from
chlorophyll- b and chlorophyll- c. Their product from photosynthesis is starch.
Cyanobacteria is a photosynthetic producer in a wide range of freshwater and
marine environment as well as common in terrestrial habitats and in the symbiotic
system (Sze, 1998). They are frequently found in the phytoplankton of still or slowly
flow through freshwater (Van de Hoek et. al., 1995). They occur ubiquitously and have
a wide range in their vegetative structure. They are unicellular, colonial members or as
filamentous forms. The filamentous forms can be either branched or un-branched.
While some of the colonies consist of the simple hollow sphere in which the cell
arranged only in a single peripheral layer (Sharma, 1986). Sexual reproduction is not
known for Cyanobacteria. They reproduce through simple division by non-motile
endospores or spores as well as by vegetative fragmentation (Chapman and Chapman,
1973).
Part of the success of these blue-green algae is their ability to use low light
intensity effectively. Thus, they can thrive below the surface, deep in the epilimnion.
According to Prescott (1969), many of the Cyanobacteria are finding attached on stone
that present in shallow water or down to depth of even up to 30.4 meter. Cyanobacteria
has a special ability compare to another group of phytoplankton. They are able to fix
nitrogen gaseous. Bold and Wynne (1978) had mentioned that there are three categories
of Cyanobacteria that have the ability to fix the atmosphere nitrogen; (i) filamentous
forms having heterocyst (ii) some unicellular non-heterocyst and (iii) some non-
heterocyst with filamentous forms.
19
Oscillatoria, sp. is a filamentous blue-green alga, reproduce through the
formation of hormogonia; the trichome is cylindrical and free with the mucilage sheath
around them. The Oscillatoria sp. belongs to order Oscillatoriales in the class of
Cyanophyceae. They do not form a colony. The individual cells are disc-shaped and
always contain ingrown cross-walls at different stages of development (Van de Hoek et.
al., 1995). This species is widely distributed in the sea freshwater, hot spring and areas
affected by sewage effluent.
The Chlorophyta division consists of 500 genera and approximately 8000
species. Most of them live in freshwater, some are discovered in marine as well as in the
terrestrial. Some of them are aerophytic, which are living on the tree trunks, soils and
rock and even on snow and ice. Chlorophyta or are known as green algae, have
chlorophyll- a and b as their major photosynthetic pigments. Their pigments are similar
to the higher plants. They have a starch as the carbohydrate reserve and chloroplast
envelope with two-associated membrane (Sze, 1998). Their morphologies are varied;
many are unicellular and colonial; some are multicellular as well as filamentous. Their
cells wall usually has cellulose as the main structural polysaccharides (Lee, 1999).
Chlorophyta species can be produced either by sexual or asexual. From sexual
production, it begins with isogamy to anisogamy and oogamy. While asexual
production occurs from motile zoospores. Nevertheless, sometime it also forms from
non-motile spores (Chapman and Chapman, 1973).
The division Chlorophyta, consist many classes as these green algae have a wide
range of species. In Chlorophyta, there are macroalgae and microalgae. However, most
of them are microalgae. Smith (1955) noted that only 10 % of them are living in the
marine area, whereas 90 % are living in freshwater and lives as phytoplankton. Two
20
examples from this division are Scenedesmus sp. and Pediastrum sp. Scenedesmus sp.
and Pediastrum sp. belong to the order Chlorococcales, in the class Chlorophyceae.
Most of the species in this class occur in freshwater as phytoplankton, some in
terrestrial forms and few of them found in brackish or marine habitat. Pediastrum sp. is
a common species, which can be found in the freshwater rich in nutrient. They are
mostly plankton, but some live on and between aquatic macrophytes (Van de Hoek et.
al., 1995). Pediastrum sp. usually forms colonies. Their structure is circular, flat and
radially organized, usually one cell is thick. The cells around the colony margin
generally bear horn-like projection; while those in the center do not have.
Species of Scenedesmus has a unique structure form. The individual cell forms
are such elliptical to the spindle shaped and in many species, they bear spines (Van de
Hoek et. al., 1995). These individual cells attached together in a row about 4, 8 or 16
individual cells to form a colony. Sometimes, they lie in two rows of cells. The terminal
cells of the species have spines, for example, Scenedesmus quadricauda (Richmond,
1986). Nevertheless, some of them have tufts of fine bristle, which have buoyancy. The
cells are uninucleate and have a laminate chloroplast that contains pyrenoids
(Richmond, 1986). Species of Scenedesmus is normally found in freshwater or brackish
water in nutrient-rich condition. Their environment usually clears from pollution. In the
laboratory work, they are often used to be cultured as they are easily grown in the
culture condition.
2.3.1 Growth factors for phytoplankton
Several important environmental factors influence the growth of the
phytoplankton. The factors are; (1) light (2) density stratification (3) nutrients (4)
21
floatation and sinking. However, the main factors that stimulate phytoplankton growth
are light and nutrients.
Light are important for all groups of phytoplankton, as they use energy of light
for their photosynthesis process. Photosynthesis in most algae occurs in the presence of
light with wavelength at about 300 to 700 nm (Lee, 1999). A requirement for light by
algae can be demonstrated by showing photosynthesis at different levels of light. Thus,
the requirement for the light and the amount for absorbance are different to every
species. For examples; the giant Kelp (brown algae), require brightness at least 70 E m-
2year
-1, in order to build up their thallus. However, more lights are needed as they were
growing deepest in the ocean. While for phytoplankton, they occur on the surface of
water to few meter depths, receive 1% of the surface irradiance (Lee, 1999).
The phytoplankton depending on species, have a compensation depth. It is said
that, the amount of light allows only enough production to meet the requirement for
cellular maintenance (respiration) without production of new biomass (Sze, 1998).
According to Moss (1980), he defined the euphotic depth as the depth in the water
column at which the energy absorbed in photosynthesis (gross photosynthesis), in an
algal cell just balance the maintenance energy need of the cell for respiration. Thus, net
for the photosynthesis is zero at the euphotic depth.
Light rapidly reduces as it penetrates the water column. The availability of light
limits phytoplankton growth to a layer of water called the photic zone. Photic zone is
the upper layer, where there is adequate light penetration. According to Sze, (1998),
irradiance decreases exponentially with water depth because water as well as suspended
particles absorb and scatter light. In water, light is attenuated by absorption and
22
scattering (Grossman et. al., 1990). Trainor (1978) noted that, the chlorophyll pigment,
absorb both red and blue light in the upper water, but as the red light is lost in the upper
10 meter, they can still function by absorption of the blue light down to 50 meters.
Near the surface, light is usually more than sufficient for photosynthesis, but
nutrient availability may be limited. In some circumstance, the water of the lake is
turbid and lack of sufficient light, thus it limits the phytoplankton growth (Trainor,
1978). It can be said that light can also be the limiting factor for the phytoplankton.
Along with adequate light, the availability of nutrient as one of the most important
factor regulating phytoplankton growth. If one of the essential elements is absence or
the concentration is low, it will limit the phytoplankton growth.
Phytoplankton nutrients consist of basic elements; macroelements and
microelements. Macroelements that needs by phytoplankton are carbon, hydrogen,
sulfur, potassium, calcium, magnesium, phosphorous and nitrogen. Usually, the
macroelements are taken in large quantities by phytoplankton. While, microelements
were phytoplankton required usually taken in lower quantities and it is often acted as
co-factors in the enzyme system (Sze, 1998). Examples of microelements are iron,
manganese, copper, zinc and molybdenum. However, for diatoms they need another
element, which is silicon.
Among the element that is commonly present in phytoplankton are carbon,
nitrogen and phosphorous, which are regarded as critical one. This is due to the
exogenous sources of the elements are among the most significant supply, that it can be
limited phytoplankton metabolite rate and their growth. Reynolds (1984) also noted
that, these three elements play an essential role in the enzymatic and energy transport.
23
Carbon is the most common nutrient utilized by the algae. They usually use the
carbon that comes from either carbon dioxide (CO2) or bicarbonate for photosynthesis.
The total inorganic carbon (TIC) in-water body consists of carbon dioxide (CO2),
carbonic acid (H2CO3), bicarbonate ions (HCO-3
) and carbonate ions (CO32-
). The TIC
derives from the atmosphere and from dissolution of carbonate rocks (Sze, 1998).
However, in some condition, phytoplankton will release large quantities of organic
carbon from their cells from photorespiration.
Nitrate is a common substance composed of nitrogen and oxygen. According to
Faizah (2004), nitrate can stimulate the growth of microalgae in lake. The principal
requirement for nitrogen to phytoplankton is in the synthesis of amino acid and protein.
Several commonly occurring sources of nitrogen are potentially available to
phytoplankton. There are different forms of nitrogen occurs in water include diatomic
nitrogen (N2), ammonium (NH+4
), nitrate (NO3-
), nitrite (NO2-
), other nitrogen oxides
and nitrogen in organic compounds such as urea and free amino acids (Reynolds, 1984).
However, occurrence of cyanobacteria as nitrogen-fixing algae are very important in the
tropical and subtropical ocean with lower nutrient levels (Sze, 1998). When other forms
of nitrogen are low, these cyanobacteria are often significant in converting nitrogen gas
to forms useable by non-nitrogen fixing phytoplankton. Nitrogen fixing is inhibiting in
the presence of nitrate or ammonium.
Nitrogen is an essential element in the synthesis of amino acids and protein of
the phytoplankton. Its nitrogen content is about one-eighth to one-sixth by weight
(Tang, 2001). It exists in aquatic environment as nitrate (NO3), nitrite (NO2) and
ammonium ion (NH4-) as well as certain dissolved nitrogenous compounds such as urea
and free amino acid peptides (Tang, 2001). Nitrogen often limits the phytoplankton in
24
the open water (Howarth, 1988), but is less commonly limiting in freshwater. In one
tropical water body, concentration below 0.02 mg nitrate-N/liter might be limited the
growth of plankton diatom (Prowse and Talling, 1958). However, elsewhere
phytoplankton has been reported to utilize inorganic nitrogen at concentration below 0.1
mg nitrate-N/liter.
Phosphorus is essential to the function and growth of all plants including
phytoplankton. This because it is a component of nucleic, acids and of adenosine
triphosphate, which forms the basis of the enzyme synthesis as well as the intracellular
energy transfer system (Tang, 2001). Reynolds (1984) mentioned that in water,
phosphorous usually occurs in oxidized state either as inorganic orthophosphate ions
(HPO2-4, H2PO4-) or in organic forms, largely biogenic compound (Tang, 2001).
Phytoplankton is able to produce its own phosphate in a special condition. When
inorganic phosphorous is low but the organic forms of phosphorous are available,
phytoplankton are able to excrete phosphate to break down a polyphosphate compound.
However, when the amount of phosphate is overloaded, cells might take it up and store
it as polyphosphate for later uses (Sze, 1998).
It is widely believed that in many freshwater bodies, growth of phytoplankton
tends to be limit by the supply of inorganic phosphate. Concentration of phosphate-P,
are often below of 10µg/L generally in range 0.1-1,000 μgPL-1
(Tang, 2001) and in
some lakes, they might be reduced to 1 µg/liter or less by uptake during the growth of
algae (Hutchinson, 1967; Gardiner, 1941).
Another element that important is silicon. It normally derived from rock
weathering and dissolve in water as orthosilicic acid [Si (OH)4] (Sze, 1998). Silicon is
25
present in most natural water as solid or colloidal silicate polymers, originate from
catchment's soils or from biogenic source, for example, death diatom. Although all
phytoplankton had a requirement for the small amount of silicon involve in protein and
carbohydrate synthesis, the huge utilize for silicon is the Chrysophyta and among the
diatoms. The silica is uses to strengthen their cell wall with unstructured silica polymer
that the requirement becomes ecologically important (Reynolds, 1984). Hutchinson
(1967) noted that phosphate, nitrate and silica are the most critical nutrients for the
autotrophic production.
2.4 Microalgae and environment
The algae have two important roles that give balance to the main gasses in the
atmosphere. They take part in the carbon cycle and as the equable level for dissolve
oxygen in the water body. However, certain phenomena can disturb this cycle. Besides,
they are producers of oxygen and organic materials, and they are responsible for 30 to
50% of the photosynthetic production on earth. Algae are important in producing
nitrogen from nitrogen-fixing cyanobacteria. Cyanobacteria can convert nitrogen gas
into forms of nitrogen than other organisms can use (Sze, 1998). Water quality also
influences the development of the phytoplankton. This relationship gives two impacts;
positive and negative. The positive impact can be seen by the occurrence of other
aquatic organisms in the water bodies due to the abundant with phytoplankton. The
phytoplankton is the main supplier for the food chain in the aquatic ecosystem as well
as the producer of the oxygen.
26
However, the negative impact is the overloading nutrient into the water bodies
happen may cause algal bloom. Besides it also polluted the aquatic system as well as
they give an odour to the environment. In some cases, an abundant of it may reduce
dissolve oxygen level, particularly during the night when there is no photosynthesis.
This is because the phytoplankton utilizes oxygen for their respiration more than other
aquatic organism. Consequently, these organisms are displaced (Ismail, 2003).
Oswald (1988a) said, that the presence of algae indicates tropic condition of a
water-body. For examples, green algae and diatoms are frequent in relatively pure
oligotrophic waters, while blooms of Cyanobacteria indicate a eutrophic state and water
pollution. Effluents from urban, agricultural or industrial origin contain higher
concentration of nitrogen and phosphate. These effluents have to be treated in primary
and secondary treatment processes before they are discharged into natural water bodies.
If the effluents loaded with too much of nitrogen and phosphate, which may cause
eutrophication, heavy metal as well as toxic organic compounds, tertiary and quaternary
treatment have been done. The cost of treating effluent increases as the stages number
of treatment increase. Thus, an alternative way has to be introduced to the treatment
system. One of the best ways is to treat wastewater with environment friendly
microalgae.
Oswald and Gotaas (1957) were the first to propose large-scale production of
algae biomass from waste. The microalgae biomass itself is also a potentially valuable
(Lincoln and Earle, 1990) commodity because of its high-protein content. Removal of
dissolved nitrogen and phosphate is the main aim of the wastewater treatment.
Discharge of these nutrients in the water bodies may cause eutrophication and indirectly
stimulate the algae bloom as well as unwanted plants like the aquatic macrophytes.
27
One of the principles reasons for removing the nutrients from wastewater
effluent is to control eutrophication that is shows by the uncontrolled algae (Hammouda
et. al., 1995). Microalgal cultures offer an elegant solution to tertiary and quaternary
treatments due to the ability of microalgae to use inorganic nitrogen and phosphorus for
their growth (Oswald, 1988a; 1988b; Richmond, 1986), and their capacity to remove
heavy metals (Rai et. al., 1981), as well as some toxic organic compounds (Redalje et.
al., 1989).
Under natural condition, most microalgae grow as mixed communities, which
include various species and genera (Becker, 1994). In the treatment process, bacteria
will break down remaining organic compounds and provide carbon dioxide for the algal
growth. Algal will utilize phosphate, nitrogen and other elements as well as carbon
dioxide. Then they will release the oxygen as their by-product. The advantageous from
the treatment are removal of in organic elements and some organic compounds as well
as water recovery for any uses, algal production and gas exchange (Trainor, 1978).
Besides the water can be supersaturated with oxygen so that the animals can survive,
and the algal biomass can be harvested for other uses such as animals feed.
A better technique of growing algae in laboratory has been giving a huge impact
in studying algae. These improvements in the algal cultivation have made great
advances in our knowledge of algal life histories, physiology, taxonomy, genetics,
biochemistry and ultra-structure (Bold, 1974). Besides by culturing the algae, it has
opened a new prospect in biotechnology mainly to the aquaculture industry.
28
Algae have tremendous ability to grow in water with variable load nutrients and
to adapt quickly to the fluctuating nutrient and climate regime. They play a vital role in
the rearing of mollusks; shrimps and fish as well as they have created a strategic interest
for aquaculture industries. A majority of microalgae species that are cultured in
aquaculture's ponds belongs to green algae, desmids and diatoms (Mohapatra, 2006).
Cyanobacteria are less used in aquaculture due to the production of toxins. However,
Spirulina sp., are cultured for its high biomass production and cellular protein contents
(Mohapatra, 2006).
2.5 Application of microalgae in wastewater using various way of treatment.
Many studies have been conducted on wastewater treatment using microalgae.
Oswald and Gotaas (1957) had reported that wastewater treatment using microalgae
have already be attempt over 40 years ago. Studies using algal culture by many
researchers previously, have demonstrated a success in removing nutrient compound in
wastewater that are rich in nitrogen and phosphorous. The algae were grown in
inorganic media. However, this approach is too expensive. Thus, to more economical,
algae were grown in the wastewater. Waste contains all the macronutriens and
micronutriens that required for the algal growth (Shelef et.al., 1978). In the earlier of the
experimental work focus had been more to the suspended microalgae that grow in
shallow, artificial pond containing sewage. However, the study of wastewater has been
extended to non-suspended microalgae. This is due to the difficulties of harvesting the
enormous suspended microalgae population developed in water after the treatment (de
Bashan and Bashan, 2004).
29
Instead of cultivating microalgae in pond, another approach that had been
attempt was to treat wastewater using immobilized microalgae. Chevalier and de la
Noüe (1985) have used Scenedesmus sp. as the immobilized microalgae in k-carragenan
beads to remove nutrients from wastewater. By employing immobilized microalgae,
treatment of liquid is simplified, as the cells were trapped in the bead. Immobilized
microalgae it may increase the retention time of cells in the reactor. Moreover, the cells
may become well adapted to the substrate and therefore less risk of washout from the
substrate (Travieso et.al., 1996). According to de-Bashan and Bashan (2004), algal cells
that are trapped in the carrageenan and alginate bead grew much slower than suspended
cells. However, these immobilized algae are able to remove over 95% of ammonium
and 99% of phosphates from the wastewater in three days. Compared to suspended
cells, the efficiency of removing the nutrients are only 50% of nitrogen and phosphate
(Lau et.al., 1997).
The most used treatment in the whole world today is the High-Rate Algal Ponds
(HRAP). These shallow oxidation ponds that have been used for many years have
encouraged the growth of suspended microalgae (Hoffmann, 1998). It was the better
treatment which can achieve a high level of treatment of both domestic and agricultural
wastewater. These can be measured by reduction in BOD, TSS, nitrogen, phosphorous
and metals (Shelef et.al., 1980; Fallowfield and Garrett, 1985; Picot et.al., 1991;
Muttamara et.al., 1995).
Microalgae which are grown in the large pond to treat wastewater can be
harvested. The harvest microalgae can be processed to become fertilizer or as animals
feed. Thus, microalgae that have special characteristics should be grown in the pond.
30
Some of the characteristics are such as; they are able to grow in sewage, relatively high
specific growth rate, ease to harvest and process (Azov et al., 1980).
Microalgae cultivation has been an alternative way for removing nitrogen and
phosphorous from wastewater treatment. The microalgae may convert those nutrients to
biomass. Through biotechnology, the biomass have become a useful product such as
feed, food additive, source of value-added products or as supplements to biomass in an
energy producing system (Mohapatra, 2006). Those products should be commercialized
as an alternative to other products that are presently used.
The ability of microalgae in utilizing effluent for their growth, give a great
potential on economic scale. The algal biomass could be used for animal feed (Shushu
and Chipeta, 2002) as well as plant's fertilizer. A combination of algal protein
production with wastewater, as an alternative for new protein sources has also been
suggested (Tam and Wong, 1989). Jassby (1988), according to algae that grow on agro,
industrial waste can be used for human nutrition. Thus, there are a lot of advantages
from the cultivation of microalgae that are grown either in wastewater or culture media.
31
Chapter 3
Methodology
3.1 Tasik Taman Jaya and collection of water samples
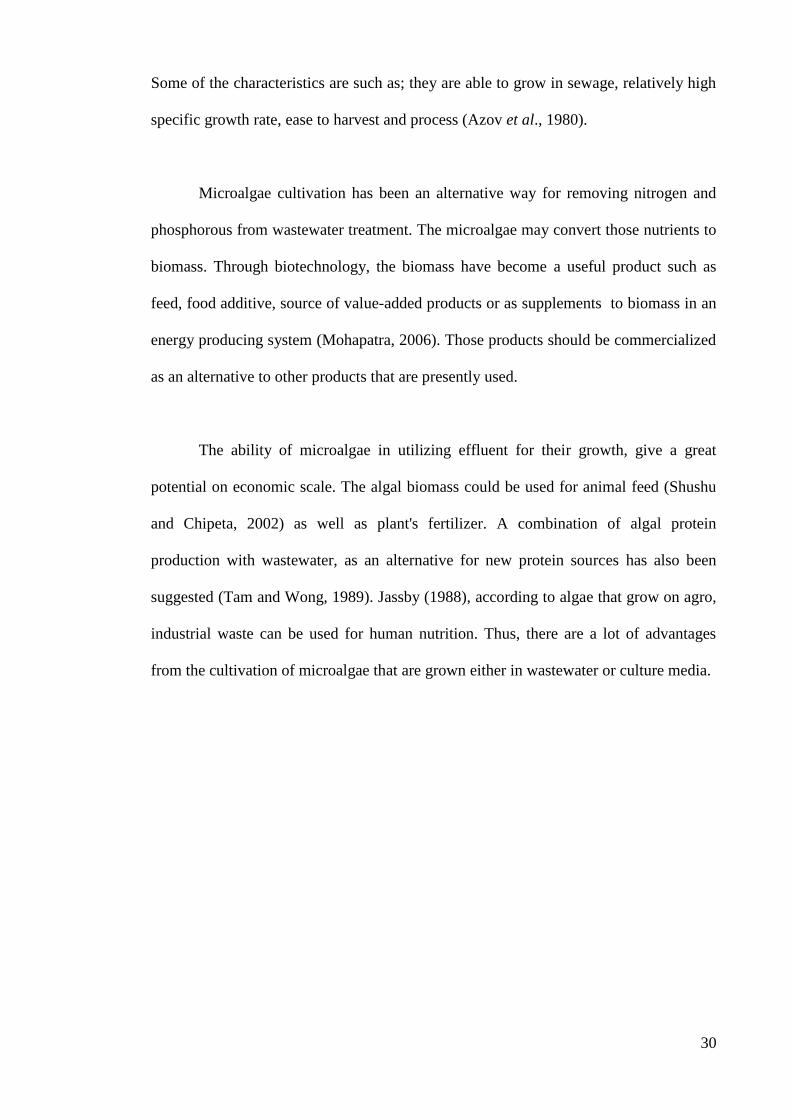
Taman Tasik Jaya is situated at Petaling Jaya, Selangor. It is located between
longitudes 03° 06’ north to 03° 07’ north and between latitude 101° 38’ east to 101° 40’
east. The surface area of the lake is 28,640 m2 with capacity of 33,957 m
3. The lake is
an ex-mining lake (Norhayati, 1995). This lake, which is situated near to the residential
area, has been use as a recreational site. Besides, it is also surrounded by the main road
and highway (Plate 3.1).
There are two major inlets and one outlet of the water into the lake. The
effluents come from the residents surrounding the lake. These two inlets received water
from the domestic waste, semi-treated waste from septic tank and water runoff from
nearby housing area, main road and highway (Saravanamuthu, 1977). Thus, the
composition of nutrient content in the water bodies is higher. The samples were taken
at three different sites of the lakes to represent the whole area of the lake.
32
Water samples from Tasik Taman Jaya were collected from two stations
(Stations A and B) between 9.30am to 10.30am in the year 2007. Water samples were
collected twice and each time from the two stations. Water samples from the first
collection were used to examine and identify microalgae that were present in the lake.
Water samples from the second collection were used to carry out wastewater treatment
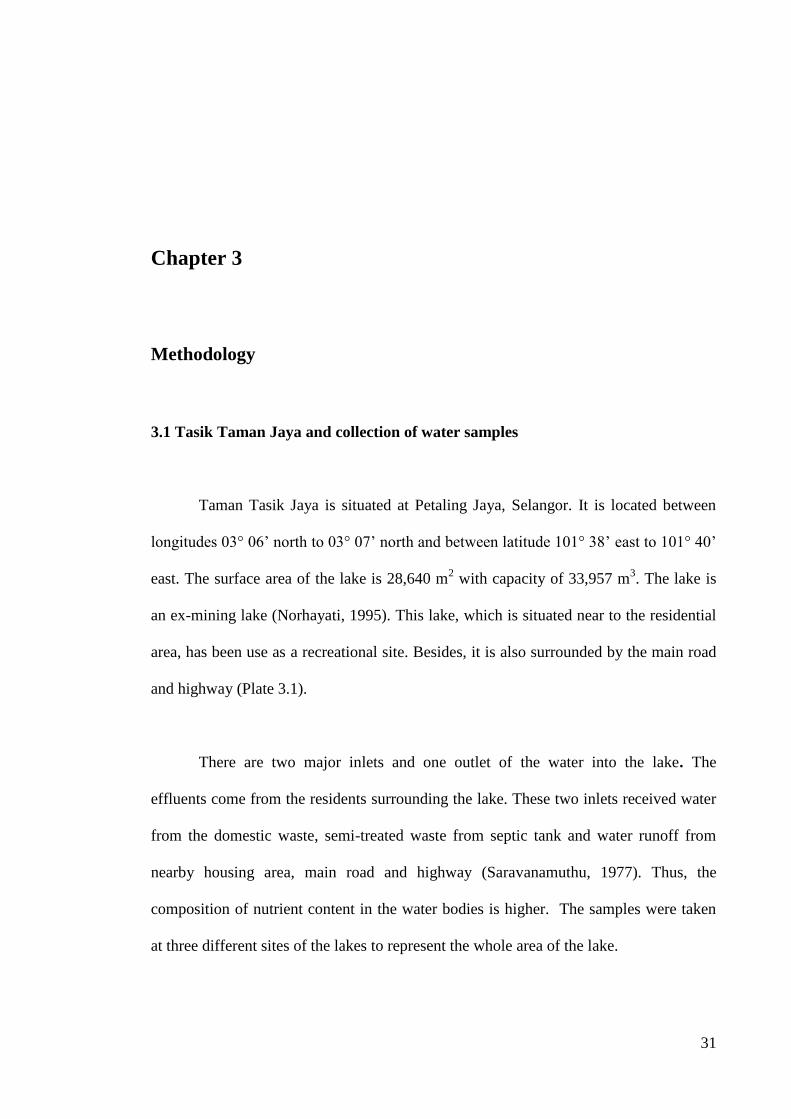
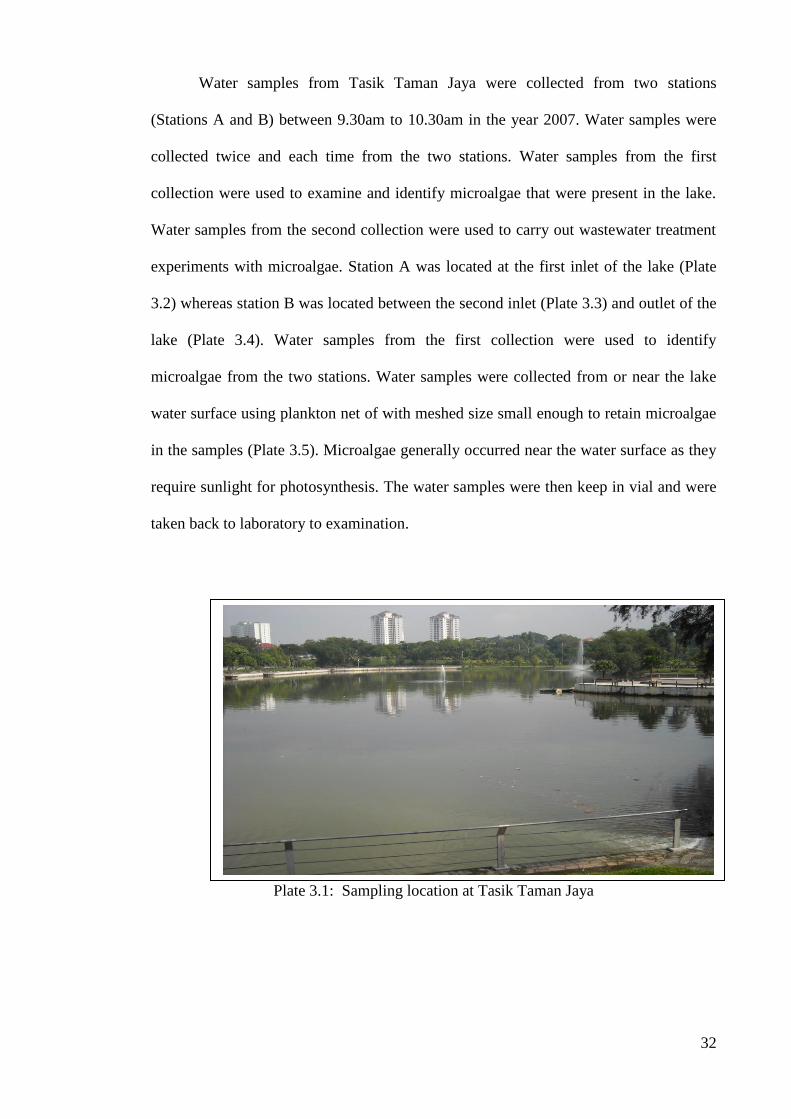
experiments with microalgae. Station A was located at the first inlet of the lake (Plate
3.2) whereas station B was located between the second inlet (Plate 3.3) and outlet of the
lake (Plate 3.4). Water samples from the first collection were used to identify
microalgae from the two stations. Water samples were collected from or near the lake
water surface using plankton net of with meshed size small enough to retain microalgae
in the samples (Plate 3.5). Microalgae generally occurred near the water surface as they
require sunlight for photosynthesis. The water samples were then keep in vial and were
taken back to laboratory to examination.
Plate 3.1: Sampling location at Tasik Taman Jaya
33
Plate 3.2: Station A showing the first inlet of the lake
Plate 3.3: Station B showing the second inlet of the lake
34
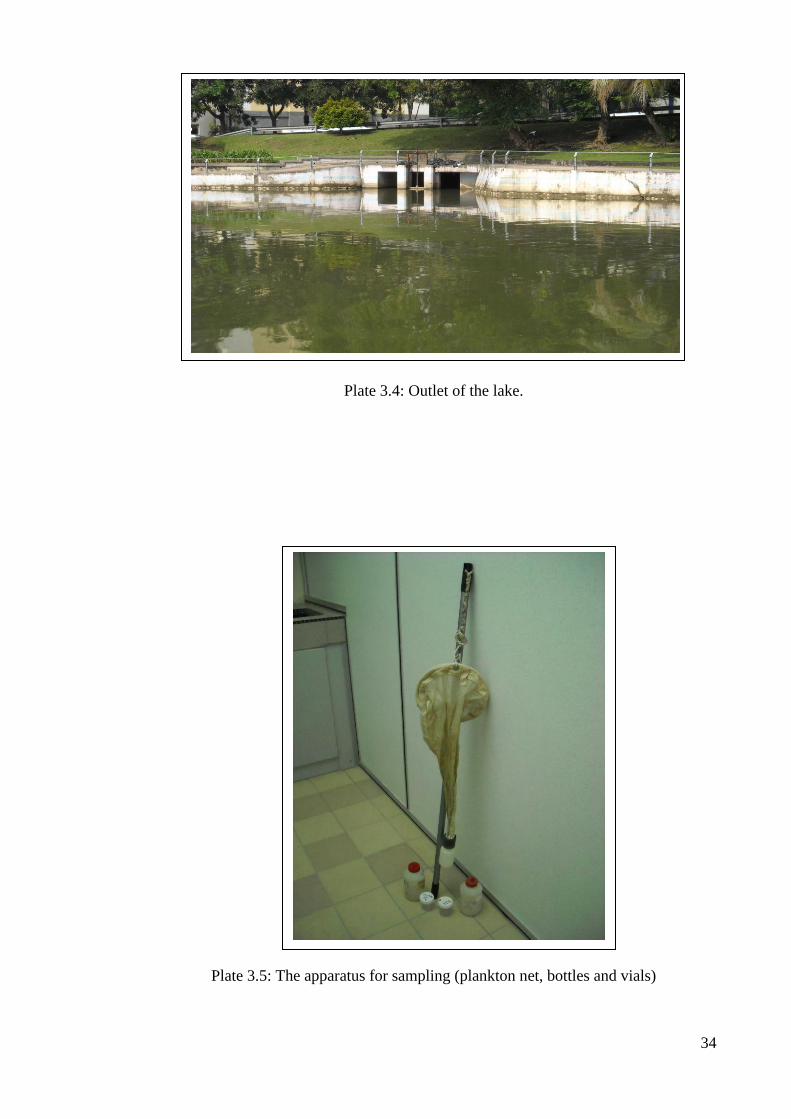
Plate 3.4: Outlet of the lake.
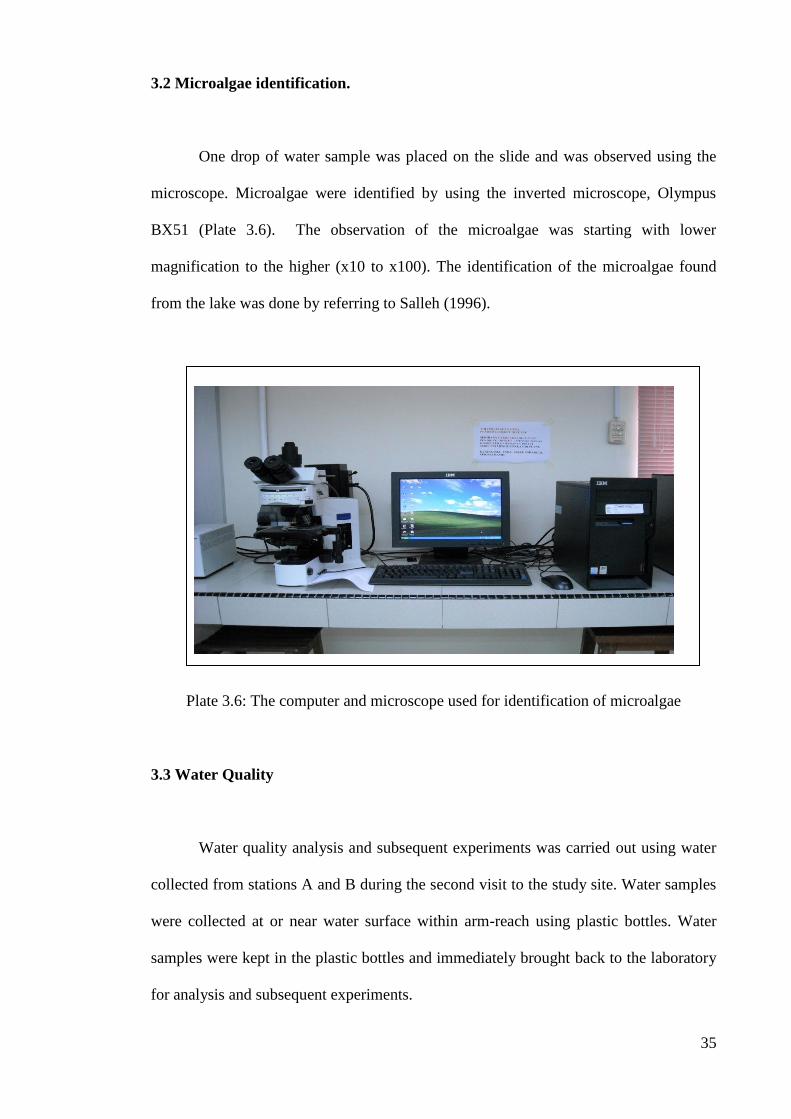
Plate 3.5: The apparatus for sampling (plankton net, bottles and vials)
35
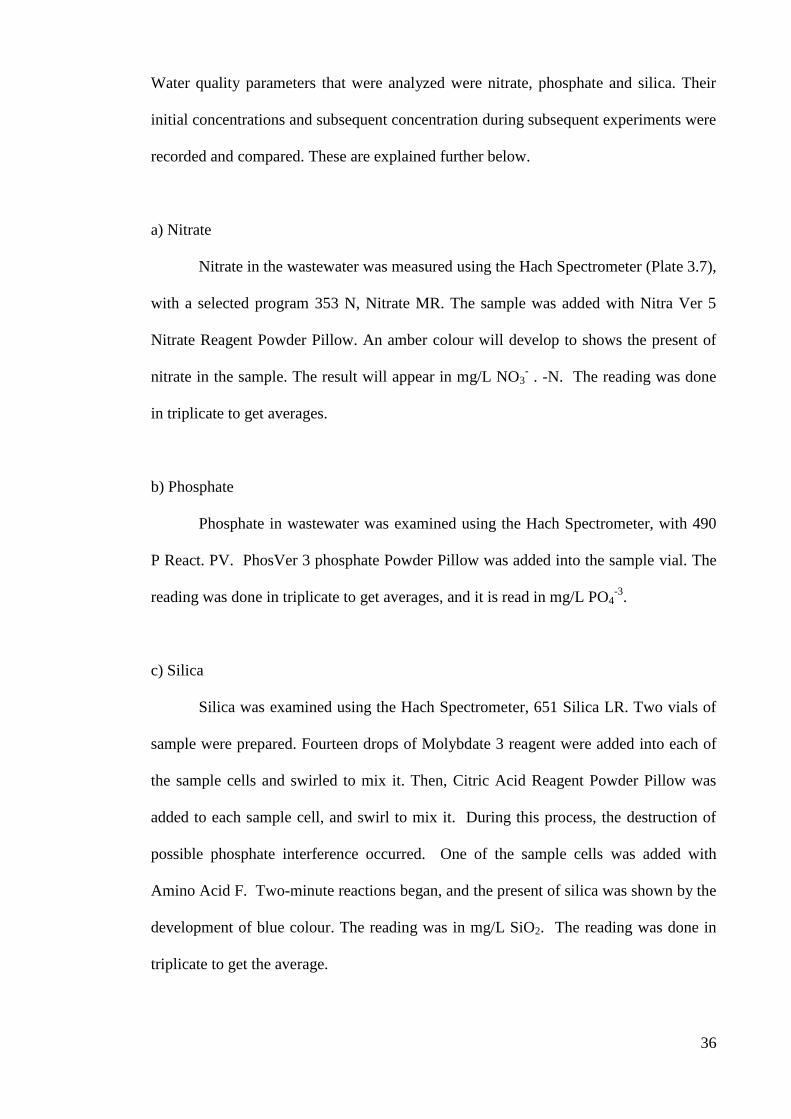
3.2 Microalgae identification.
One drop of water sample was placed on the slide and was observed using the
microscope. Microalgae were identified by using the inverted microscope, Olympus
BX51 (Plate 3.6). The observation of the microalgae was starting with lower
magnification to the higher (x10 to x100). The identification of the microalgae found
from the lake was done by referring to Salleh (1996).
Plate 3.6: The computer and microscope used for identification of microalgae
3.3 Water Quality
Water quality analysis and subsequent experiments was carried out using water
collected from stations A and B during the second visit to the study site. Water samples
were collected at or near water surface within arm-reach using plastic bottles. Water
samples were kept in the plastic bottles and immediately brought back to the laboratory
for analysis and subsequent experiments.
36
Water quality parameters that were analyzed were nitrate, phosphate and silica. Their
initial concentrations and subsequent concentration during subsequent experiments were
recorded and compared. These are explained further below.
a) Nitrate
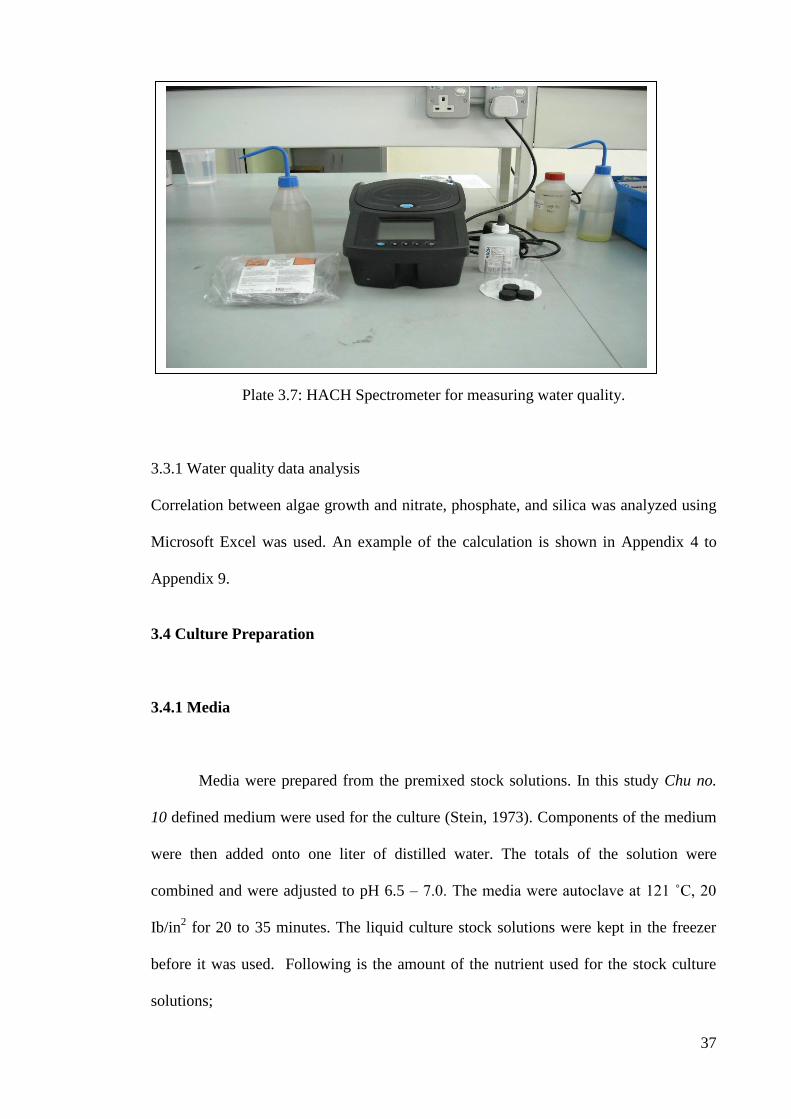
Nitrate in the wastewater was measured using the Hach Spectrometer (Plate 3.7),
with a selected program 353 N, Nitrate MR. The sample was added with Nitra Ver 5
Nitrate Reagent Powder Pillow. An amber colour will develop to shows the present of
nitrate in the sample. The result will appear in mg/L NO3- . -N. The reading was done
in triplicate to get averages.
b) Phosphate
Phosphate in wastewater was examined using the Hach Spectrometer, with 490
P React. PV. PhosVer 3 phosphate Powder Pillow was added into the sample vial. The
reading was done in triplicate to get averages, and it is read in mg/L PO4-3
.
c) Silica
Silica was examined using the Hach Spectrometer, 651 Silica LR. Two vials of
sample were prepared. Fourteen drops of Molybdate 3 reagent were added into each of
the sample cells and swirled to mix it. Then, Citric Acid Reagent Powder Pillow was
added to each sample cell, and swirl to mix it. During this process, the destruction of
possible phosphate interference occurred. One of the sample cells was added with
Amino Acid F. Two-minute reactions began, and the present of silica was shown by the
development of blue colour. The reading was in mg/L SiO2. The reading was done in
triplicate to get the average.
37
Plate 3.7: HACH Spectrometer for measuring water quality.
3.3.1 Water quality data analysis
Correlation between algae growth and nitrate, phosphate, and silica was analyzed using
Microsoft Excel was used. An example of the calculation is shown in Appendix 4 to
Appendix 9.
3.4 Culture Preparation
3.4.1 Media
Media were prepared from the premixed stock solutions. In this study Chu no.
10 defined medium were used for the culture (Stein, 1973). Components of the medium
were then added onto one liter of distilled water. The totals of the solution were
combined and were adjusted to pH 6.5 – 7.0. The media were autoclave at 121 ˚C, 20
Ib/in2 for 20 to 35 minutes. The liquid culture stock solutions were kept in the freezer
before it was used. Following is the amount of the nutrient used for the stock culture
solutions;
38
Ca (NO3)2 0.04 g/l
K2HOP4 0.01 g/l
MgSO4.7H2O 0.025g/l
NaCO3 0.02 g/l
NaSiO3 0.025g/l
FeCl3 0.8 mg/l
3.4.2. Isolation
The isolation of a single algal unit into medium suitable for growth is required to
establish a clonal, unialgal culture (Stein, 1973). The algae are isolated from the fresh
collection from the field. The isolation process was done by using fine capillary pipette
by taking aseptically a sterile Pasture-type pipette with a rubber bulb on the wide end. A
forceps was used to hold the narrow end of pipette while it was heated up. As the pipette
became softer, the narrow end of the pipette was pulled.
As the glass softened, the pippets were gently removed from the flame. The tip
of the capillary pippet was then broken off. The bore of the pippet should be several
times diameter size (75 to 150 µm) than the algal unit being isolated (Stein, 1973). The
isolated algal were placed into a Petri disk and were looking through under the inverted
microscope. The pippet was taken out of the liquid and positioned just above the algal
unit. The pippet was slowly dipped into the liquid and by capillary action; the liquid
with the desired cells should flow into the pippet. The flow of liquid can also be
controlled by slight pressure of the rubber bulb.
39
The cells were placed into another disk, which contained distilled water. Algal
cells were washed several times with the distilled water to remove dirt. The clean algal
cells were placed in fresh water. After the cells showed rapid development they were
transferred into a prepared medium (Chu 10).
3.4.3. Culture method
Liquid medium, that contained the algae were placed under florescence
illumination so that the algae could grow without being damaged by direct sunlight. The
room temperature was maintained at about 20 to 21 °C. 12 hours of light and 12 hours
of darkness were done for the algae culture. Increases in algal cell number were
observed after five days to two weeks depending to species. During the lag phase, the
cells are adapted to the experimental environment. When the algae have entered the
exponential phase, they were transfer into a larger flask to maintain their growth.
3.5 Nutrient removal
Fresh water sample collected from the Tasik Taman Jaya were filtered and
placed into a 500 ml beaker. The water samples were filtered to remove the unwanted
microalgae as well as suspended matter. Four beakers were set up and filled with three
different microalgae species. One of the beakers was set up as a control and contains
with filtered water sample.
The three different microalgae previously grown as the stock cultures were
transferred into beaker that contained the wastewater. The stock cultures of the
microalgae were Oscillatoria limnosa, Scenedesmus quadricauda and Pediastrum
duplex. They were transferred into the water sample to examine their ability to remove
40
nutrient and reacted as water treatment. The nutrients that were removed from the water
samples were nitrogen, phosphorous and silica. All the beakers were placed under
florescence light with temperature maintained at 25°C to 26°C (room temperature). The
measurements were done every 48 hours to monitor the reduction of the nutrient from
the water samples with selected microalgae. During the experiment, stirring were done
manually. Amount of nutrient removal (R) was calculated using the following formula.
Where T0 is the concentration at the start of the experiment and Ti is the
consequences day the end of the experiment.
3.6 Growth
Growth measurement for the microalgae was done every 48 hours. One ml of
water sample was put into sedimentation chamber. A few drops of Lugol’s solution
were added into water sample. It took about 30 to 60 minutes to allow the cells sink in
the sedimentation chamber. Gently removed the chamber and put the cover slip on top
of the slide. Then the cells counting were done by using inverted microscope. The
growth was determined by the formula;
K= (ln Nt1 – lnNt0)
t1 – t0
Where; Nt1is the number of the cells at sampling, and Nt0 is the numbers of the cells at
the beginning of the experiment (Oh-Hama and Miyachi, 1992).
41
Chapter 4
Result and discussion
4.1 Species of microalgae at Tasik Taman Jaya
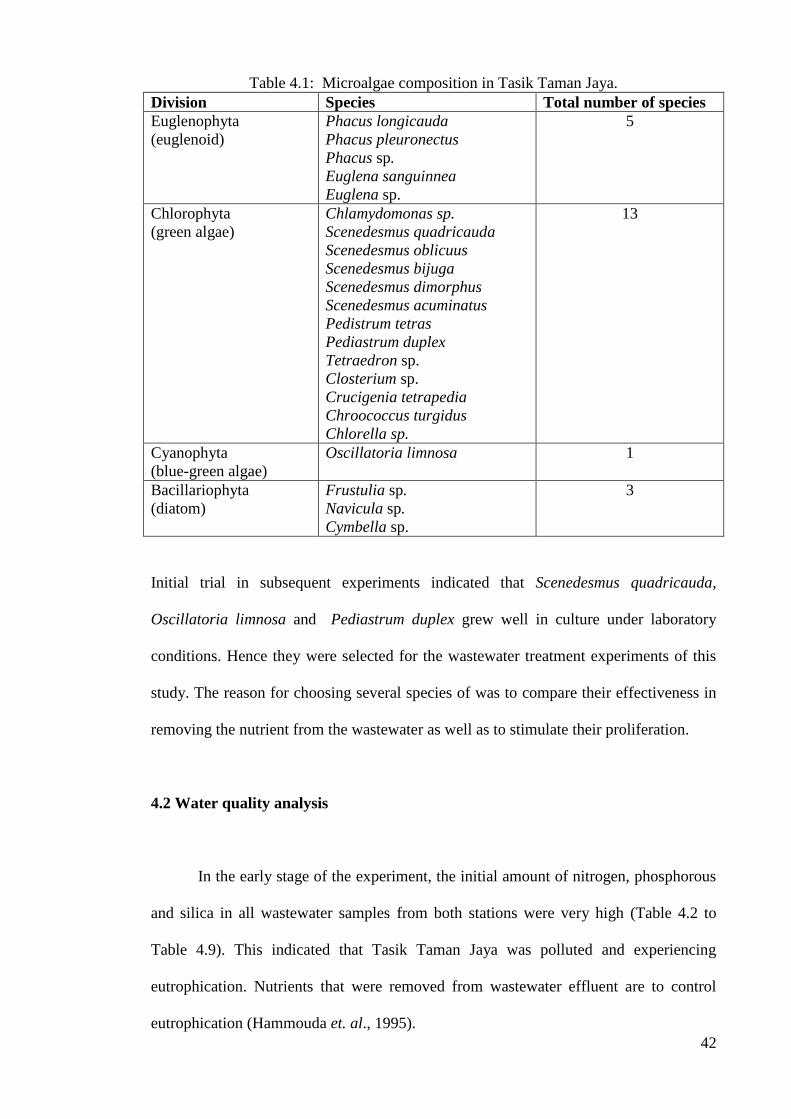
A total of 22 species microalgae from Taman Jaya were identified in this study.
Most of the species belongs to the division Chlorophyta and the division with the least
number of species was Cyanophyta. All these are summarized in Table 4.1. Individuals
belong to the division Euglenophyta were, however, the most commonly seen during the
examination of microalgae of the water samples. Euglenophytes are generally able to
adapt to and inhabit polluted water. They are able to utilize nutrients that pollute such
water. According to Norhayati (1995), Tasik Taman Jaya was very polluted and
eutrophic.
The effluents of the lake came from the residential area and surrounding road.
The effluent bring along inorganic matter, detergents, kitchen wastes and others. With
high constitution of the inorganic matter, it might trigger the development of the
microalgae. Table 4.1 shows the existence of the microalgae in the Tasik Taman Jaya.
42
Table 4.1: Microalgae composition in Tasik Taman Jaya.
Division Species Total number of species
Euglenophyta
(euglenoid)
Phacus longicauda
Phacus pleuronectus
Phacus sp.
Euglena sanguinnea
Euglena sp.
5
Chlorophyta
(green algae)
Chlamydomonas sp.
Scenedesmus quadricauda
Scenedesmus oblicuus
Scenedesmus bijuga
Scenedesmus dimorphus
Scenedesmus acuminatus
Pedistrum tetras
Pediastrum duplex
Tetraedron sp.
Closterium sp.
Crucigenia tetrapedia
Chroococcus turgidus
Chlorella sp.
13
Cyanophyta
(blue-green algae)
Oscillatoria limnosa
1
Bacillariophyta
(diatom)
Frustulia sp.
Navicula sp.
Cymbella sp.
3
Initial trial in subsequent experiments indicated that Scenedesmus quadricauda,
Oscillatoria limnosa and Pediastrum duplex grew well in culture under laboratory
conditions. Hence they were selected for the wastewater treatment experiments of this
study. The reason for choosing several species of was to compare their effectiveness in
removing the nutrient from the wastewater as well as to stimulate their proliferation.
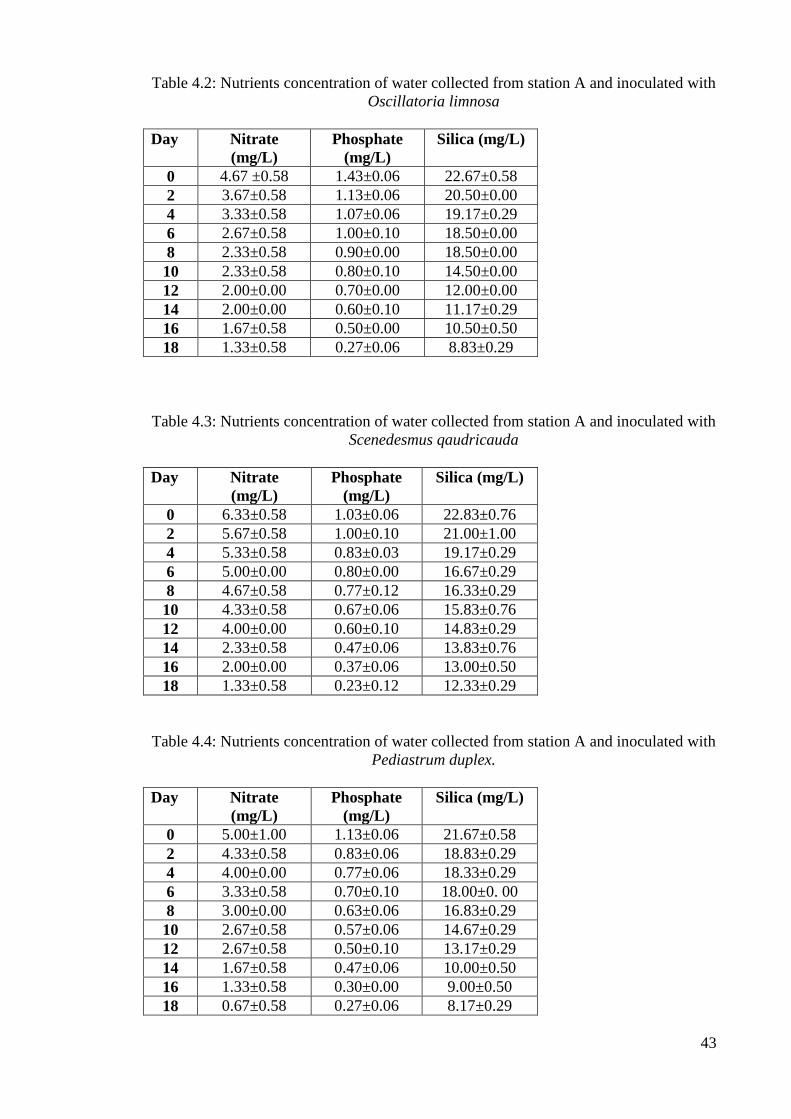
4.2 Water quality analysis
In the early stage of the experiment, the initial amount of nitrogen, phosphorous
and silica in all wastewater samples from both stations were very high (Table 4.2 to
Table 4.9). This indicated that Tasik Taman Jaya was polluted and experiencing
eutrophication. Nutrients that were removed from wastewater effluent are to control
eutrophication (Hammouda et. al., 1995).
43
Table 4.2: Nutrients concentration of water collected from station A and inoculated with
Oscillatoria limnosa
Day Nitrate
(mg/L)
Phosphate
(mg/L)
Silica (mg/L)
0 4.67 ±0.58 1.43±0.06 22.67±0.58
2 3.67±0.58 1.13±0.06 20.50±0.00
4 3.33±0.58 1.07±0.06 19.17±0.29
6 2.67±0.58 1.00±0.10 18.50±0.00
8 2.33±0.58 0.90±0.00 18.50±0.00
10 2.33±0.58 0.80±0.10 14.50±0.00
12 2.00±0.00 0.70±0.00 12.00±0.00
14 2.00±0.00 0.60±0.10 11.17±0.29
16 1.67±0.58 0.50±0.00 10.50±0.50
18 1.33±0.58 0.27±0.06 8.83±0.29
Table 4.3: Nutrients concentration of water collected from station A and inoculated with
Scenedesmus qaudricauda
Day Nitrate
(mg/L)
Phosphate
(mg/L)
Silica (mg/L)
0 6.33±0.58 1.03±0.06 22.83±0.76
2 5.67±0.58 1.00±0.10 21.00±1.00
4 5.33±0.58 0.83±0.03 19.17±0.29
6 5.00±0.00 0.80±0.00 16.67±0.29
8 4.67±0.58 0.77±0.12 16.33±0.29
10 4.33±0.58 0.67±0.06 15.83±0.76
12 4.00±0.00 0.60±0.10 14.83±0.29
14 2.33±0.58 0.47±0.06 13.83±0.76
16 2.00±0.00 0.37±0.06 13.00±0.50
18 1.33±0.58 0.23±0.12 12.33±0.29
Table 4.4: Nutrients concentration of water collected from station A and inoculated with
Pediastrum duplex.
Day Nitrate
(mg/L)
Phosphate
(mg/L)
Silica (mg/L)
0 5.00±1.00 1.13±0.06 21.67±0.58
2 4.33±0.58 0.83±0.06 18.83±0.29
4 4.00±0.00 0.77±0.06 18.33±0.29
6 3.33±0.58 0.70±0.10 18.00±0. 00
8 3.00±0.00 0.63±0.06 16.83±0.29
10 2.67±0.58 0.57±0.06 14.67±0.29
12 2.67±0.58 0.50±0.10 13.17±0.29
14 1.67±0.58 0.47±0.06 10.00±0.50
16 1.33±0.58 0.30±0.00 9.00±0.50
18 0.67±0.58 0.27±0.06 8.17±0.29
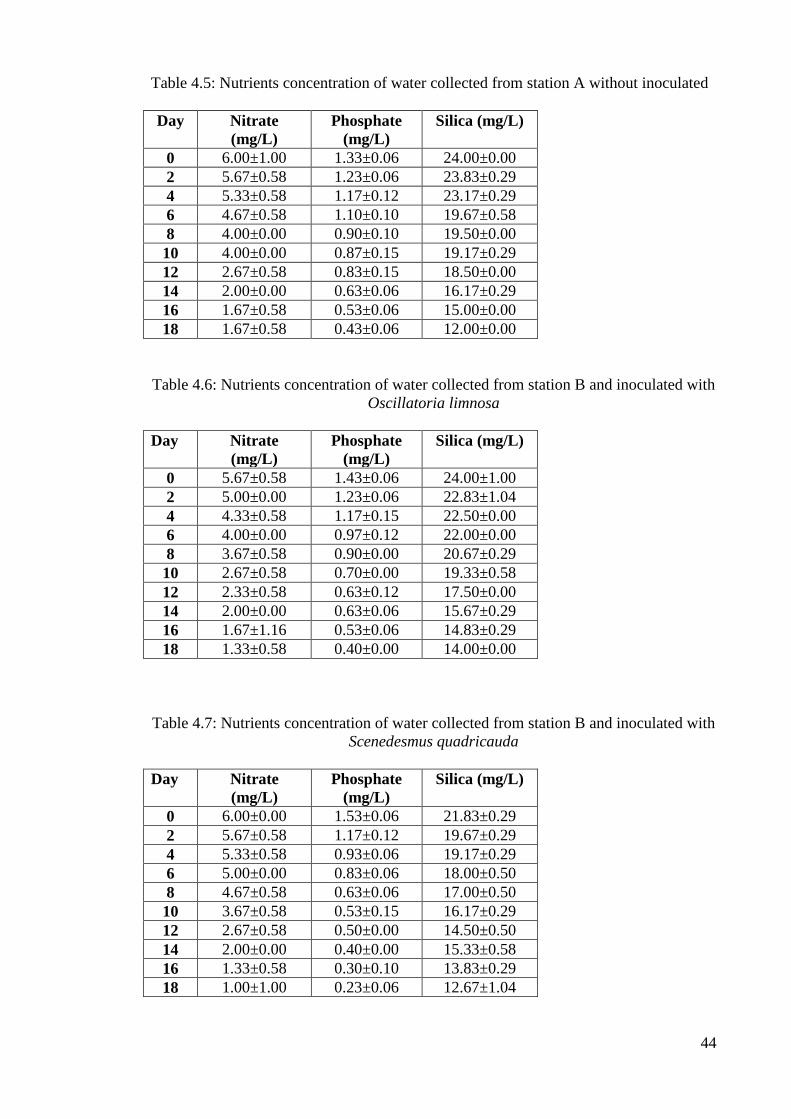
44
Table 4.5: Nutrients concentration of water collected from station A without inoculated
Day Nitrate
(mg/L)
Phosphate
(mg/L)
Silica (mg/L)
0 6.00±1.00 1.33±0.06 24.00±0.00
2 5.67±0.58 1.23±0.06 23.83±0.29
4 5.33±0.58 1.17±0.12 23.17±0.29
6 4.67±0.58 1.10±0.10 19.67±0.58
8 4.00±0.00 0.90±0.10 19.50±0.00
10 4.00±0.00 0.87±0.15 19.17±0.29
12 2.67±0.58 0.83±0.15 18.50±0.00
14 2.00±0.00 0.63±0.06 16.17±0.29
16 1.67±0.58 0.53±0.06 15.00±0.00
18 1.67±0.58 0.43±0.06 12.00±0.00
Table 4.6: Nutrients concentration of water collected from station B and inoculated with
Oscillatoria limnosa
Day Nitrate
(mg/L)
Phosphate
(mg/L)
Silica (mg/L)
0 5.67±0.58 1.43±0.06 24.00±1.00
2 5.00±0.00 1.23±0.06 22.83±1.04
4 4.33±0.58 1.17±0.15 22.50±0.00
6 4.00±0.00 0.97±0.12 22.00±0.00
8 3.67±0.58 0.90±0.00 20.67±0.29
10 2.67±0.58 0.70±0.00 19.33±0.58
12 2.33±0.58 0.63±0.12 17.50±0.00
14 2.00±0.00 0.63±0.06 15.67±0.29
16 1.67±1.16 0.53±0.06 14.83±0.29
18 1.33±0.58 0.40±0.00 14.00±0.00
Table 4.7: Nutrients concentration of water collected from station B and inoculated with
Scenedesmus quadricauda
Day Nitrate
(mg/L)
Phosphate
(mg/L)
Silica (mg/L)
0 6.00±0.00 1.53±0.06 21.83±0.29
2 5.67±0.58 1.17±0.12 19.67±0.29
4 5.33±0.58 0.93±0.06 19.17±0.29
6 5.00±0.00 0.83±0.06 18.00±0.50
8 4.67±0.58 0.63±0.06 17.00±0.50
10 3.67±0.58 0.53±0.15 16.17±0.29
12 2.67±0.58 0.50±0.00 14.50±0.50
14 2.00±0.00 0.40±0.00 15.33±0.58
16 1.33±0.58 0.30±0.10 13.83±0.29
18 1.00±1.00 0.23±0.06 12.67±1.04
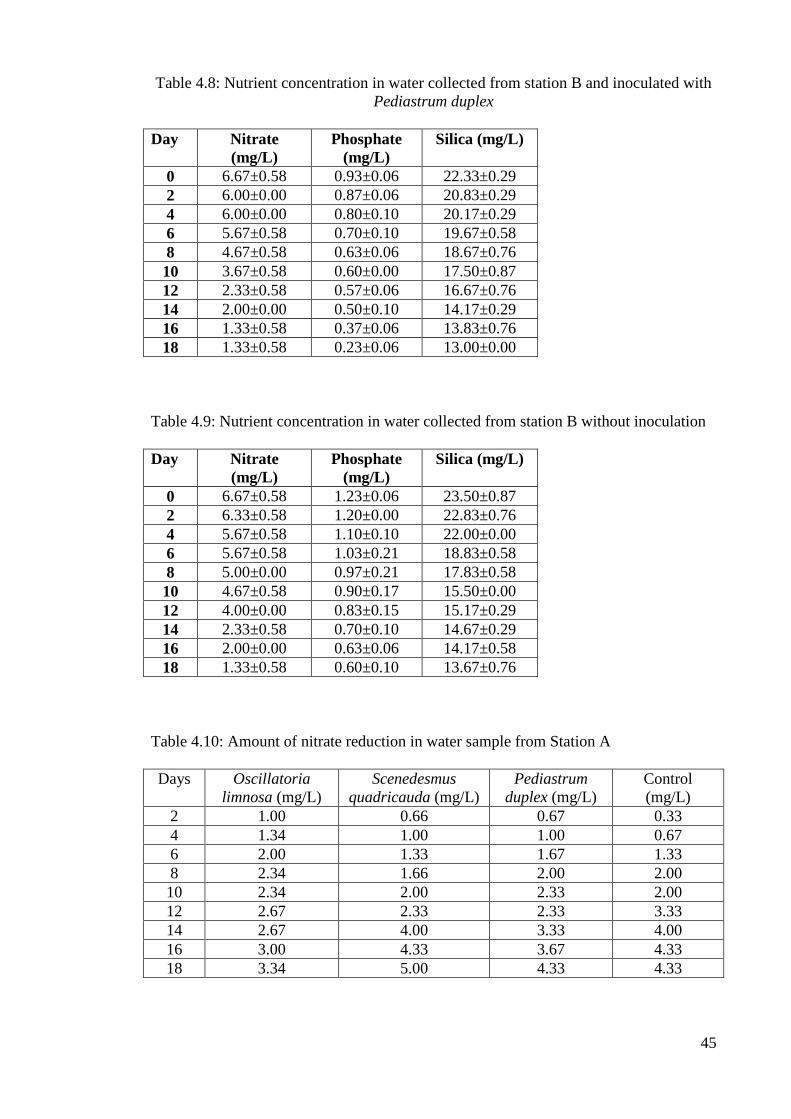
45
Table 4.8: Nutrient concentration in water collected from station B and inoculated with
Pediastrum duplex
Day Nitrate
(mg/L)
Phosphate
(mg/L)
Silica (mg/L)
0 6.67±0.58 0.93±0.06 22.33±0.29
2 6.00±0.00 0.87±0.06 20.83±0.29
4 6.00±0.00 0.80±0.10 20.17±0.29
6 5.67±0.58 0.70±0.10 19.67±0.58
8 4.67±0.58 0.63±0.06 18.67±0.76
10 3.67±0.58 0.60±0.00 17.50±0.87
12 2.33±0.58 0.57±0.06 16.67±0.76
14 2.00±0.00 0.50±0.10 14.17±0.29
16 1.33±0.58 0.37±0.06 13.83±0.76
18 1.33±0.58 0.23±0.06 13.00±0.00
Table 4.9: Nutrient concentration in water collected from station B without inoculation
Day Nitrate
(mg/L)
Phosphate
(mg/L)
Silica (mg/L)
0 6.67±0.58 1.23±0.06 23.50±0.87
2 6.33±0.58 1.20±0.00 22.83±0.76
4 5.67±0.58 1.10±0.10 22.00±0.00
6 5.67±0.58 1.03±0.21 18.83±0.58
8 5.00±0.00 0.97±0.21 17.83±0.58
10 4.67±0.58 0.90±0.17 15.50±0.00
12 4.00±0.00 0.83±0.15 15.17±0.29
14 2.33±0.58 0.70±0.10 14.67±0.29
16 2.00±0.00 0.63±0.06 14.17±0.58
18 1.33±0.58 0.60±0.10 13.67±0.76
Table 4.10: Amount of nitrate reduction in water sample from Station A
Days Oscillatoria
limnosa (mg/L)
Scenedesmus
quadricauda (mg/L)
Pediastrum
duplex (mg/L)
Control
(mg/L)
2 1.00 0.66 0.67 0.33
4 1.34 1.00 1.00 0.67
6 2.00 1.33 1.67 1.33
8 2.34 1.66 2.00 2.00
10 2.34 2.00 2.33 2.00
12 2.67 2.33 2.33 3.33
14 2.67 4.00 3.33 4.00
16 3.00 4.33 3.67 4.33
18 3.34 5.00 4.33 4.33
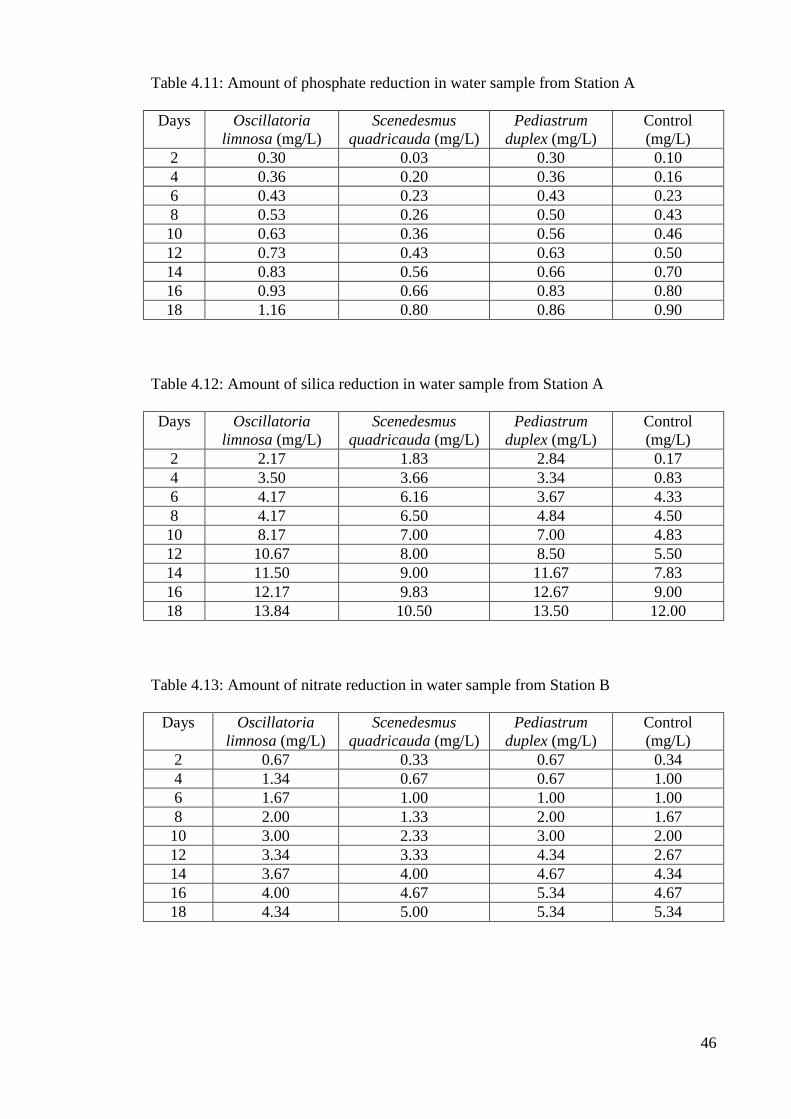
46
Table 4.11: Amount of phosphate reduction in water sample from Station A
Days Oscillatoria
limnosa (mg/L)
Scenedesmus
quadricauda (mg/L)
Pediastrum
duplex (mg/L)
Control
(mg/L)
2 0.30 0.03 0.30 0.10
4 0.36 0.20 0.36 0.16
6 0.43 0.23 0.43 0.23
8 0.53 0.26 0.50 0.43
10 0.63 0.36 0.56 0.46
12 0.73 0.43 0.63 0.50
14 0.83 0.56 0.66 0.70
16 0.93 0.66 0.83 0.80
18 1.16 0.80 0.86 0.90
Table 4.12: Amount of silica reduction in water sample from Station A
Days Oscillatoria
limnosa (mg/L)
Scenedesmus
quadricauda (mg/L)
Pediastrum
duplex (mg/L)
Control
(mg/L)
2 2.17 1.83 2.84 0.17
4 3.50 3.66 3.34 0.83
6 4.17 6.16 3.67 4.33
8 4.17 6.50 4.84 4.50
10 8.17 7.00 7.00 4.83
12 10.67 8.00 8.50 5.50
14 11.50 9.00 11.67 7.83
16 12.17 9.83 12.67 9.00
18 13.84 10.50 13.50 12.00
Table 4.13: Amount of nitrate reduction in water sample from Station B
Days Oscillatoria
limnosa (mg/L)
Scenedesmus
quadricauda (mg/L)
Pediastrum
duplex (mg/L)
Control
(mg/L)
2 0.67 0.33 0.67 0.34
4 1.34 0.67 0.67 1.00
6 1.67 1.00 1.00 1.00
8 2.00 1.33 2.00 1.67
10 3.00 2.33 3.00 2.00
12 3.34 3.33 4.34 2.67
14 3.67 4.00 4.67 4.34
16 4.00 4.67 5.34 4.67
18 4.34 5.00 5.34 5.34
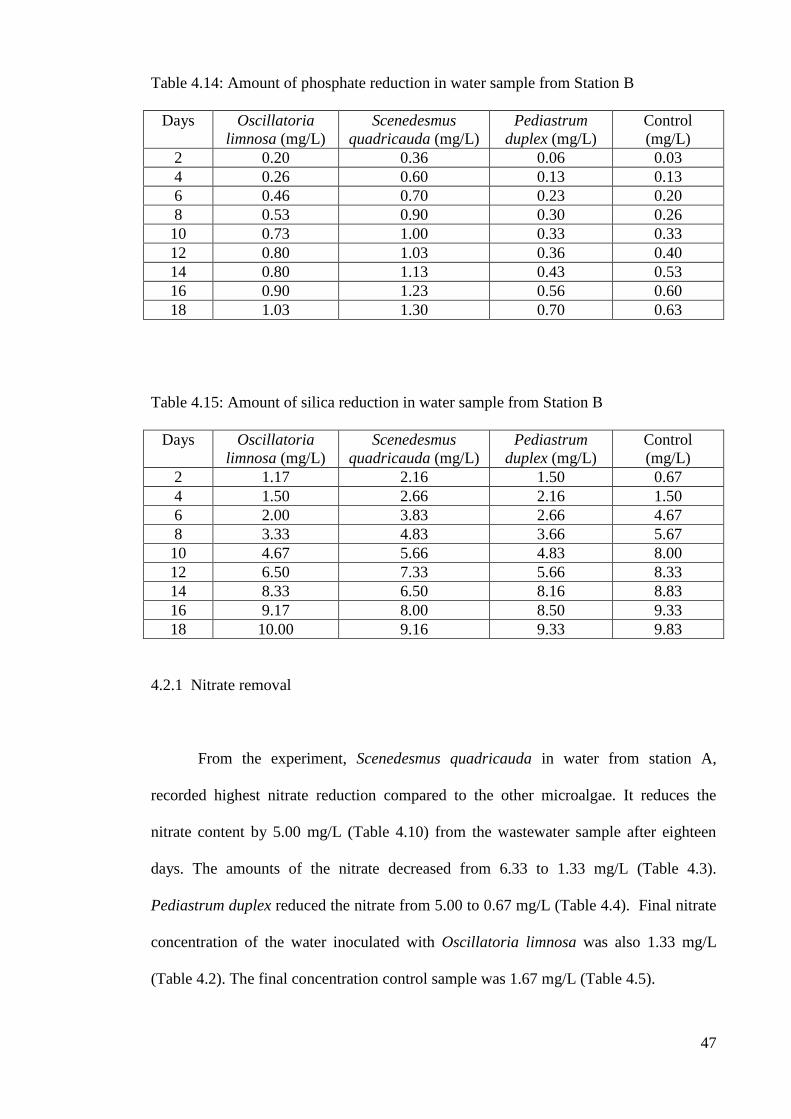
47
Table 4.14: Amount of phosphate reduction in water sample from Station B
Days Oscillatoria
limnosa (mg/L)
Scenedesmus
quadricauda (mg/L)
Pediastrum
duplex (mg/L)
Control
(mg/L)
2 0.20 0.36 0.06 0.03
4 0.26 0.60 0.13 0.13
6 0.46 0.70 0.23 0.20
8 0.53 0.90 0.30 0.26
10 0.73 1.00 0.33 0.33
12 0.80 1.03 0.36 0.40
14 0.80 1.13 0.43 0.53
16 0.90 1.23 0.56 0.60
18 1.03 1.30 0.70 0.63
Table 4.15: Amount of silica reduction in water sample from Station B
Days Oscillatoria
limnosa (mg/L)
Scenedesmus
quadricauda (mg/L)
Pediastrum
duplex (mg/L)
Control
(mg/L)
2 1.17 2.16 1.50 0.67
4 1.50 2.66 2.16 1.50
6 2.00 3.83 2.66 4.67
8 3.33 4.83 3.66 5.67
10 4.67 5.66 4.83 8.00
12 6.50 7.33 5.66 8.33
14 8.33 6.50 8.16 8.83
16 9.17 8.00 8.50 9.33
18 10.00 9.16 9.33 9.83
4.2.1 Nitrate removal
From the experiment, Scenedesmus quadricauda in water from station A,
recorded highest nitrate reduction compared to the other microalgae. It reduces the
nitrate content by 5.00 mg/L (Table 4.10) from the wastewater sample after eighteen
days. The amounts of the nitrate decreased from 6.33 to 1.33 mg/L (Table 4.3).
Pediastrum duplex reduced the nitrate from 5.00 to 0.67 mg/L (Table 4.4). Final nitrate
concentration of the water inoculated with Oscillatoria limnosa was also 1.33 mg/L
(Table 4.2). The final concentration control sample was 1.67 mg/L (Table 4.5).
48
For water from station B, the nitrate concentration at the last day of experiment
inoculated with Scenedesmus quadricauda was 1.00 mg/L (Table 4.7), Those inoculated
with Oscillatoria limnosa, Pediastrum duplex and control recorded the same final
concentration value (1.33 mg/L) (Table 4.6, Table 4.8 and Table 4.9 ). Higher reduction
of nitrate in water from station B inoculated with Pediastrum duplex was obtained as
compared to that from station A. The reduction in nitrate content in the former was 5.34
mg/L (Table 4.13).
4.2.2 Phosphate removal
Initial phosphate concentration in water collected from station A ranged from
1.03 to 1.43 mg/L (Table 4.2, Table 4.3). Reduction in phosphate content during the 18
days experiment in water inoculated with the algae Scenedsmus quadricauda,
Pediastrum duplex, Oscillatoria limnosa are shown Table 4.11. Water inoculated with
Oscillatoria limnosa recorded the highest reduction of phosphate 1.16 mg/L. This
showed that Oscillatoria limnosa was able to utilize phosphate more than Pediastrum
duplex and Scenedesmus quadricauda. Meanwhile, in the control, the amount of
phosphate reduction was about 0.90 mg/L (Table 4.11) with the final concentration of
0.43 mg/L (Table 4.5).
Reduction of phosphate in experiments with water sample collected from station
B is shown in Tables 4.7 and Table 4.8). Final phosphate concentration in water sample
inoculated with Scenedesmus quadricauda and Pediastrum duplex were both 0.23 mg/L
The amount of phosphate reduced was in water samples inoculated with Scenedesmus
quadricauda and Pediastrum duplex was 1.30 mg/L and 0.70 mg/L respectively. In
49
water sample inoculated with Oscillatoria limnosa phosphate reduction was 1.03 mg/L.
There was a 0.63 mg/L reduction in phosphate concentration in the control (Table 4.9).
4.2.3 Silica removal
Table 4.12 shows the amount of silica reduction in water sample for station A.
After eighteen days of the experiment, Pediastrum duplex reduced the silica at about
13.50 mg/L (Table 4.12). Silica concentration at the end of the experiment was 8.17
mg/L (Table 4.4). In water sample inoculated with Oscillatoria limnosa silica
concentration decreased by 13.84 mg/L. In water sample inoculated with Scenedesmus
quadricauda silica concentration decreased by 10.50 mg/L. Higher reduction of silica
was obtained for the control which was by 12.00 mg/L. In water samples from station B
inoculated with Scenedesmus quadricauda, there was a 9.16 mg/L reduction in silica.
Reduction in concentration of silica in water sample from station B by all the algae are
shown in Table 4.15. Water sample inoculated with Scenedesmus quadricauda showed
the least reduction of silica concentration.
This study shows that unicellular and the filamentous algae were able to remove
nutrient's concentration in the wastewater samples. A worked done by Shushu and
Chipeta (2002) showed, Oscillatoria sp. is able to remove 100% of phosphate within six
days of the experiment. Although in this experiment the stirring was done manually,
almost 80% of the nitrate and phosphate as well as 50 % of silica has been removed
from the wastewater by the microalgae. According to Martínez et.al (2000), stirring did
not visibly affected this total elimination, except at 30° C. Stirring hardly affected
adsorption, but at 30° C was the temperature at which stirring most influenced growth.
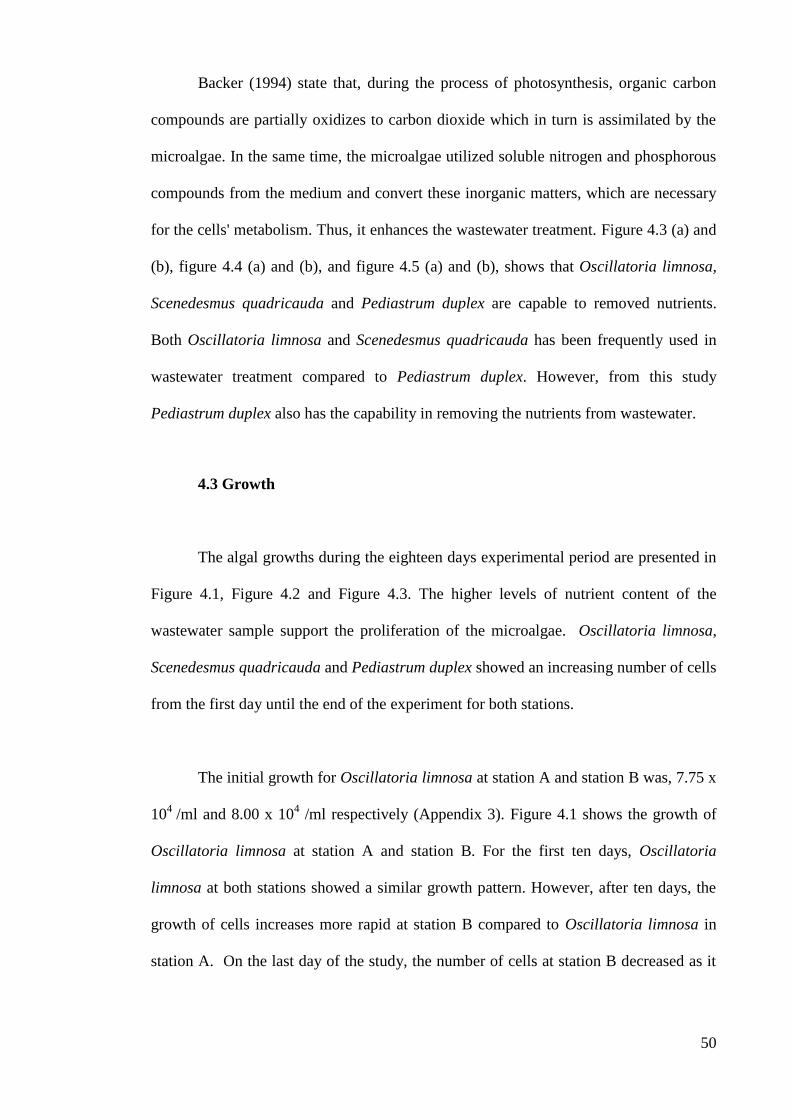
50
Backer (1994) state that, during the process of photosynthesis, organic carbon
compounds are partially oxidizes to carbon dioxide which in turn is assimilated by the
microalgae. In the same time, the microalgae utilized soluble nitrogen and phosphorous
compounds from the medium and convert these inorganic matters, which are necessary
for the cells' metabolism. Thus, it enhances the wastewater treatment. Figure 4.3 (a) and
(b), figure 4.4 (a) and (b), and figure 4.5 (a) and (b), shows that Oscillatoria limnosa,
Scenedesmus quadricauda and Pediastrum duplex are capable to removed nutrients.
Both Oscillatoria limnosa and Scenedesmus quadricauda has been frequently used in
wastewater treatment compared to Pediastrum duplex. However, from this study
Pediastrum duplex also has the capability in removing the nutrients from wastewater.
4.3 Growth
The algal growths during the eighteen days experimental period are presented in
Figure 4.1, Figure 4.2 and Figure 4.3. The higher levels of nutrient content of the
wastewater sample support the proliferation of the microalgae. Oscillatoria limnosa,
Scenedesmus quadricauda and Pediastrum duplex showed an increasing number of cells
from the first day until the end of the experiment for both stations.
The initial growth for Oscillatoria limnosa at station A and station B was, 7.75 x
104
/ml and 8.00 x 10⁴ /ml respectively (Appendix 3). Figure 4.1 shows the growth of
Oscillatoria limnosa at station A and station B. For the first ten days, Oscillatoria
limnosa at both stations showed a similar growth pattern. However, after ten days, the
growth of cells increases more rapid at station B compared to Oscillatoria limnosa in
station A. On the last day of the study, the number of cells at station B decreased as it
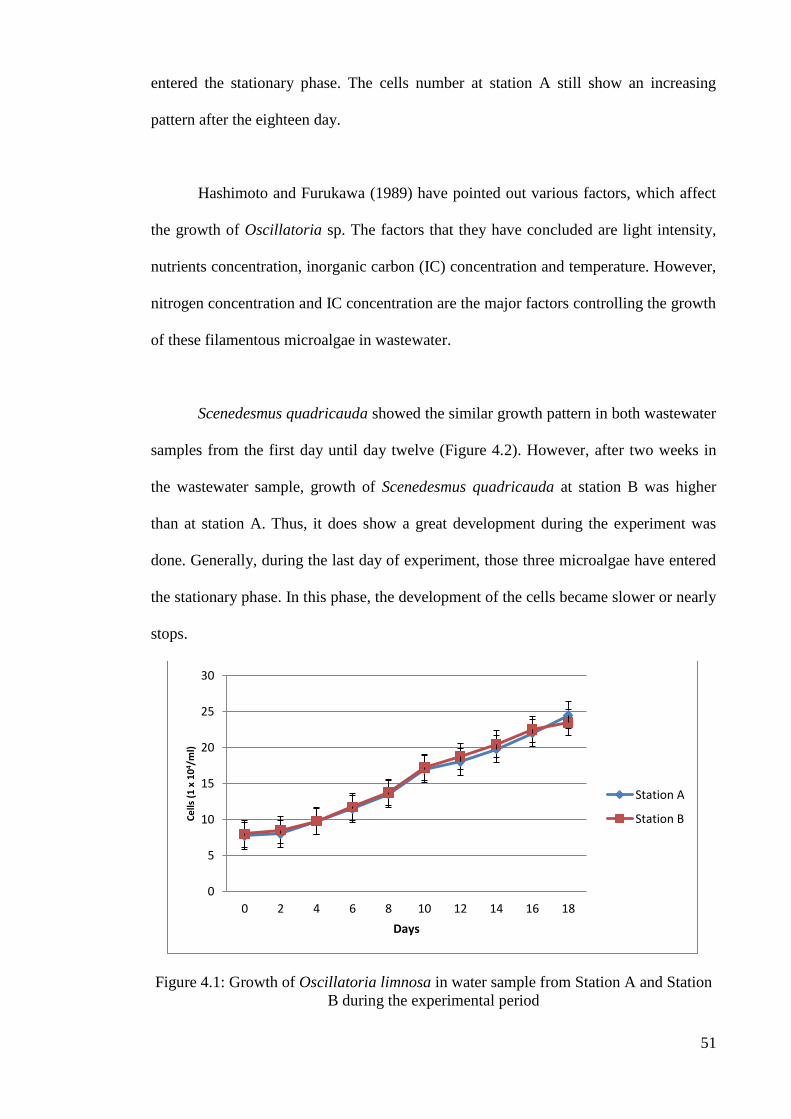
51
entered the stationary phase. The cells number at station A still show an increasing
pattern after the eighteen day.
Hashimoto and Furukawa (1989) have pointed out various factors, which affect
the growth of Oscillatoria sp. The factors that they have concluded are light intensity,
nutrients concentration, inorganic carbon (IC) concentration and temperature. However,
nitrogen concentration and IC concentration are the major factors controlling the growth
of these filamentous microalgae in wastewater.
Scenedesmus quadricauda showed the similar growth pattern in both wastewater
samples from the first day until day twelve (Figure 4.2). However, after two weeks in
the wastewater sample, growth of Scenedesmus quadricauda at station B was higher
than at station A. Thus, it does show a great development during the experiment was
done. Generally, during the last day of experiment, those three microalgae have entered
the stationary phase. In this phase, the development of the cells became slower or nearly
stops.
Figure 4.1: Growth of Oscillatoria limnosa in water sample from Station A and Station
B during the experimental period
0
5
10
15
20
25
30
0 2 4 6 8 10 12 14 16 18
Ce
lls (
1 x
10
4 /m
l)
Days
Station A
Station B
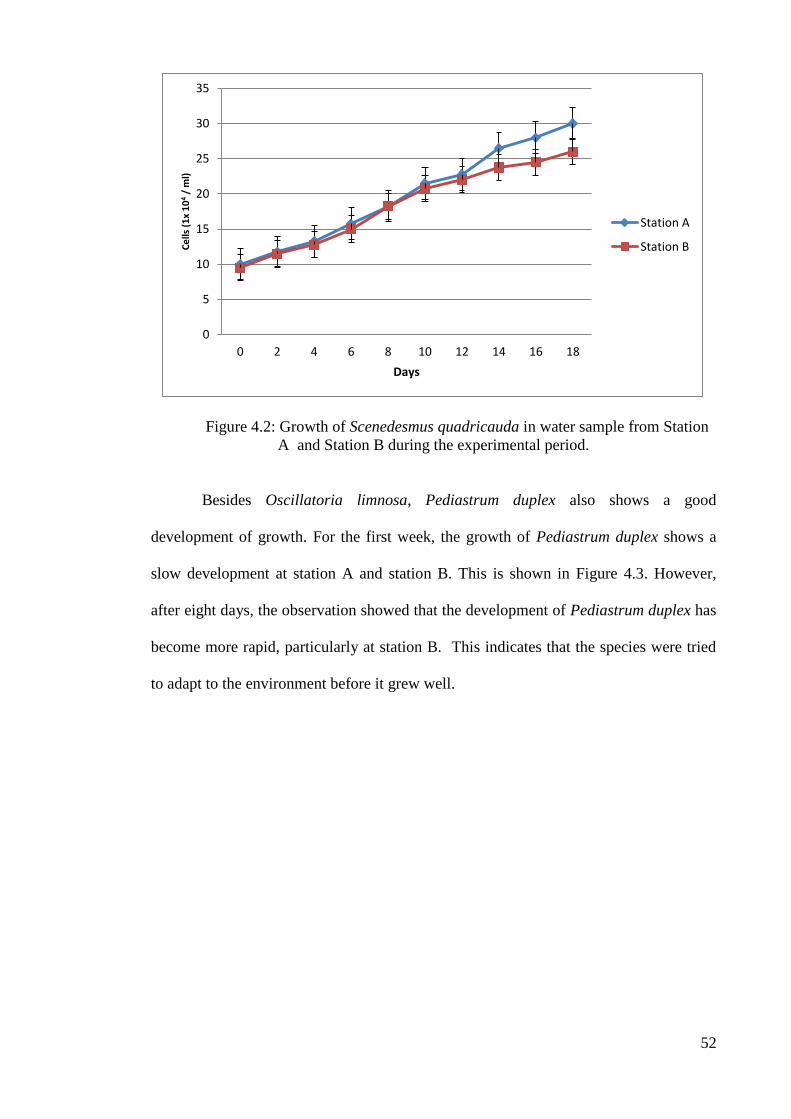
52
Figure 4.2: Growth of Scenedesmus quadricauda in water sample from Station
A and Station B during the experimental period.
Besides Oscillatoria limnosa, Pediastrum duplex also shows a good
development of growth. For the first week, the growth of Pediastrum duplex shows a
slow development at station A and station B. This is shown in Figure 4.3. However,
after eight days, the observation showed that the development of Pediastrum duplex has
become more rapid, particularly at station B. This indicates that the species were tried
to adapt to the environment before it grew well.
0
5
10
15
20
25
30
35
0 2 4 6 8 10 12 14 16 18
Ce
lls (
1x
10
4 /
ml)
Days
Station A
Station B
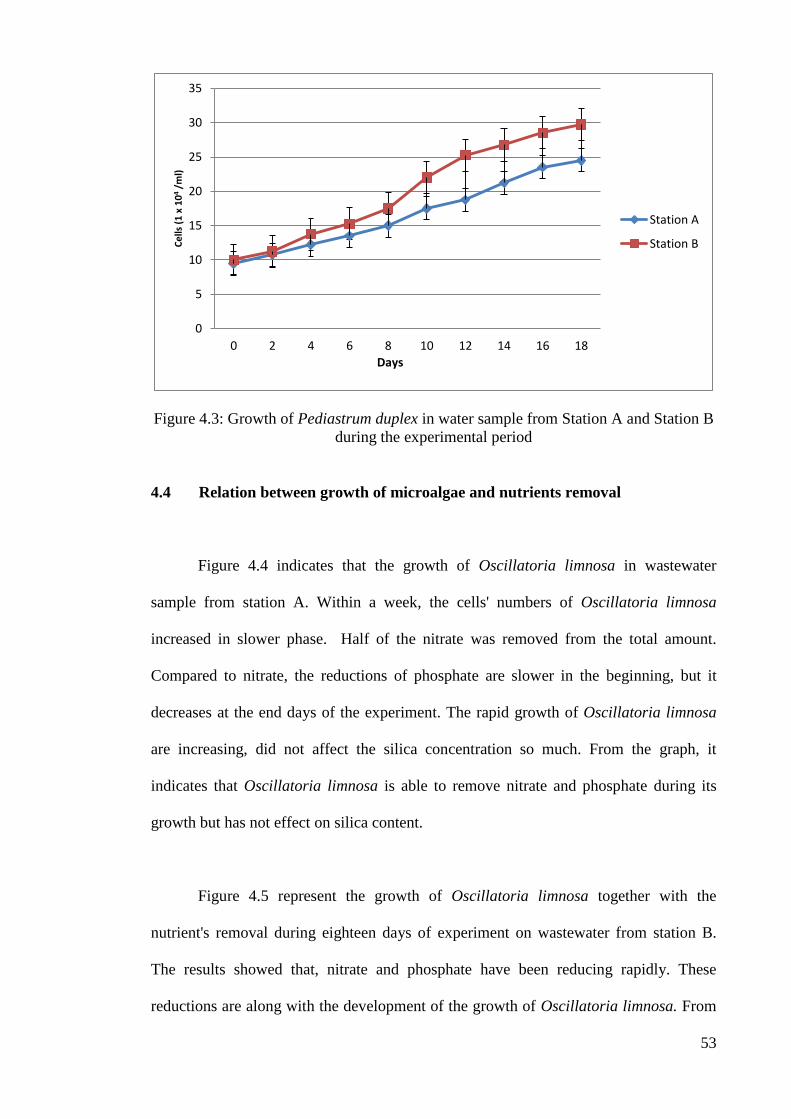
53
Figure 4.3: Growth of Pediastrum duplex in water sample from Station A and Station B
during the experimental period
4.4 Relation between growth of microalgae and nutrients removal
Figure 4.4 indicates that the growth of Oscillatoria limnosa in wastewater
sample from station A. Within a week, the cells' numbers of Oscillatoria limnosa
increased in slower phase. Half of the nitrate was removed from the total amount.
Compared to nitrate, the reductions of phosphate are slower in the beginning, but it
decreases at the end days of the experiment. The rapid growth of Oscillatoria limnosa
are increasing, did not affect the silica concentration so much. From the graph, it
indicates that Oscillatoria limnosa is able to remove nitrate and phosphate during its
growth but has not effect on silica content.
Figure 4.5 represent the growth of Oscillatoria limnosa together with the
nutrient's removal during eighteen days of experiment on wastewater from station B.
The results showed that, nitrate and phosphate have been reducing rapidly. These
reductions are along with the development of the growth of Oscillatoria limnosa. From
0
5
10
15
20
25
30
35
0 2 4 6 8 10 12 14 16 18
Ce
lls (
1 x
10
4 /
ml)
Days
Station A
Station B
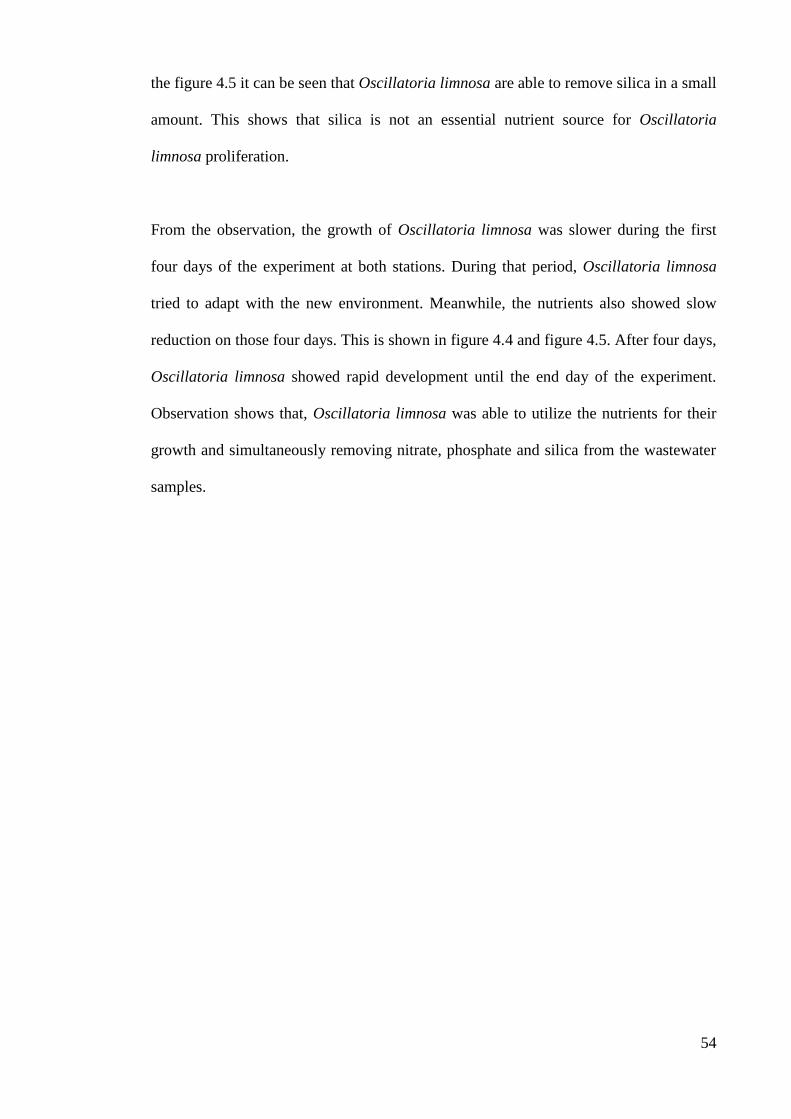
54
the figure 4.5 it can be seen that Oscillatoria limnosa are able to remove silica in a small
amount. This shows that silica is not an essential nutrient source for Oscillatoria
limnosa proliferation.
From the observation, the growth of Oscillatoria limnosa was slower during the first
four days of the experiment at both stations. During that period, Oscillatoria limnosa
tried to adapt with the new environment. Meanwhile, the nutrients also showed slow
reduction on those four days. This is shown in figure 4.4 and figure 4.5. After four days,
Oscillatoria limnosa showed rapid development until the end day of the experiment.
Observation shows that, Oscillatoria limnosa was able to utilize the nutrients for their
growth and simultaneously removing nitrate, phosphate and silica from the wastewater
samples.
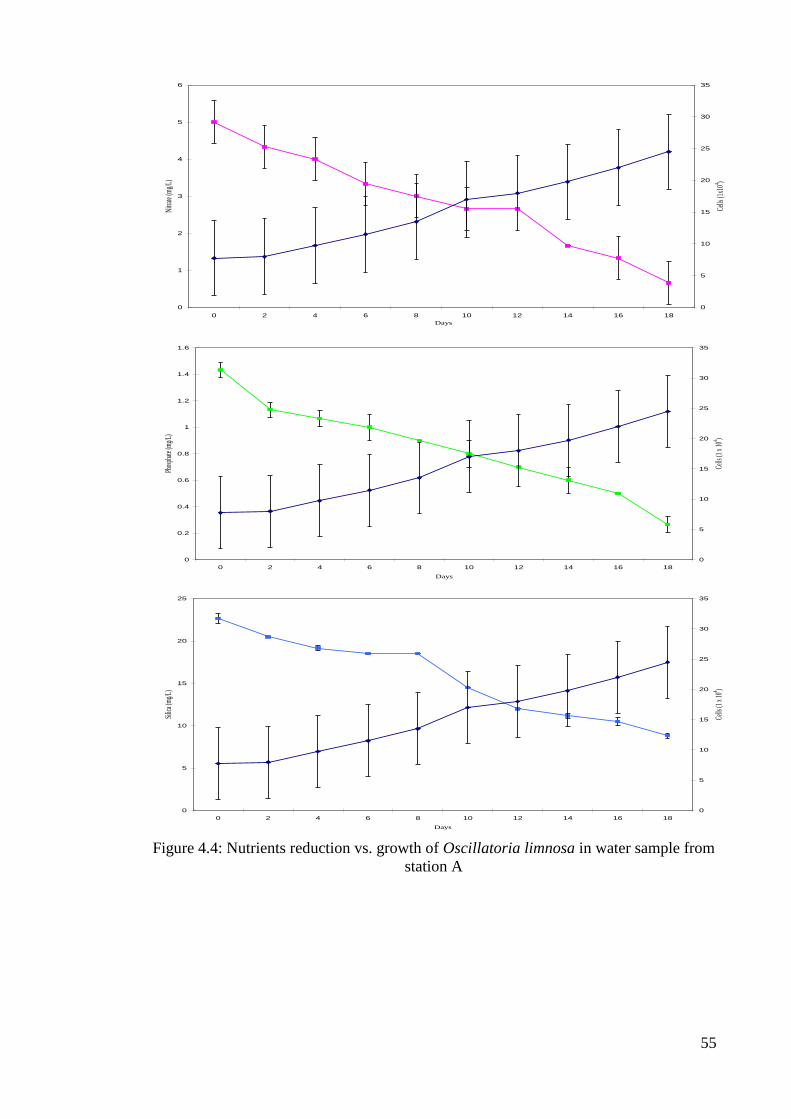
55
Figure 4.4: Nutrients reduction vs. growth of Oscillatoria limnosa in water sample from
station A
0
1
2
3
4
5
6
0 2 4 6 8 10 12 14 16 18
Days
Nitr
ate
(mg/
L)
0
5
10
15
20
25
30
35
Cells
(1x1
04 )
0
0.2
0.4
0.6
0.8
1
1.2
1.4
1.6
0 2 4 6 8 10 12 14 16 18
Days
Phos
phate
(mg/
L)
0
5
10
15
20
25
30
35
Cells
(1 x
104 )
0
5
10
15
20
25
0 2 4 6 8 10 12 14 16 18
Days
Silic
a (m
g/L)
0
5
10
15
20
25
30
35
Cells
(1 x
104 )
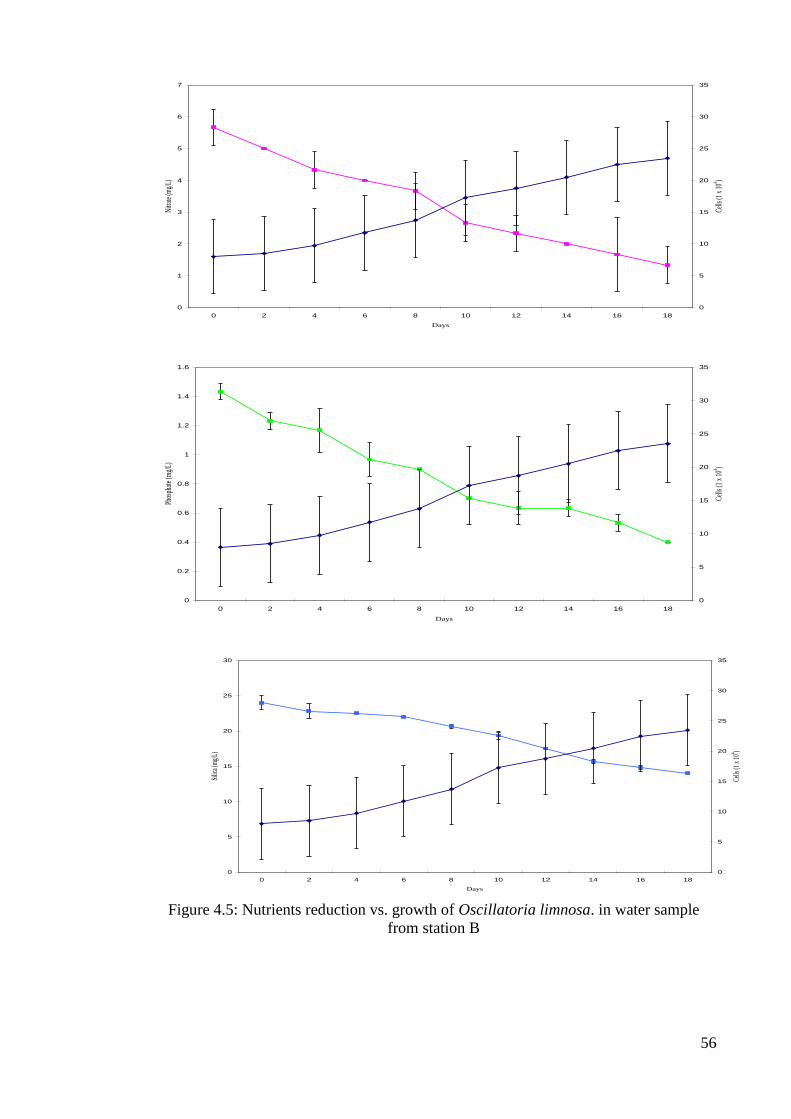
56
Figure 4.5: Nutrients reduction vs. growth of Oscillatoria limnosa. in water sample
from station B
0
1
2
3
4
5
6
7
0 2 4 6 8 10 12 14 16 18
Days
Nitr
ate
(mg/
L)
0
5
10
15
20
25
30
35
Cells
(1 x
104 )
0
0.2
0.4
0.6
0.8
1
1.2
1.4
1.6
0 2 4 6 8 10 12 14 16 18
Days
Phos
phat
e (m
g/L)
0
5
10
15
20
25
30
35
Cel
ls (1
x 1
04 )
0
5
10
15
20
25
30
0 2 4 6 8 10 12 14 16 18
Days
Silic
a (m
g/L)
0
5
10
15
20
25
30
35
Cells
(1 x
104 )
57
Figure 4.6 shows growth of Pediastrum duplex in wastewater from station A.
Growth of the species increased rapidly with total number of cells 9.50 x 10⁴
/ml
(Appendix 3) from the first day of the experiment. At the end day of the experiment the
numbers of cells become 24.50 x 10⁴ /ml
(Appendix 3). During the eighteen days of the
study, nitrate and phosphate decreased rapidly along with the algae growth. This
indicated that, Pediastrum duplex utilize the inorganic compound to increase their cells
number. Silica also reduced along with the growth of Pediastrum duplex
At the beginning of the experiment for wastewater from station B, the
developments of the Pediastrum duplex cells are slower with total numbers of cells
10.00 x 10⁴ /ml (Appendix 3), but after a week they grew faster. At the same time, the
nitrate, phosphate and silica were also decreased. The growth pattern and reduction of
nutrients can be seen in figure 4.7. After a week, growth of Pediastrum duplex has
accelerated and at the same time nitrate content there was a rapid drop. This also
observed for phosphate. The increasing growth of Pediastrum duplex was due nitrate
and phosphate assimilation. At the end of the experiment the total numbers of
Pediastrum duplex was 29.75 x 10⁴ /ml. The cells have utilized the nutrients for their
proliferation but silica was not utilized. The same results were found in Oscillatoria
limnosa where silica content did not reduce to much compare with nitrate and
phosphate. On day 18, the silica reached to the level above of 10.00 mg/L. Thus, from
the figure 4.6 and figure 4.7 show that Pediastrum duplex has an ability to reduce the
nutrients in the wastewater.
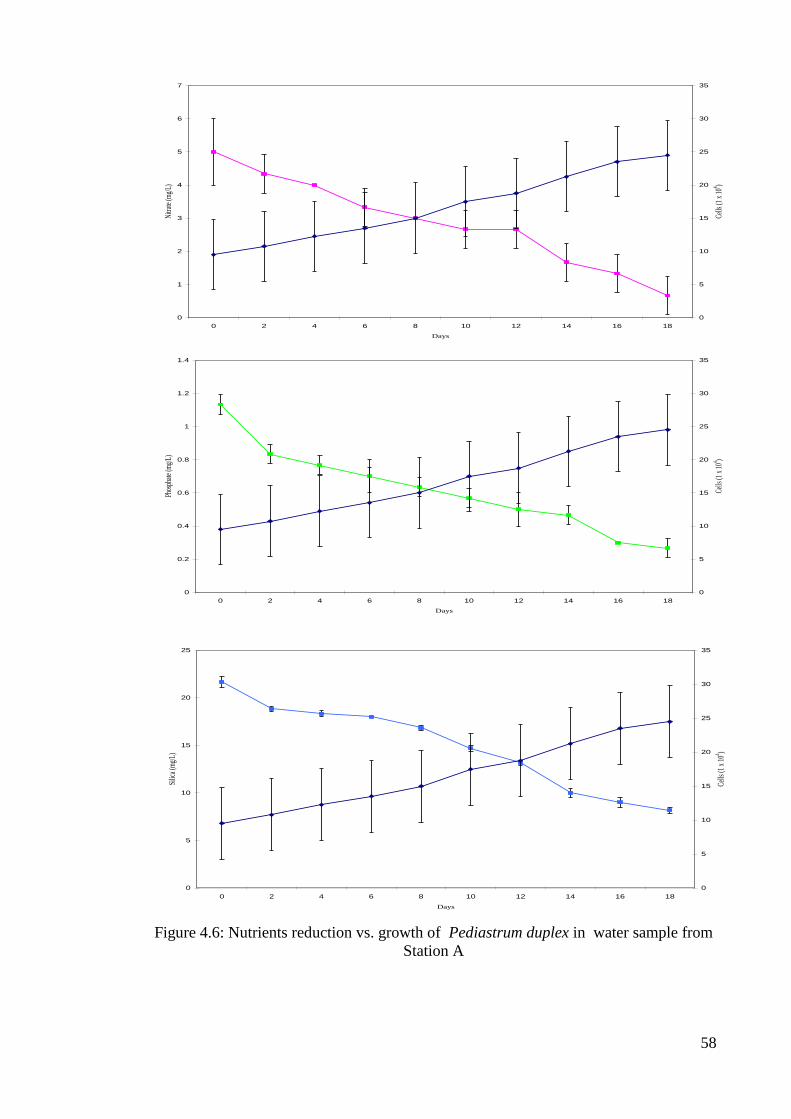
58
Figure 4.6: Nutrients reduction vs. growth of Pediastrum duplex in water sample from
Station A
0
1
2
3
4
5
6
7
0 2 4 6 8 10 12 14 16 18
Days
Nitr
ate
(mg/
L)
0
5
10
15
20
25
30
35
Cel
ls (1
x 1
04 )
0
0.2
0.4
0.6
0.8
1
1.2
1.4
0 2 4 6 8 10 12 14 16 18
Days
Phos
phat
e (m
g/L)
0
5
10
15
20
25
30
35
Cel
ls (1
x 1
04 )
0
5
10
15
20
25
0 2 4 6 8 10 12 14 16 18
Days
Silic
a (m
g/L)
0
5
10
15
20
25
30
35
Cel
ls (1
x 1
04 )
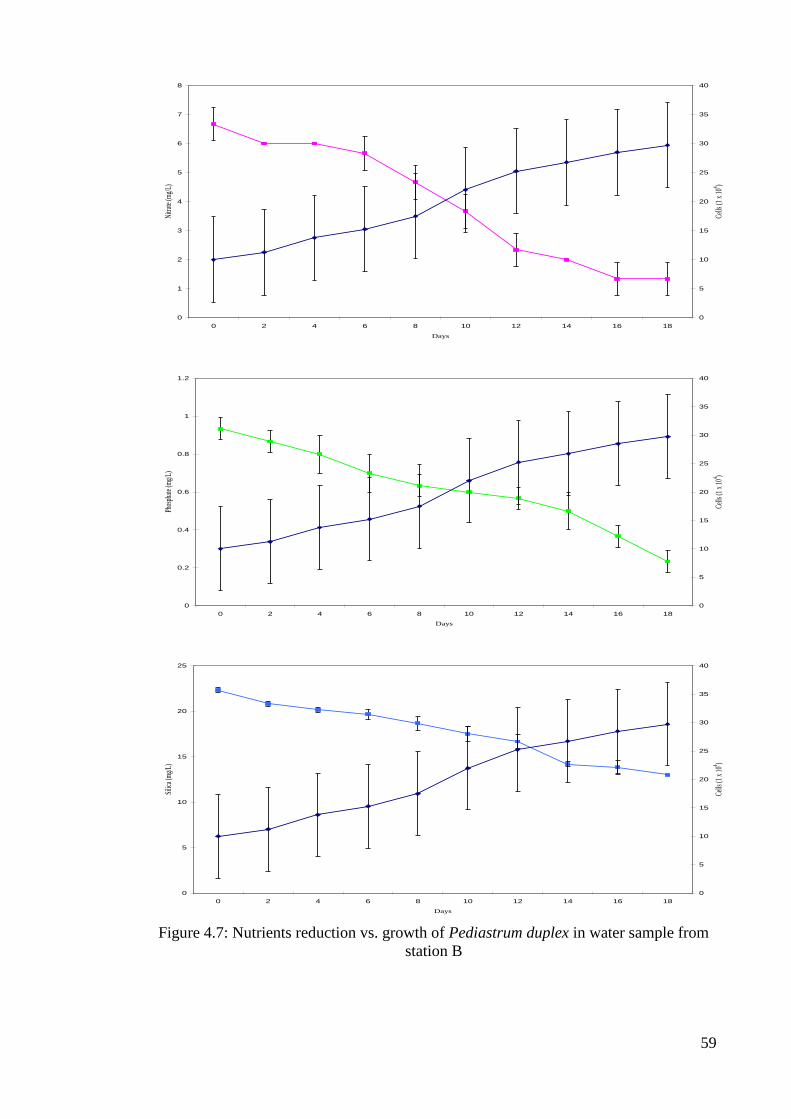
59
Figure 4.7: Nutrients reduction vs. growth of Pediastrum duplex in water sample from
station B
0
1
2
3
4
5
6
7
8
0 2 4 6 8 10 12 14 16 18
Days
Nitr
ate
(mg/
L)
0
5
10
15
20
25
30
35
40
Cel
ls (1
x 1
04 )
0
0.2
0.4
0.6
0.8
1
1.2
0 2 4 6 8 10 12 14 16 18
Days
Phos
phat
e (m
g/L)
0
5
10
15
20
25
30
35
40
Cells
(1 x
104 )
0
5
10
15
20
25
0 2 4 6 8 10 12 14 16 18
Days
Silic
a (m
g/L)
0
5
10
15
20
25
30
35
40
Cells
(1 x
104 )
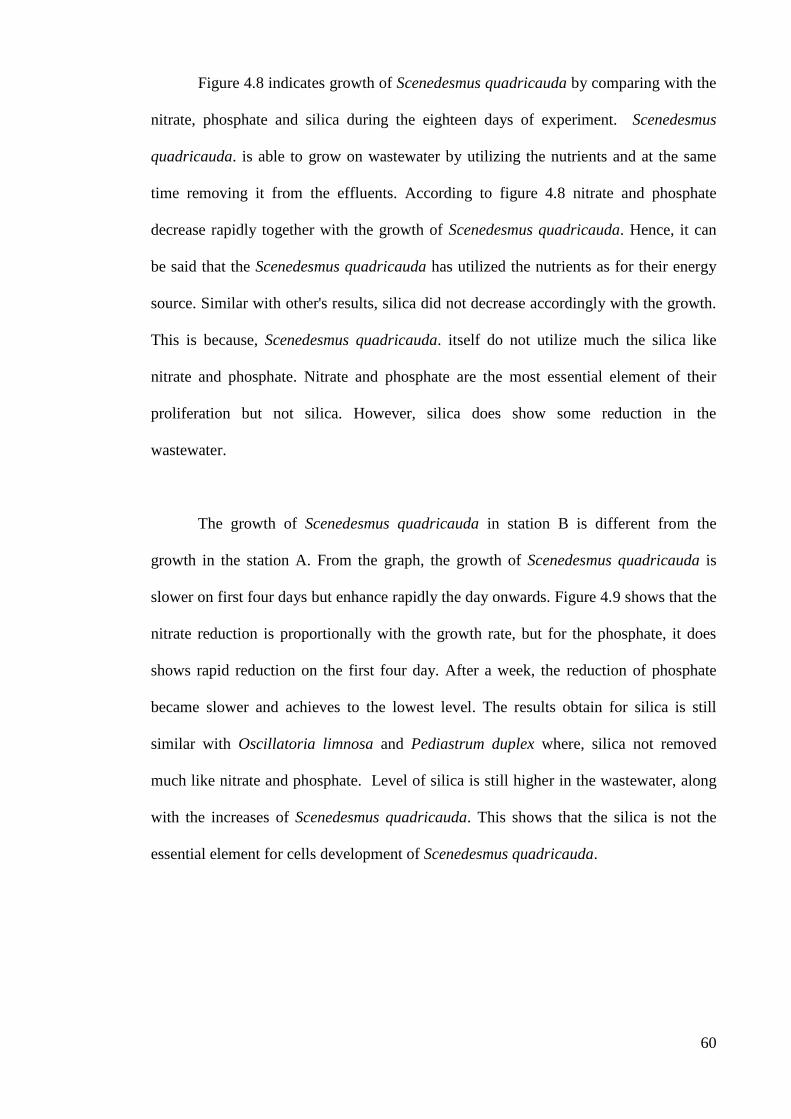
60
Figure 4.8 indicates growth of Scenedesmus quadricauda by comparing with the
nitrate, phosphate and silica during the eighteen days of experiment. Scenedesmus
quadricauda. is able to grow on wastewater by utilizing the nutrients and at the same
time removing it from the effluents. According to figure 4.8 nitrate and phosphate
decrease rapidly together with the growth of Scenedesmus quadricauda. Hence, it can
be said that the Scenedesmus quadricauda has utilized the nutrients as for their energy
source. Similar with other's results, silica did not decrease accordingly with the growth.
This is because, Scenedesmus quadricauda. itself do not utilize much the silica like
nitrate and phosphate. Nitrate and phosphate are the most essential element of their
proliferation but not silica. However, silica does show some reduction in the
wastewater.
The growth of Scenedesmus quadricauda in station B is different from the
growth in the station A. From the graph, the growth of Scenedesmus quadricauda is
slower on first four days but enhance rapidly the day onwards. Figure 4.9 shows that the
nitrate reduction is proportionally with the growth rate, but for the phosphate, it does
shows rapid reduction on the first four day. After a week, the reduction of phosphate
became slower and achieves to the lowest level. The results obtain for silica is still
similar with Oscillatoria limnosa and Pediastrum duplex where, silica not removed
much like nitrate and phosphate. Level of silica is still higher in the wastewater, along
with the increases of Scenedesmus quadricauda. This shows that the silica is not the
essential element for cells development of Scenedesmus quadricauda.
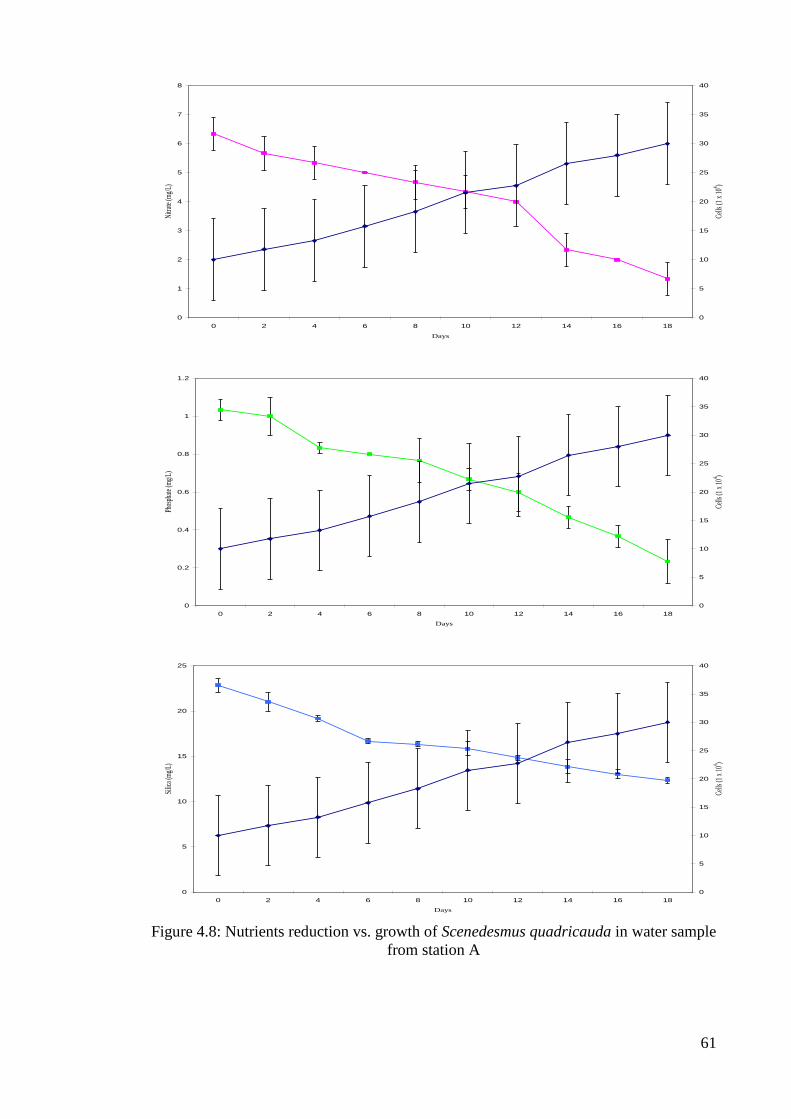
61
Figure 4.8: Nutrients reduction vs. growth of Scenedesmus quadricauda in water sample
from station A
0
1
2
3
4
5
6
7
8
0 2 4 6 8 10 12 14 16 18
Days
Nitr
ate
(mg/
L)
0
5
10
15
20
25
30
35
40
Cel
ls (1
x 1
04 )
0
0.2
0.4
0.6
0.8
1
1.2
0 2 4 6 8 10 12 14 16 18
Days
Phos
phat
e (m
g/L)
0
5
10
15
20
25
30
35
40
Cells
(1 x
104 )
0
5
10
15
20
25
0 2 4 6 8 10 12 14 16 18
Days
Silic
a (m
g/L)
0
5
10
15
20
25
30
35
40
Cells
(1 x
104 )
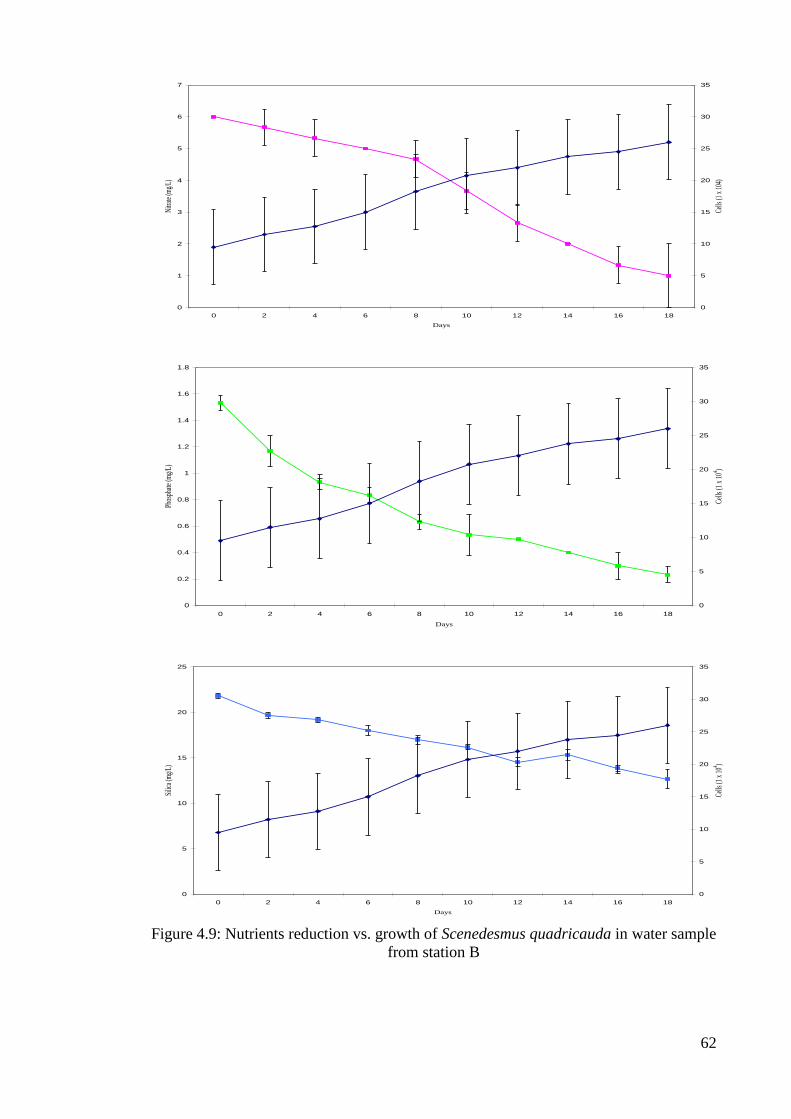
62
Figure 4.9: Nutrients reduction vs. growth of Scenedesmus quadricauda in water sample
from station B
0
1
2
3
4
5
6
7
0 2 4 6 8 10 12 14 16 18
Days
Nitr
ate
(mg/
L)
0
5
10
15
20
25
30
35
Cells
(1 x
104
)
0
0.2
0.4
0.6
0.8
1
1.2
1.4
1.6
1.8
0 2 4 6 8 10 12 14 16 18
Days
Phos
phat
e (m
g/L)
0
5
10
15
20
25
30
35
Cel
ls (1
x 1
04 )
0
5
10
15
20
25
0 2 4 6 8 10 12 14 16 18
Days
Silic
a (m
g/L)
0
5
10
15
20
25
30
35
Cells
(1 x
104 )
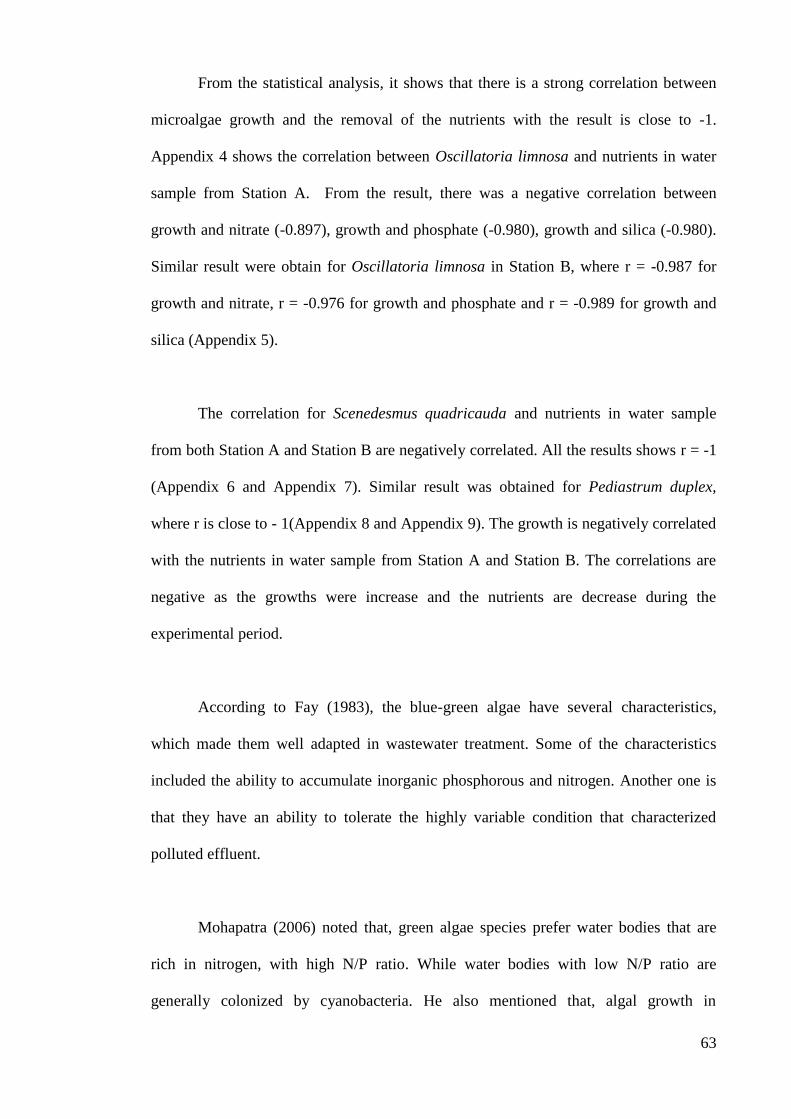
63
From the statistical analysis, it shows that there is a strong correlation between
microalgae growth and the removal of the nutrients with the result is close to -1.
Appendix 4 shows the correlation between Oscillatoria limnosa and nutrients in water
sample from Station A. From the result, there was a negative correlation between
growth and nitrate (-0.897), growth and phosphate (-0.980), growth and silica (-0.980).
Similar result were obtain for Oscillatoria limnosa in Station B, where r = -0.987 for
growth and nitrate, r = -0.976 for growth and phosphate and r = -0.989 for growth and
silica (Appendix 5).
The correlation for Scenedesmus quadricauda and nutrients in water sample
from both Station A and Station B are negatively correlated. All the results shows r = -1
(Appendix 6 and Appendix 7). Similar result was obtained for Pediastrum duplex,
where r is close to - 1(Appendix 8 and Appendix 9). The growth is negatively correlated
with the nutrients in water sample from Station A and Station B. The correlations are
negative as the growths were increase and the nutrients are decrease during the
experimental period.
According to Fay (1983), the blue-green algae have several characteristics,
which made them well adapted in wastewater treatment. Some of the characteristics
included the ability to accumulate inorganic phosphorous and nitrogen. Another one is
that they have an ability to tolerate the highly variable condition that characterized
polluted effluent.
Mohapatra (2006) noted that, green algae species prefer water bodies that are
rich in nitrogen, with high N/P ratio. While water bodies with low N/P ratio are
generally colonized by cyanobacteria. He also mentioned that, algal growth in
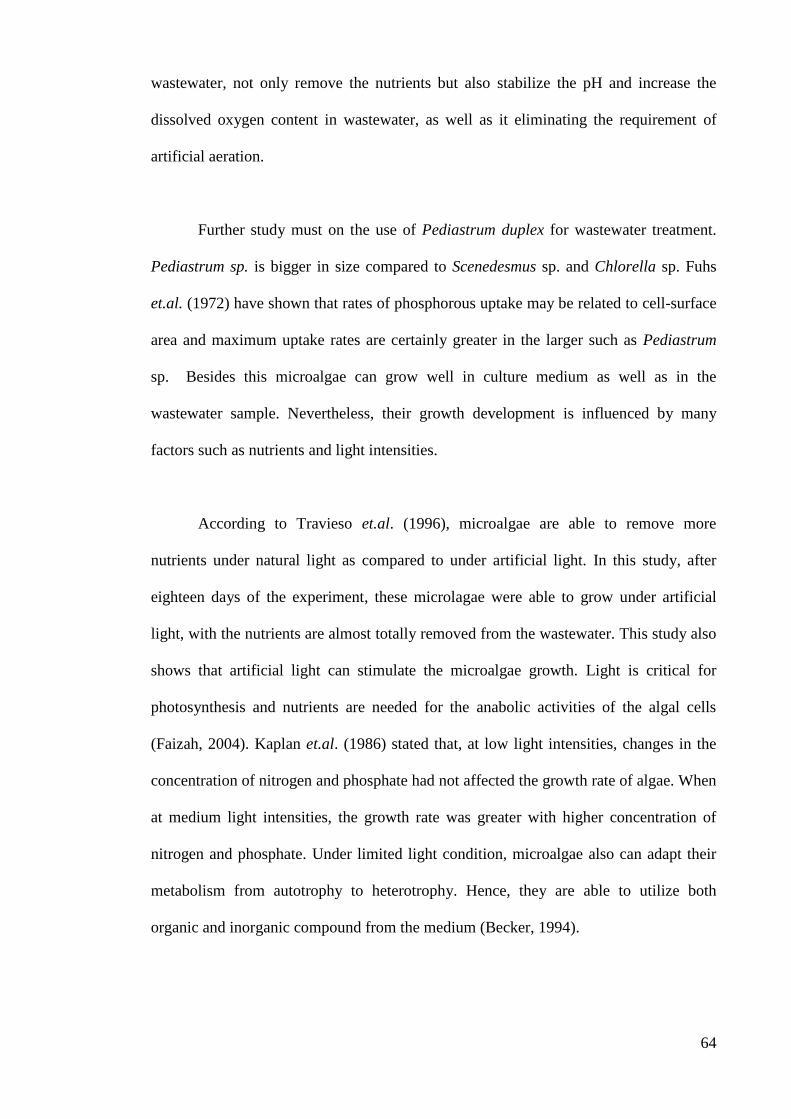
64
wastewater, not only remove the nutrients but also stabilize the pH and increase the
dissolved oxygen content in wastewater, as well as it eliminating the requirement of
artificial aeration.
Further study must on the use of Pediastrum duplex for wastewater treatment.
Pediastrum sp. is bigger in size compared to Scenedesmus sp. and Chlorella sp. Fuhs
et.al. (1972) have shown that rates of phosphorous uptake may be related to cell-surface
area and maximum uptake rates are certainly greater in the larger such as Pediastrum
sp. Besides this microalgae can grow well in culture medium as well as in the
wastewater sample. Nevertheless, their growth development is influenced by many
factors such as nutrients and light intensities.
According to Travieso et.al. (1996), microalgae are able to remove more
nutrients under natural light as compared to under artificial light. In this study, after
eighteen days of the experiment, these microlagae were able to grow under artificial
light, with the nutrients are almost totally removed from the wastewater. This study also
shows that artificial light can stimulate the microalgae growth. Light is critical for
photosynthesis and nutrients are needed for the anabolic activities of the algal cells
(Faizah, 2004). Kaplan et.al. (1986) stated that, at low light intensities, changes in the
concentration of nitrogen and phosphate had not affected the growth rate of algae. When
at medium light intensities, the growth rate was greater with higher concentration of
nitrogen and phosphate. Under limited light condition, microalgae also can adapt their
metabolism from autotrophy to heterotrophy. Hence, they are able to utilize both
organic and inorganic compound from the medium (Becker, 1994).
65
Shelef et. al. (1978) concluded that microalgae are capable of taking nitrogen
and phosphorous as their biomass. The increase in biomass yield proportionally
enhances the removal of eutrophication causing nutrients from the effluent. Other
studies revealed that the nutrient removal efficiency is related to (i) the content of
nutrients in wastewater (ii) the degree of nutrient utilized by algal growth and (iii) the
nutrient concentration in algal tissues (Matusiak et. al., 1976; Przytocka-Jusiak et.al.,
1984). Tam and Wong (1989) mentioned that, the removal of total inorganic nitrogen
from wastewater was more effective when algae were cultured in settled sewage. They
stated that the removal of nitrogen, especially NH4+-
N, from algal cultures is affected by
two factors; direct utilization of nitrogen by algae and NH3 stripping. They also added
that the removal of total inorganic nitrogen from wastewater was, more effective when
algae were cultivated in settle sewage than in activated sewage. Over 90% removal of
total inorganic nitrogen was detected in treatments with settle sewage.
66
Chapter 5
Conclusion
An eighteen day laboratory experiment on waste water samples inoculated with
different microalgae species shows:
1) 60 to 75% of the nutrients can be removed from wastewater.
2) Microalgae can grow and utilize nutrients in wastewater.
3) The growth rate of microalgae is negatively correlated with the nutrient.
4) Pediastrum duplex also has the potential to be used to remove nutrients from
wastewater.
67
References
Abdul Aziz, H. (1999a). Kejuruteraan Air Sisa: Kualiti Air dan Air Sisa. Utusan
Publication and Distribution Sdn Bhd, Universiti Sains Malaysia.
Abdul Aziz, H. (1999b). Kejuruteraan Air Sisa. Utusan Publication and Distribution
Sdn. Bhd, Universiti Sains Malaysia
Abdul Salam, M.N. (1999). Handbook 5 Water Pollution: Integrated Coastal and
Estuarine Area Management. WWF, Malaysia.
Azov, Y., Shelef, G., Moraine, R. and Levi, A. (1980). Controlling Algal Genera in
High Rate Wastewater Oxidation Pond. In: Shelef, G. and Soeder, C.J. (eds).
Algae Biomass Production and Use. Elsevier/ North-Holland Biomedical Press,
Amsterdam. p. 245.
Bagulia, A.M. (2008a). The Microalgae. In: Encyclopedia of Algae. Vol. 2. Amnol
Publication Pvt. Ltd. New Delhi, India.
Becker, E.W. (1994). Microalgae: Biotechnology and Microbiology. Cambridge
University Press, Britain.
Bold, H.C and Wynne, M.J. (1978). Introduction to The Algae Structure and
Reproductive. Prentice-Hall of India, New Delhi.
Bold, H.C. (1974). Phycology. 1947-1972. Ann. Missouri Bot. Gard. Vol (61): p. 14-44
Bowe, G. (2002). An Overview of Counting Methods of Algae. In: Palumbo, F., Zigli,
G. and André Van der Beken (eds). Detection Methods for Algae, Protozoa and
Helminths in Fresh and Drinking Water. John Wiley and Sons, Limited.
England.
Canter-Lund, H. and Lund, J.W.G. (1995). Freshwater Algae; Their Microscopic World
Explore. Bopress Ltd. United Kingdom.
Chapman, V.J. (1962). The Algae. McMillan and Co. Ltd. London.
Chapman V.J. and Chapman D.J. (1973).The Algae. MacMillan and Co. Ltd. Great
Britain.
68
Chevalier, P and de la Noüe, J. (1985). Efficiency of The Immobilized
Hyperconcentrated Algae on Ammmonia and Orthophosphate Removal from
Wastewater. Biotechnology Lett. Vol. (7) : p. 395-400.
De Bashan, L.E. and Bashan, Y. (2004). Recent Advances in Removing Phosphorus
from Wastewater and Its Future Use as Fertilizer (1997-2003). Water Research.
Vol. (38): p. 4222 – 4246.
De la Noüe, J., Laliberté, G. and Proulx, D. (1992).Algae and Wastewater. Journal of
Applied Phycology. Vol. (4): p. 247-254.
Edmondson, W.T. (1974). Book Review. Limnology Oceanography. Vol. 19: pp 369-
357.
Faizah, S. (2004).A Comparative Study of Selected Nutrients and Phytoplankton
Distribution in Tasik Taman Jaya, Petaling Jaya and Tasik Ampang, Kuala
Lumpur. M.Tech. Thesis. Institute of Postgraduate Studies and Research.
University of Malaya, Kuala Lumpur.
Fallowfield, H.J. and Garrett, M.K. (1985). Treatment of Waste by Algal Culture.
Journal of App. Bacteriol. Vol. (3) [ Symp. Suppl] : p. 187S-205S.
Fay, P. (1983). The Blue-Green. Edward Arnolds Publishers Ltd. London. p. 87.
Fogg, G.E., Stewart, W.D., Fay, P. and Walsby, A.E. (1973).The Blue-green Algae.
Academic Press, London&New York.
Fuhs, G.W., Demmerle, S.D., Canelli, E and Chen, M. (1972). Characteristic of
Phosphorous-limited Algae (with reflections on the limiting nutrients concept).
In: Likens, G,E. (ed). Nutrients and Eutrophication. Am. Soc. Limnol.
Oceanogr. Spec. Symp. Vol. (1): p. 312-321.
Gardiner, A.C. (1941). Silicon and Phosphorous as Factor Limiting Development of
Diatoms. J. Soc.Chem. Ind. London. Vol. (60): p. 73-78.
Graham, L.E. and Wilcox, L.E (2000).Algae. Prentice-Hall Inc, United State of
America.
69
Grossman, A. Manodori, A. and Snyder, D. (1990). Light-harvesting Protein of
Diatoms: Their relationship to the chlorophyll a/b binding protein of the higher
plants and their mode of transport to plastids. Mol. Gen. Genetic. Vol (224): p.
91-100.
Hall, R.I. and Smol, J.P. (1999). Diatoms as Indicator of LakeEutrophication. In:
Stoermer, E.F. and Smol, J.P. (eds). The Diatom; Application for the
Environmental and Earth Science. Cambridge University Press. United
Kingdom.
Hammouda, O., Gaber, A., and Abdel-Raouf, N. (1995). Microalgae and Wastewater
Treatment. J. Ecotoxicology and Environment Safety. Vol. (31): p. 205-210.
Hashimoto, S. and Furukawa, K. (1989). Nutrient Removal from Secondary Effluent by
Filamentous Algae. Journal of Fermentation and Bioengineering. Vol. (67) No.
1: p. 62-69.
Hayes, C.R. and Greene, L.A. (1984).The Evolution of Eutrophication Impact in Public
Water Supply Reservoirs in East Anglia. Water Pollution Control. Vol. 83: p.
45-51.
Hensen, V. (1887). Über die Bestimmung des Planktons oder des in Meere treibenden
Matierials an Pflanzen und Tieren. Bericht Deutschen wissenschaftlichen
Kommision für Meereforschung, Vol. (5): p. 1-109.
Hoffmann, J.P. (1998). Wastewater Treatment with Suspended and Nonsuspended
Algae. Journal of Phycology. Vol. (34): p.757-763.
Howarth, R.W. (1988).Nutrient Limitation of Net Primary Production in Marine
Ecosystems. Annual Review Ecology and Systematic. Vol. (19): p. 89-110.
Hutchinson, G.E. (1967). A Treatise on Limnology, Vol. 2. Introduction to LakeBiology
and The Limmoplankton. Wiley, New York.
Ismail, A. and Mohamad, A.B. (1992).Ekologi Air Tawar. Dewan Bahasa dan Pustaka,
Kuala Lumpur.
Ismail, H. (2003).Kajian Kualiti Air dan Plankton di Tasik Timah, Perlis. M.Sc. Thesis.
Institut Sains Biologi, Fakulti Sains, Universiti of Malaya. Kuala Lumpur.
70
Jackson, M.H.. Morris, G.P., Smith, O.G. and Crawford J.F. (1990).Environmental
Health Reference Book. Butterworth-Heinemann.
Jassby, A. (1988). Some Public Health Aspects of Microbial Product. In: Lembi, C.A.
and Wooland, J.R. (eds). Algae and Human Affair. Cambridge University Press,
New York. p. 181-202.
Kaplan, D., Richmond, A.E., Dubinsky, Z. and Aaronson, S. (1986). Algal Nutrition. In:
Richmond, A. (ed). CRC Handbook of Microalgal Mass Culture. CRC Press
Inc., Boca Raton, Florida, United State. p. 147.
Laliberté, G., Proulx, D., de Pauw, N. and de la Noüe, J. (1994). Algal Technology in
Wastewater Treatment. In : L.C.Rai, J.P.Gaur and C.J. Soeder (eds). Algae and
Water Pollution. Archiv. For Hydrobiology. Vol (42) : p. 283-302.
Lau, P.S., Tam, N.F.Y. and Wong Y.S. (1997). Wastewater Nutrients (N and P)
Removal by Carrageenan and Alginate Immobilized Chlorella vulgaris.
Environ. Techno. Vol. (18): p. 945-951.
Lee, R.E. (1999).Phycology (3rd
ed.). Cambridge University Press, United Kingdom.
Likens, G.E. (1972). Eutrophication and Aquatic Ecosystem. In; Likens, G.E. (ed).
Nutrient and Eutrophication : The Limiting – Nutrient Controversy. Special
Symposia, Vol. 1. America Society of Limnology and Oceanography Inc. p. 3-
13.
Likens, G.E. and Bormann, F.H. (1971).Nutrient Cycling in Ecosystem. In: Weins, J.
(ed.) Ecosystem, Structure and Function. Univ. Oregon Press (In press). p. 25-
27.
Lincoln, E.P. and Earle, J.F.K. (1990). Wastewater Treatment with Microalgae. In:
Akatsuka, I. (eds). Introduction to Applied Phycology. SBP. Academic
Publishing, Netherland.
Manson, C.F. (1981). Biology of Freshwater Pollution. Longman Inc., New York,
United State of America.
Martínez, M.E., Sánchez, S., Jiménez, J.M., El Yousfi, F. and Muńoz, L. (2000).
Nitrogen and Phosphorus Removal from Urban Wastewater by The Microalgal
Scenedesmus obliquus. Bioresource Technology. Vol. (73): p. 263-272.
71
Matusiak, K., Przytocka-Jusiak, M., Leszcynska-Gerula, K. and Horoch, M. (1976).
Studies on The Purification of Wastewater From The Nitrogen Fertilizer
Industry by Intensive Algal Cultures. II:Removal of Nitrogen From Wastewater.
Acta Microbiol Pollution Vol. (25): p. 361-374.
Metcalf and Eddy (1991).Wastewater Engineering: Treatment, Disposal and Reuse (3rd
ed). In: Tchobanaglous, T. and Burton, F. (eds). Water Resources and
Environmental EngineeringNew York, Mc Grew Hill.
Mohapatra, P.K. (2006). Textbook of Environmental Biotechnology. I.K. International
Publishing House. Pvt. Ltd. New Delhi, India.
Moss, B. (1980).Ecology of Fresh Water: Man and Medium 2nd
ed. Blackwell Scientific
Publishing.
Muttamara ,S., Puetpaiboon, U., Mara, D.D., Pearson, H.W. and Silva, S.A. (1995).
Nitrogen Removal in Baffled Waste Stabilization Ponds. Water and Science
Technol. Vol. (33): p. 173-181
Nicoll, E.H. (1988).Small Water Pollution Control Works, Design and Practice. John-
Willey and Sons.
Norhayati, D. (1995).Taburan Logam Berat di Tasik Taman Jaya. B.Sc. Thesis.
Department of Zoology, Faculty of Science, University of Malaya, Kuala
Lumpur.
Oh-Hama, T. and Miyachi, S. (1992). Chorella. In: Borowitzka, M.A. and
Borowitzka,L.J. (eds.). Micro-algae Biotechnology. Cambridge UK, Cambridge
University Press. p. 26.
Oswald, W.J. (1988a). The Role of Microalgae in Liquid Waste Treatment and
Reclaminatio. In: Lembi, C.A. and Woaland. J.R. (eds). Algae and Human
Affairs. CambridgeUniversityPress, United Kingdom. p. 255-281.
Oswald, W.J. (1988b). Micro-algae and Waste-water Treatment. In: Borowiwitzka
M.A., Borowitzka (eds), Micro-algal Biotechnology. Cambridge U.P.,
Cambridge, p. 305-328.
Oswald, W.J and Gotaas, H.B. (1957).Photosynthesis in the Sewage Treatment. Trans
Am. Soc. Civil. Eng. Vol. (122): pp. 73-105.
72
Picot, B., El Halouani, H., Casellas, C., Moersidik, S. and Bontoux, J. (1991). Nutrient
Removal by High Rate Algal Pond System in a Medditerranean Climate
(France). Water and Science Technol. Vol. (23): p. 1534-1541.
Prescott, G.W. (1969).The Algae: A Review. Thomas Nelson and Sons Ltd. London.
Prowse, G.A. and Talling, J.F. (1958). The Seasonal Growth and Sucsession of
Plankton Algae in the White Nile. Limnology and Oceanography. Vol. (3): p.
222-238.
Przytocka-Jusiak, M., Duszota, M., Matusiak, K. and Mycielki, R. (1984). Intensive
Culture of Chlorella vulgaris/AA as The Second Stage of Biological
Purification of Nitrogen Industry Wastewater. Water Resourse. Vol. (18): p. 1-7
Rai, L.C., Gaur, J.P., Kumar, H.D. (1981). Phycology and Heavy Metal Pollution. Biol.
Rev. Vol. (56): p 99-151.
Redalje, D.G., Duerr, E.O, de la Noüe, J., Mayzaud, P, Nonomura, A.M., Cassin, R.C.
(1989).Algae as Ideal Waste Removers: Biochemical Pathways. In; Huntley,
M.E. (eds), Biotreatment of Agricultural Wastewater. CRC Press, Boca Raton.
p. 91-110.
Reynolds, C.S. (1984).The Ecology of Freshwater Phytoplankton. Cambridge
University Press, Britain.
Richmond, A. (1986). Handbook of Microalgal Mass Culture. CRC Press Inc., United
State of America. pp. 528.
Rohlich, G.A. and Littormark, P.D. (1972). Wastewater Treatment and Eutrophication.
In: Likens, G.E. (eds). Nutrients and Eutrophication : The Limiting-nutrient
Controversy. Special Symposia. Vol. 1.America Society of Limnology and
Oceanography Inc. p 231-245.
Ruttner, F. (1953). Fundamentals of Limnology (Translation of Grundriss der
Limnologie by D.G. Frey & F.E.D. Fry). University of Toronto, Toronto.
Salleh, A. (1996).Panduan Mengenali Alga Air Tawar. Dewan Bahasa dan Pustaka,
Kuala Lumpur.
73
Saravanamuthu, J. (1977). Primary Production and Seasonal Dynamic of
Phytoplankton in a Eutrophicated Pond, Taman Jaya, Petaling Jaya. B.Sc.
Thesis. Department of Zoology, Faculty of Science, University of Malaya, Kuala
Lumpur.
Scragg, A. (2005).Environmental Biotechnology (2nd
ed.) Oxford University Press Inc.,
New York. United States.
Sharma, O.P. (1986). Textbook of Algae. Tata McGraw-Hill, New Delhi, India.
Shelef, G., Moraine, R. and Oron, G. (1978). Photosynthetic Biomass Production from
Sewage. Ergebn. Limnol. Vol. (2): p. 3-14.
Shelef, G., Azov, Y., Moraine, R. and Oron, G. (1980). Algal Mass Reclamation
System. In: Shelef, G. and Soeder, C.J. (eds). Algae Biomass Production and
Use. Elsevier / North –Holland Biomedical Press, Amsterdam. p. 163-189.
Shushu, D.D. and Chipeta, P. (2002). Secondary Wastewater Treatment by Microalgae
Isolated from Gaborone Oxidation Ponds. Botswana Journal of Technology. p.
39-43.
Smitt, G.M. (1955).Textbook of Environmental Biotechnology. I.K International
Publishing House Pvt. Ltd., New Delhi, India.
Stein, J.R. (1973).Handbook of Phycological Methods: Culture Methods and Growth
Measurements. Cambridge University Press, United State of America.
Sze, P. (1998).A Biology of the Algae (3rd
ed.). McGraw-Hill. United State of America.
Tam, N.F.Y and Wong, Y.S (1989). Wastewater Nutrient Removal by Chlorella
pyrenoidosa and Scenedesmus sp. Environmental Pollution. Vol. (58): p. 19-34.
Tang, S.H. (2001). Diversity and Abundance of Phytoplankton in Tasek Bera, Pahang.
M. Tech. Thesis. Institute of Postgraduate Studies and Research. University of
Malaya, Kuala Lumpur.
Tchobanoglous, G. and Burton, F.L. (1991). Wastewater Engineering: Treatment,
Disposal and Reuse (3rd
ed.). McGraw Hill Series. In: Water Resources and
Environmental Engineering, McGraw Hill, New York. p. 1334.
74
Tilman, D., Kiesling, R., Sterner, R., Kilham, S.S. and Johnson, F.A. (1986). Green,
Blue-green and Diatom Algae: Taxonomic Differences in Competitive Ability
for Phosphate, Silicon and Nitrogen. Archive für Hydrobiologie Beiheft
Ergebnisse der Limnologie (eds). p 106.
Trainor, F.R. (1978). Introduction of Phycology. John Wiley & sons Inc., United State
of America.
Travieso, L., Benitez, F., Weiland, P., Sãnchez, E, Dupeyrón, R. and Domiguez, A.R.
(1996).Experiments on Immobilization of Microalgae for Nutrient Removal in
Wastewater Treatments. Bioresource Technology. Vol. (55): p. 181-186.
Van de Hoek, C., Mann, D.G. and Jahns, H.M. (1995).Algae; an Introduction
Phycology. Cambridge University Press, United Kingdom.
Vaughn, J.E. (1961).Coagulation Difficulties of the South District Filtration Plant. Pure
Water. Vol. (13) : p. 42-49.
Webster, K.E., Kratz, T.K, Bowser, C.J. and Magnussion, J.J. (1996). The Influence of
Landscape Position and Lake Chemical Response to Drought in Northern
Wisconsin. Limnology and Oceanography. Vol. 41: pp 977-984.
Wright, R.T. (2005). Environmental Science (9th
ed.) Pearson Prentice Hall. United
State of America.
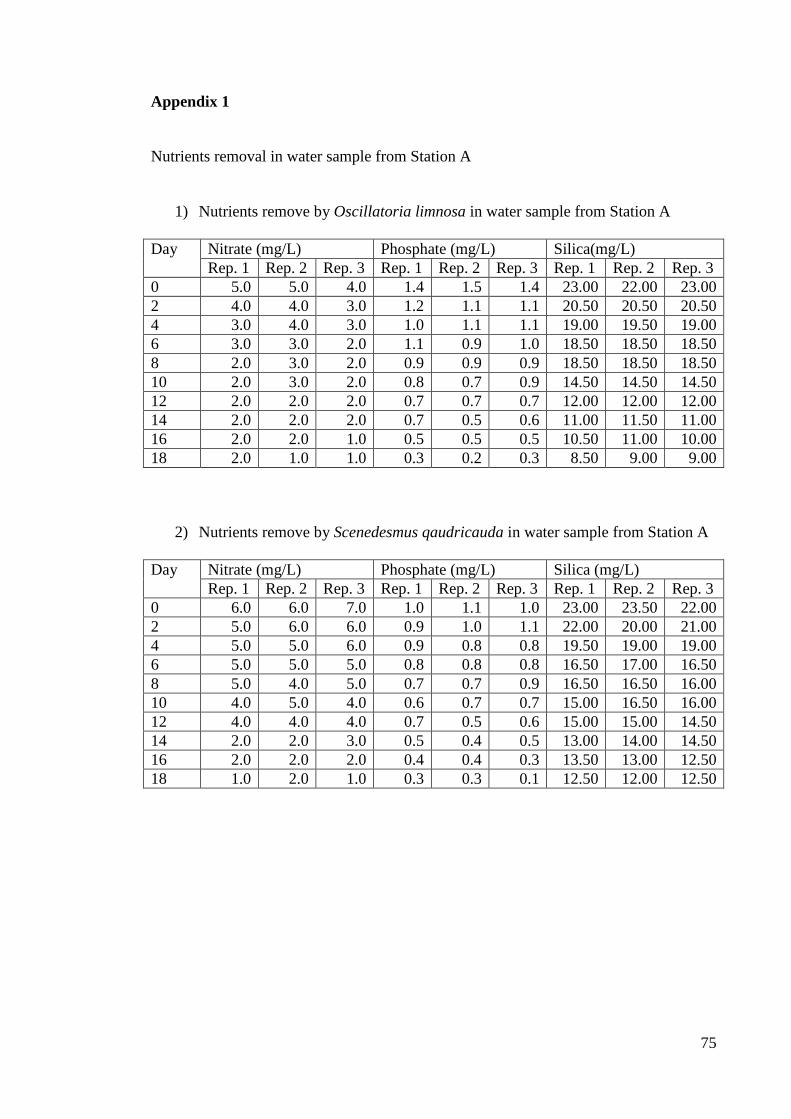
75
Appendix 1
Nutrients removal in water sample from Station A
1) Nutrients remove by Oscillatoria limnosa in water sample from Station A
Day Nitrate (mg/L) Phosphate (mg/L) Silica(mg/L)
Rep. 1 Rep. 2 Rep. 3 Rep. 1 Rep. 2 Rep. 3 Rep. 1 Rep. 2 Rep. 3
0 5.0 5.0 4.0 1.4 1.5 1.4 23.00 22.00 23.00
2 4.0 4.0 3.0 1.2 1.1 1.1 20.50 20.50 20.50
4 3.0 4.0 3.0 1.0 1.1 1.1 19.00 19.50 19.00
6 3.0 3.0 2.0 1.1 0.9 1.0 18.50 18.50 18.50
8 2.0 3.0 2.0 0.9 0.9 0.9 18.50 18.50 18.50
10 2.0 3.0 2.0 0.8 0.7 0.9 14.50 14.50 14.50
12 2.0 2.0 2.0 0.7 0.7 0.7 12.00 12.00 12.00
14 2.0 2.0 2.0 0.7 0.5 0.6 11.00 11.50 11.00
16 2.0 2.0 1.0 0.5 0.5 0.5 10.50 11.00 10.00
18 2.0 1.0 1.0 0.3 0.2 0.3 8.50 9.00 9.00
2) Nutrients remove by Scenedesmus qaudricauda in water sample from Station A
Day Nitrate (mg/L) Phosphate (mg/L) Silica (mg/L)
Rep. 1 Rep. 2 Rep. 3 Rep. 1 Rep. 2 Rep. 3 Rep. 1 Rep. 2 Rep. 3
0 6.0 6.0 7.0 1.0 1.1 1.0 23.00 23.50 22.00
2 5.0 6.0 6.0 0.9 1.0 1.1 22.00 20.00 21.00
4 5.0 5.0 6.0 0.9 0.8 0.8 19.50 19.00 19.00
6 5.0 5.0 5.0 0.8 0.8 0.8 16.50 17.00 16.50
8 5.0 4.0 5.0 0.7 0.7 0.9 16.50 16.50 16.00
10 4.0 5.0 4.0 0.6 0.7 0.7 15.00 16.50 16.00
12 4.0 4.0 4.0 0.7 0.5 0.6 15.00 15.00 14.50
14 2.0 2.0 3.0 0.5 0.4 0.5 13.00 14.00 14.50
16 2.0 2.0 2.0 0.4 0.4 0.3 13.50 13.00 12.50
18 1.0 2.0 1.0 0.3 0.3 0.1 12.50 12.00 12.50
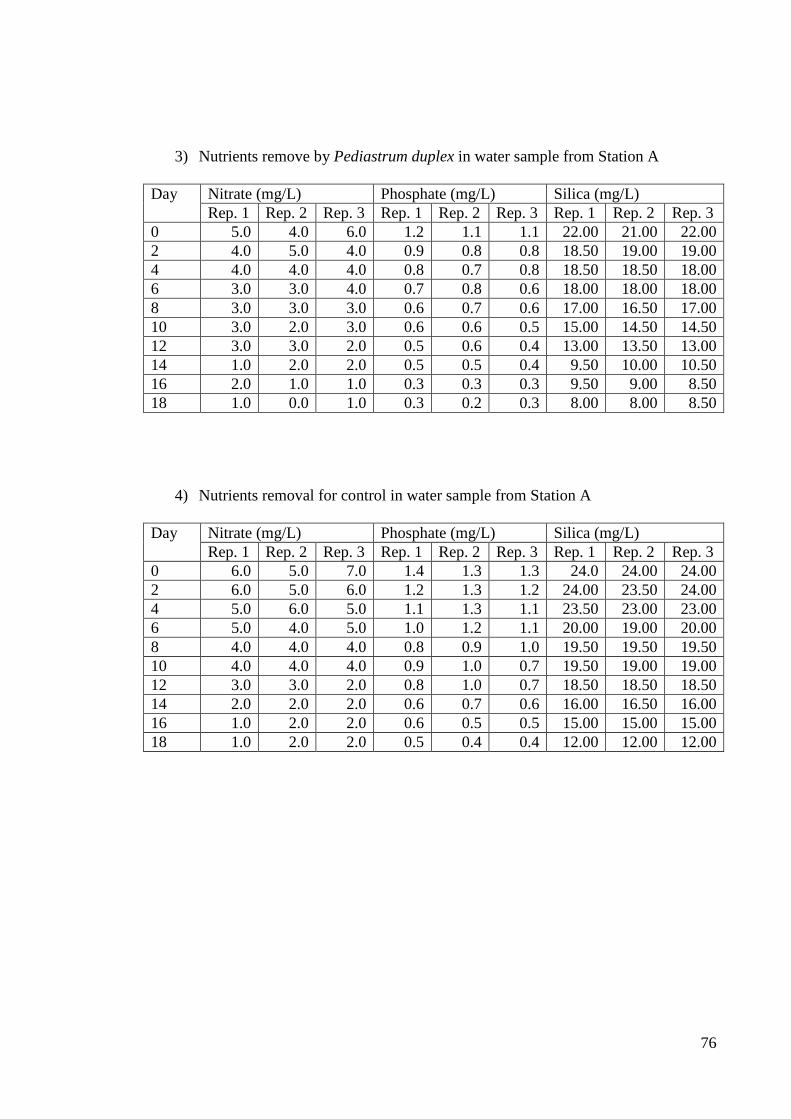
76
3) Nutrients remove by Pediastrum duplex in water sample from Station A
Day Nitrate (mg/L) Phosphate (mg/L) Silica (mg/L)
Rep. 1 Rep. 2 Rep. 3 Rep. 1 Rep. 2 Rep. 3 Rep. 1 Rep. 2 Rep. 3
0 5.0 4.0 6.0 1.2 1.1 1.1 22.00 21.00 22.00
2 4.0 5.0 4.0 0.9 0.8 0.8 18.50 19.00 19.00
4 4.0 4.0 4.0 0.8 0.7 0.8 18.50 18.50 18.00
6 3.0 3.0 4.0 0.7 0.8 0.6 18.00 18.00 18.00
8 3.0 3.0 3.0 0.6 0.7 0.6 17.00 16.50 17.00
10 3.0 2.0 3.0 0.6 0.6 0.5 15.00 14.50 14.50
12 3.0 3.0 2.0 0.5 0.6 0.4 13.00 13.50 13.00
14 1.0 2.0 2.0 0.5 0.5 0.4 9.50 10.00 10.50
16 2.0 1.0 1.0 0.3 0.3 0.3 9.50 9.00 8.50
18 1.0 0.0 1.0 0.3 0.2 0.3 8.00 8.00 8.50
4) Nutrients removal for control in water sample from Station A
Day Nitrate (mg/L) Phosphate (mg/L) Silica (mg/L)
Rep. 1 Rep. 2 Rep. 3 Rep. 1 Rep. 2 Rep. 3 Rep. 1 Rep. 2 Rep. 3
0 6.0 5.0 7.0 1.4 1.3 1.3 24.0 24.00 24.00
2 6.0 5.0 6.0 1.2 1.3 1.2 24.00 23.50 24.00
4 5.0 6.0 5.0 1.1 1.3 1.1 23.50 23.00 23.00
6 5.0 4.0 5.0 1.0 1.2 1.1 20.00 19.00 20.00
8 4.0 4.0 4.0 0.8 0.9 1.0 19.50 19.50 19.50
10 4.0 4.0 4.0 0.9 1.0 0.7 19.50 19.00 19.00
12 3.0 3.0 2.0 0.8 1.0 0.7 18.50 18.50 18.50
14 2.0 2.0 2.0 0.6 0.7 0.6 16.00 16.50 16.00
16 1.0 2.0 2.0 0.6 0.5 0.5 15.00 15.00 15.00
18 1.0 2.0 2.0 0.5 0.4 0.4 12.00 12.00 12.00
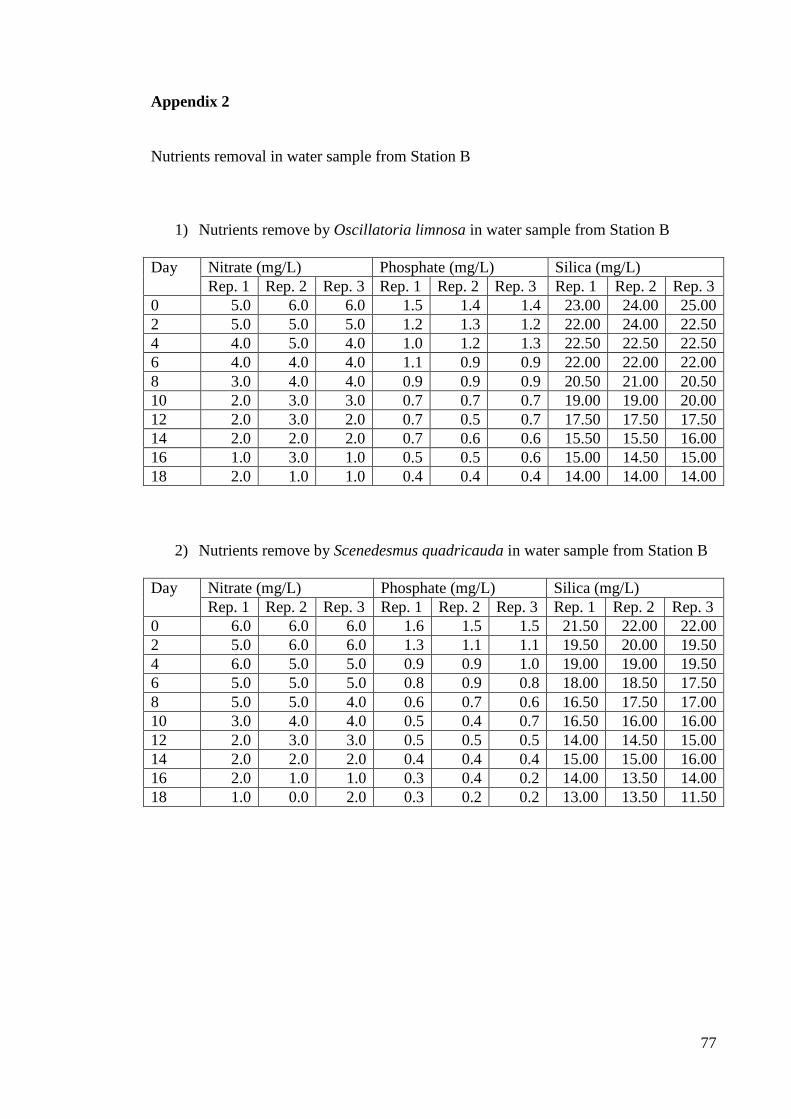
77
Appendix 2
Nutrients removal in water sample from Station B
1) Nutrients remove by Oscillatoria limnosa in water sample from Station B
Day Nitrate (mg/L) Phosphate (mg/L) Silica (mg/L)
Rep. 1 Rep. 2 Rep. 3 Rep. 1 Rep. 2 Rep. 3 Rep. 1 Rep. 2 Rep. 3
0 5.0 6.0 6.0 1.5 1.4 1.4 23.00 24.00 25.00
2 5.0 5.0 5.0 1.2 1.3 1.2 22.00 24.00 22.50
4 4.0 5.0 4.0 1.0 1.2 1.3 22.50 22.50 22.50
6 4.0 4.0 4.0 1.1 0.9 0.9 22.00 22.00 22.00
8 3.0 4.0 4.0 0.9 0.9 0.9 20.50 21.00 20.50
10 2.0 3.0 3.0 0.7 0.7 0.7 19.00 19.00 20.00
12 2.0 3.0 2.0 0.7 0.5 0.7 17.50 17.50 17.50
14 2.0 2.0 2.0 0.7 0.6 0.6 15.50 15.50 16.00
16 1.0 3.0 1.0 0.5 0.5 0.6 15.00 14.50 15.00
18 2.0 1.0 1.0 0.4 0.4 0.4 14.00 14.00 14.00
2) Nutrients remove by Scenedesmus quadricauda in water sample from Station B
Day Nitrate (mg/L) Phosphate (mg/L) Silica (mg/L)
Rep. 1 Rep. 2 Rep. 3 Rep. 1 Rep. 2 Rep. 3 Rep. 1 Rep. 2 Rep. 3
0 6.0 6.0 6.0 1.6 1.5 1.5 21.50 22.00 22.00
2 5.0 6.0 6.0 1.3 1.1 1.1 19.50 20.00 19.50
4 6.0 5.0 5.0 0.9 0.9 1.0 19.00 19.00 19.50
6 5.0 5.0 5.0 0.8 0.9 0.8 18.00 18.50 17.50
8 5.0 5.0 4.0 0.6 0.7 0.6 16.50 17.50 17.00
10 3.0 4.0 4.0 0.5 0.4 0.7 16.50 16.00 16.00
12 2.0 3.0 3.0 0.5 0.5 0.5 14.00 14.50 15.00
14 2.0 2.0 2.0 0.4 0.4 0.4 15.00 15.00 16.00
16 2.0 1.0 1.0 0.3 0.4 0.2 14.00 13.50 14.00
18 1.0 0.0 2.0 0.3 0.2 0.2 13.00 13.50 11.50
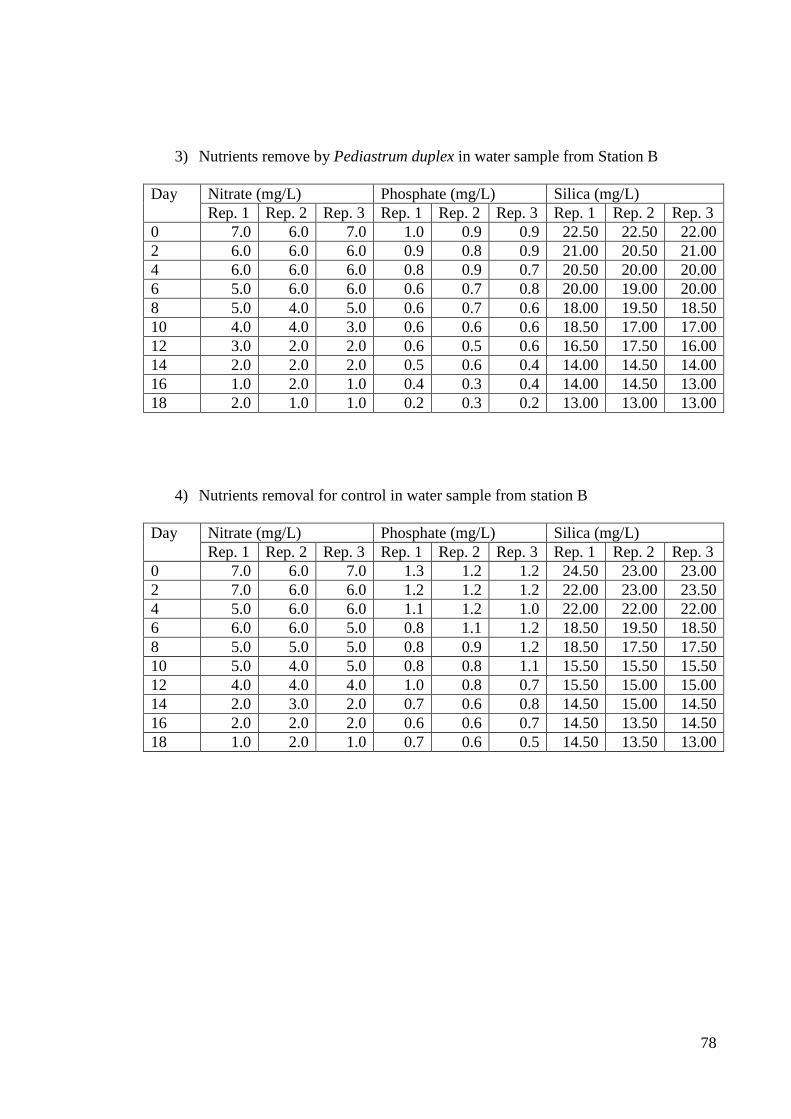
78
3) Nutrients remove by Pediastrum duplex in water sample from Station B
Day Nitrate (mg/L) Phosphate (mg/L) Silica (mg/L)
Rep. 1 Rep. 2 Rep. 3 Rep. 1 Rep. 2 Rep. 3 Rep. 1 Rep. 2 Rep. 3
0 7.0 6.0 7.0 1.0 0.9 0.9 22.50 22.50 22.00
2 6.0 6.0 6.0 0.9 0.8 0.9 21.00 20.50 21.00
4 6.0 6.0 6.0 0.8 0.9 0.7 20.50 20.00 20.00
6 5.0 6.0 6.0 0.6 0.7 0.8 20.00 19.00 20.00
8 5.0 4.0 5.0 0.6 0.7 0.6 18.00 19.50 18.50
10 4.0 4.0 3.0 0.6 0.6 0.6 18.50 17.00 17.00
12 3.0 2.0 2.0 0.6 0.5 0.6 16.50 17.50 16.00
14 2.0 2.0 2.0 0.5 0.6 0.4 14.00 14.50 14.00
16 1.0 2.0 1.0 0.4 0.3 0.4 14.00 14.50 13.00
18 2.0 1.0 1.0 0.2 0.3 0.2 13.00 13.00 13.00
4) Nutrients removal for control in water sample from station B
Day Nitrate (mg/L) Phosphate (mg/L) Silica (mg/L)
Rep. 1 Rep. 2 Rep. 3 Rep. 1 Rep. 2 Rep. 3 Rep. 1 Rep. 2 Rep. 3
0 7.0 6.0 7.0 1.3 1.2 1.2 24.50 23.00 23.00
2 7.0 6.0 6.0 1.2 1.2 1.2 22.00 23.00 23.50
4 5.0 6.0 6.0 1.1 1.2 1.0 22.00 22.00 22.00
6 6.0 6.0 5.0 0.8 1.1 1.2 18.50 19.50 18.50
8 5.0 5.0 5.0 0.8 0.9 1.2 18.50 17.50 17.50
10 5.0 4.0 5.0 0.8 0.8 1.1 15.50 15.50 15.50
12 4.0 4.0 4.0 1.0 0.8 0.7 15.50 15.00 15.00
14 2.0 3.0 2.0 0.7 0.6 0.8 14.50 15.00 14.50
16 2.0 2.0 2.0 0.6 0.6 0.7 14.50 13.50 14.50
18 1.0 2.0 1.0 0.7 0.6 0.5 14.50 13.50 13.00
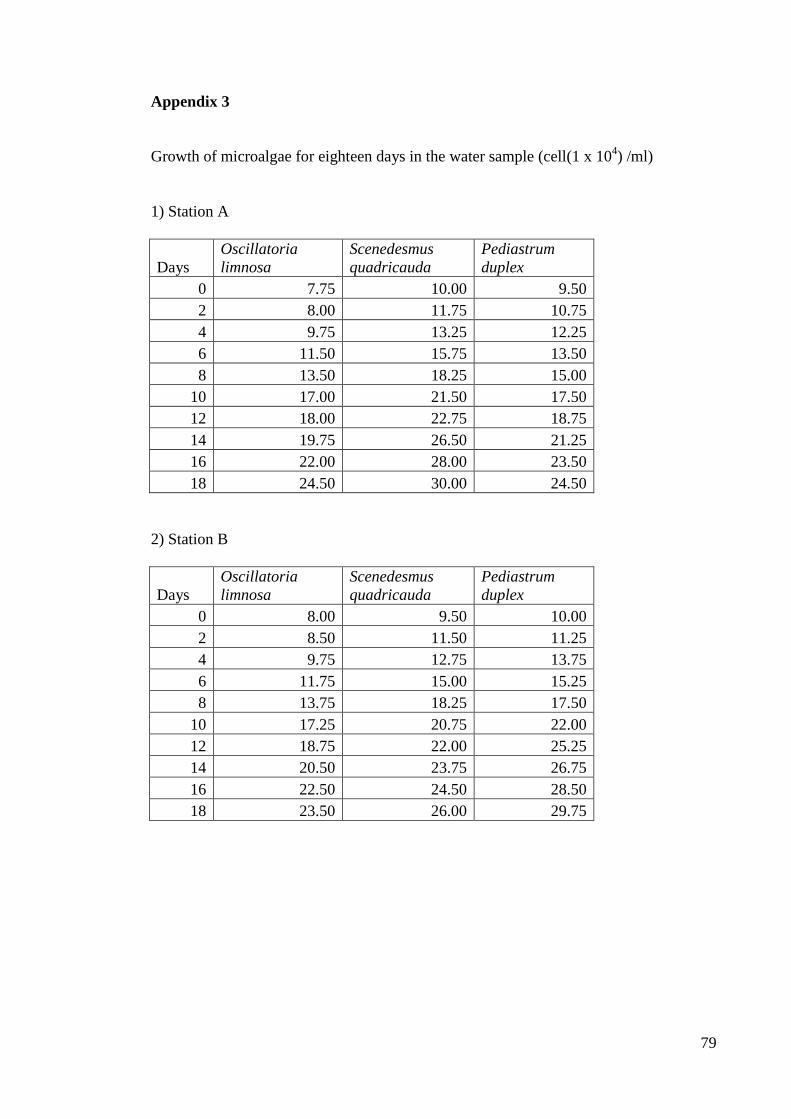
79
Appendix 3
Growth of microalgae for eighteen days in the water sample (cell(1 x 10⁴) /ml)
1) Station A
Days
Oscillatoria
limnosa
Scenedesmus
quadricauda
Pediastrum
duplex
0 7.75 10.00 9.50
2 8.00 11.75 10.75
4 9.75 13.25 12.25
6 11.50 15.75 13.50
8 13.50 18.25 15.00
10 17.00 21.50 17.50
12 18.00 22.75 18.75
14 19.75 26.50 21.25
16 22.00 28.00 23.50
18 24.50 30.00 24.50
2) Station B
Days
Oscillatoria
limnosa
Scenedesmus
quadricauda
Pediastrum
duplex
0 8.00 9.50 10.00
2 8.50 11.50 11.25
4 9.75 12.75 13.75
6 11.75 15.00 15.25
8 13.75 18.25 17.50
10 17.25 20.75 22.00
12 18.75 22.00 25.25
14 20.50 23.75 26.75
16 22.50 24.50 28.50
18 23.50 26.00 29.75
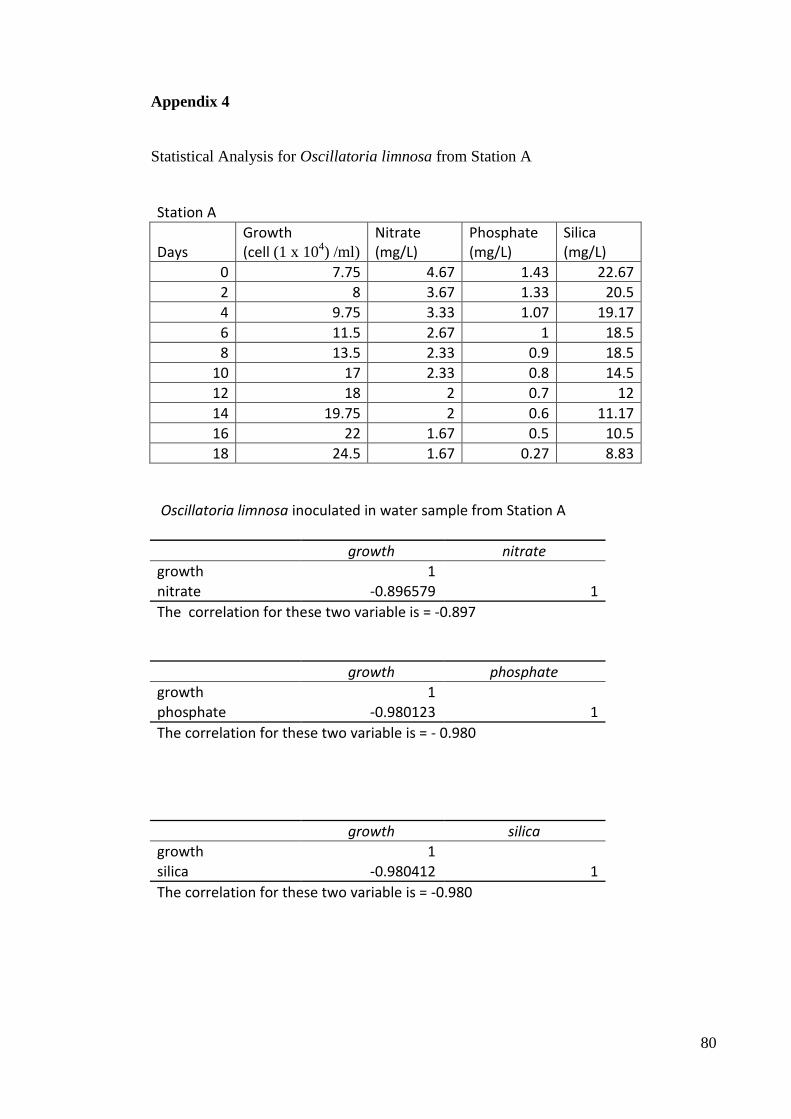
80
Appendix 4
Statistical Analysis for Oscillatoria limnosa from Station A
Station A
Days Growth (cell (1 x 10
4) /ml)
Nitrate (mg/L)
Phosphate (mg/L)
Silica (mg/L)
0 7.75 4.67 1.43 22.67
2 8 3.67 1.33 20.5
4 9.75 3.33 1.07 19.17
6 11.5 2.67 1 18.5
8 13.5 2.33 0.9 18.5
10 17 2.33 0.8 14.5
12 18 2 0.7 12
14 19.75 2 0.6 11.17
16 22 1.67 0.5 10.5
18 24.5 1.67 0.27 8.83
Oscillatoria limnosa inoculated in water sample from Station A
growth nitrate growth 1
nitrate -0.896579 1 The correlation for these two variable is = -0.897
growth phosphate
growth 1 phosphate -0.980123 1
The correlation for these two variable is = - 0.980
growth silica growth 1
silica -0.980412 1 The correlation for these two variable is = -0.980

81
Appendix 5
Statistical Analysis for Oscillatoria limnosa from Station B
Station B
Days Growth (cell (1 x 10
4) /ml)
Nitrate (mg/L)
Phosphate (mg/L)
Silica (mg/L)
0 8 5.67 1.43 24
2 8.5 5 1.23 22.83
4 9.75 4.33 1.17 22.5
6 11.75 4 0.97 22
8 13.75 3.67 0.9 20.67
10 17.25 2.67 0.7 19.33
12 18.75 2.33 0.63 17.5
14 20.5 2 0.63 15.67
16 22.5 1.67 0.53 14.83
18 23.5 1.33 0.4 14
Oscillatoria limnosa inoculated in water sample from Station B
growth nitrate growth 1
nitrate -0.98656 1 The correlation for these two variable is = - 0.987
growth phosphate
growth 1 phosphate -0.97586 1
The correlation for these two variable is = -0.976
growth silica
growth 1 silica -0.98852 1
The correlation for these two variable is = -0.989
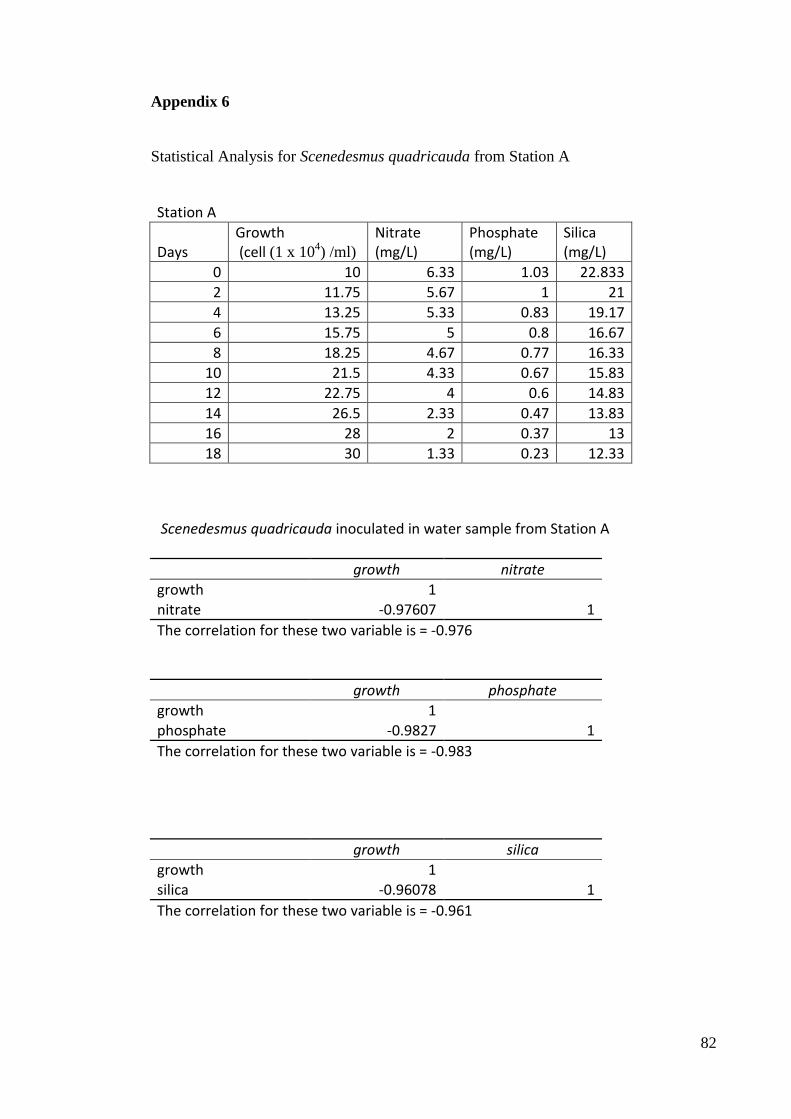
82
Appendix 6
Statistical Analysis for Scenedesmus quadricauda from Station A
Station A
Days Growth (cell (1 x 10
4) /ml)
Nitrate (mg/L)
Phosphate (mg/L)
Silica (mg/L)
0 10 6.33 1.03 22.833
2 11.75 5.67 1 21
4 13.25 5.33 0.83 19.17
6 15.75 5 0.8 16.67
8 18.25 4.67 0.77 16.33
10 21.5 4.33 0.67 15.83
12 22.75 4 0.6 14.83
14 26.5 2.33 0.47 13.83
16 28 2 0.37 13
18 30 1.33 0.23 12.33
Scenedesmus quadricauda inoculated in water sample from Station A
growth nitrate growth 1
nitrate -0.97607 1 The correlation for these two variable is = -0.976
growth phosphate
growth 1 phosphate -0.9827 1
The correlation for these two variable is = -0.983
growth silica growth 1
silica -0.96078 1 The correlation for these two variable is = -0.961
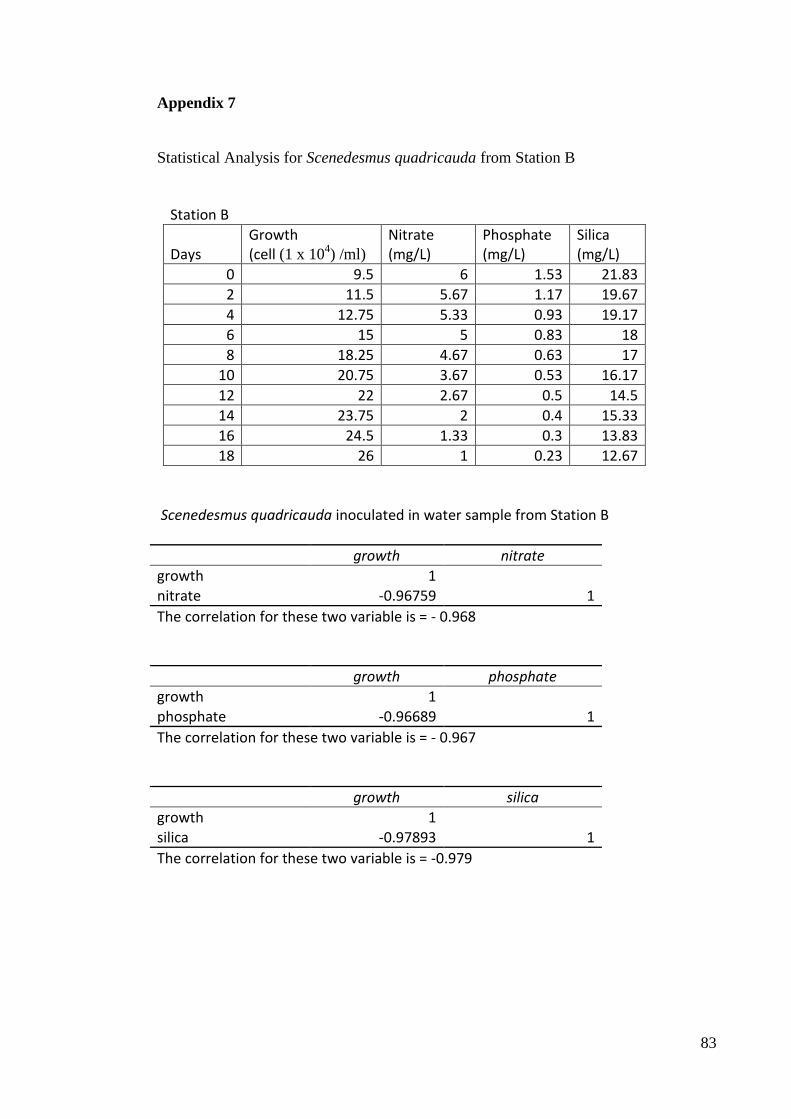
83
Appendix 7
Statistical Analysis for Scenedesmus quadricauda from Station B
Station B
Days Growth (cell (1 x 10
4) /ml)
Nitrate (mg/L)
Phosphate (mg/L)
Silica (mg/L)
0 9.5 6 1.53 21.83
2 11.5 5.67 1.17 19.67
4 12.75 5.33 0.93 19.17
6 15 5 0.83 18
8 18.25 4.67 0.63 17
10 20.75 3.67 0.53 16.17
12 22 2.67 0.5 14.5
14 23.75 2 0.4 15.33
16 24.5 1.33 0.3 13.83
18 26 1 0.23 12.67
Scenedesmus quadricauda inoculated in water sample from Station B
growth nitrate growth 1
nitrate -0.96759 1 The correlation for these two variable is = - 0.968
growth phosphate
growth 1 phosphate -0.96689 1
The correlation for these two variable is = - 0.967
growth silica
growth 1 silica -0.97893 1
The correlation for these two variable is = -0.979
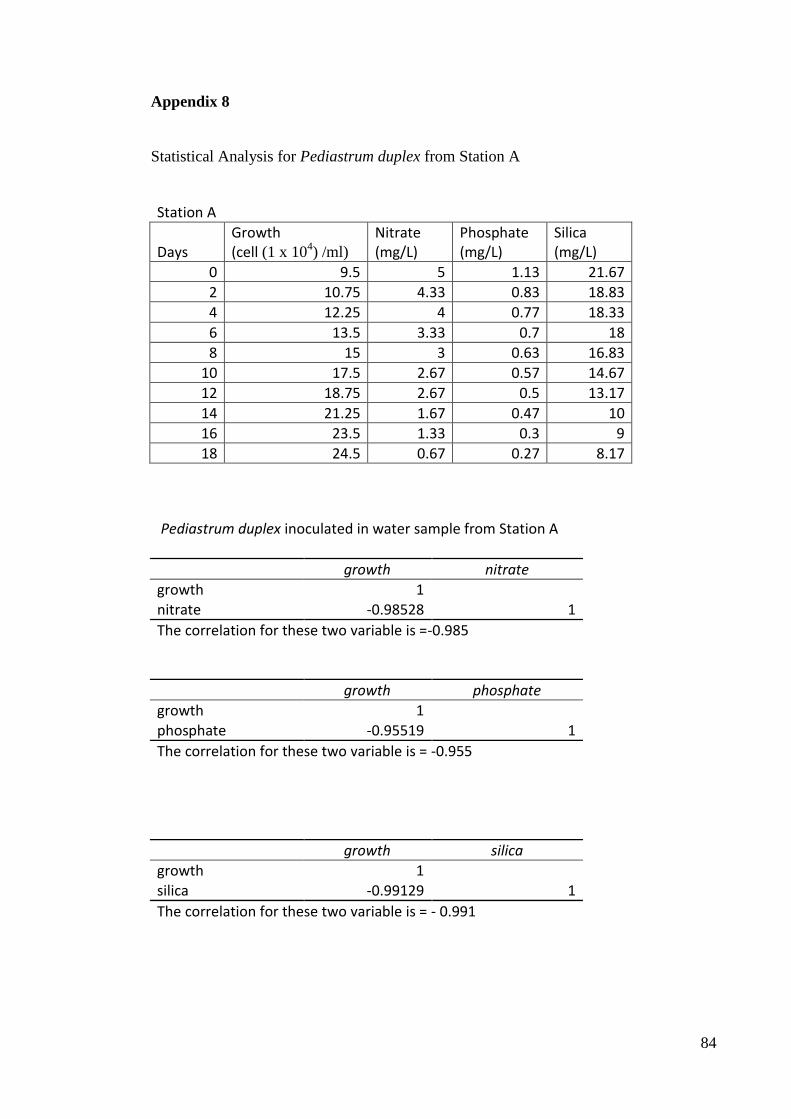
84
Appendix 8
Statistical Analysis for Pediastrum duplex from Station A
Station A
Days Growth (cell (1 x 10
4) /ml)
Nitrate (mg/L)
Phosphate (mg/L)
Silica (mg/L)
0 9.5 5 1.13 21.67
2 10.75 4.33 0.83 18.83
4 12.25 4 0.77 18.33
6 13.5 3.33 0.7 18
8 15 3 0.63 16.83
10 17.5 2.67 0.57 14.67
12 18.75 2.67 0.5 13.17
14 21.25 1.67 0.47 10
16 23.5 1.33 0.3 9
18 24.5 0.67 0.27 8.17
Pediastrum duplex inoculated in water sample from Station A
growth nitrate growth 1
nitrate -0.98528 1 The correlation for these two variable is =-0.985
growth phosphate
growth 1 phosphate -0.95519 1
The correlation for these two variable is = -0.955
growth silica
growth 1 silica -0.99129 1
The correlation for these two variable is = - 0.991
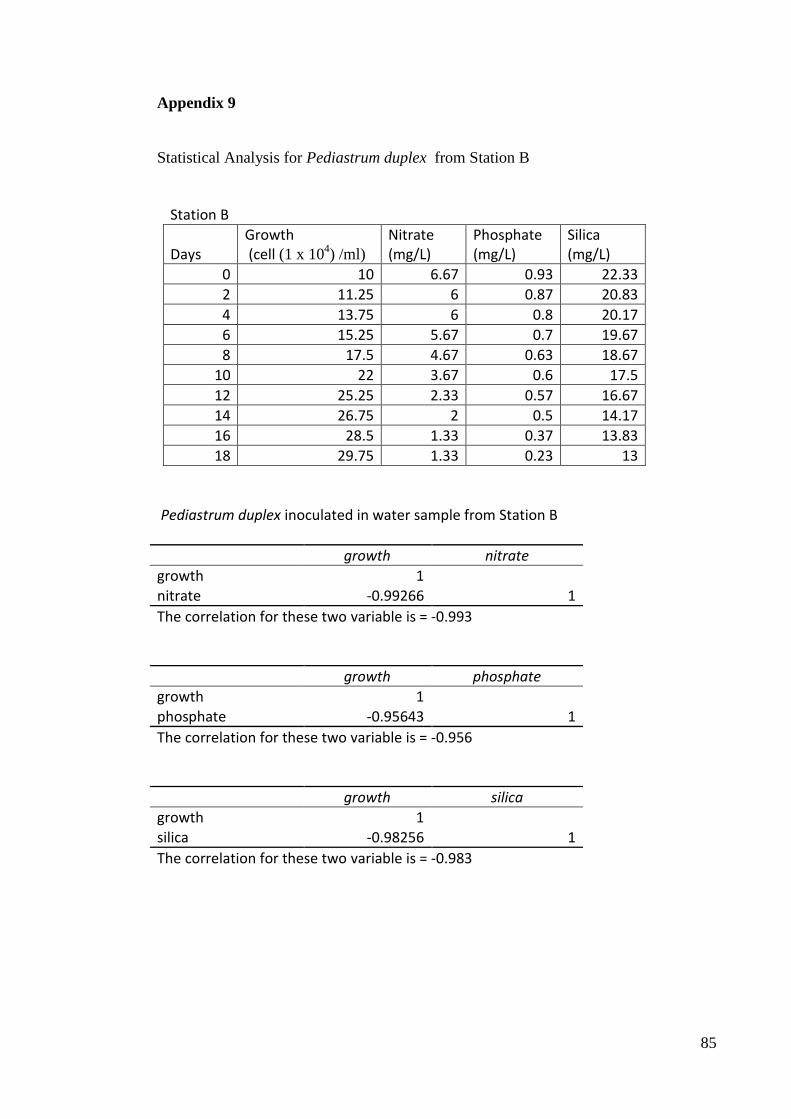
85
Appendix 9
Statistical Analysis for Pediastrum duplex from Station B
Station B
Days Growth (cell (1 x 10
4) /ml)
Nitrate (mg/L)
Phosphate (mg/L)
Silica (mg/L)
0 10 6.67 0.93 22.33
2 11.25 6 0.87 20.83
4 13.75 6 0.8 20.17
6 15.25 5.67 0.7 19.67
8 17.5 4.67 0.63 18.67
10 22 3.67 0.6 17.5
12 25.25 2.33 0.57 16.67
14 26.75 2 0.5 14.17
16 28.5 1.33 0.37 13.83
18 29.75 1.33 0.23 13
Pediastrum duplex inoculated in water sample from Station B
growth nitrate growth 1
nitrate -0.99266 1 The correlation for these two variable is = -0.993
growth phosphate
growth 1 phosphate -0.95643 1
The correlation for these two variable is = -0.956
growth silica
growth 1 silica -0.98256 1
The correlation for these two variable is = -0.983