Embed Size (px)
Citation preview
16.1 Definition
Food should be stable and must be safe. These requirements mean that the products mustnot endanger the health of the consumer with micro-organisms or their toxins, ordeteriorate owing to enzymic or microbial activity, at any stage from production throughstorage and retail to consumption. Factors determining microbial deterioration may bedifferentiated as intrinsic factors, process factors and extrinsic factors. Intrinsic factorsinclude water activity aw, pH value and redox potential Eh, and extrinsic factors covertemperature and humidity as well as atmospheric influences and partial pressures of gasesduring food storage. The techniques in food technology that affect shelf life by alteringthe conditions for microbial growth in the product are described as process factors. Thecontrol points critical for production can be deduced by analysing the hygienic risks of afood. Then measurements of the critical variables can be taken as part of process control,compared with standard levels and corrected where necessary. This concept of processcontrol is known as Hazard Analysis and Critical Control Point (HACCP) (Kaufmann andSchaffner 1974; Bonberg and David 1977; Bryan 1980; Brown 2000; Directive 93/43/EEC).
For food, there are several factors that have a bearing upon any assessment ofmicrobiological stability, and thus upon the shelf life and safety of a product. Wateractivity aw is a particularly important parameter for risk analysis as defined by theHACCP concept, as are the pH value, the F0 value and the redox potential (see Section1.2). These intrinsic factors of a food can be measured more or less accurately. Of thephysical parameters, the pH value, the redox potential value (Rodel and Scheuer 1999a,b;2000a,b) and the water activity of food may be reliably determined; equipment suitablefor measuring the aw level has been developed in recent years. As a consequence, theconcept of water activity with all its significance has become ever more widelyestablished in research and especially in industrial applications (Giese 1997).
Water is essential for the growth and metabolic activity of micro-organisms. But notall of the water present in food is in fact available for the biological activity of micro-organisms or for other chemical and enzyme reactions. The concept of ‘water activity’
16
Water activity and its measurement in foodW. Rodel, Federal Centre for Meat Research, Kulmbach
(Scott 1957) has generally been accepted as a parameter for the concentration conditionsin the aqueous part of food. The water activity is defined as the ratio
aw � p�p0
where p represents the actual partial pressure of water vapour and p0 the maximumpossible water vapour pressure of pure water (saturation pressure) at the sametemperature. The aw level is therefore dimensionless; pure water has a level of 1.0,and a completely water-free substance has a level of 0.0. The relationship between theequilibrium relative humidity (ERH) in a food and the water activity is
aw 100 � ERH
The aw level is expressed as a fraction of 1, the equilibrium relative humidity as apercentage.
16.2 Significance of water activity
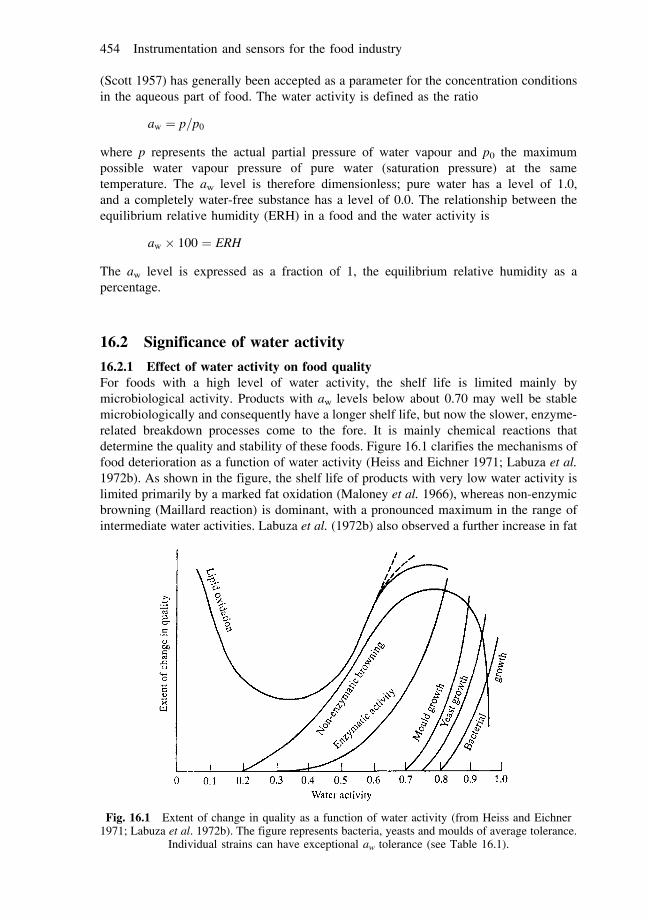
16.2.1 Effect of water activity on food qualityFor foods with a high level of water activity, the shelf life is limited mainly bymicrobiological activity. Products with aw levels below about 0.70 may well be stablemicrobiologically and consequently have a longer shelf life, but now the slower, enzyme-related breakdown processes come to the fore. It is mainly chemical reactions thatdetermine the quality and stability of these foods. Figure 16.1 clarifies the mechanisms offood deterioration as a function of water activity (Heiss and Eichner 1971; Labuza et al.1972b). As shown in the figure, the shelf life of products with very low water activity islimited primarily by a marked fat oxidation (Maloney et al. 1966), whereas non-enzymicbrowning (Maillard reaction) is dominant, with a pronounced maximum in the range ofintermediate water activities. Labuza et al. (1972b) also observed a further increase in fat
Fig. 16.1 Extent of change in quality as a function of water activity (from Heiss and Eichner1971; Labuza et al. 1972b). The figure represents bacteria, yeasts and moulds of average tolerance.
Individual strains can have exceptional aw tolerance (see Table 16.1).
454 Instrumentation and sensors for the food industry
oxidation in certain cases within this intermediate range. In foods with even higher aw
levels, the rate of reaction of enzyme-catalysed oxidation and hydrolysis also increases(Hunter et al. 1951; Acker 1962; Acker and Huber 1970), as there is now enough wateravailable to transport the substrate to the enzyme. For water activities over 0.70, changesin the food are mainly caused by the growth of micro-organisms (bacteria, yeasts andmoulds).
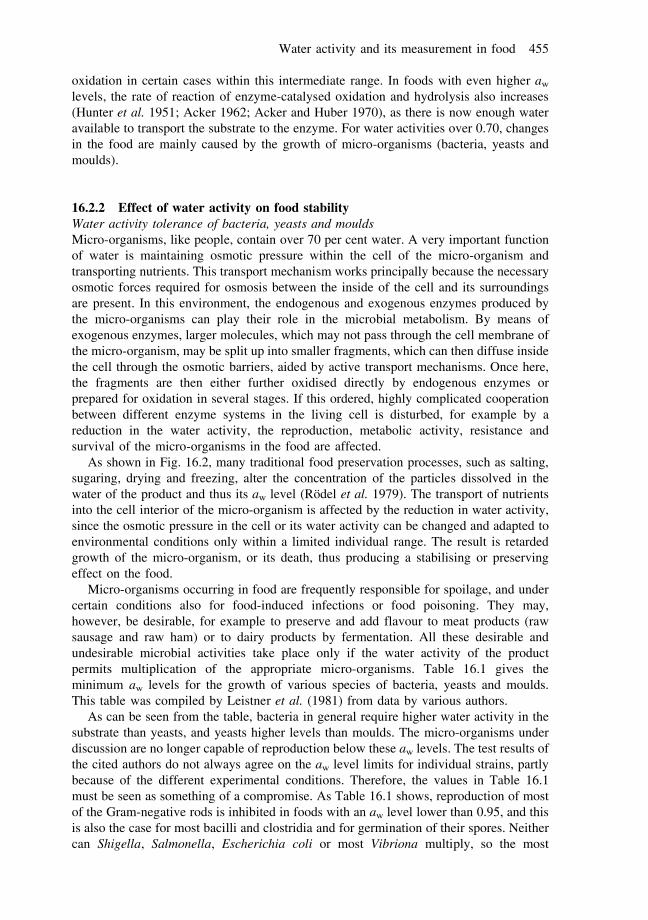
16.2.2 Effect of water activity on food stabilityWater activity tolerance of bacteria, yeasts and mouldsMicro-organisms, like people, contain over 70 per cent water. A very important functionof water is maintaining osmotic pressure within the cell of the micro-organism andtransporting nutrients. This transport mechanism works principally because the necessaryosmotic forces required for osmosis between the inside of the cell and its surroundingsare present. In this environment, the endogenous and exogenous enzymes produced bythe micro-organisms can play their role in the microbial metabolism. By means ofexogenous enzymes, larger molecules, which may not pass through the cell membrane ofthe micro-organism, may be split up into smaller fragments, which can then diffuse insidethe cell through the osmotic barriers, aided by active transport mechanisms. Once here,the fragments are then either further oxidised directly by endogenous enzymes orprepared for oxidation in several stages. If this ordered, highly complicated cooperationbetween different enzyme systems in the living cell is disturbed, for example by areduction in the water activity, the reproduction, metabolic activity, resistance andsurvival of the micro-organisms in the food are affected.
As shown in Fig. 16.2, many traditional food preservation processes, such as salting,sugaring, drying and freezing, alter the concentration of the particles dissolved in thewater of the product and thus its aw level (Rodel et al. 1979). The transport of nutrientsinto the cell interior of the micro-organism is affected by the reduction in water activity,since the osmotic pressure in the cell or its water activity can be changed and adapted toenvironmental conditions only within a limited individual range. The result is retardedgrowth of the micro-organism, or its death, thus producing a stabilising or preservingeffect on the food.
Micro-organisms occurring in food are frequently responsible for spoilage, and undercertain conditions also for food-induced infections or food poisoning. They may,however, be desirable, for example to preserve and add flavour to meat products (rawsausage and raw ham) or to dairy products by fermentation. All these desirable andundesirable microbial activities take place only if the water activity of the productpermits multiplication of the appropriate micro-organisms. Table 16.1 gives theminimum aw levels for the growth of various species of bacteria, yeasts and moulds.This table was compiled by Leistner et al. (1981) from data by various authors.
As can be seen from the table, bacteria in general require higher water activity in thesubstrate than yeasts, and yeasts higher levels than moulds. The micro-organisms underdiscussion are no longer capable of reproduction below these aw levels. The test results ofthe cited authors do not always agree on the aw level limits for individual strains, partlybecause of the different experimental conditions. Therefore, the values in Table 16.1must be seen as something of a compromise. As Table 16.1 shows, reproduction of mostof the Gram-negative rods is inhibited in foods with an aw level lower than 0.95, and thisis also the case for most bacilli and clostridia and for germination of their spores. Neithercan Shigella, Salmonella, Escherichia coli or most Vibriona multiply, so the most
Water activity and its measurement in food 455
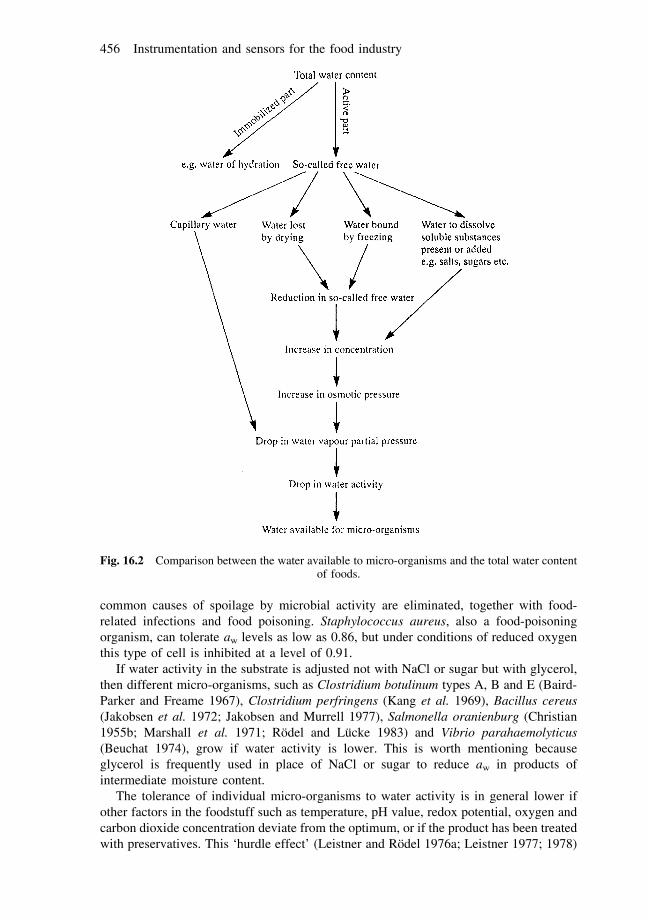
common causes of spoilage by microbial activity are eliminated, together with food-related infections and food poisoning. Staphylococcus aureus, also a food-poisoningorganism, can tolerate aw levels as low as 0.86, but under conditions of reduced oxygenthis type of cell is inhibited at a level of 0.91.
If water activity in the substrate is adjusted not with NaCl or sugar but with glycerol,then different micro-organisms, such as Clostridium botulinum types A, B and E (Baird-Parker and Freame 1967), Clostridium perfringens (Kang et al. 1969), Bacillus cereus(Jakobsen et al. 1972; Jakobsen and Murrell 1977), Salmonella oranienburg (Christian1955b; Marshall et al. 1971; Rodel and Lucke 1983) and Vibrio parahaemolyticus(Beuchat 1974), grow if water activity is lower. This is worth mentioning becauseglycerol is frequently used in place of NaCl or sugar to reduce aw in products ofintermediate moisture content.
The tolerance of individual micro-organisms to water activity is in general lower ifother factors in the foodstuff such as temperature, pH value, redox potential, oxygen andcarbon dioxide concentration deviate from the optimum, or if the product has been treatedwith preservatives. This ‘hurdle effect’ (Leistner and Rodel 1976a; Leistner 1977; 1978)
Fig. 16.2 Comparison between the water available to micro-organisms and the total water contentof foods.
456 Instrumentation and sensors for the food industry
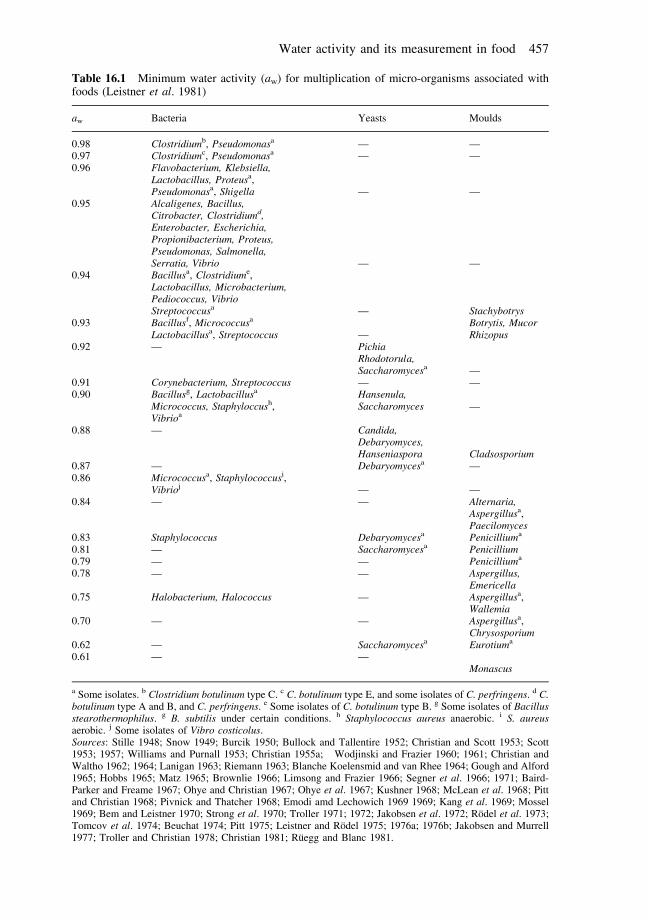
Table 16.1 Minimum water activity (aw) for multiplication of micro-organisms associated withfoods (Leistner et al. 1981)
aw Bacteria Yeasts Moulds
0.98 Clostridiumb, Pseudomonasa — —0.97 Clostridiumc, Pseudomonasa — —0.96 Flavobacterium, Klebsiella,
Lactobacillus, Proteusa,Pseudomonasa, Shigella — —
0.95 Alcaligenes, Bacillus,Citrobacter, Clostridiumd,Enterobacter, Escherichia,Propionibacterium, Proteus,Pseudomonas, Salmonella,Serratia, Vibrio — —
0.94 Bacillusa, Clostridiume,Lactobacillus, Microbacterium,Pediococcus, VibrioStreptococcusa — Stachybotrys
0.93 Bacillusf, Micrococcusa Botrytis, MucorLactobacillusa, Streptococcus — Rhizopus
0.92 — PichiaRhodotorula,Saccharomycesa —
0.91 Corynebacterium, Streptococcus — —0.90 Bacillusg, Lactobacillusa Hansenula,
Micrococcus, Staphyloccush, Saccharomyces —Vibrioa
0.88 — Candida,Debaryomyces,Hanseniaspora Cladsosporium
0.87 — Debaryomycesa —0.86 Micrococcusa, Staphylococcusi,
Vibrioj — —0.84 — — Alternaria,
Aspergillusa,Paecilomyces
0.83 Staphylococcus Debaryomycesa Penicilliuma
0.81 — Saccharomycesa Penicillium0.79 — — Penicilliuma
0.78 — — Aspergillus,Emericella
0.75 Halobacterium, Halococcus — Aspergillusa,Wallemia
0.70 — — Aspergillusa,Chrysosporium
0.62 — Saccharomycesa Eurotiuma
0.61 — —Monascus
a Some isolates. b Clostridium botulinum type C. c C. botulinum type E, and some isolates of C. perfringens. d C.botulinum type A and B, and C. perfringens. e Some isolates of C. botulinum type B. g Some isolates of Bacillusstearothermophilus. g B. subtilis under certain conditions. h Staphylococcus aureus anaerobic. i S. aureusaerobic. j Some isolates of Vibro costicolus.Sources: Stille 1948; Snow 1949; Burcik 1950; Bullock and Tallentire 1952; Christian and Scott 1953; Scott1953; 1957; Williams and Purnall 1953; Christian 1955a; Wodjinski and Frazier 1960; 1961; Christian andWaltho 1962; 1964; Lanigan 1963; Riemann 1963; Blanche Koelensmid and van Rhee 1964; Gough and Alford1965; Hobbs 1965; Matz 1965; Brownlie 1966; Limsong and Frazier 1966; Segner et al. 1966; 1971; Baird-Parker and Freame 1967; Ohye and Christian 1967; Ohye et al. 1967; Kushner 1968; McLean et al. 1968; Pittand Christian 1968; Pivnick and Thatcher 1968; Emodi amd Lechowich 1969 1969; Kang et al. 1969; Mossel1969; Bem and Leistner 1970; Strong et al. 1970; Troller 1971; 1972; Jakobsen et al. 1972; Rodel et al. 1973;Tomcov et al. 1974; Beuchat 1974; Pitt 1975; Leistner and Rodel 1975; 1976a; 1976b; Jakobsen and Murrell1977; Troller and Christian 1978; Christian 1981; Ruegg and Blanc 1981.
Water activity and its measurement in food 457
is of fundamental importance for food preservation because it may be used to preventfood-related infections, food poisoning and deterioration due to microbes, and thefermentation of food can be controlled more easily.
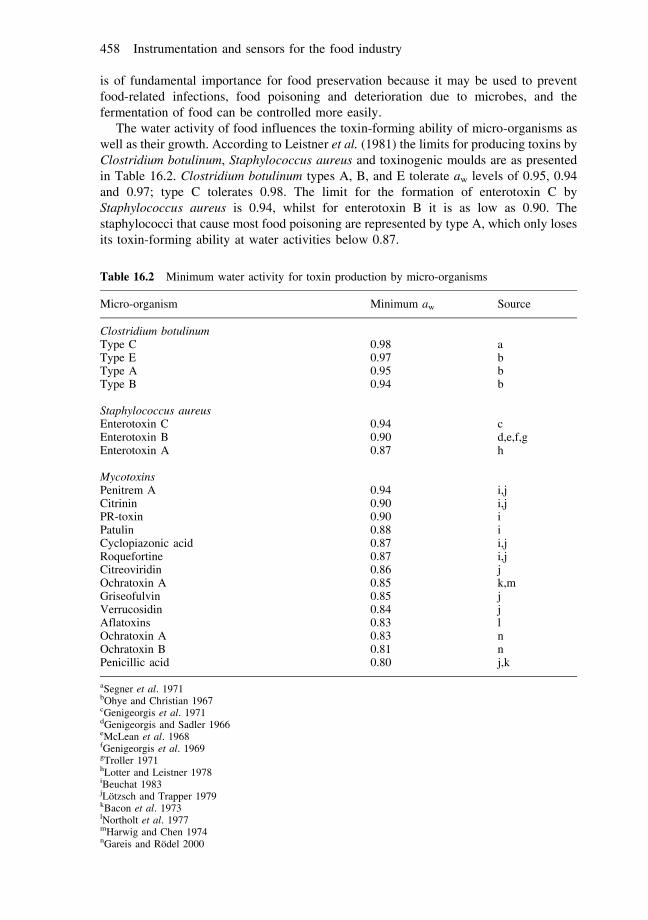
The water activity of food influences the toxin-forming ability of micro-organisms aswell as their growth. According to Leistner et al. (1981) the limits for producing toxins byClostridium botulinum, Staphylococcus aureus and toxinogenic moulds are as presentedin Table 16.2. Clostridium botulinum types A, B, and E tolerate aw levels of 0.95, 0.94and 0.97; type C tolerates 0.98. The limit for the formation of enterotoxin C byStaphylococcus aureus is 0.94, whilst for enterotoxin B it is as low as 0.90. Thestaphylococci that cause most food poisoning are represented by type A, which only losesits toxin-forming ability at water activities below 0.87.
Table 16.2 Minimum water activity for toxin production by micro-organisms
Micro-organism Minimum aw Source
Clostridium botulinumType C 0.98 aType E 0.97 bType A 0.95 bType B 0.94 b
Staphylococcus aureusEnterotoxin C 0.94 cEnterotoxin B 0.90 d,e,f,gEnterotoxin A 0.87 h
MycotoxinsPenitrem A 0.94 i,jCitrinin 0.90 i,jPR-toxin 0.90 iPatulin 0.88 iCyclopiazonic acid 0.87 i,jRoquefortine 0.87 i,jCitreoviridin 0.86 jOchratoxin A 0.85 k,mGriseofulvin 0.85 jVerrucosidin 0.84 jAflatoxins 0.83 lOchratoxin A 0.83 nOchratoxin B 0.81 nPenicillic acid 0.80 j,k
aSegner et al. 1971bOhye and Christian 1967cGenigeorgis et al. 1971dGenigeorgis and Sadler 1966eMcLean et al. 1968fGenigeorgis et al. 1969gTroller 1971hLotter and Leistner 1978iBeuchat 1983jLotzsch and Trapper 1979kBacon et al. 1973lNortholt et al. 1977mHarwig and Chen 1974nGareis and Rodel 2000
458 Instrumentation and sensors for the food industry
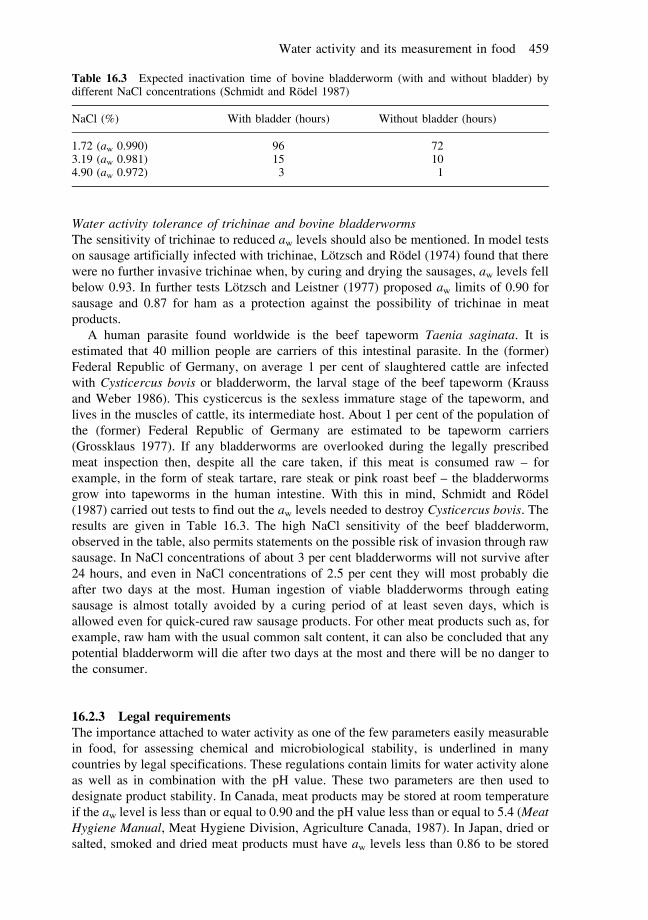
Water activity tolerance of trichinae and bovine bladderwormsThe sensitivity of trichinae to reduced aw levels should also be mentioned. In model testson sausage artificially infected with trichinae, Lotzsch and Rodel (1974) found that therewere no further invasive trichinae when, by curing and drying the sausages, aw levels fellbelow 0.93. In further tests Lotzsch and Leistner (1977) proposed aw limits of 0.90 forsausage and 0.87 for ham as a protection against the possibility of trichinae in meatproducts.
A human parasite found worldwide is the beef tapeworm Taenia saginata. It isestimated that 40 million people are carriers of this intestinal parasite. In the (former)Federal Republic of Germany, on average 1 per cent of slaughtered cattle are infectedwith Cysticercus bovis or bladderworm, the larval stage of the beef tapeworm (Kraussand Weber 1986). This cysticercus is the sexless immature stage of the tapeworm, andlives in the muscles of cattle, its intermediate host. About 1 per cent of the population ofthe (former) Federal Republic of Germany are estimated to be tapeworm carriers(Grossklaus 1977). If any bladderworms are overlooked during the legally prescribedmeat inspection then, despite all the care taken, if this meat is consumed raw – forexample, in the form of steak tartare, rare steak or pink roast beef – the bladderwormsgrow into tapeworms in the human intestine. With this in mind, Schmidt and Rodel(1987) carried out tests to find out the aw levels needed to destroy Cysticercus bovis. Theresults are given in Table 16.3. The high NaCl sensitivity of the beef bladderworm,observed in the table, also permits statements on the possible risk of invasion through rawsausage. In NaCl concentrations of about 3 per cent bladderworms will not survive after24 hours, and even in NaCl concentrations of 2.5 per cent they will most probably dieafter two days at the most. Human ingestion of viable bladderworms through eatingsausage is almost totally avoided by a curing period of at least seven days, which isallowed even for quick-cured raw sausage products. For other meat products such as, forexample, raw ham with the usual common salt content, it can also be concluded that anypotential bladderworm will die after two days at the most and there will be no danger tothe consumer.
16.2.3 Legal requirementsThe importance attached to water activity as one of the few parameters easily measurablein food, for assessing chemical and microbiological stability, is underlined in manycountries by legal specifications. These regulations contain limits for water activity aloneas well as in combination with the pH value. These two parameters are then used todesignate product stability. In Canada, meat products may be stored at room temperatureif the aw level is less than or equal to 0.90 and the pH value less than or equal to 5.4 (MeatHygiene Manual, Meat Hygiene Division, Agriculture Canada, 1987). In Japan, dried orsalted, smoked and dried meat products must have aw levels less than 0.86 to be stored
Table 16.3 Expected inactivation time of bovine bladderworm (with and without bladder) bydifferent NaCl concentrations (Schmidt and Rodel 1987)
NaCl (%) With bladder (hours) Without bladder (hours)
1.72 (aw 0.990) 96 723.19 (aw 0.981) 15 104.90 (aw 0.972) 3 1
Water activity and its measurement in food 459
above 10ºC, or lower than 0.94 to be stored below 10ºC (Food Sanitation Law, Ministryof Health and Welfare). Limits for food in the USA, which refer only to the wateractivity, stipulate an aw of less than 0.85, with no pH requirement (Johnston and Lin1987; FDA 1979; 1985). These few examples show clearly how important it is to controlthe water activity of foodstuffs; and, particularly where sausage and ham are beingproduced for export into the above-mentioned countries, it is absolutely essential tocontrol the water activity of these products. Compliance with the required limits is oftenstrictly and severely enforced by the importing countries.
16.3 Water activity levels in food and their control
The water activity levels of fruits, vegetables, milk products and meat, measured byvarious authors in separate studies, have been published in the comprehensive work ofChirife and Ferro Fontan (1982). Alzamora and Chirife (1983) published water activitylevels of different types of canned food such as fruits, vegetables and meat products.Detailed information on aw levels in German meat products has been published by Rodel(1975).
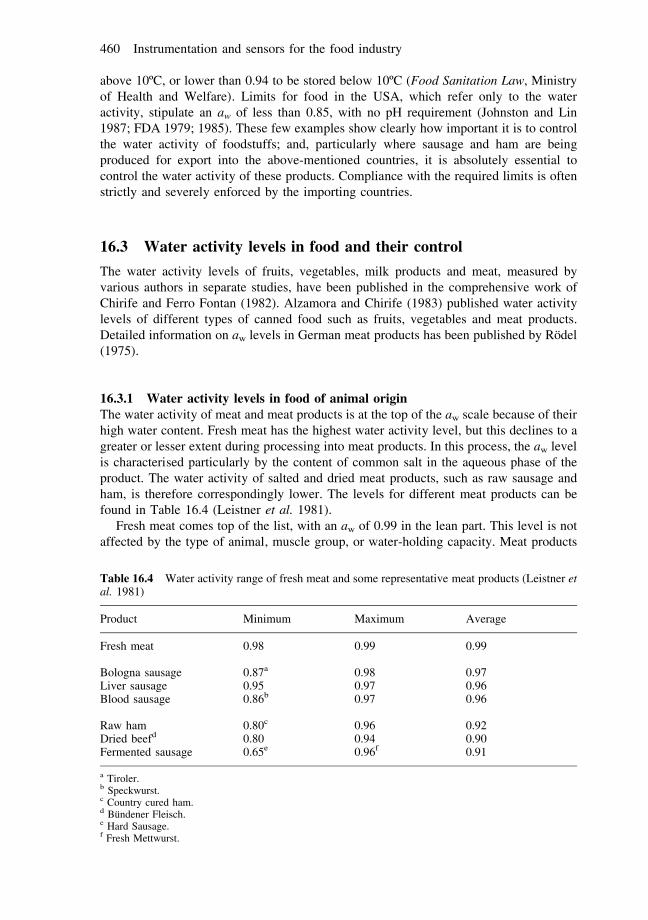
16.3.1 Water activity levels in food of animal originThe water activity of meat and meat products is at the top of the aw scale because of theirhigh water content. Fresh meat has the highest water activity level, but this declines to agreater or lesser extent during processing into meat products. In this process, the aw levelis characterised particularly by the content of common salt in the aqueous phase of theproduct. The water activity of salted and dried meat products, such as raw sausage andham, is therefore correspondingly lower. The levels for different meat products can befound in Table 16.4 (Leistner et al. 1981).
Fresh meat comes top of the list, with an aw of 0.99 in the lean part. This level is notaffected by the type of animal, muscle group, or water-holding capacity. Meat products
Table 16.4 Water activity range of fresh meat and some representative meat products (Leistner etal. 1981)
Product Minimum Maximum Average
Fresh meat 0.98 0.99 0.99
Bologna sausage 0.87a 0.98 0.97Liver sausage 0.95 0.97 0.96Blood sausage 0.86b 0.97 0.96
Raw ham 0.80c 0.96 0.92Dried beefd 0.80 0.94 0.90Fermented sausage 0.65e 0.96f 0.91
a Tiroler.b Speckwurst.c Country cured ham.d Bundener Fleisch.e Hard Sausage.f Fresh Mettwurst.
460 Instrumentation and sensors for the food industry
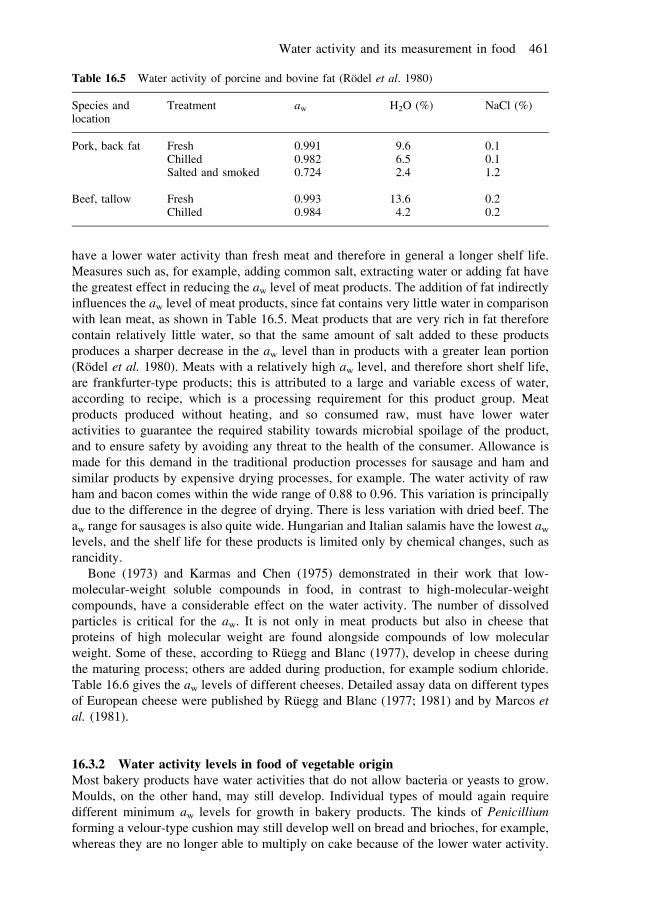
have a lower water activity than fresh meat and therefore in general a longer shelf life.Measures such as, for example, adding common salt, extracting water or adding fat havethe greatest effect in reducing the aw level of meat products. The addition of fat indirectlyinfluences the aw level of meat products, since fat contains very little water in comparisonwith lean meat, as shown in Table 16.5. Meat products that are very rich in fat thereforecontain relatively little water, so that the same amount of salt added to these productsproduces a sharper decrease in the aw level than in products with a greater lean portion(Rodel et al. 1980). Meats with a relatively high aw level, and therefore short shelf life,are frankfurter-type products; this is attributed to a large and variable excess of water,according to recipe, which is a processing requirement for this product group. Meatproducts produced without heating, and so consumed raw, must have lower wateractivities to guarantee the required stability towards microbial spoilage of the product,and to ensure safety by avoiding any threat to the health of the consumer. Allowance ismade for this demand in the traditional production processes for sausage and ham andsimilar products by expensive drying processes, for example. The water activity of rawham and bacon comes within the wide range of 0.88 to 0.96. This variation is principallydue to the difference in the degree of drying. There is less variation with dried beef. Theaw range for sausages is also quite wide. Hungarian and Italian salamis have the lowest aw
levels, and the shelf life for these products is limited only by chemical changes, such asrancidity.
Bone (1973) and Karmas and Chen (1975) demonstrated in their work that low-molecular-weight soluble compounds in food, in contrast to high-molecular-weightcompounds, have a considerable effect on the water activity. The number of dissolvedparticles is critical for the aw. It is not only in meat products but also in cheese thatproteins of high molecular weight are found alongside compounds of low molecularweight. Some of these, according to Ruegg and Blanc (1977), develop in cheese duringthe maturing process; others are added during production, for example sodium chloride.Table 16.6 gives the aw levels of different cheeses. Detailed assay data on different typesof European cheese were published by Ruegg and Blanc (1977; 1981) and by Marcos etal. (1981).
16.3.2 Water activity levels in food of vegetable originMost bakery products have water activities that do not allow bacteria or yeasts to grow.Moulds, on the other hand, may still develop. Individual types of mould again requiredifferent minimum aw levels for growth in bakery products. The kinds of Penicilliumforming a velour-type cushion may still develop well on bread and brioches, for example,whereas they are no longer able to multiply on cake because of the lower water activity.
Table 16.5 Water activity of porcine and bovine fat (Rodel et al. 1980)
Species and Treatment aw H2O (%) NaCl (%)location
Pork, back fat Fresh 0.991 9.6 0.1Chilled 0.982 6.5 0.1Salted and smoked 0.724 2.4 1.2
Beef, tallow Fresh 0.993 13.6 0.2Chilled 0.984 4.2 0.2
Water activity and its measurement in food 461
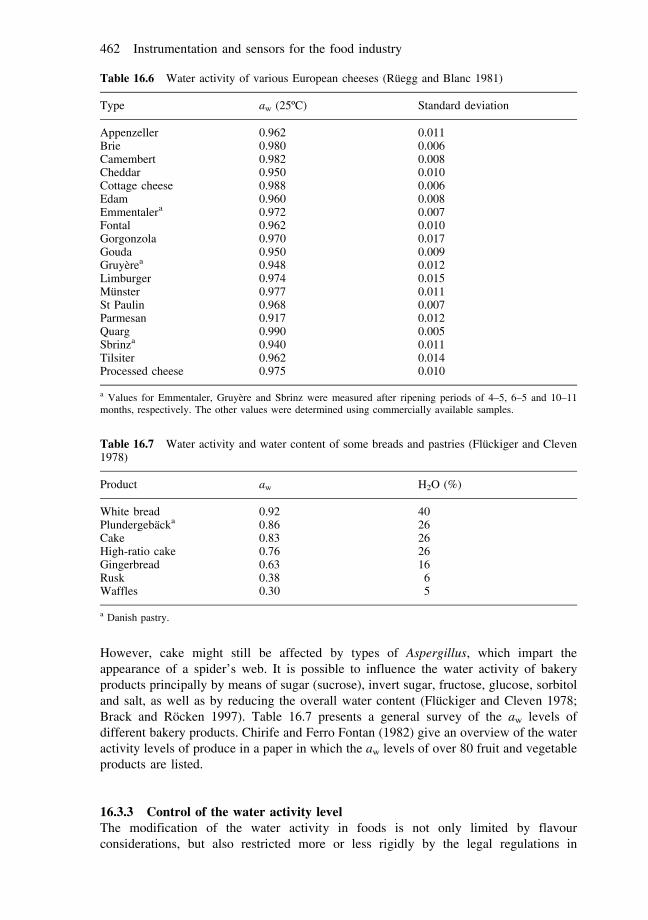
However, cake might still be affected by types of Aspergillus, which impart theappearance of a spider’s web. It is possible to influence the water activity of bakeryproducts principally by means of sugar (sucrose), invert sugar, fructose, glucose, sorbitoland salt, as well as by reducing the overall water content (Fluckiger and Cleven 1978;Brack and Rocken 1997). Table 16.7 presents a general survey of the aw levels ofdifferent bakery products. Chirife and Ferro Fontan (1982) give an overview of the wateractivity levels of produce in a paper in which the aw levels of over 80 fruit and vegetableproducts are listed.
16.3.3 Control of the water activity levelThe modification of the water activity in foods is not only limited by flavourconsiderations, but also restricted more or less rigidly by the legal regulations in
Table 16.6 Water activity of various European cheeses (Ruegg and Blanc 1981)
Type aw (25ºC) Standard deviation
Appenzeller 0.962 0.011Brie 0.980 0.006Camembert 0.982 0.008Cheddar 0.950 0.010Cottage cheese 0.988 0.006Edam 0.960 0.008Emmentalera 0.972 0.007Fontal 0.962 0.010Gorgonzola 0.970 0.017Gouda 0.950 0.009Gruyerea 0.948 0.012Limburger 0.974 0.015Munster 0.977 0.011St Paulin 0.968 0.007Parmesan 0.917 0.012Quarg 0.990 0.005Sbrinza 0.940 0.011Tilsiter 0.962 0.014Processed cheese 0.975 0.010
a Values for Emmentaler, Gruyere and Sbrinz were measured after ripening periods of 4–5, 6–5 and 10–11months, respectively. The other values were determined using commercially available samples.
Table 16.7 Water activity and water content of some breads and pastries (Fluckiger and Cleven1978)
Product aw H2O (%)
White bread 0.92 40Plundergebacka 0.86 26Cake 0.83 26High-ratio cake 0.76 26Gingerbread 0.63 16Rusk 0.38 6Waffles 0.30 5
a Danish pastry.
462 Instrumentation and sensors for the food industry
individual countries. However, numerous publications have described technologies fornew types of foods termed ‘intermediate-moisture foods’ (Heiss and Eichner 1971;Labuza et al. 1972a; 1972b; Bone 1973; Ross 1975; Davies et al. 1976; Simatos andMulton 1985). These products, in which mostly glycerol is used to retain moisture, haveachieved great significance in a similar form in animal feeds. The moisture retainers orhumectants, such as glycerol or propylene glycol, used in these products combine with orreplace part of the water in the product and therefore reduce the aw level without theproduct losing its tenderness. These products can be stored for a long period even withoutrefrigeration if a fungal growth inhibitor is applied. For traditional meat products, thewater activity can be reduced mainly by salting, adding fat and drying. For Asianproducts the water activity is also in many cases reduced additionally by large quantitiesof sugar.
According to Fluckiger and Cleven (1978) there are two ways of reducing the wateractivity of bakery products to below the critical limit of 0.75 for these products (lowerlimit for mould growth). During bakery production the water content of the product canbe greatly reduced either through the choice of recipe and the process, or by the additionof sugar or sugar substitutes. In Great Britain and the USA the latter option is used for so-called high-ratio cakes. When special flours (cake flour) are used, sugar may be added atlevels up to 160 per cent in proportion to the flour. The aw level of these very moist cakeslies in the range between 0.70 and 0.76. Unopened, these products are protected frommould growth even after prolonged storage. The fact that cakes containing raisins orcandied fruit are hardly affected by mould is likewise due to a reduction in the wateractivity brought about by the soluble sugars present in the fruits.
16.3.4 Example: regulating raw sausage ripening by controlling the water activitylevelIt is not only from a microbiological point of view that water activity in food is ofinterest. This parameter may also be used to optimise products and to save energy in theprocessing steps involved in the fermentation of raw sausages such as salami.Conventional sausage ripening is currently based mainly on empirical principles. Thus,established processing conditions are regarded as optimal if there are no significant lossesin the form of faulty products, for example with overdried edge zones or with tears. Theripening conditions (that is, temperature, humidity, air flow rate and time) are still alteredmainly on the basis of sensory impressions, for example elasticity and dampness of theskin, external colour, etc. As a safeguard, a spot check is sometimes made on weight loss,pH value or water activity. Only in conditioned curing rooms in larger plants arecontinuous records of temperature and humidity standard practice. The character ofmodern curing plants has, however, changed with the increased use of microprocessors.In these new-generation microprocessor-controlled air-conditioned curing chambers,particularly those used in the production of raw slicing sausage, it is necessary to replacethe older ‘time control’ of the curing chamber with process control, involving continuousassessment of selected fermentation parameters to allow continuous feedback to thecuring process. It is then possible to react to desired – or particularly to undesired –changes and processes in the sausage during the long fermentation process by regulatingthe curing plant. The measurements necessary for this are supplied to the microprocessorby sensors (Rodel and Stiebing 1987; Stiebing and Rodel 1989).
Water activity and its measurement in food 463
16.4 Measuring water activity level
16.4.1 BackgroundThe following methods for measuring water activity in foods, with the exception of thefreezing point technique, operate by determining the equilibrium moisture content. In thiscontext, equilibrium means that equality has been reached between the water activity ofthe food and the relative humidity of the air enclosed in a measuring chamberimpermeable to water vapour. The following conditions are therefore essential foraccurate practical measurement of aw. The measuring chamber must be sealed to preventthe effects of humidity in the external air on the equilibrium humidity in the chamber, andto prevent water vapour losses from the chamber. The water content of the samplesshould be practically identical before and after achieving equilibrium in the measuringchamber, which presupposes that the volume of air enclosed with the food in themeasuring chamber is small. The rate of equilibration (determining the measuring period)is also increased for small volumes of air.
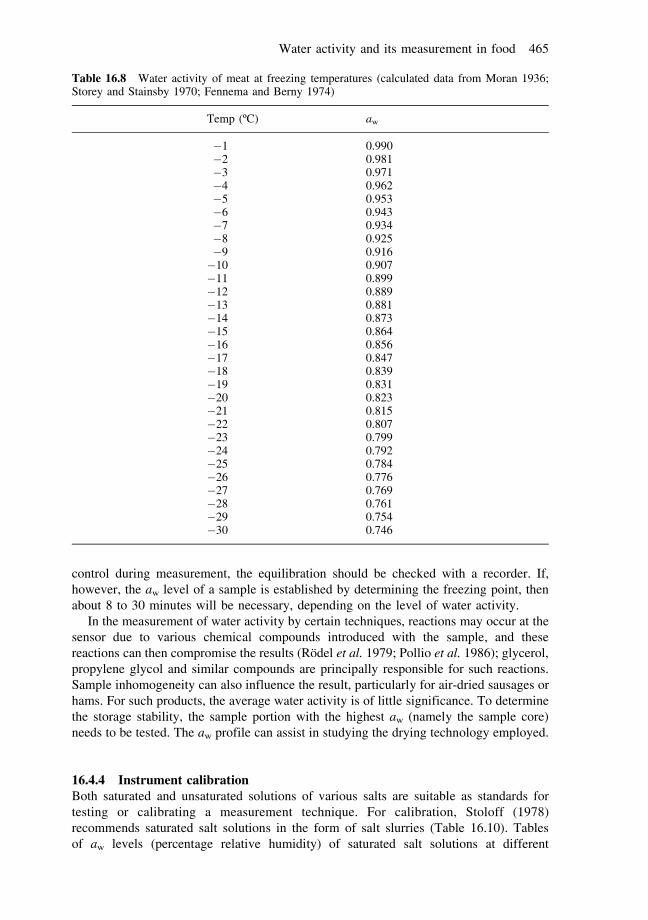
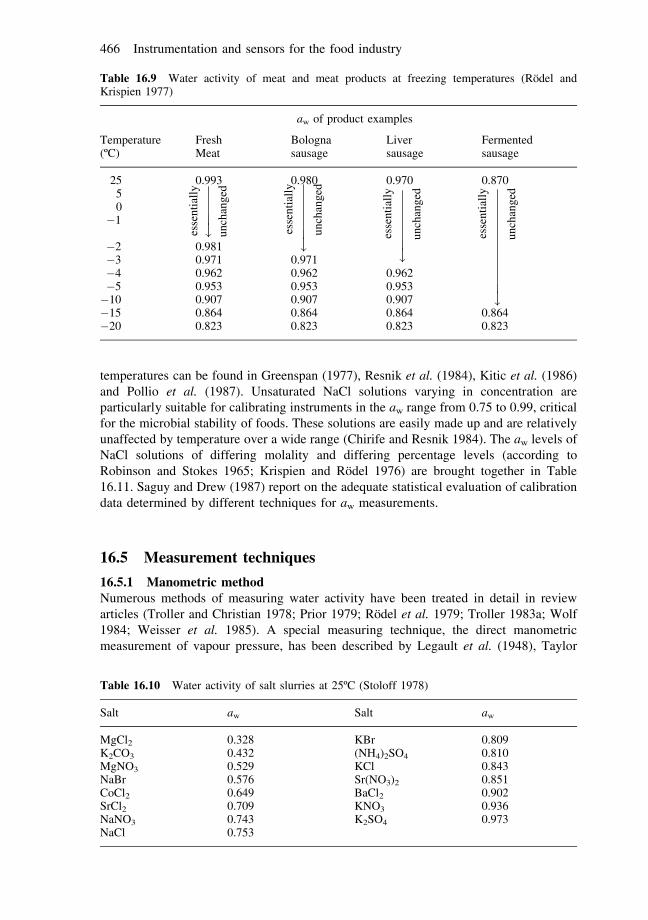
16.4.2 Water activity as a function of temperatureThe water activity of foods decreases as the temperature drops (Ross 1975; Van den Berg1975; Fennema 1978). Research carried out by Krispien and Rodel (1976) and Rodel andKrispien (1977) on meat and meat products has shown that if these products are cooledfrom 25ºC down to the chilled and frozen range, there is a reduction in the aw level. Attemperatures above the onset of freezing the decrease in aw level is insignificant(~0.00015 per K), whereas below this point the decrease is considerable (~0.008 per K).Below the freezing point of meat and meat products, the aw level equals the aw level ofice at the particular freezing temperature (Table 16.8). The aw level of foods at freezingtemperatures can be read from this table. Table 16.9 illustrates the processes at decreasingtemperatures for meat and meat products. All frozen foods, including frozen water, havethe same aw level at the same temperature.
The temperature above freezing point at which the aw is measured therefore makes nodifference, as the effect of temperature on the vapour pressure ratios is very slight. It isonly necessary to ensure that calibration and sample measurement take place at the sametemperatures. A measurement temperature of 25ºC has proved practical, as there is agreat deal of information in the literature on calibration references at this temperature.Particular attention must be paid to the constancy of temperature while the aw is beingmeasured. Any difference in temperature between measuring chamber, sensor and foodmay cause gross errors in the measurement. The higher the aw level of the sample, thegreater the error.
16.4.3 Influence of equilibration periods and sample propertiesIt is not only the humidity equilibrium that can be adversely affected by variations intemperature during measurement; most electronic aw sensors also have a typicaltemperature response. Thus all water activity measurements must be taken at ambienttemperatures that are as constant as possible (maximum ±0.2K fluctuation), whichrequires the use of temperature-controlled cabinets or Peltier-cooled boxes. The accuracyand in particular the reproducibility of many methods are adversely affected byinadequate measuring periods. If the aw level of the sample is determined by the processof equilibration, the measuring period for foods is generally about 2 to 4 hours. For better
464 Instrumentation and sensors for the food industry
control during measurement, the equilibration should be checked with a recorder. If,however, the aw level of a sample is established by determining the freezing point, thenabout 8 to 30 minutes will be necessary, depending on the level of water activity.
In the measurement of water activity by certain techniques, reactions may occur at thesensor due to various chemical compounds introduced with the sample, and thesereactions can then compromise the results (Rodel et al. 1979; Pollio et al. 1986); glycerol,propylene glycol and similar compounds are principally responsible for such reactions.Sample inhomogeneity can also influence the result, particularly for air-dried sausages orhams. For such products, the average water activity is of little significance. To determinethe storage stability, the sample portion with the highest aw (namely the sample core)needs to be tested. The aw profile can assist in studying the drying technology employed.
16.4.4 Instrument calibrationBoth saturated and unsaturated solutions of various salts are suitable as standards fortesting or calibrating a measurement technique. For calibration, Stoloff (1978)recommends saturated salt solutions in the form of salt slurries (Table 16.10). Tablesof aw levels (percentage relative humidity) of saturated salt solutions at different
Table 16.8 Water activity of meat at freezing temperatures (calculated data from Moran 1936;Storey and Stainsby 1970; Fennema and Berny 1974)
Temp (ºC) aw
�1 0.990�2 0.981�3 0.971�4 0.962�5 0.953�6 0.943�7 0.934�8 0.925�9 0.916�10 0.907�11 0.899�12 0.889�13 0.881�14 0.873�15 0.864�16 0.856�17 0.847�18 0.839�19 0.831�20 0.823�21 0.815�22 0.807�23 0.799�24 0.792�25 0.784�26 0.776�27 0.769�28 0.761�29 0.754�30 0.746
Water activity and its measurement in food 465
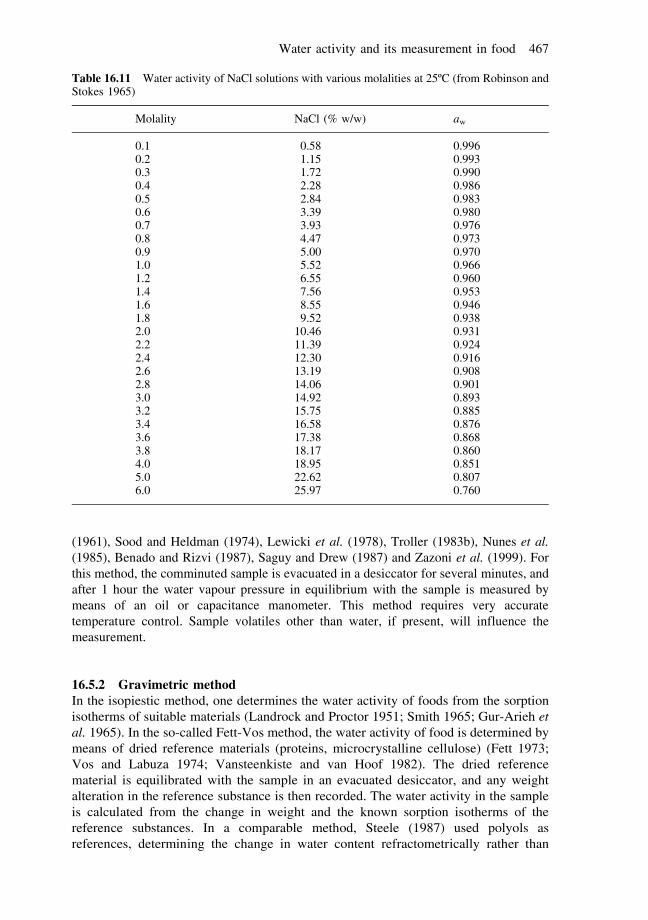
temperatures can be found in Greenspan (1977), Resnik et al. (1984), Kitic et al. (1986)and Pollio et al. (1987). Unsaturated NaCl solutions varying in concentration areparticularly suitable for calibrating instruments in the aw range from 0.75 to 0.99, criticalfor the microbial stability of foods. These solutions are easily made up and are relativelyunaffected by temperature over a wide range (Chirife and Resnik 1984). The aw levels ofNaCl solutions of differing molality and differing percentage levels (according toRobinson and Stokes 1965; Krispien and Rodel 1976) are brought together in Table16.11. Saguy and Drew (1987) report on the adequate statistical evaluation of calibrationdata determined by different techniques for aw measurements.
16.5 Measurement techniques
16.5.1 Manometric methodNumerous methods of measuring water activity have been treated in detail in reviewarticles (Troller and Christian 1978; Prior 1979; Rodel et al. 1979; Troller 1983a; Wolf1984; Weisser et al. 1985). A special measuring technique, the direct manometricmeasurement of vapour pressure, has been described by Legault et al. (1948), Taylor
Table 16.9 Water activity of meat and meat products at freezing temperatures (Rodel andKrispien 1977)
aw of product examples
Temperature Fresh Bologna Liver Fermented(ºC) Meat sausage sausage sausage
25 0.993 0.980 0.970 0.87050
�1
�2 0.981�3 0.971 0.971�4 0.962 0.962 0.962�5 0.953 0.953 0.953�10 0.907 0.907 0.907�15 0.864 0.864 0.864 0.864�20 0.823 0.823 0.823 0.823
esse
ntia
lly�� un
chan
ged
esse
ntia
lly��
unch
ange
d
esse
ntia
lly��
unch
ange
d
esse
ntia
lly��
unch
ange
d
Table 16.10 Water activity of salt slurries at 25ºC (Stoloff 1978)
Salt aw Salt aw
MgCl2 0.328 KBr 0.809K2CO3 0.432 (NH4)2SO4 0.810MgNO3 0.529 KCl 0.843NaBr 0.576 Sr(NO3)2 0.851CoCl2 0.649 BaCl2 0.902SrCl2 0.709 KNO3 0.936NaNO3 0.743 K2SO4 0.973NaCl 0.753
466 Instrumentation and sensors for the food industry
(1961), Sood and Heldman (1974), Lewicki et al. (1978), Troller (1983b), Nunes et al.(1985), Benado and Rizvi (1987), Saguy and Drew (1987) and Zazoni et al. (1999). Forthis method, the comminuted sample is evacuated in a desiccator for several minutes, andafter 1 hour the water vapour pressure in equilibrium with the sample is measured bymeans of an oil or capacitance manometer. This method requires very accuratetemperature control. Sample volatiles other than water, if present, will influence themeasurement.
16.5.2 Gravimetric methodIn the isopiestic method, one determines the water activity of foods from the sorptionisotherms of suitable materials (Landrock and Proctor 1951; Smith 1965; Gur-Arieh etal. 1965). In the so-called Fett-Vos method, the water activity of food is determined bymeans of dried reference materials (proteins, microcrystalline cellulose) (Fett 1973;Vos and Labuza 1974; Vansteenkiste and van Hoof 1982). The dried referencematerial is equilibrated with the sample in an evacuated desiccator, and any weightalteration in the reference substance is then recorded. The water activity in the sampleis calculated from the change in weight and the known sorption isotherms of thereference substances. In a comparable method, Steele (1987) used polyols asreferences, determining the change in water content refractometrically rather than
Table 16.11 Water activity of NaCl solutions with various molalities at 25ºC (from Robinson andStokes 1965)
Molality NaCl (% w/w) aw
0.1 0.58 0.9960.2 1.15 0.9930.3 1.72 0.9900.4 2.28 0.9860.5 2.84 0.9830.6 3.39 0.9800.7 3.93 0.9760.8 4.47 0.9730.9 5.00 0.9701.0 5.52 0.9661.2 6.55 0.9601.4 7.56 0.9531.6 8.55 0.9461.8 9.52 0.9382.0 10.46 0.9312.2 11.39 0.9242.4 12.30 0.9162.6 13.19 0.9082.8 14.06 0.9013.0 14.92 0.8933.2 15.75 0.8853.4 16.58 0.8763.6 17.38 0.8683.8 18.17 0.8604.0 18.95 0.8515.0 22.62 0.8076.0 25.97 0.760
Water activity and its measurement in food 467
gravimetrically. These methods are relatively easy to perform. If equilibration iscarried out in a static atmosphere they are not, however, suitable for measuringperishable foods because of the long adjustment period of more than 24 hours. But ifthe work is carried out in a dynamic, conditioned air stream, this period is substantiallyreduced (Multon et al. 1980). Lang et al. (1981), McCune et al. (1981), Lenart andFlink (1983), Palacha and Flink (1987) and Marcos-Esteban (1997) describe aproximity equilibration cell (PEC) method, which is not very expensive and makes useof the change in weight of filter paper to determine the aw level of the sample.
16.5.3 Psychrometric methodSharpe et al. (1991) outline a psychrometric technique for foods (Water Activity meter,Model aw-10, Ottawa Instrumentation Ltd., 169 Fifth Avenue, Ottawa, Ontario K12 2M8CA). The instrument is valuable for the measurement of aw in cheeses, meats, preserves,butter, and canned vegetables. The principle of the method is to use a miniaturehygrometer probe which contains both ‘dry’ reference and a ‘wet’ sensor. The latter isexposed to the atmosphere above the food sample after equilibration. The resultingtemperature change is a very linear function. Measurement may be made with respect topure water reference (aw � 1.00) or a suitable sodium chloride reference (aw from 0.78 to1.00). The measurement time is largely constrained by the time taken to achievetemperature stability. Five minutes are allowed for equilibration, and the measurement ofaw takes a further 30 seconds. The total time per sample is normally well under tenminutes. The instrument is calibrated by measuring the response to a pure water sampleand then one of 0.80 aw units. The aw resolution is ±0.01 units.
16.5.4 Hygrometric methodsSalt methodThe aw level may be determined relatively cheaply using apparatus with the salt/filter-paper method of Kvaale and Dalhoff (1963), as modified by Northolt and Heuvelman(1982) and Hilsheimer and Hauschild (1985). The method is based on the fact that driedsalt adhering to filter paper is dissolved if the humidity of the surrounding air has reacheda point equal to the saturation humidity of the salt. If salts of different saturationhumidities are used, the aw level of a sample may be estimated.
Thread hygrometersThis method is based on the hygroscopicity of the polyamide thread, which reacts to anincrease in moisture by elongating noticeably. The instrument shown in Fig. 16.3 formeasuring aw (aw level meter 5803, made by G. Lufft Mess- und Regeltechnik GmbH,Gutenbergstrasse 20, D-70736 Fellbach, Germany) consists of a sample-scale pan and anattachment that is connected from the pan to a measuring unit by means of a lever system.The polyamide thread is inside the attachment. The change in thread length is convertedto a scale on an indicator by means of an axle and lever mechanism.
Measuring water activity with this instrument (which takes about 3–4 hours) requiresconstant temperature. This method has been extensively tested and described by Rodeland Leistner (1971), Rodel et al. (1975), Labuza et al. (1977), Bousquet-Ricard et al.(1980), Jakobsen (1983), Gerschenson et al. (1984) and Stroup et al. (1987). Theaccuracy of the instrument is 0.01 aw and the reproducibility is also 0.01 aw (Rodel et al.1975; Bousquet-Ricard et al. 1980; Jakobsen 1983) at a constant temperature of 25ºC,
468 Instrumentation and sensors for the food industry
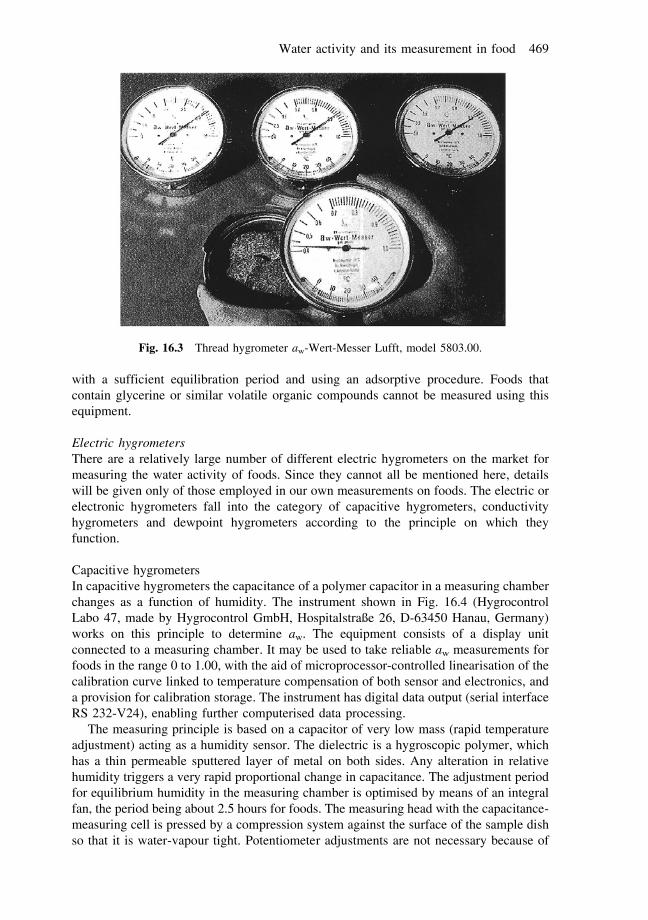
with a sufficient equilibration period and using an adsorptive procedure. Foods thatcontain glycerine or similar volatile organic compounds cannot be measured using thisequipment.
Electric hygrometersThere are a relatively large number of different electric hygrometers on the market formeasuring the water activity of foods. Since they cannot all be mentioned here, detailswill be given only of those employed in our own measurements on foods. The electric orelectronic hygrometers fall into the category of capacitive hygrometers, conductivityhygrometers and dewpoint hygrometers according to the principle on which theyfunction.
Capacitive hygrometersIn capacitive hygrometers the capacitance of a polymer capacitor in a measuring chamberchanges as a function of humidity. The instrument shown in Fig. 16.4 (HygrocontrolLabo 47, made by Hygrocontrol GmbH, Hospitalstraße 26, D-63450 Hanau, Germany)works on this principle to determine aw. The equipment consists of a display unitconnected to a measuring chamber. It may be used to take reliable aw measurements forfoods in the range 0 to 1.00, with the aid of microprocessor-controlled linearisation of thecalibration curve linked to temperature compensation of both sensor and electronics, anda provision for calibration storage. The instrument has digital data output (serial interfaceRS 232-V24), enabling further computerised data processing.
The measuring principle is based on a capacitor of very low mass (rapid temperatureadjustment) acting as a humidity sensor. The dielectric is a hygroscopic polymer, whichhas a thin permeable sputtered layer of metal on both sides. Any alteration in relativehumidity triggers a very rapid proportional change in capacitance. The adjustment periodfor equilibrium humidity in the measuring chamber is optimised by means of an integralfan, the period being about 2.5 hours for foods. The measuring head with the capacitance-measuring cell is pressed by a compression system against the surface of the sample dishso that it is water-vapour tight. Potentiometer adjustments are not necessary because of
Fig. 16.3 Thread hygrometer aw-Wert-Messer Lufft, model 5803.00.
Water activity and its measurement in food 469
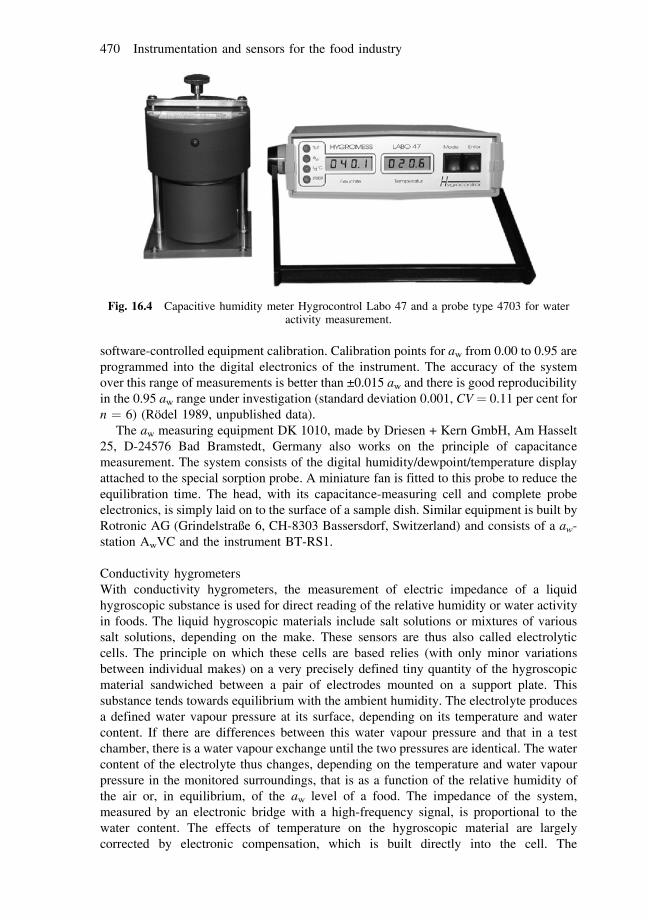
software-controlled equipment calibration. Calibration points for aw from 0.00 to 0.95 areprogrammed into the digital electronics of the instrument. The accuracy of the systemover this range of measurements is better than ±0.015 aw and there is good reproducibilityin the 0.95 aw range under investigation (standard deviation 0.001, CV � 0.11 per cent forn � 6) (Rodel 1989, unpublished data).
The aw measuring equipment DK 1010, made by Driesen + Kern GmbH, Am Hasselt25, D-24576 Bad Bramstedt, Germany also works on the principle of capacitancemeasurement. The system consists of the digital humidity/dewpoint/temperature displayattached to the special sorption probe. A miniature fan is fitted to this probe to reduce theequilibration time. The head, with its capacitance-measuring cell and complete probeelectronics, is simply laid on to the surface of a sample dish. Similar equipment is built byRotronic AG (Grindelstraße 6, CH-8303 Bassersdorf, Switzerland) and consists of a aw-station AwVC and the instrument BT-RS1.
Conductivity hygrometersWith conductivity hygrometers, the measurement of electric impedance of a liquidhygroscopic substance is used for direct reading of the relative humidity or water activityin foods. The liquid hygroscopic materials include salt solutions or mixtures of varioussalt solutions, depending on the make. These sensors are thus also called electrolyticcells. The principle on which these cells are based relies (with only minor variationsbetween individual makes) on a very precisely defined tiny quantity of the hygroscopicmaterial sandwiched between a pair of electrodes mounted on a support plate. Thissubstance tends towards equilibrium with the ambient humidity. The electrolyte producesa defined water vapour pressure at its surface, depending on its temperature and watercontent. If there are differences between this water vapour pressure and that in a testchamber, there is a water vapour exchange until the two pressures are identical. The watercontent of the electrolyte thus changes, depending on the temperature and water vapourpressure in the monitored surroundings, that is as a function of the relative humidity ofthe air or, in equilibrium, of the aw level of a food. The impedance of the system,measured by an electronic bridge with a high-frequency signal, is proportional to thewater content. The effects of temperature on the hygroscopic material are largelycorrected by electronic compensation, which is built directly into the cell. The
Fig. 16.4 Capacitive humidity meter Hygrocontrol Labo 47 and a probe type 4703 for wateractivity measurement.
470 Instrumentation and sensors for the food industry
electrolytic measuring cells are calibrated against salt solutions with known aw levels andprovide a signal that is directly dependent on the measured aw level.
When this type of aw measurement system is used, in addition to the uppertemperature limit, the following conditions should generally be observed. Direct contactof the test cells with water or salt solutions should be avoided under all circumstances.This means that the aw level of calibration liquids and of foods may be measured only inthe air space above their surfaces. Measuring chambers for samples are designedaccordingly for different systems. The electrolytic cells must not be subjected to anyheavy shock condensation such as may occur with larger swings from low to hightemperatures. Heavy mechanical impacts when measuring above aw 0.80 must beavoided.
Electrolytic measuring cells, in common with capacitance cells, may react to volatileinorganic and organic substances by changing their characteristics, and these changes canbe difficult to interpret. Low concentrations (~ 100 ppm) are normally tolerated, with theoperating range for temperature and humidity also having an influence. To protect themeasuring cell, some manufacturers offer special filters (active carbon filters) which areparticularly recommended for use when measuring the aw of petfoods, as these animalfoods are frequently produced with a propylene glycol additive (Pollio et al. 1986). Iffilters are not used, high concentrations of organic vapours may dissolve in thehygroscopic material and its characteristics may change. Some chemicals have only atemporary effect on the cell (that is the measuring cell regenerates when they evaporatefrom the electrolyte), but others have an irreversible effect on the electrolyte, destroyingthe measuring cell. Oil and fat volatiles are also harmful to the cell as these materials cancondense in the sensor and prevent it from functioning.
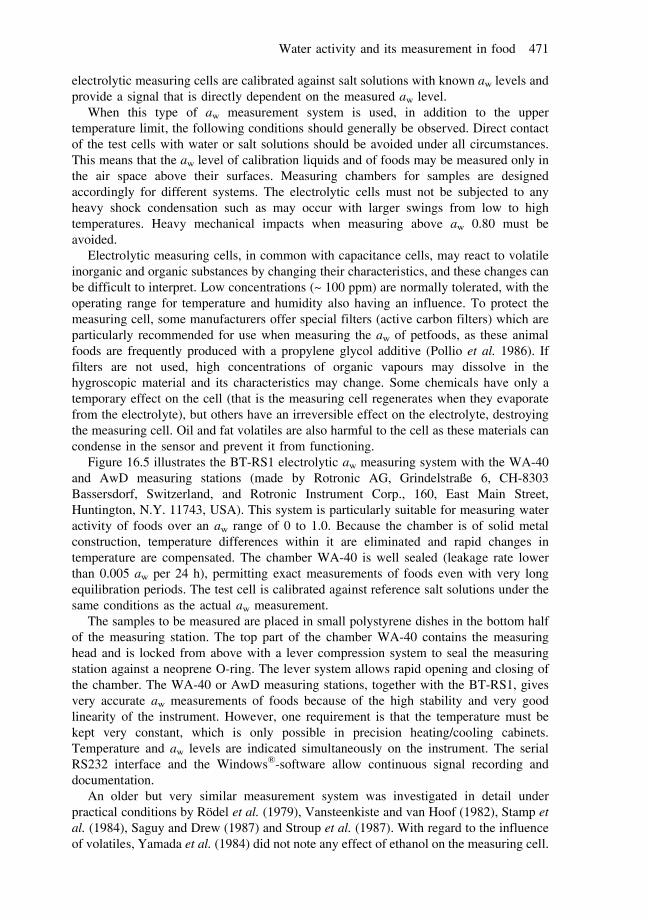
Figure 16.5 illustrates the BT-RS1 electrolytic aw measuring system with the WA-40and AwD measuring stations (made by Rotronic AG, Grindelstraße 6, CH-8303Bassersdorf, Switzerland, and Rotronic Instrument Corp., 160, East Main Street,Huntington, N.Y. 11743, USA). This system is particularly suitable for measuring wateractivity of foods over an aw range of 0 to 1.0. Because the chamber is of solid metalconstruction, temperature differences within it are eliminated and rapid changes intemperature are compensated. The chamber WA-40 is well sealed (leakage rate lowerthan 0.005 aw per 24 h), permitting exact measurements of foods even with very longequilibration periods. The test cell is calibrated against reference salt solutions under thesame conditions as the actual aw measurement.
The samples to be measured are placed in small polystyrene dishes in the bottom halfof the measuring station. The top part of the chamber WA-40 contains the measuringhead and is locked from above with a lever compression system to seal the measuringstation against a neoprene O-ring. The lever system allows rapid opening and closing ofthe chamber. The WA-40 or AwD measuring stations, together with the BT-RS1, givesvery accurate aw measurements of foods because of the high stability and very goodlinearity of the instrument. However, one requirement is that the temperature must bekept very constant, which is only possible in precision heating/cooling cabinets.Temperature and aw levels are indicated simultaneously on the instrument. The serialRS232 interface and the Windows�-software allow continuous signal recording anddocumentation.
An older but very similar measurement system was investigated in detail underpractical conditions by Rodel et al. (1979), Vansteenkiste and van Hoof (1982), Stamp etal. (1984), Saguy and Drew (1987) and Stroup et al. (1987). With regard to the influenceof volatiles, Yamada et al. (1984) did not note any effect of ethanol on the measuring cell.
Water activity and its measurement in food 471
In comparing experiments, Rodel et al. (1990) were able to record good reproducibility ofthe resulting measurements (eleven measurements each for NaCl solutions with aw levels0.90 and 0.95). The standard deviations were 0.0004 aw (CV 0.04 per cent) or 0.0007 aw
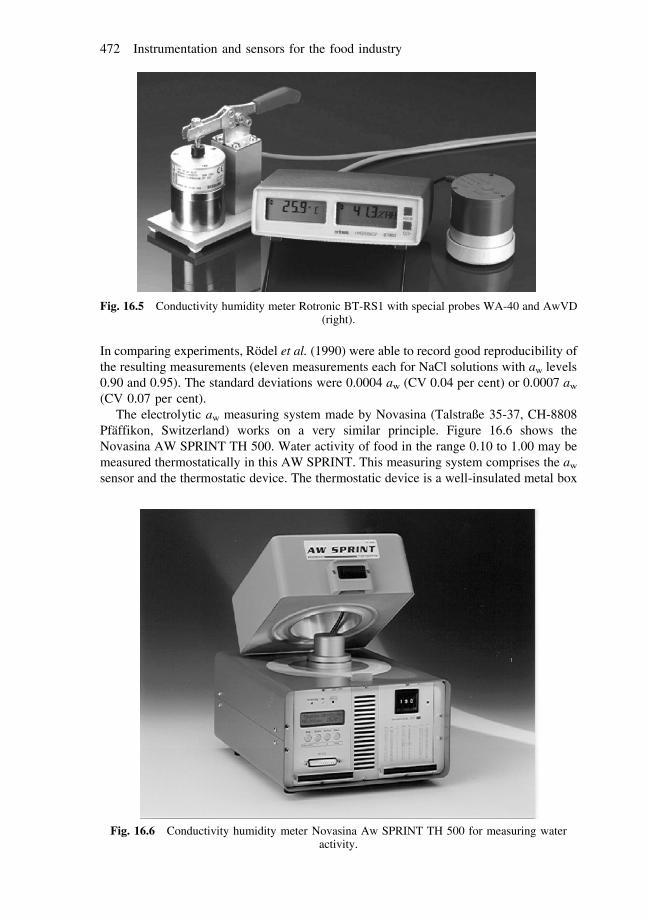
(CV 0.07 per cent).The electrolytic aw measuring system made by Novasina (Talstraße 35-37, CH-8808
Pfaffikon, Switzerland) works on a very similar principle. Figure 16.6 shows theNovasina AW SPRINT TH 500. Water activity of food in the range 0.10 to 1.00 may bemeasured thermostatically in this AW SPRINT. This measuring system comprises the aw
sensor and the thermostatic device. The thermostatic device is a well-insulated metal box
Fig. 16.5 Conductivity humidity meter Rotronic BT-RS1 with special probes WA-40 and AwVD(right).
Fig. 16.6 Conductivity humidity meter Novasina Aw SPRINT TH 500 for measuring wateractivity.
472 Instrumentation and sensors for the food industry
in which an air-cooled Peltier system thermostatically controls the interior, and thus thesensor and the sample, with great precision. This measuring system is independent of theambient temperature at the measurement location because of the thermostat, which iselectronically controlled. The serial interface (RS232) and a PC software Novalog allowsthe connection to a computer for signal monitoring and documentation of the aw-values.As tests on this system have shown, aw levels of foods may be determined with highreproducibility (±0.002 aw).
Dew-point hygrometerDecagon Devices, Inc. (P.O. Box 835, Pullman, Washington 99163, USA) offers a dew-point hygrometer for determining the water activity of various foods (Aqualab, ModelCX-3). The CX-3 determines the water activity of a 7-ml food sample by measuring thesample temperature and the dew point temperature of air in equilibrium with the sample.The water activity is computed as the ratio of saturation vapour pressure at dewpointtemperature to saturation vapour pressure at sample temperature. Both temperatures mustbe precisely measured in order to obtain an accurate water activity measurement. Sincethis method of determining water activity goes back to basic principles, no calibration ofthe CX-3 should be necessary. The sample temperature is measured with a smallthermopile sensor. A filter over the sensor limits the spectral response to the 8 to 14�mwaveband. All samples tend to have very high absorptivities and emissivities in thiswaveband, so the calibration of the infrared sensor should be almost independent of typeor visible colour of the sample. The resolution is ±0.001 and the accuracy is ±0.003 aw
(Richard and Labuza 1990; Roa and Tapia de Daza 1991, Voysey 1993; Harris 1995/96).
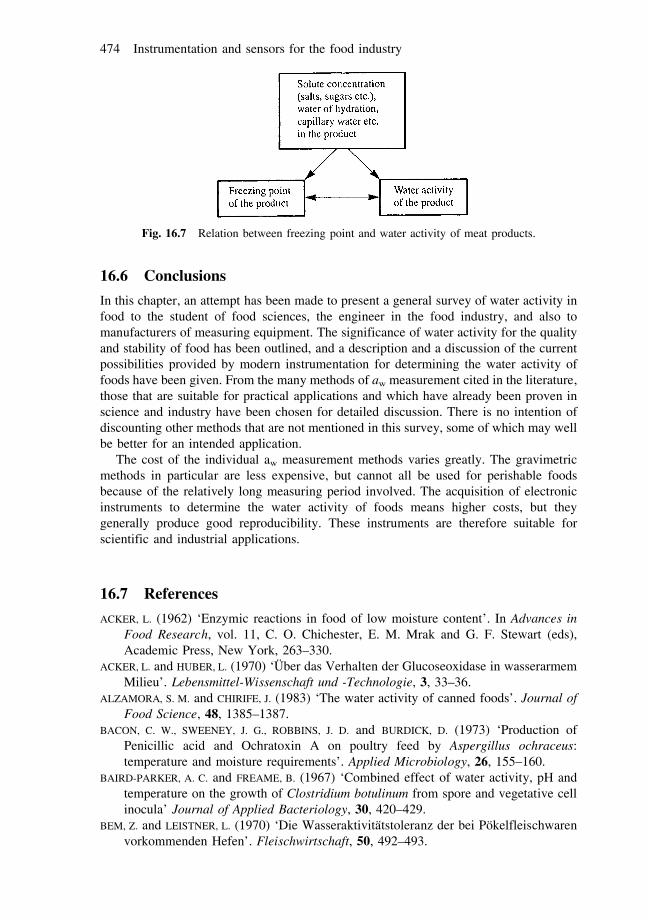
16.5.5 Thermometric techniqueThe freezing point of a food is closely linked in a physical/chemical sense with the wateractivity of the product, this being shown diagrammatically for meat products in Fig. 16.7.All those processes in a product that reduce the water activity also lower the freezingpoint of the food. The point at which foods begin to freeze can be measured and from thisthe aw level at 25ºC can be calculated. The aw Kryometer AWK-20, made by NagyMesssysteme GmbH (Siedlerstrasse 34, D-71126 Gaufelden-Nebringen, Germany) workson this principle. With this instrument water activity, particularly for meat products, canbe determined thermometrically. The measuring system includes an electronic indicatormodule with a microprocessor, a cylindrical sample chamber and a Peltier-cooling box ata temperature of approximately �50ºC. The measuring period for this cryoscopic aw teston meat products depends on the aw level. The higher the water activity of the sample, theshorter the measuring period. It is between about 8 and 30 minutes with an aw range from0.999 to 0.80.
Because the freezing point of a sample is identified without operator intervention, theequipment automatically finishes the measuring procedure after calculating anddisplaying the water activity level, and it is then ready to commence a new measurement.Sample-specific effects, for example from humectants such as glycerol or similarmaterials, do not pose any problem with thermometric aw measurement, and the methodhas very good reproducibility. When salt solutions with aw levels of 0.90 and 0.95 wereused, the standard deviation on eleven measurements was 0.0002 (CV 0.03 per cent) and0.0001 (CV 0.01 per cent), respectively (Rodel et al. 1990; Thumel 1993).
Water activity and its measurement in food 473
16.6 Conclusions
In this chapter, an attempt has been made to present a general survey of water activity infood to the student of food sciences, the engineer in the food industry, and also tomanufacturers of measuring equipment. The significance of water activity for the qualityand stability of food has been outlined, and a description and a discussion of the currentpossibilities provided by modern instrumentation for determining the water activity offoods have been given. From the many methods of aw measurement cited in the literature,those that are suitable for practical applications and which have already been proven inscience and industry have been chosen for detailed discussion. There is no intention ofdiscounting other methods that are not mentioned in this survey, some of which may wellbe better for an intended application.
The cost of the individual aw measurement methods varies greatly. The gravimetricmethods in particular are less expensive, but cannot all be used for perishable foodsbecause of the relatively long measuring period involved. The acquisition of electronicinstruments to determine the water activity of foods means higher costs, but theygenerally produce good reproducibility. These instruments are therefore suitable forscientific and industrial applications.
16.7 References
ACKER, L. (1962) ‘Enzymic reactions in food of low moisture content’. In Advances inFood Research, vol. 11, C. O. Chichester, E. M. Mrak and G. F. Stewart (eds),Academic Press, New York, 263–330.
ACKER, L. and HUBER, L. (1970) ‘Uber das Verhalten der Glucoseoxidase in wasserarmemMilieu’. Lebensmittel-Wissenschaft und -Technologie, 3, 33–36.
ALZAMORA, S. M. and CHIRIFE, J. (1983) ‘The water activity of canned foods’. Journal ofFood Science, 48, 1385–1387.
BACON, C. W., SWEENEY, J. G., ROBBINS, J. D. and BURDICK, D. (1973) ‘Production ofPenicillic acid and Ochratoxin A on poultry feed by Aspergillus ochraceus:temperature and moisture requirements’. Applied Microbiology, 26, 155–160.
BAIRD-PARKER, A. C. and FREAME, B. (1967) ‘Combined effect of water activity, pH andtemperature on the growth of Clostridium botulinum from spore and vegetative cellinocula’ Journal of Applied Bacteriology, 30, 420–429.
BEM, Z. and LEISTNER, L. (1970) ‘Die Wasseraktivitatstoleranz der bei Pokelfleischwarenvorkommenden Hefen’. Fleischwirtschaft, 50, 492–493.
Fig. 16.7 Relation between freezing point and water activity of meat products.
474 Instrumentation and sensors for the food industry
BENADO, A. L. and RIZVI, S. S. H. (1987) ‘Water activity calculation by direct measurementof vapor pressure’. Journal of Food Science, 52, 429–432.
BEUCHAT, L. R. (1974) ‘Combined effects of water activity, solute and temperature on thegrowth of Vibrio parahaemolyticus.’ Applied Microbiology, 27, 1075–1080.
BEUCHAT, L. R. (1983) ‘Influence of water activity on growth, metabolic activities andsurvival of yeasts and molds’. Journal of Food Protection, 46, 135–141.
BLANCHE KOELENSMID, W. A. A. and VAN RHEE, R. (1964) ‘Salmonella in meat products’.Annales de l’Institute Pasteur de Lille, 15, 85–97.
BONBERG, B. J. and DAVID, B. D. (1977) ‘HACCP models for quality control of entreeproduction in foodservice systems’. Journal of Food Protection, 40, 632–638.
BONE, D. (1973) ‘Water activity in intermediate moisture foods’. Food Technology, 27,71–76.
BOUSQUET-RICARD, M., QUAYLE, G., PHAM, T. and CHEFTEL, J. C. (1980) ‘Etude comparativecritique de trois methodes de mesure de l’activite de l’eau des aliments a humiditeintermediaire’. Lebensmittel-Wissenschaft und -Technologie, 13, 169–176.
BRACK, G. and ROCKEN, W. (1997) ‘Salmonellen & Co: Risiken bei ungebackenenFullungen in Feingeback vermeiden!’ ForschungsReport Ernahrung, Landwirtschaftund Forsten 1, 24–27.
BROWN, M. (2000) HACCP in the meat industry. Woodhead Publishing Limited,Cambridge.
BROWNLIE, L. E. (1966) ‘Effect of some environmental factors on psychrophilicmicrobacteria Journal of Applied Bacteriology, 29, 447–454.
BRYAN, F. L. (1980) ‘Foodborne disease in the United States associated with meat andpoultry’. Journal of Food Protection, 43, 140–150.
BULLOCK, K. and TALLENTIRE, A. (1952) ‘Bacterial survival in systems of low moisturecontent. Part 4: The effects of increasing moisture content on heat resistance,viability and growth of spores of B. subtilis’. Journal of Pharmacy andPharmacology, 4, 917–931.
BURCIK, E. (1950) ‘Uber die Beziehung zwischen Hydratur and Wachstum bei Bakerienand Hefen’. Archiv fur Mikrobiologie, 15, 203–235.
CHIRIFE, J. and FERRO FONTAN, C. (1982) ‘Water activity of fresh foods’. Journal of FoodScience, 47, 661–663.
CHIRIFE, J. and RESNIK, S. L. (1984) ‘Unsaturated solutions of sodium chloride as referencesources of water activity at various temperatures’. Journal of Food Science, 49,1486–1488.
CHRISTIAN, J. H. B. (1955a) ‘The influence of nutrition on the water relations of Salmonellaoranienburg’. Australian Journal of Biological Sciences, 8, 75–82.
CHRISTIAN, J. H. B. (1955b) ‘The water relations of growth and respiration of Salmonellaoranienburg at 30ºC’. Australian Journal of Biological Sciences, 8, 490–497.
CHRISTIAN, J. H. B. (1981) ‘Specific solute effects on microbial water relations’. In WaterActivity: Influences on Food Quality, L. B. Rockland and G. F. Stewart (eds),Academic, New York, 825–854.
CHRISTIAN, J. H. B. and SCOTT, W. J. (1953) ‘Water relations of salmonellae at 30ºC’.Australian Journal of Biological Sciences, 6, 565–573.
CHRISTIAN, J. H. B. and WALTHO, J. A. (1962) ‘The water relations of staphylococci andmicrococci’. Journal of Applied Bacteriology, 25, 369–377.
CHRISTIAN, J. H. B. and WALTHO, J. A. (1964) ‘The composition of Staphylococcus aureusin relation to the water activity of the growth medium’. Journal of GeneralMicrobiology, 35, 205–213.
Water activity and its measurement in food 475
DAVIES, R., BIRCH, G. G. and PARKER, K. J. (1976) Intermediate Moisture Foods, AppliedScience, London.
EMODI, A. S. and LECHOWICH, R. V. (1969) ‘Low temperature growth of type Clostridiumbotulinum spores. 1: Effects of sodium chloride, sodium nitrite and pH’. Journal ofFood Science, 34, 78–81.
FENNEMA, O. R. (1978) ‘Enzyme kinetics at low temperature and reduced water activity. InDried Biological Systems, J. H. Crowe and J. S. Clegg (eds), Academic Press, NewYork, 297–322.
FENNEMA, O. R. and BERNY, L. A. (1974) ‘Equilibrium vapor pressure and water activity offood at subfreezing temperatures’. Proceedings of the IV International Congress ofFood Science and Technology (Madrid), 2, 27–35.
FETT, H. M. (1973) ‘Water activity determination in foods in the range 0.80 to 0.99’.Journal of Food Science, 38, 1097–1098.
FLUCKIGER, W. and CLEVEN, F. (1978) ‘Wasseraktivitat. Ihre Bedeutung fur die Haltbarkeitvon Gebacken’. Backtechnik, 26, 13–15.
FOOD AND DRUG ADMINISTRATION (1979) ‘Current Good Manufacturing Practices’.Federal Register 44 (53): 16209, 44 (53): 16230, 44 (112): 33238. Washington DC,US Government Printing Office.
FOOD AND DRUG ADMINISTRATION (1985) Title 21 Code of Federal Regulations Parts 58,108, 113 and 114. Washington DC, US Government Printing Office.
GAREIS, M. and RODEL, W. (2000) ‘Produktion von Ochratoxin A in Abhangigkeit vonWasseraktivitat und Wassergehalt’. Jahresbericht der BAFF Kulmbach, 1999, 64–65.
GENIGEORGIS, C. and SADLER, W. W. (1966) ‘Effect of sodium chloride and pH onenterotoxin B production’. Journal of Bacteriology, 92, 1383–1387.
GENIGEORGIS, C., RIEMANN, H. and SADLER, W. W. (1969) ‘Production of enterotoxin B incured meats’. Journal of Food Science, 34, 62–68.
GENIGEORGIS, C., FODA, M. S., MANTIS, A. and SADLER, W. W. (1971) ‘Effect of sodiumchloride and pH on enterotoxin C production’. Applied Microbiology, 21, 862–866.
GERSCHENSON, L., FAVETTO, G. and CHIRIFE, J. (1984) ‘Influence of organic volatilesduring water activity measurement with a fiber-dimensional hygrometer’.Lebensmittel-Wissenschaft und -Technologie, 17, 342–344.
GIESE, J. (1997) ‘Water activity: the new critical measurement’. Food Technology, 51, 93.GOUGH, B. J. and ALFORD, J. A. (1965) ‘Effect of curing agents on the growth and survival
of food-poisoning strains of Clostridium perfringens’. Journal of Food Science, 30,1025–1028.
GREENSPAN, L. (1977) ‘Humidity fixed points of binary saturated aqueous solutions’.Journal of Research of the National Bureau of Standards A, Physics and Chemistry,81A (1), 89–96.
GROSSKLAUS, D. (1977) ‘Lebensmittelhygienische Aspekte der Zoonosenbekampfung’.Fleischwirtschaft, 57, 1649, 1652.
GUR-ARIEH, C., NELSON, A. I., STEINBERG, M. P. and WEI, L. S. (1965) ‘A method for rapiddeterminations of moisture adsorption isotherms of solid particles’. Journal of FoodScience, 30, 105–110.
HARRIS, G.A. (1995) ‘Food water relations’. Food Tech Europe Dec 95/Jan 96, 96–98.HARWIG, J. and CHEN, Y. K. (1974) ‘Some conditions favoring production of ochratoxin A
and citrinin by Penicillium viridicatum in wheat and barley’. Canadian Journal ofPlant Science, 54, 17–22.
HEISS, R. and EICHNER, K. (1971) ‘Die Haltbarkeit von Lebensmitteln mit niedrigen and
476 Instrumentation and sensors for the food industry
mittleren Wassergehalten’. Chemie Mikrobiologie Technologie der Lebensmittel, 1,33–40.
HILSHEIMER, R. and HAUSCHILD, A. H. W. (1985) ‘A modified method for ascertainingwater activities within defined limits’. Journal of Food Protection, 48, 325–326.
HOBBS, B. C. (1965) ‘Clostridium welchii as a food poisoning organism’. Journal ofApplied Bacteriology, 28, 74–82.
HUNTER, I. R., HOUSTON, D. F. and KESTER, E. B. (1951) ‘Development of free fatty acidsduring storage of brown (husked) rice’. Cereal Chemistry, 28, 232–239.
JAKOBSEN, M. (1983) ‘Filament hygrometer for water activity measurement:interlaboratory evaluation’. Journal of the Association of the Official AnalyticalChemists, 66, 1106–1111.
JAKOBSEN, M., FILTENBORG, O. and BRAMSNAES, F. (1972) ‘Germination and outgrowth ofthe bacterial spore in the presence of different solutes’. Lebensmittel-Wissenschaftund -Technologie, 5, 159–162.
JAKOBSEN, M. and MURRELL, W. G. (1977) ‘The effect of water activity and aw-controllingsolute on sporulation of Bacillus cereus T’. Journal of Applied Bacteriology, 43,239–245.
JOHNSTON, M. R. and LIN, R. C. (1987) ‘FDA views on the importance of aw in goodmanufacturing practice’. In Water Activity: Theory and Application to Food, L. B.Rockland and L. R. Beuchat (eds), Marcel Dekker, New York, 287–294.
KANG, CH. K., WOODBURN, M., PAGENKOPF, A. and CHENY, R. (1969) ‘Growth, sporulation,and germination of Clostridium perfringens in media of controlled water activity’.Applied Microbiology, 18, 798–805.
KARMAS, E. and CHEN, C. C. (1975) ‘Relationship between water activity and water bindingin high and intermediate moisture foods’. Journal of Food Science, 40, 800–801.
KAUFMANN, F. L. and SCHAFFNER, R. M. (1974) ‘Hazard analysis, critical control points andgood manufacturing practices regulations (sanitation) in food plant inspections’.Proceedings of the IVth International Congress on Food Science and Technology,402–407.
KITIC, D., PEREIRA JARDIM, D. C., FAVETTO, G. J., RESNIK, S. L. and CHIRIFE, J. (1986)‘Theoretical prediction of the water activity of standard saturated salt solutions atvarious temperatures’. Journal of Food Science, 51, 1037–1041.
KRAUSS, H. and WEBER, A. (1986) Zoonosen. Deutscher Arzt, Koln.KRISPIEN, K. and RODEL, W. (1976) ‘Bedeutung der Temperatur fur den aw-Wert von
Fleisch and Fleischerzeugnissen’. Fleischwirtschaft, 56, 709–714.KUSHNER, D. J. (1968) ‘Halophilic bacteria In Advances in Applied Microbiology, W. W.
Umbreit and D. Periman (eds), Academic Press, New York, 73–99.KVAALE, O. and DALHOFF, E. (1963) ‘Determination of the equilibrium relative humidity
of foods’. Food Technology, 17, 151–153.LABUZA, T. P., CASSIL, S. and SINSKEY, A. J. (1972a) ‘Stability of intermediate moisture
foods. 2: Microbiology’. Journal of Food Science, 37, 160–162.LABUZA, T. P., MCNALLY, L., GALLAGHER, D., HAWKES, J. and HURTADO, F. (1972b) ‘Stability of
intermediate moisture foods. 1: Lipid oxidation’. Journal of Food Science, 37, 154–159.LABUZA, T. P., KREISMAN, L. N., HEINZ, C. A. and LEWICKI, P. P. (1977) ‘Evaluation of the
Abbeon cup analyzer compared to the VPM and FettVos methods for water activitymeasurement’. Journal of Food Processing and Preservation, 1, 32–41.
LANDROCK, A. H. and PROCTOR, B. E. (1951) ‘A new graphical interpolation method forobtaining humidity equilibria data, with special reference to its role in foodpackaging studies’. Food Technology, 5, 332–337.
Water activity and its measurement in food 477
LANG, K. W., MCCUNE, T. D. and STEINBERG, M. P. (1981) ‘A proximity equilibration cellfor rapid determination of sorption isotherms’. Journal of Food Science, 46, 936–938.
LANIGAN, G. W. (1963) ‘Silage bacteriology. 1: Water activity and temperaturerelationships of silage strains of Lactobacillus plantarum, Lactobacillus brevis,and Pediococcus cerevisiae’. Australian Journal of Biological Sciences, 16, 606–615.
LEGAULT, R. R., MAKOWER, B. and TALBURT, W. F. (1948) ‘Apparatus for measurement ofvapor pressure’. Analytical Chemistry, 20, 428–430.
LEISTNER, L. (1977) ‘Microbiology of ready-to-serve foods’. In How Ready Are Ready-to-Serve Foods?, K. Paulus (ed), Karger, Basel, 260–272.
LEISTNER, L. (1978) ‘Hurdle effect and energy saving’. In Food Quality and Nutrition, W.K. Downey (ed), Applied Science, London, pp. 553–557.
LEISTNER, L. and RODEL, W. (1975) ‘The significance of water activity for micro-organisms in meats’. In Water Relations of Foods, R. B. Duckworth (ed), Academic,London, 309–323.
LEISTNER, L. and RODEL, W. (1976a) ‘Inhibition of micro-organisms in food by wateractivity’. In Inhibition and Inactivation of Vegetative Microbes, F. A. Skinner andW. B. Hugo (eds), Academic, London, 219–237.
LEISTNER, L. and RODEL, W. (1976b) ‘The stability of intermediate moisture foods withrespect to micro-organisms’. In Intermediate Moisture Foods, R. Davies, G. G. Birchand K. J. Parker (eds), Applied Science, London, 120–137.
LEISTNER, L., RODEL, W. and KRISPIEN, K. (1981) ‘Microbiology of meat products in high-and intermediate-moisture ranges’. In Water Activity: Influences on Food Quality, L.B. Rockland and G. F. Stewart (eds), Academic, New York, 855–916.
LENART, A. and FLINK, J. M. (1983) ‘An improved proximity equilibration cell method formeasuring water activity of foods’. Lebensmittel-Wissenschaft und -Technologie, 16,84–89.
LEWICKI, P. P., BUSK, G. C., PETERSON, P. L. and LABUZA, T. P. (1978) ‘Determination offactors controlling accurate measurement of aw by the vapor pressure manometrictechnique’. Journal of Food Science, 43, 244–246.
LIMSONG, S. and FRAZIER, W. C. (1966) ‘Adaptation of Pseudomonas fluorescens to lowlevels of water activity produced by different solutes’. Applied Microbiology, 14,899–901.
LOTTER, L. P. and LEISTNER, L. (1978) ‘Minimal water activity for enterotoxin Aproduction and growth of Staphylococcus aureus’. Applied and EnvironmentalMicrobiology, 36, 377–380.
LOTZSCH, R. and LEISTNER, L. (1977) ‘Uberleben von Trichinella spiralis in Rohwurst andRohschinken in Abhangigkeit von der Wasseraktivitat (aw-Wert)’. Proceedings ofthe XXIIIrd European Congress of Meat Research Workers, Moscow, 16.
LOTZSCH, R. and RODEL, W. (1974) ‘Untersuchungen uber die Lebensfahigkeit vonTrichinella spiralis in Rohwursten in Abhangigkeit von der Wasseraktivitat’.Fleischwirtschaft, 54, 1203–1208.
LOTZSCH, R. and TRAPPER, D. (1979) ‘Minimale Wasseraktivitaten (aw-Werte) fur dieBildung von zehn Mykotoxinen bei Penicillium spp’. Poster at the 4th InternationalIUPAC Symposium on Mycotoxins and Phycotoxins, Lausanne.
MALONEY, J. F., LABUZA, T. P., WALLACE, D. H. and KAREL, M. (1966) ‘Autoxidation ofmethyl linoleate in freeze-dried model systems. I: Effect of water on the auto-catalyzed oxidation’. Journal of Food Science, 31, 878–884.
478 Instrumentation and sensors for the food industry
MARCOS, A., ALCALA, M., LEON, F., FERNANDEZ-SALGUERO, J. and ESTABAN, M. A. (1981)‘Water activity and chemical composition of cheese’. Journal of Dairy Science, 64,622–626.
MARCOS-ESTEBAN, B. (1997) ‘Simple method for determination of water activity over therange of microbial growth’. Alimentaria, 284, 25–277.
MARSHALL, B. J., OHYE, D. F. and CHRISTIAN, J. H. B. (1971) ‘Tolerance of bacteria to highconcentrations of NaCl and glycerol in the growth medium’. Applied Microbiology,21, 363–364.
MATZ, S. A. (1965) Water in Foods. AVI, Westport, CT.MCCUNE, T. D., LANG, K. W. and STEINBERG, M. P. (1981) ‘Water activity determination with
the proximity equilibration cell’. Journal of Food Science, 46, 1978–1979.MCLEAN, R. A., LILLY, H. D. and ALFORD, J. A. (1968) ‘Effects of meat-curing salts and
temperature on production of staphylococcal enterotoxin B’. Journal ofBacteriology, 95, 1207–1211.
MORAN, T. (1936) ‘The state of water in tissues’. Report of the Food Investigation Boardfor the Year 1935, HMSO, London, 20–24.
MOSSEL, D. A. A. (1969) ‘Nahrungsmittel als Umwelt fur Mikroorganismen, dieLebensmittel gesundheitsschadlich machen’. Alimenta, 8, 8–16.
MULTON, J. L., SAVET, B. and BIZOT, H. (1980) ‘A fast method for measuring the activity ofwater in foods’. Lebensmittel-Wissenschaft und -Technologie, 13, 271–273.
NORTHOLT, M. D. and HEUVELMAN, C. J. (1982) ‘The salt crystal liquefaction test: a simplemethod for testing the water activity of foods’. Journal of Food Protection, 45, 537–540, 546.
NORTHOLT, M. D., VAN EGMOND, H. P. and PAULSCH, W. E. (1977) ‘Differences betweenAspergillus flavus strains in growth and aflatoxin B1 production in relation to wateractivity and temperature’. Journal of Food Protection, 40, 778–781.
NUNES, R. V., URBINCAIN, M. J. and ROTSTEIN, E. (1985) ‘Improving accuracy and precisionof water activity measurements with a water vapor pressure manometer’. Journal ofFood Science, 50, 148–149.
OHYE, D. F. and CHRISTIAN, J. H. B. (1967) ‘Combined effects of temperature, pH and wateractivity on growth and toxin production by Cl. botulinum types A, B, and E’.Proceedings of the 5th International Symposium of Food Microbiology, Moscow,1966, 217–223.
OHYE, D. F. CHRISTIAN, J. H. B. and SCOTT, W. J. (1967) ‘Influence of temperature on thewater relations of growth of Cl. botulinum type E’. Proceedings of the 5thInternational Symposium of Food Microbiology, Moscow, 1966, 136–143.
PALACHA, Z. and FLINK, J. M. (1987) ‘Revised PEC method for measuring water activity’.Journal of Food Science and Technology, 22, 485–490.
PITT, J. I. (1975) ‘Xerophilic fungi and the spoilage of foods of plant origin’. In WaterRelations of Foods, R. B. Duckworth (ed), Academic, London, 273–307.
PITT, J. I. and CHRISTIAN, J. H. B. (1968) ‘Water relations of xerophilic fungi isolated fromprunes’. Applied Microbiology, 16, 1853–1858.
PIVNICK, H. and THATCHER, F. S. (1968) ‘Microbial problems in food safety with particularreference to Clostridium botulinum’. In The Safety of Foods, AVI, Westport, CT,121–140.
POLLIO, M. L., KITIC, D., FAVETTO, G. J. and CHIRIFE, J. (1986) ‘Effectiveness of availablefilters for an electric hygrometer for measurement of water activity in the foodindustry’. Journal of Food Science, 51, 1358–1359.
POLLIO, M. L., KITIC, D., FAVETTO, G. J. and CHIRIFE, J. (1987) ‘Prediction and measurement
Water activity and its measurement in food 479
of the water activity of selected saturated salt solutions at 5C and 10ºC’. Journal ofFood Science, 52, 1118–1119.
PRIOR, B. A. (1979) ‘Measurement of water activity in foods: a review’. Journal of FoodProtection, 42, 668–674.
RESNIK, S. L., FAVETTO, G. J., CHIRIFE, J. and FERRO FONTAN, C. (1984) ‘A world survey ofwater activity of selected saturated salt solutions used as standards at 25ºC’. Journalof Food Science, 49, 510–513.
RICHARD, J. and LABUZA, T. P. (1990) ‘Rapid determination of the water activity of somereference solutions, culture media , and cheese using a new instrument based on thedew-point method’. Science des Aliments, 10, 57–64.
RIEMANN, H. (1963) ‘Safe heat processing of canned cured meats with regard to bacterialspores’. Food Technology, 17, 39–49.
ROA, V. and MARIA S. TAPIA DE DAZA (1991) ‘Evaluation of water activity measurements withdew point electronic humidity meter’. Lebensmittel-Wissenschaft und -Technologie.,24, 208–213.
ROBINSON, R. A. and STOKES, R. H. (1965) Electrolyte Solutions. Butterworth, London.RODEL, W. (1975) ‘Einstufung von Fleischerzeugnissen in leicht verderbliche,
verderbliche and lagerfahige Produkte aufgrund des pH-Wertes und aw Wertes’.Dissertation (thesis), Freie Universitat Berlin, West Germany.
RODEL, W. and KRISPIEN, K. (1977) ‘Der Einfluß von Kuhl- and Gefriertemperaturen aufdie Wasseraktivitat (aw-Wert) von Fleisch and Fleischerzeugnissen’. Fleisch-wirtschaft, 57, 1863–1867.
RODEL, W. and LEISTNER, L. (1971) ‘Ein einfacher aw-Wert-Messer fur die Praxis’.Fleischwirtschaft, 51, 1800–1802.
RODEL, W. and LUCKE, F. -K. (1983) ‘Vermehrung von Staphylococcus aureus andSalmonella spp. bei niedriger Wasseraktivitat’. Mitteilungsblatt der Bundesanstaltfur Fleischforschung, Kulmbach, 82, 5707–5714.
RODEL, W. and SCHEUER, R. (1999a) ‘Redox potential of meat and meat products. 1.Physicochemical basis, determination and evaluation of the redox potential’.Fleischwirtschaft International, 1, 38–41.
RODEL, W. and SCHEUER, R. (1999b) ‘Redox potential of meat and meat products. 2.Typical redox potentials of meat and meat products’. Fleischwirtschaft International,3, 29–32.
RODEL, W. and SCHEUER, R. (2000a) ‘Redox potential of meat and meat products. 3.Control of redox potential during meat processing. Effects of pH value, sodiumnitrite, sodium ascorbate, sodium lactate and atmospheric oxygen’. FleischwirtschaftInternational, 1, 40–43.
RODEL, W. and SCHEUER, R. (2000b) ‘Redox potential of meat and meat products. 4.Recording criteria of quality in meat and meat products by measuring the redoxpotential’. Fleischwirtschaft International, 2, 46–48.
RODEL, W. and STIEBING, A. (1987) ‘Kontinuierliche Messung des Reifungsverlaufs vonRohwurst’. Fleischwirtschaft, 67, 1202–1211.
RODEL, W., HERZOG, H. and LEISTNER, L. (1973) ‘Wasseraktivitats-Toleranz vonlebensmittelhygienisch wichtigen Keimarten der Gattung Vibrio’. Fleischwirtschaft,53, 1301–1303.
RODEL, W., KRISPIEN, K. and LEISTNER, L. (1979) ‘Messung der Wasseraktivitat (aw-Wert)von Fleisch and Fleischerzeugnissen’. Fleischwirtschaft, 59, 831–836.
RODEL, W., KRISPIEN, K. and LEISTNER, L. (1980) ‘Die Wasseraktivitat von Fetten tierischerHerkunft’. Fleischwirtschaft, 60, 642, 644–648, 650.
480 Instrumentation and sensors for the food industry
RODEL, W., PONERT, H. and LEISTNER, L. (1975) ‘Verbesserter aw,-Wert-Messer zurBestimmung der Wasseraktivitat (aw-Wert) von Fleisch und Fleischwaren’.Fleischwirtschaft, 55, 557–558.
RODEL, W., SCHEUER, R. and WAGNER, H. (1990) ‘Neues Verfahren zur Bestimming derWasseraktivitat bei Fleischerzeugnissen.’ Mitreilungsblatt des Bundesanstalt fuFleischforschung, Kulmbach, 100, 7979–7986.
RODEL, W., SCHEUER, R. and WAGNER, H. (1990) ‘A new method of determining wateractivity in meat products’. Fleischwirtsch. 70, 905–907.
ROSS, K. D. (1975) ‘Estimation of water activity in intermediate moisture foods’. FoodTechnology, 2, 26–34.
RUEGG, M. and BLANC, B. (1977) ‘Beziehungen zwischen Wasseraktivitat, Wasser-Sorptionsvermogen und Zusammensetzung von Kase’. Milchwissenschaft, 32, 193–201.
RUEGG, M. and BLANC, B. (1981) ‘Influence of water activity on the manufacture andageing of cheese’. In Water activity: Influences on Food Quality, L. B. Rockland andG. F. Stewart (eds), Academic, New York, 791–823.
SAGUY, I. and DREW, B. (1987) ‘Statistical calibration of instruments using water activitydetermination as an example’. Journal of Food Science, 52, 767–771.
SCHMIDT, U. and RODEL, W. (1987) ‘Einfluß der Wasseraktivitat (aw-Wert) auf dasUberleben der Rinderfinne (Cysticercus bovis)’. Mitteilungsblatt der Bundesanstaltfur Fleischforschung, Kulmbach, 97, 7550–7556.
SCOTT, W. J. (1953) ‘Water relations of Staphylococcus aureus at 30ºC’. AustralianJournal of Biological Sciences, 6, 549–564.
SCOTT, W. J. (1957) ‘Water relations of food spoilage microorganisms’. In Advances inFood Research, vol. VII, E. M. Mrak and G. F. Stewart (eds), Academic Press, NewYork, 83–127.
SEGNER, W. P., SCHMIDT, C. F. and BOLTZ, J. K. (1966) ‘Effect of sodium chloride and pH onthe outgrowth of spores of type E Clostridium botulinum at optimal and suboptimaltemperatures’. Applied Microbiology, 14, 49–54.
SEGNER, W. P., SCHMIDT, C. F. and BOLTZ, J. K. (1971) ‘Minimal growth temperature, sodiumchloride tolerance, pH sensitivity, and toxin production of marine and terrestrial strainsof Clostridium botulinum type C’. Applied Microbiology, 22, 1025–1029.
SHARPE, A.N., DIOTTE, M.P. and DUDAS, I. (1991) ‘Water activity tester suited to complianceand high aw work’. Journal of Food Protection, 54, 277–282.
SIMATOS, D. and MULTON, J. L. (1985) Properties of Water in Foods in Relation to Qualityand Stability. Martinus Nijhoff, Dordrecht.
SMITH, P. R. (1965) ‘A new apparatus for the study of moisture sorption by starches andother foodstuffs in humidified atmospheres’. In Humidity and Moisture, A. Wexlerand W. A. Wildhack (eds), Reinhold, New York, 487–494.
SNOW, D. (1949) ‘The germination of mould spores at controlled humidities’. Annals ofApplied Biology, 36, 1–13.
SOOD, V. C. and HELDMAN, D. R. (1974) ‘Analysis of a vapor pressure manometer formeasurement of water activity in nonfat dry milk’. Journal of Food Science, 39,1011–1013.
STAMP, J. A., LINSCOTT, S., LOMAURO, C. and LABUZA, T. P. (1984) ‘Measurement of wateractivity of salt solutions and foods by several electronic methods as compared todirect vapor pressure measurement’. Journal of Food Science, 49, 1139–1142.
STEELE, R. J. (1987) ‘Use of polyols to measure equilibrium relative humidity’.International Journal of Food Science and Technology, 22, 377–384.
Water activity and its measurement in food 481
STIEBING, A. and RODEL, W. (1989) ‘Kontinuierliches Messen der Oberflachen-Wasser-aktivitat von Rohwurst’. Mitteilungsblatt der Bundesanstalt fur Fleischforschung,Kulmbach, 104, 221–227.
STILLE, B. (1948) ‘Grenzwerte der relativen Feuchtigkeit und des Wassergehaltesgetrockneter Lebensmittel fur den mikrobiellen Befall’. Zeitschrift fur Lebensmittel-untersuchung und -Forschung, 88, 9–12.
STOLOFF, L. (1978) ‘Processed vegetable products. Calibration of water activitymeasurement instruments and devices: collaborative study’. Journal of theAssociation of the Official Analytic Chemists, 61, 1166–1178.
STOREY, R. M. and STAINSBY, G. (1970) ‘The equilibrium water vapour pressure of frozencod’. Journal of Food Technology, 5, 157–163.
STRONG, D. H., FOSTER, E. F. and DUNCAN, C. L. (1970) ‘Influence of water activity on thegrowth of Clostridium perfringens’. Applied Microbiology, 19, 980–987.
STROUP, W. H., PEELER, J. T. and SMITH, K. (1987) ‘Evaluation of precision estimates forfiber-dimensional and electrical hygrometers for water activity determinations’.Journal of the Association of the Official Analytic Chemists, 70, 955–957.
TAYLOR, A. A. (1961) ‘Determination of moisture equilibria in dehydrated foods’. FoodTechnology, 15, 536–540.
THUMEL, H. (1993) ‘Die Kryoskopie-ein neues alternatives Verfahren zur Bestimmung derWasseraktivitat bei Fleischerzeugnissen’. Fleischerei-Technik, 9, 174–177.
TOMCOV, D., BERN, Z. and LEISTNER, L. (1974) ‘Minimalne aw vrednosti odabranihbakterijskih vrsta’ rim, 6, 39.
TROLLER, J. A. (1971) ‘Effect of water activity on enterotoxin B production and growth ofStaphylococcus aureus’. Applied Microbiology, 21, 435–439.
TROLLER, J. A. (1972) ‘Effect of water activity on enterotoxin A production and growth ofStaphylococcus aureus’. Applied Microbiology, 24, 440–443.
TROLLER, J. A. (1983a) ‘Methods to measure water activity’. Journal of Food Protection,46, 129–134.
TROLLER, J. A. (1983b) ‘Water activity measurements with a capacitance manometer’.Journal of Food Science, 48, 739–741.
TROLLER, J. A. and CHRISTIAN, J. H. B. (1978) Water Activity and Food, Academic Press,New York.
VAN DEN BERG, I. C. (1975) ‘Thermodynamical aspects of water activity in intermediatemoisture foods’. Course on Intermediate Moisture Foods Cycle CPCIA Europe,Seminaire E.5.
VANSTEENKISTE, J. P. and VAN HOOF, J. (1982) ‘Measurement of water activity of drysausages: a comparison of the isopiestic method and the electric hygrometer’. Archivfur Lebensmittelhygiene, 33, 116–118.
VOS, P. T. and LABUZA, T. P. (1974) ‘Technique for measurement of water activity in thehigh aw range’. Journal of Agricultural and Food Chemistry, 22, 326–327.
VOYSEY, P. (1993) ‘An evaluation of the Aqualab CX-2 system for measuring wateractivity.’ Digest, 124–125.
WEISSER, H., ROTH, TH. and HARZ, H. -P. (1985) ‘Spezielle Methoden zum Bestimmen derWasseraktivitat’. Zeitschrift fur Lebensmittel-Technologie und -Verfahrenstechnik, 3,170, 172, 176, 178–179.
WILLIAMS, O. B. and PURNELL, H. G. (1953) ‘Spore germination, growth, and sporeformation by Clostridium botulinum in relation to the water content of the substrate’.Food Research, 18, 35–39.
WODZINSKI, R. J. and FRAZIER, W. C. (1960) ‘Moisture requirements of bacteria I: Influence
482 Instrumentation and sensors for the food industry
of temperature and pH on requirements of Pseudomonas fluorescens’. Journal ofBacteriology, 79, 572–578.
WODZINSKI, R. J. and FRAZIER, W. C. (1961) ‘Moisture requirements of bacteria III:Influence of temperature, pH, and malate and thiamine concentration onrequirements of lactobacillus viridescens’. Journal of Bacteriology, 81, 359–365.
WOLF, W. (1984) ‘Ermittlung des aw Wertes in Lebensmittelproben’. Getreide Mehl undBrot, 38, 116–119.
YAMADA, J., TANAKA, A., SHINKURA, Y. and AIBARA, K. (1984) ‘Influence of ethanol ondetermination of water activity’. Journal of Food Hygienic Society of Japan, 25,118–124.
ZAZONI B., PERI, C., GIOVANELLI, G. and PAGLIARINI, E. (1999) ‘Design and setting up of awater vapour pressure capacitance manometer for measurement of water activity’.Journal of Food Engineering, 38, 407–423.
n.n. Directive 93/43/EEC (14.06.1993). Hygiene of Foodstuffs.
Water activity and its measurement in food 483