Embed Size (px)
Citation preview
Water activity measurement:
demonstration of a single and
non-specific optimal storage
value for orthodox forest seeds
ISTA Congress, Köln June16-20
Session 3
Fabienne COLAS, Direction de la recherche forestière, Québec
Patrick BALDET, Cemagref, France
Michèle BETTEZ, Centre de semences for. de Berthier, Québec
1. Water activity : definition & concept
• aw is an image of the thermodynamic activity of water
– aw is the ratio between the relative vapour pressure of a given sample “ps” and the one of pure water “p”.
– aw ranges from 0 to 1 (pure water).
• aw is equivalent to “equilibrium relative humidity (ERH)” and a function of “water potential (Ψ)”.
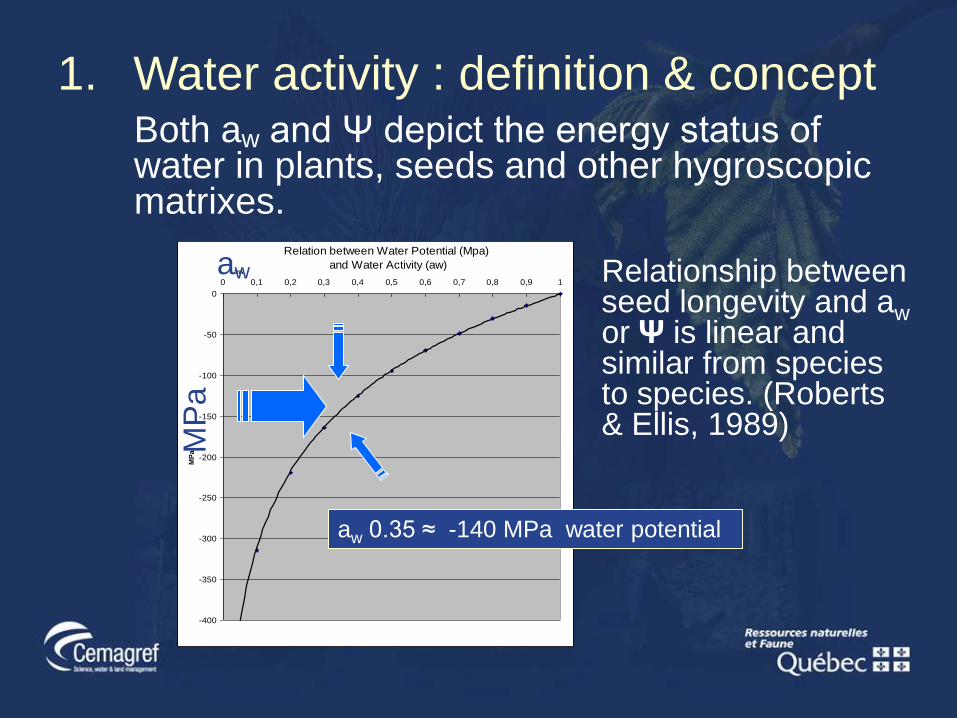
Both aw and Ψ depict the energy status of water in plants, seeds and other hygroscopic matrixes.
Relation between Water Potential (Mpa)
and Water Activity (aw)
-400
-350
-300
-250
-200
-150
-100
-50
0
0 0,1 0,2 0,3 0,4 0,5 0,6 0,7 0,8 0,9 1
aw
MP
a
aw
MP
a
aw 0.35 ≈ -140 MPa water potential
Relationship between seed longevity and awor Ψ is linear and similar from species to species. (Roberts & Ellis, 1989)
1. Water activity : definition & concept
1. Water activity : definition & concept
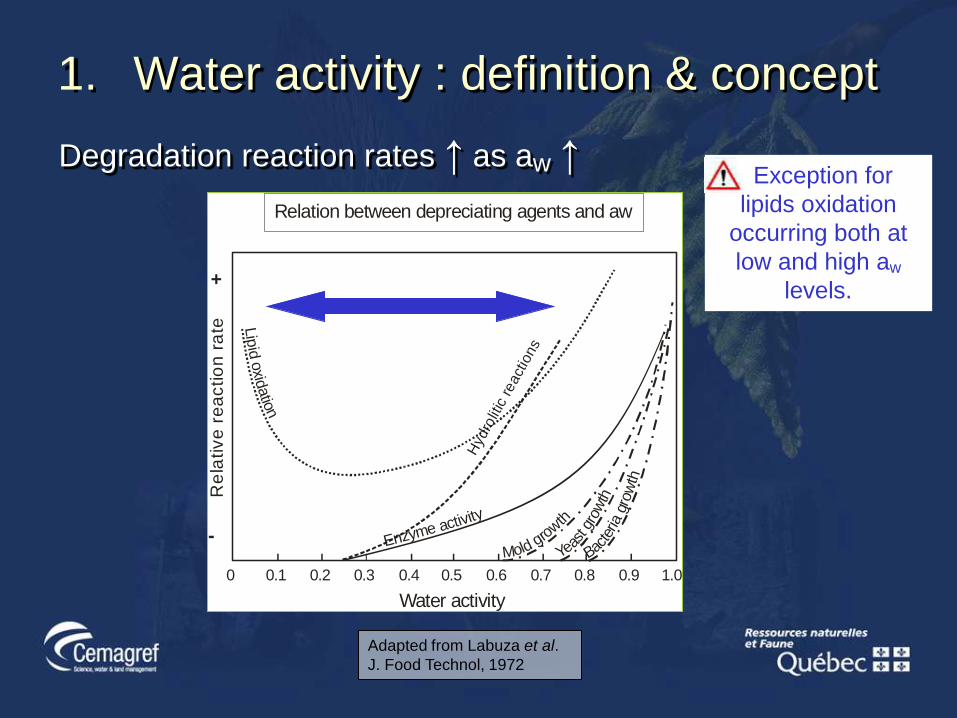
Degradation reaction rates ↑ as aw ↑
Hyd
rolit
ic react
ions
+
-
Re
lative
re
actio
n r
ate
Water activity
0 0.1 0.2 0.3 0.4 0.5 0.6 0.7 0.8 0.9 1.0
Lip
id o
xidatio
n
Mold growth
Yeast g
row
th
Bacte
ria g
row
th
Enzyme activity
Relation between depreciating agents and aw
Adapted from Labuza et al.
J. Food Technol, 1972
Exception for
lipids oxidation
occurring both at
low and high aw
levels.
1. Water activity : definition & concept
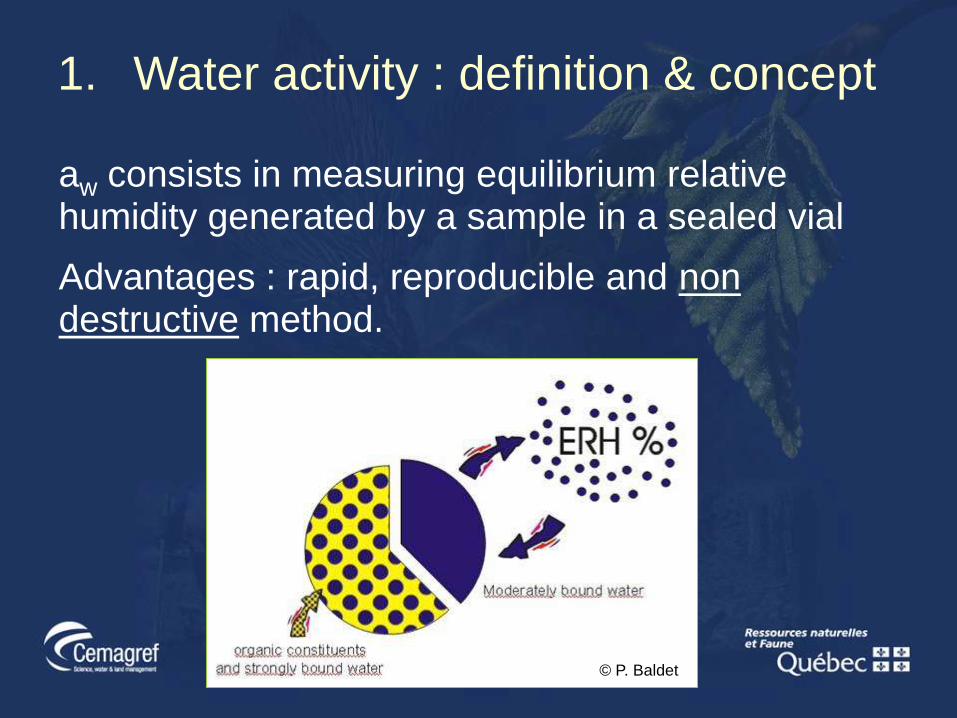
aw consists in measuring equilibrium relative humidity generated by a sample in a sealed vial
Advantages : rapid, reproducible and non destructive method.
© P. Baldet
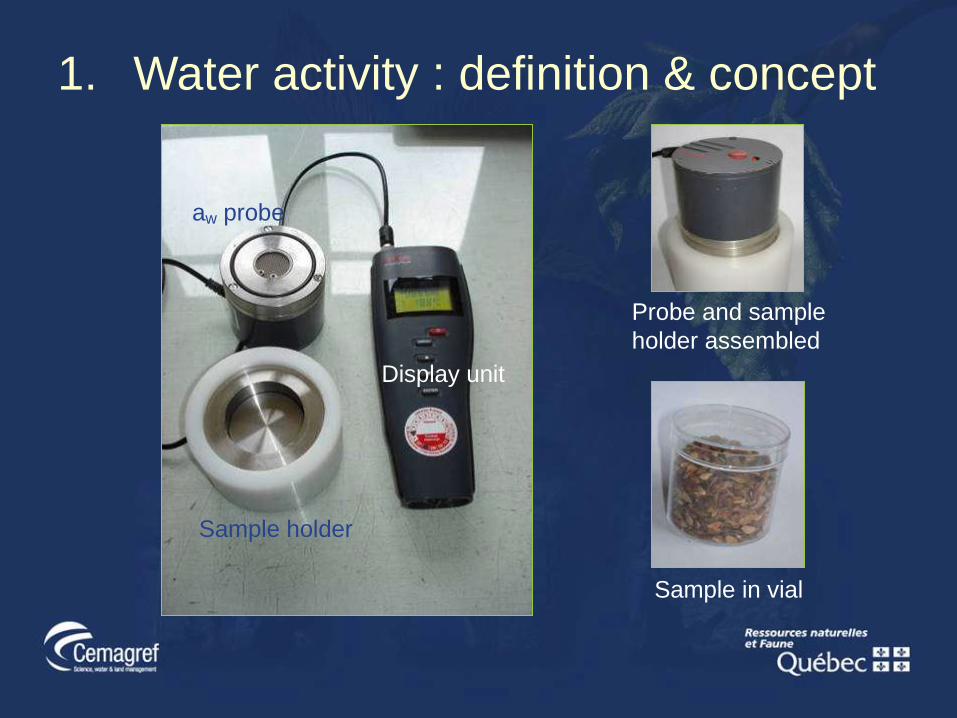
Sample in vial
aw probe
Sample holder
Display unit
Probe and sample
holder assembled
1. Water activity : definition & concept

1. Water activity : definition & concept
• Water behaviour in seeds can be described with moisture sorption isotherms obtained experimentally.
• Each isotherm is specific of the tested sample. A given matter may have a significant intra specific variability implying replication of isotherms.
• For a given ERH or aw corresponds a resultingmoisture content.
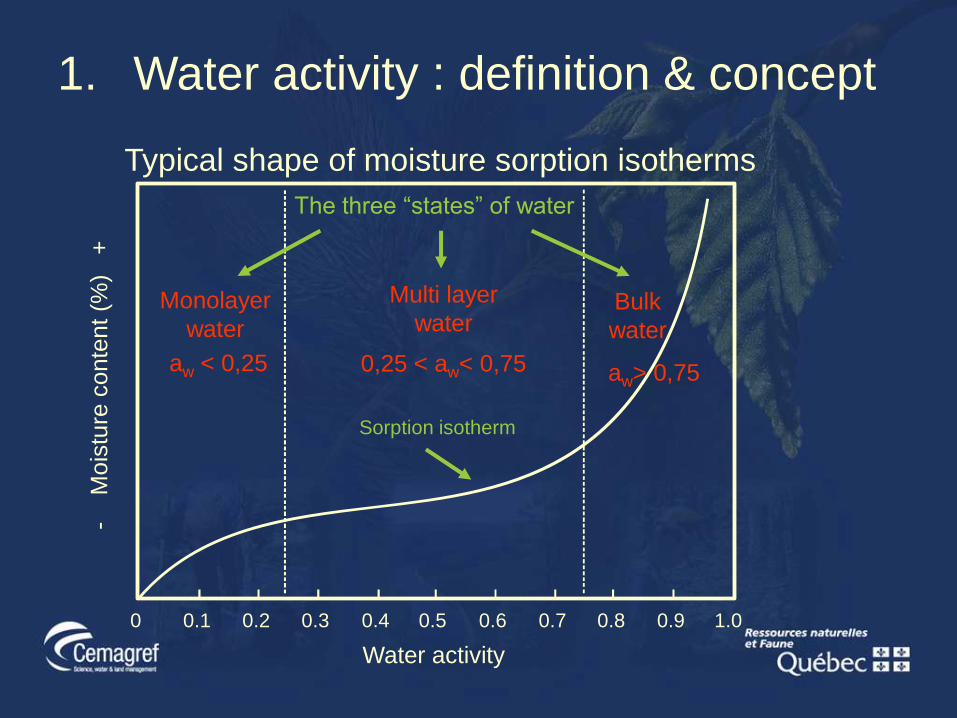
Typical shape of moisture sorption isotherms
The three “states” of water
Water activity
0 0.1 0.2 0.3 0.4 0.5 0.6 0.7 0.8 0.9 1.0
Sorption isotherm
-M
ois
ture
conte
nt
(%)
+
Monolayer
water
aw < 0,25
Multi layer
water
0,25 < aw< 0,75
Bulk
water
aw> 0,75
1. Water activity : definition & concept
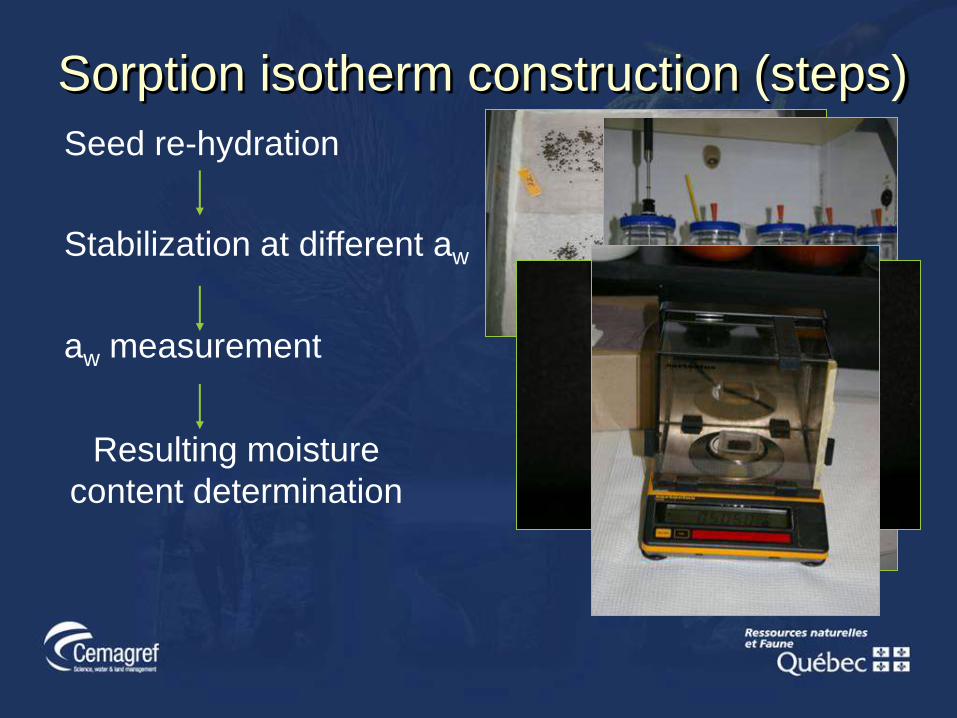
Sorption isotherm construction (steps)
Seed re-hydration
Stabilization at different aw
aw measurement
Resulting moisture
content determination
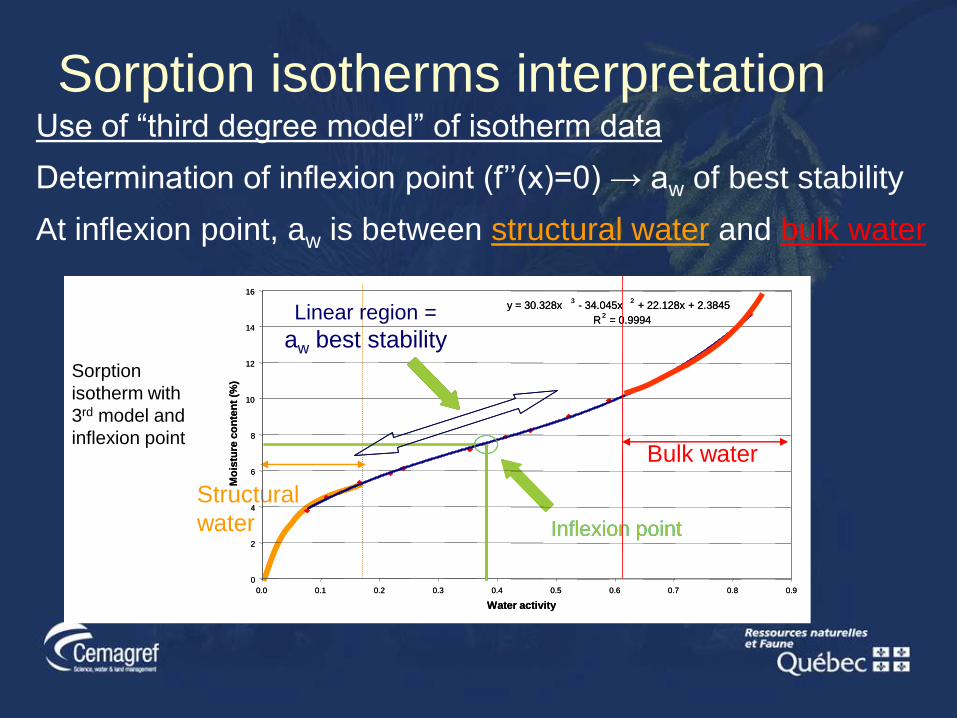
Sorption isotherms interpretation Use of “third degree model” of isotherm data
Determination of inflexion point (f’’(x)=0) → aw of best stability
At inflexion point, aw is between structural water and bulk water
Inflexion point
Structural
water
y = 30.328x3
- 34.045x2
+ 22.128x + 2.3845
R2
= 0.9994
0
2
4
6
8
10
12
14
16
0.0 0.1 0.2 0.3 0.4 0.5 0.6 0.7 0.8 0.9
Water activity
Mo
istu
re c
on
ten
t (%
)
y = 30.328x3
- 34.045x2
+ 22.128x + 2.3845
R2
= 0.9994
0
2
4
6
8
10
12
14
16
0.0 0.1 0.2 0.3 0.4 0.5 0.6 0.7 0.8 0.9
Water activity
Mo
istu
re c
on
ten
t (%
)
Linear region =
aw best stability
Inflexion point
Sorption
isotherm with
3rd model and
inflexion pointBulk water
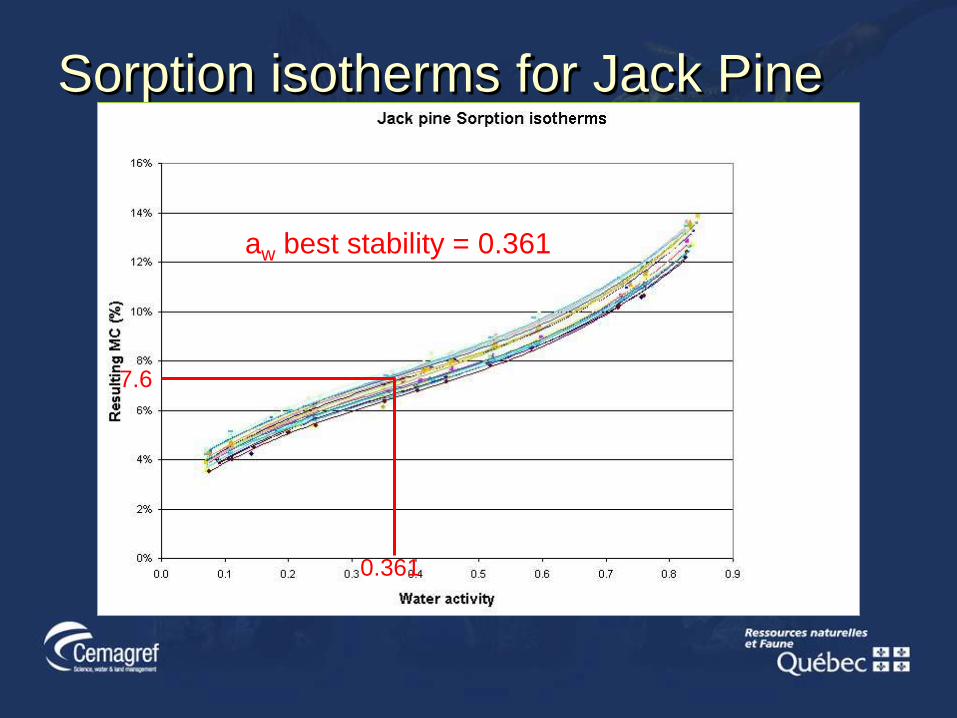
Sorption isotherms for Jack Pine
0.361
7.6
aw best stability = 0.361
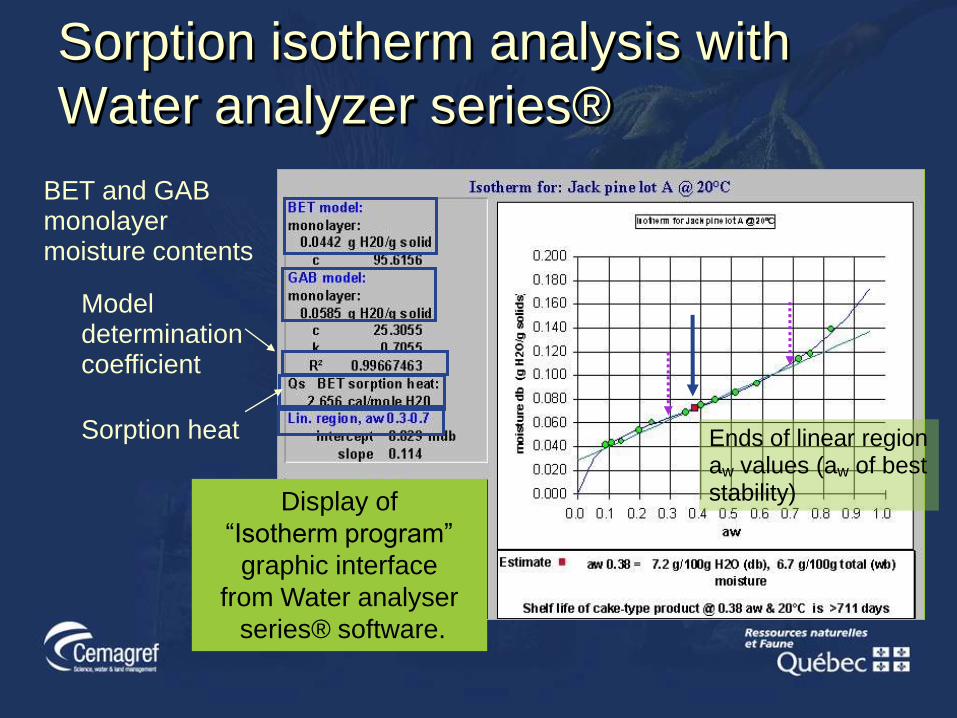
Display of
“Isotherm program”
graphic interface
from Water analyser
series® software.
BET and GAB monolayer moisture contents
Sorption isotherm analysis with
Water analyzer series®
Model determination coefficient
Ends of linear region aw values (aw of best stability)
Sorption heat

Sorption isotherms – results (3rd degree model)
Species Samples aw best stab. Res. MC
Coniferous P. mariana (EPN)
P. glauca (EPB)
20
14
0.352
0.343
6.65 %
6.33 %
P. banksiana (PIG)
P. contorta (PLI)
20
8
0.361
0.383
7.61 %
8.06 %
P. menziesii (DOUG)
T. plicata (CW)
A. balsamea (SAB)
12
8
5
0.355
0.378
0.334
6.99 %
7.31 %
6.22 %
Broadleaved F. sylvatica (FAGUS)
F. exelsior (FRAX)
B. alleghaniensis (BOJ)
C. betulus (CARP)
15
10
10
5
0.312
0.323
0.369
0.315
7.68 %
7.83 %
6.97%
6.69%

aw of best stability and resulting moisture content for the 11 species studied
Sorption isotherms – results (3rd degree model)
PLI
CW
DOUG
FRAX
PIGFAGUS
Broadleaved Coniferous
CARP

Sorption isotherms – results (Water analyser ®)
Species Samples Moisture content @ Monolayer BET
aw linear region span
P. mariana (EPN)
P. glauca (EPB)
20
14
4.08%
3.91%
0.27 – 0.69
0.23 - 0.69
P. banksiana (PIG)
P. contorta (PLI)
20
8
4.65%
4.56%
0.27 – 0.69
0.24 – 0.69
P. menziesii (DOUG)
T. plicata (CW)
A. balsamea (SAB)
12
8
5
4.93%
4.27%
4.17%
0.22 – 0.68
0.18 – 0.69
0.18 – 0.68
F. sylvatica (FAGUS)
F. exelsior (FRAX)
B. alleghaniensis (BOJ)
C. betulus (CARP)
15
10
10
5
5.32%
6.02%
5.03%
5.67%
0.17 – 0.64
0.26 – 0.67
0.3 – 0.7
0.3 – 0.7
Con
ifero
us
Bro
adle
aved
Our hypothesis : there is an universal aw for
optimal storage of orthodox seeds
Mean inflexion point from all isotherm 3rd model analysis is aw 0.35 (+/- 0.008*, p = 0.01).
Moisture content @ aw 0.35 > BET & GAB monolayer moisture contents for all the tested species.
Resulting moisture contents @ aw 0.35 are relevant to the state of the art storage values for the tested species.
At aw 0.35, chemical and biotic degradation factors are minimum.
* : confidence interval @ 99%
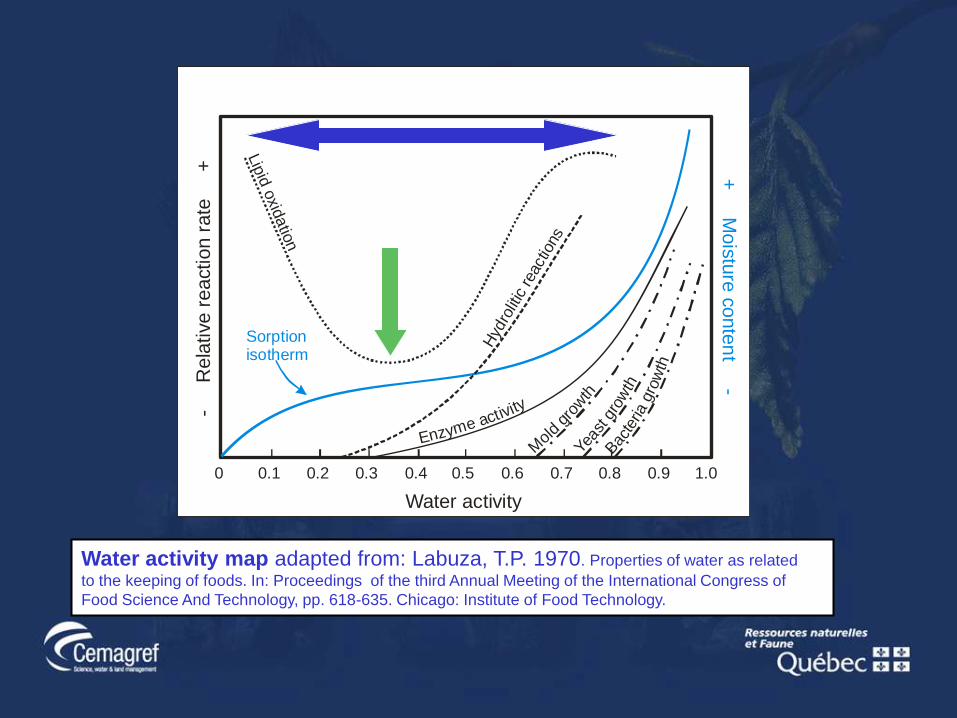
Water activity map adapted from: Labuza, T.P. 1970. Properties of water as related
to the keeping of foods. In: Proceedings of the third Annual Meeting of the International Congress of
Food Science And Technology, pp. 618-635. Chicago: Institute of Food Technology.
- R
ela
tive r
eaction r
ate
+ +
Mois
ture
conte
nt -
Water activity
0 0.1 0.2 0.3 0.4 0.5 0.6 0.7 0.8 0.9 1.0
Lip
id o
xidatio
n
Hyd
rolit
ic rea
ctio
ns
Sorptionisotherm
Mold
g
rowth
Yeas
t gro
wth
Bac
teria
gro
wth
Enzyme activity-
R
ela
tive r
eaction r
ate
+ +
Mois
ture
conte
nt -
Water activity
0 0.1 0.2 0.3 0.4 0.5 0.6 0.7 0.8 0.9 1.0
Lip
id o
xidatio
n
Hyd
rolit
ic rea
ctio
ns
Sorptionisotherm
Mold
g
rowth
Yeas
t gro
wth
Bac
teria
gro
wth
Enzyme activity

Conclusion
The results obtained with 11 orthodox forest species show that 0.35 is an optimal aw value for orthodox seeds drying and conservation.
This value can be applied to all orthodox species without long moisture behaviour characterisation.
We propose that aw can be introduced in ISTA quality rules.

Acknowledgments
The authors would like to express their gratitude to the
“62ème Commission Permanente de Coopération entre la
France et le Québec” for supporting our cooperative project.
Mrs. Pelletier and Mr. Allard for the technical work.
Ministère des Ressources Naturelles et de la Faune du
Québec & Cemagref for the financial support.
Invitation- ISTA Workshop
Water activity applied to seed testing
October 13-15, Montargis (France)
ISTA Committees: Forest Tree and Shrub seed, and
Moisture
Lectures and practical aspects related to water activity measurement
will be considered in relation with gravimetric moisture content.