Embed Size (px)
Citation preview
To be c i ted as:
Book t i t le
Chapter 7
Zarate, E., Aldaya, M., Chico, D., Pahlow, M., Flachsbarth, I., Franco, G., Zhang, G., Garrido, A., Kuroiwa, J., Pascale-Palhares, J.C., Arévalo, D. (2914), Water and agriculture, In: Willaarts, B.A., Garrido, A., Llamas, M.R. (Eds.), Water for Food and Wellbeing in Latin America and the Caribbean. Social and Environmental Implications for a Globalized Economy. Routledge, Oxon and New York, pp. 177-212.
Water for Food and Wellbeing in Latin America and the Caribbean. Social and Environmental Implications for a Globalized Economy, Routledge, Oxon and New York, 432 pp.
Edited by: Bárbara A. Willaarts, Alberto Garrido and M.R. Llamas
Year: 2014
Water and agriculture
WATER AND AGRICULTURE
A u t h o r s :Erika Zarate, Good Stuff International, SwitzerlandMaite M. Aldaya, Water Observatory – Botín Foundation, and Complutense University of Madrid, SpainDaniel Chico, Water Observatory – Botín Foundation, and CEIGRAM, Technical University of Madrid, SpainMarkus Pahlow, Department of Water Engineering & Management, University of Twente, The NetherlandsInsa Flachsbarth, Water Observatory – Botín Foundation, and CEIGRAM, Technical University of Madrid, SpainGabriela Franco, Departamento de Economía Agraria Ponti�cia Universidad Católica de Chile,Santiago, ChileGuoping Zhang, Water Footprint Network, The NetherlandsAlberto Garrido, Water Observatory – Botín Foundation, and CEIGRAM, Technical University of Madrid, SpainJulio M. Kuroiwa, Laboratorio Nacional de Hidráulica – Universidad Nacional de Ingeniería, Lima, PeruJulio Cesar Pascale Palhares, Embrapa Cattle Southeast, São Carlos, BrazilDiego Arévalo Uribe, Water Management and Footprint. Centro de Ciencia y Tecnología de Antioquia, Colombia
C o o r d i n a t o r :Maite M. Aldaya, Water Observatory – Botín Foundation, and Complutense University of Madrid, Spain
C o n t r i b u t o r s :Mes�n Mekonnen, University of Twente, The NetherlandsBarbara Soriano, CEIGRAM, Technical University of Madrid, SpainLaurens Thuy, Utrecht University, The NetherlandsLuis F. Castro, School of Civil Engineering,Universidad Nacional de Ingenieria, Lima, Peru
7
PA R T 3 :WAT E R F O R F O O D A N D N O N – F O O D
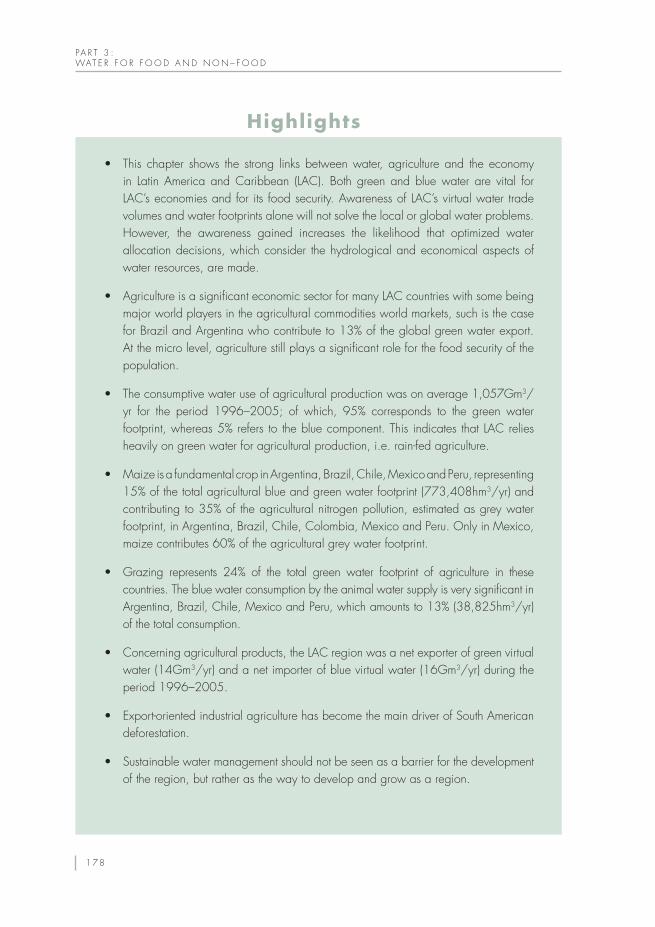
• This chapter shows the strong linksbetweenwater, agricultureand theeconomyin Latin America and Caribbean (LAC). Both green and blue water are vital for LAC’s economies and for its food security. Awareness of LAC’s virtual water trade volumes and water footprints alone will not solve the local or global water problems. However, the awareness gained increases the likelihood that optimized water allocation decisions, which consider the hydrological and economical aspects of water resources, are made.
• AgricultureisasignificanteconomicsectorformanyLACcountrieswithsomebeingmajor world players in the agricultural commodities world markets, such is the case for Brazil and Argentina who contribute to 13% of the global green water export. At the micro level, agriculture still plays a significant role for the food security of the population.
• Theconsumptivewateruseofagriculturalproductionwasonaverage1,057Gm3/yr for the period 1996–2005; of which, 95% corresponds to the green water footprint, whereas 5% refers to the blue component. This indicates that LAC relies heavily on green water for agricultural production, i.e. rain-fed agriculture.
• MaizeisafundamentalcropinArgentina,Brazil,Chile,MexicoandPeru,representing15% of the total agricultural blue and green water footprint (773,408hm3/yr) and contributing to 35% of the agricultural nitrogen pollution, estimated as grey water footprint, in Argentina, Brazil, Chile, Colombia, Mexico and Peru. Only in Mexico, maize contributes 60% of the agricultural grey water footprint.
• Grazing represents 24% of the total green water footprint of agriculture in thesecountries. The blue water consumption by the animal water supply is very significant in Argentina, Brazil, Chile, Mexico and Peru, which amounts to 13% (38,825hm3/yr) of the total consumption.
• Concerningagriculturalproducts,theLACregionwasanetexporterofgreenvirtualwater (14Gm3/yr) and a net importer of blue virtual water (16Gm3/yr) during the period 1996–2005.
• Export-orientedindustrialagriculturehasbecomethemaindriverofSouthAmericandeforestation.
• Sustainablewatermanagementshouldnotbeseenasabarrierforthedevelopmentof the region, but rather as the way to develop and grow as a region.
Highlights
1 7 8
C H A P T E R 7WAT E R A N D A G R I C U L T U R E
The Latin American and Caribbean region (LAC) as a whole is increasingly becoming a major source of agricultural commodities for the world market and thus influencing food security. As such, improving resource management in the region promises to have important benefits for both the inhabitants of LAC and the world.
Agriculture is essential to food security. However, food production requires substantial amounts of water, both stored in the soil as soil moisture from rain (green water) and as water for irrigation (blue water). FAO (2012b) estimated an annual blue water use in LAC of 262,800hm3/yr. Globally, agriculture is the sector with the largest water withdrawal by far, with about 70%. This percentage compares to 73%, (192,700hm3/yr) in LAC, whereas 19% and 9% correspond to the domestic and industrial sectors respectively (ibid.). The Guyana sub-region (Guyana and Suriname) and Southern Cone (Argentina, Chile, Paraguay and Uruguay) have the highest level of agricultural water use, with values of 96% and 91% respectively (ibid.). Agriculture is also central to economic growth in LAC. For the period 2000–2007, it contributed an average of 9.6% to its GDP and exports of agricultural commodities accounted for 44% of total export value in 2007 (Bovarnick et al., 2010). Notably the agricultural sector provides employment for about 9% of LAC’s population (UNEP, 2013).
Globally, a substantial part of the most fertile land is already being used for agriculture. According to FAO (2012a), much of the remaining arable land is located in LAC and sub-Saharan Africa, however, it is in remote locations, far from population centres and agricultural infrastructure, and cannot be converted into productive land without investments in infrastructure development. In LAC, agricultural production increased by more than 50 % from 2000 to 2012, with Brazil expanding production by more than 70 %. Most food is produced by rain-fed agriculture in LAC, with 87% of the cropland being rain-fed (Rockström et al., 2007). The irrigation potential for the region is estimated at 77.8 million hectares (FAO, 2013), whereas in 2009 the LAC region had 13.5 million hectares of irrigated agriculture. The gap between the irrigation potential and actually irrigated agriculture is due to increasing costs of construction, limited government support for large-scale irrigation investments and concerns about the negative social and environmental impacts of irrigation (UNCTAD, 2011). Most of the regional irrigation potential (66%) is located in four countries: Argentina, Brazil, Mexico and Peru (ibid.). Figures on irrigation potential usually only take into account climatic conditions and land
• Understanding the magnitude of overlap and interactions between poverty,conservation and macro-economic processes is crucial in order to identify possible win–win solutions for the LAC region. Access to agricultural water has secondary effects on poverty through output, employment and prices.
Introduction7.1
1 7 9
PA R T 3 :WAT E R F O R F O O D A N D N O N – F O O D
irrigation sustainability, while studies including surface- and groundwater availability are considered scarce (FAO, 2013).
Water quality deserves as much attention as water quantity. Local and regional physical water scarcity problems are exacerbated by severe water quality problems in LAC; leading to the frequent usage of wastewater for irrigation. Many countries in LAC have been facing increasing challenges in water quality management. The world’s major water quality issues as identified by United Nations (UN, 2003) are organic pollution, pathogens, salinity, nitrate, heavy metals, acidification, eutrophication and sediment load either in surface water bodies or in groundwater.
LAC is relatively well endowed with water resources. However, the spatial and temporal variability of water, coupled with rapid urbanization and inadequate water governance is putting considerable pressure on the available water resources (see Chapter 2 and 6 for an analysis of water scarcity in LAC). Ironically, in the water abundant LAC, almost 20% of its nearly 600 million inhabitants do not have access to drinking water, 20% do not have any kind of access to a sewage system, and less than 30% of the wastewater receives treatment (Proceso Regional de las Américas, 2012). In addition almost 18 million of children under five suffer from chronic malnutrition (FAO, 2012b). This elevated distributive inequity is a notable element in the reality of LAC.
This chapter analyses the challenges and opportunities of water management in the region from the perspective of the agricultural sector. First, water is accounted in terms of quantity and quality. Virtual water trade in the LAC region is also analysed and, finally, a productivity analysis is presented taking into account social and economic aspects.
In this chapter we use the water footprint (WF) (Hoekstra et al., 2011) to calculate water consumption. The ‘water footprint’ is a measure of humans’ appropriation of freshwater resources. Freshwater appropriation is measured in terms of water volume consumed (evaporated or incorporated into a product) or polluted per unit of time. A water footprint has three components: green, blue and grey. The blue water footprint refers to consump-tion of blue water resources (surface and ground water). The green water footprint is the volume of green water (rainwater stored in the soil as soil moisture) consumed, which is particularly relevant in crop production. The grey water footprint is an indicator of the degree of freshwater pollution and is defined as the volume of freshwater that is required to assimilate the load of pollutants based on existing ambient water quality standards.
In the context of the countries considered, the water footprint accounting is applied from two perspectives: the water footprint of agricultural production and the water foot-print of agricultural consumption. The water footprint of agricultural production for a given country refers to the blue, green and grey water footprints of all the agricultural processes, that is, crop and livestock production, taking place within the political borders of the country. The water footprint of agricultural production is equivalent to the agricultural ‘water footprint within the area of the nation’ (Hoekstra et al., 2011), and is defined as
Methodology and data7.2
1 8 0
C H A P T E R 7WAT E R A N D A G R I C U L T U R E
the total freshwater volume consumed or polluted within the territory of the nation as a result of activities within the different sectors of the economy, in this case agriculture.
The water footprint of agricultural consumption refers to the quantification of the water consumed and polluted to produce the agricultural products consumed by the population of a country. It consists of two components: the internal and external water footprint of national consumption. The internal water footprint is defined as the use of domestic water resources to produce goods and services consumed by the population of the country. It is the sum of the water footprint within the nation minus the volume of virtual-water exported to other nations through the export of products produced with domestic water resources. The external water footprint is defined as the volume of water resources used in other nations to produce goods and services consumed by the population in the nation under consideration. It is equal to the virtual water import into the nation minus the volume of virtual water export to other nations as a result of re-export of imported products. The virtual water export from a nation consists of exported water of domestic origin and re-exported water of foreign origin. The virtual-water import into a nation will partly be consumed, thus constituting the external water footprint of national consumption, and may in part be re-exported (Mekonnen and Hoekstra, 2011).
The grey water footprint data used refer to the nitrogen pollution alone and are based on Mekonnen and Hoekstra (2011), who estimated the grey water footprint based on nitrogen leaching-runoff from fertilizer use. The fraction of nitrogen that leaches or runs off multiplied by the nitrogen application rate represents the load of nitrogen reaching the surface and subsurface water bodies. Some 10% of the applied nitrogen fertilizer is assumed to be lost through leaching-runoff. In order to estimate the grey water footprint, an ambient water quality standard of 10mg/l measured as Nitrate-nitrogen (NO3-N) was used, following the guidelines of the US Environmental Protection Agency (US-EPA).
The countries analysed in this chapter as LAC correspond to the thirty-three countries of the Economic Commission for Latin America and the Caribbean (ECLAC) plus Puerto Rico. Data from other non-sovereign Caribbean islands are included in tables whenever available.
In the majority of the countries of the region, irrigation is seen as an important means to increase productivity, and enable and intensify crop diversification, an objective of most agricultural policies of governments in the region (FAO, 2013). Irrigated areas increased steadily during the 20th century and particularly from the 1950s onwards (ibid.). These increases are, however, modest in comparison to Asia and sub-Saharan Africa. Mexico has by far the largest irrigated area with over 6.5 million hectares; and Brazil is next with 3.2 million hectares, followed by Chile, Argentina, and Bolivia (UNCTAD, 2011). About
Water accounting7.3Water quantit y7.3.1
Water withdrawal in agriculture7.3.1.1
1 8 1
PA R T 3 :WAT E R F O R F O O D A N D N O N – F O O D
0.5 million hectares in Brazil are located in the semi-arid northeast region – an area with the lowest social and economic indicators (Oliviera et al., 2009).
Figures on irrigation water use (non-consumptive) are expressed in cubic metres per hectare per year, and show certain homogeneity for the whole of South America and the Greater Antilles, varying between 9,000m3/ha/yr and 12,000m3/ha/yr. Figures for Mexico are slightly higher, 13,500m3/ha/yr, and for Central America even higher. In the case of Mexico, the higher value is probably due to its climatic characteristics (higher potential evapotranspiration), while Central America is dominated by its permanent crops (banana, sugar cane, etc.) and its high cultivation intensity in temporary crops such as rice (FAO, 2013).
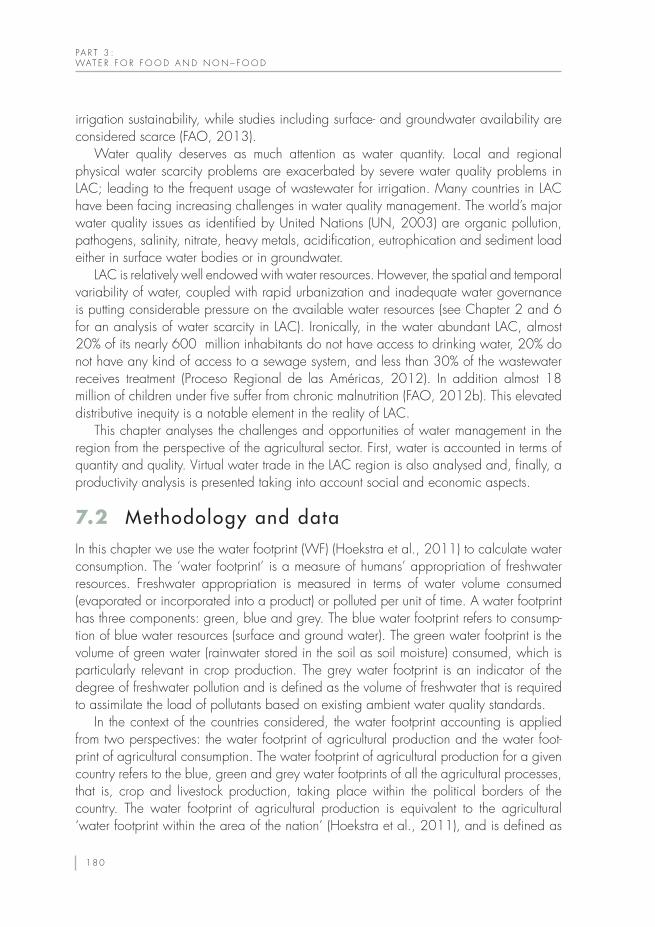
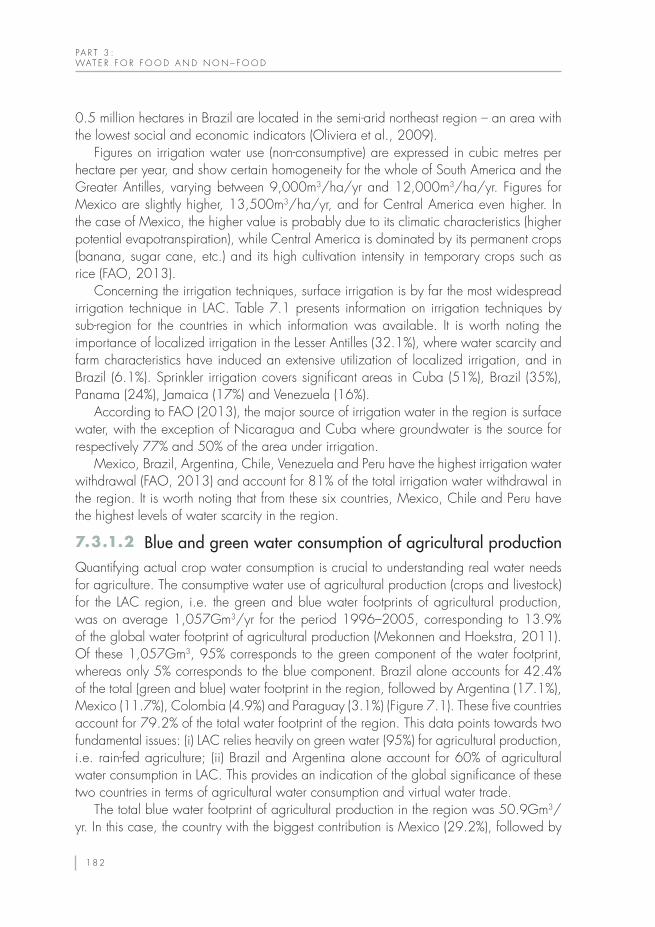
Concerning the irrigation techniques, surface irrigation is by far the most widespread irrigation technique in LAC. Table 7.1 presents information on irrigation techniques by sub-region for the countries in which information was available. It is worth noting the importance of localized irrigation in the Lesser Antilles (32.1%), where water scarcity and farm characteristics have induced an extensive utilization of localized irrigation, and in Brazil (6.1%). Sprinkler irrigation covers significant areas in Cuba (51%), Brazil (35%), Panama (24%), Jamaica (17%) and Venezuela (16%).
According to FAO (2013), the major source of irrigation water in the region is surface water, with the exception of Nicaragua and Cuba where groundwater is the source for respectively 77% and 50% of the area under irrigation.
Mexico, Brazil, Argentina, Chile, Venezuela and Peru have the highest irrigation water withdrawal (FAO, 2013) and account for 81% of the total irrigation water withdrawal in the region. It is worth noting that from these six countries, Mexico, Chile and Peru have the highest levels of water scarcity in the region.
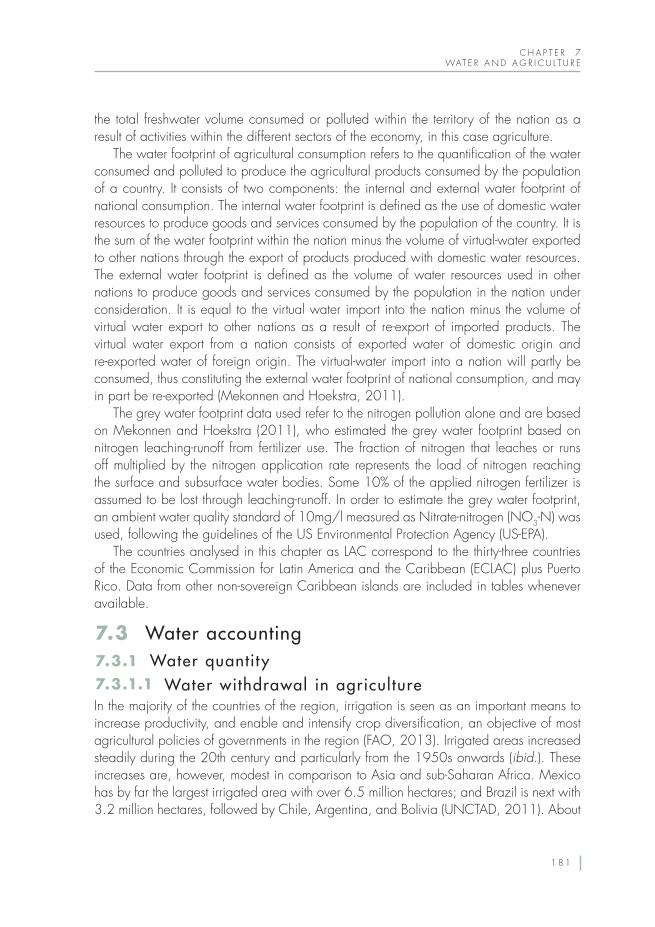
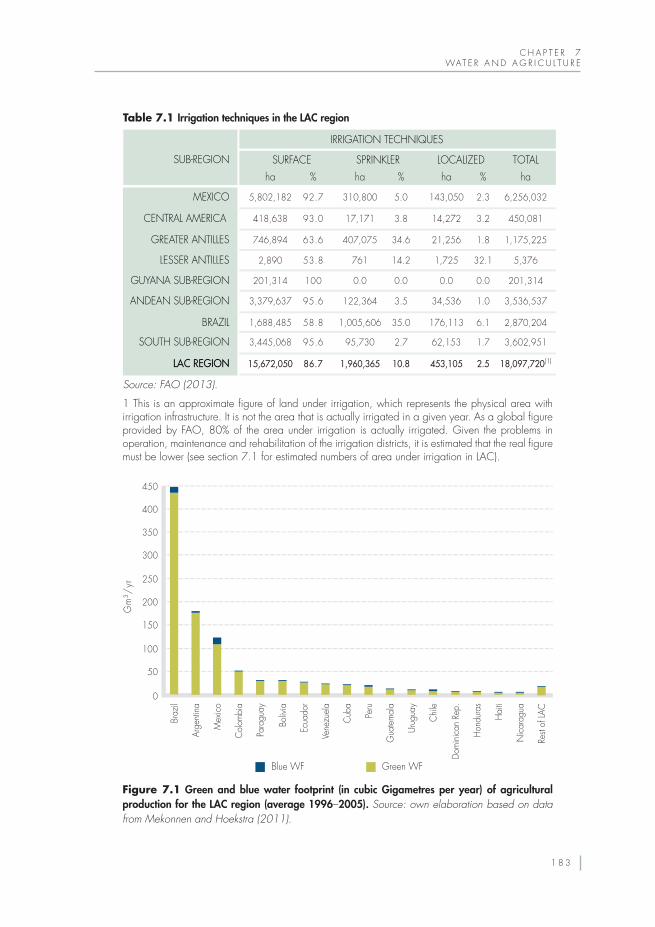
Quantifying actual crop water consumption is crucial to understanding real water needs for agriculture. The consumptive water use of agricultural production (crops and livestock) for the LAC region, i.e. the green and blue water footprints of agricultural production, was on average 1,057Gm3/yr for the period 1996–2005, corresponding to 13.9% of the global water footprint of agricultural production (Mekonnen and Hoekstra, 2011). Of these 1,057Gm3, 95% corresponds to the green component of the water footprint, whereas only 5% corresponds to the blue component. Brazil alone accounts for 42.4% of the total (green and blue) water footprint in the region, followed by Argentina (17.1%), Mexico (11.7%), Colombia (4.9%) and Paraguay (3.1%) (Figure 7.1). These five countries account for 79.2% of the total water footprint of the region. This data points towards two fundamental issues: (i) LAC relies heavily on green water (95%) for agricultural production, i.e. rain-fed agriculture; (ii) Brazil and Argentina alone account for 60% of agricultural water consumption in LAC. This provides an indication of the global significance of these two countries in terms of agricultural water consumption and virtual water trade.
The total blue water footprint of agricultural production in the region was 50.9Gm3/yr. In this case, the country with the biggest contribution is Mexico (29.2%), followed by
Blue and green water consumption of agricultural production7.3.1.2
1 8 2
C H A P T E R 7WAT E R A N D A G R I C U L T U R E
SUB-REGION
IRRIGATION TECHNIQUES
SURFACE
MEXICO
CENTRAL AMERICA
5,802,182
ha
418,638
92.7
%
93.0
SPRINKLER
310,800
ha
17,171
5.0
%
3.8
LOCALIZED
143,050
ha ha
14,272
2.3
%
3.2
TOTAL
6,256,032
450,081
GREATER ANTILLES 746,894 63.6 407,075 34.6 21,256 1.8 1,175,225
LESSER ANTILLES 2,890 53.8 761 14.2 1,725 32.1 5,376
GUYANA SUB-REGION 201,314 100 0.0 0.0 0.0 0.0 201,314
SOUTH SUB-REGION 3,445,068 95.6 95,730 2.7 62,153 1.7 3,602,951
LAC REGION 15,672,050 86.7 1,960,365 10.8 453,105 2.5 18,097,720(1)
ANDEAN SUB-REGION 3,379,637 95.6 122,364 3.5 34,536 1.0 3,536,537
BRAZIL 1,688,485 58.8 1,005,606 35.0 176,113 6.1 2,870,204
Gm
³/yr
Braz
il
Arge
ntin
a
Mex
ico
Col
ombi
a
Para
guay
Boliv
ia
Ecua
dor
Vene
zuel
a
Cub
a
Peru
Gua
tem
ala
Urug
uay
Chi
le
Dom
inic
an R
ep.
Hon
dura
s
Hai
ti
Nic
arag
ua
Rest
of LA
C
50
0
100
150
200
250
300
350
400
450
Blue WF Green WF
Table 7.1 Irrigation techniques in the LAC region
Source: FAO (2013).
1 This is an approximate figure of land under irrigation, which represents the physical area with irrigation infrastructure. It is not the area that is actually irrigated in a given year. As a global figure provided by FAO, 80% of the area under irrigation is actually irrigated. Given the problems in operation, maintenance and rehabilitation of the irrigation districts, it is estimated that the real figure must be lower (see section 7.1 for estimated numbers of area under irrigation in LAC).
Figure 7.1 Green and blue water footprint (in cubic Gigametres per year) of agricultural production for the LAC region (average 1996–2005). Source: own elaboration based on data from Mekonnen and Hoekstra (2011).
1 8 3
PA R T 3 :WAT E R F O R F O O D A N D N O N – F O O D
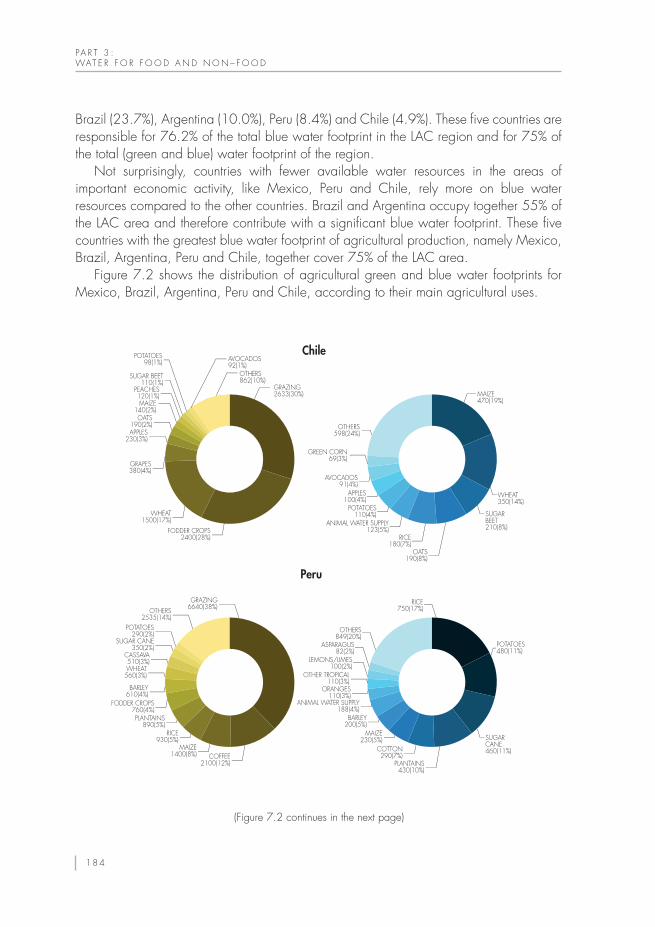
Brazil (23.7%), Argentina (10.0%), Peru (8.4%) and Chile (4.9%). These five countries are responsible for 76.2% of the total blue water footprint in the LAC region and for 75% of the total (green and blue) water footprint of the region.
Not surprisingly, countries with fewer available water resources in the areas of important economic activity, like Mexico, Peru and Chile, rely more on blue water resources compared to the other countries. Brazil and Argentina occupy together 55% of the LAC area and therefore contribute with a significant blue water footprint. These five countries with the greatest blue water footprint of agricultural production, namely Mexico, Brazil, Argentina, Peru and Chile, together cover 75% of the LAC area.
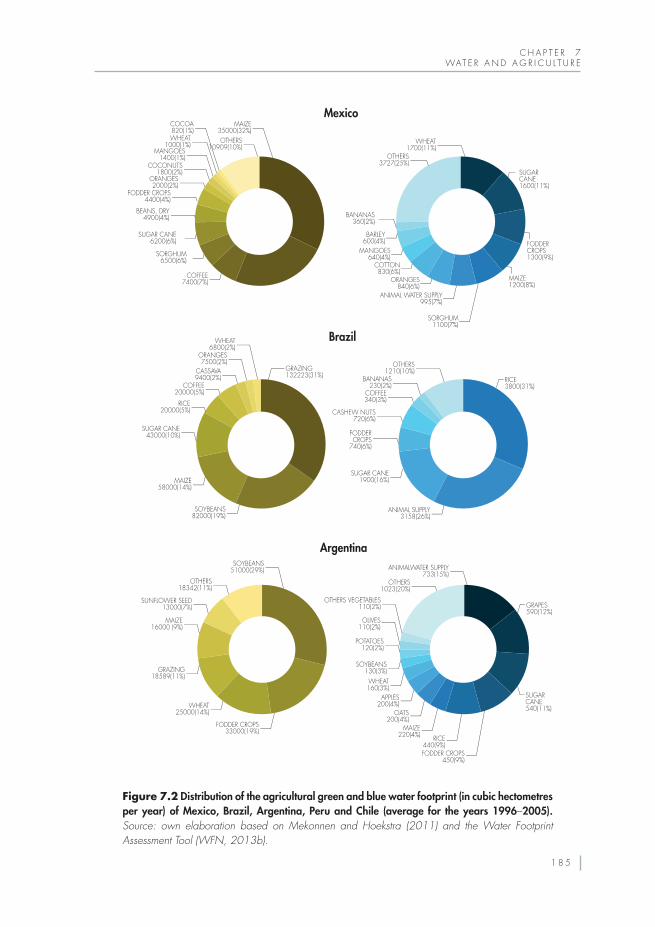
Figure 7.2 shows the distribution of agricultural green and blue water footprints for Mexico, Brazil, Argentina, Peru and Chile, according to their main agricultural uses.
SUGAR CANE460(11%)
SUGAR BEET210(8%)
WHEAT350(14%)
APPLES230(3%)
OATS190(2%)
MAIZE140(2%)
PEACHES120(1%)
SUGAR BEET110(1%)
POTATOES98(1%)
GRAZING2633(30%)
GREEN CORN69(3%)
OTHERS598(24%)
MAIZE470(19%)
Chile
POTATOES110(4%)
ANIMAL WATER SUPPLY123(5%)
RICE180(7%)
OATS190(8%)
APPLES100(4%)
AVOCADOS91(4%)
OTHERS862(10%)
AVOCADOS92(1%)
FODDER CROPS2400(28%)
WHEAT1500(17%)
GRAPES380(4%)
WHEAT560(3%) OTHER TROPICAL
110(3%)
LEMONS/LIMES100(2%)
ASPARAGUS82(2%)
OTHERS849(20%)
RICE750(17%)
CASSAVA510(3%)
SUGAR CANE350(2%)
POTATOES290(2%)
OTHERS2535(14%)
GRAZING6640(38%)
POTATOES480(11%)
Peru
FODDER CROPS760(4%)
BARLEY610(4%)
PLANTAINS890(5%)
MAIZE230(5%)
COTTON290(7%)
PLANTAINS430(10%)
BARLEY200(5%)
ANIMAL WATER SUPPLY188(4%)
ORANGES110(3%)
RICE930(5%)
MAIZE1400(8%) COFFEE
2100(12%)
(Figure 7.2 continues in the next page)
1 8 4
C H A P T E R 7WAT E R A N D A G R I C U L T U R E
OTHERS1023(20%)
ANIMALWATER SUPPLY733(15%)
POTATOES120(2%)
OLIVES110(2%)
OTHERS VEGETABLES110(2%)
OATS200(4%)
MAIZE220(4%)
SUGAR CANE540(11%)
RICE440(9%)FODDER CROPS
450(9%)
WHEAT160(3%)
GRAPES590(12%)
Argentina
APPLES200(4%)
SOYBEANS130(3%)
OTHERS18342(11%)
SOYBEANS51000(29%)
SUNFLOWER SEED13000(7%)
MAIZE16000 (9%)
GRAZING18589(11%)
WHEAT25000(14%)
FODDER CROPS33000(19%)
COFFEE340(3%)
CASHEW NUTS720(6%)
FODDER CROPS
740(6%)
BANANAS230(2%)
OTHERS1210(10%)
RICE3800(31%)
Brazil
SUGAR CANE43000(10%)
RICE20000(5%)
COFFEE20000(5%)
CASSAVA9400(2%)
ORANGES7500(2%)
WHEAT6800(2%)
GRAZING132223(31%)
MAIZE58000(14%)
SOYBEANS82000(19%)
SUGAR CANE 1900(16%)
ANIMAL SUPPLY3158(26%)
ORANGES2000(2%)
FODDER CROPS4400(4%)
BEANS, DRY4900(4%)
COCONUTS1800(2%)
MANGOES1400(1%)
WHEAT1000(1%)
COCOA820(1%)
OTHERS10909(10%)
MAIZE35000(32%)
OTHERS3727(25%)
BANANAS360(2%)
WHEAT1700(11%)
FODDER CROPS1300(9%)
MAIZE1200(8%)
Mexico
SUGAR CANE1600(11%)
SUGAR CANE6200(6%)
BARLEY600(4%)
MANGOES640(4%)
COTTON830(6%)
ORANGES840(6%)
ANIMAL WATER SUPPLY995(7%)
SORGHUM1100(7%)
SORGHUM6500(6%)
COFFEE7400(7%)
Figure 7.2 Distribution of the agricultural green and blue water footprint (in cubic hectometres per year) of Mexico, Brazil, Argentina, Peru and Chile (average for the years 1996–2005). Source: own elaboration based on Mekonnen and Hoekstra (2011) and the Water Footprint Assessment Tool (WFN, 2013b).
1 8 5
PA R T 3 :WAT E R F O R F O O D A N D N O N – F O O D
Maize is a fundamental crop in all five countries as shown in Figure 7.2. It represents 15% of the total agricultural (blue and green) water footprint (WF) of these five countries equivalent to 773,408hm3/yr. Soybean is especially important in Brazil and Argentina, and accounts for 17% of the total agricultural blue and green WF of these five countries. Grazing contributes significantly with 24% of the total green WF of agriculture in these countries. The blue water consumption for the animal water supply in the five countries, which amounts to 13%, or 8,825hm3/yr, is also noteworthy. In the context of water policy, being aware of water allocation for livestock is essential when considering food security for LAC (Box 7.1). Sugar cane is also an important crop for all the above-mentioned countries except Chile (for climatic reasons), which shows a stronger production of cash crops such as grapes, apples and avocados. Rice makes up a significant part of the blue WF for all the countries except Mexico (14% of the total blue WF of the five countries). Potatoes constitute a very important crop in Peru (Box 7.2).
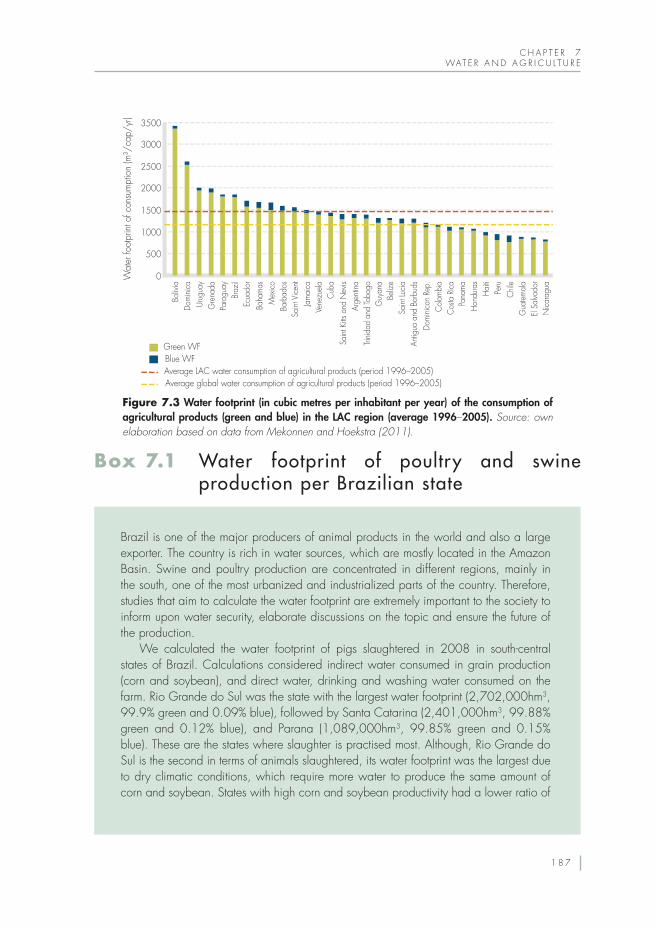
The average global water consumption of agricultural products was 1,156m3/capita/yr (88% green, 12% blue) for the period 1996–2005 (Mekonnen and Hoekstra, 2011). The equivalent value for the LAC region was 1,473m3/capita/yr (94% green, 6% blue). Figure 7.3 shows that water footprints range between 3,420m3/capita/yr (98% green, 2% blue) for Bolivia and 833m3/capita/yr (95% green, 5% blue) for Nicaragua. Chile, Peru, Mexico and Dominican Republic have the highest percentage of blue water in their water footprints of consumption, with values of 16, 15, 10 and 10% respectively. Countries with the lowest blue water proportion are Bolivia (2%), and Brazil, Uruguay, Paraguay and Dominica (3%).
The virtual water import dependency of a nation is defined as the ratio of the external to the total water footprint of national consumption, whereas the national water self-sufficiency is defined as the ratio of the internal to the total water footprint of national consumption. The Lesser Antilles and Mexico have the highest virtual water dependency in the LAC region. Saint Lucia, Trinidad and Tobago and Bahamas show virtual water dependencies above 90%, whereas Mexico’s corresponding value is approximately 45%. This means that these countries import most of the virtual water required to cover the agricultural needs of its population, meaning they have a notable dependency on external water resources. Chile and Peru, both countries characterized by significant levels of water scarcity (see Chapter 2), show virtual water import dependencies of 37 and 34% respectively. Conversely, Paraguay, Argentina, Bolivia and Brazil have very low virtual water import dependency values (2, 3, 9 and 9 % respectively) indicating high self-sufficiency. This means that these countries use their own available resources to supply most of the agricultural products consumed by their inhabitants.
Water footprint agricultural products’ consumption: externalization of the water footprint
7.3.1.3
1 8 6
C H A P T E R 7WAT E R A N D A G R I C U L T U R E
Brazil is one of the major producers of animal products in the world and also a large exporter. The country is rich in water sources, which are mostly located in the Amazon Basin. Swine and poultry production are concentrated in different regions, mainly in the south, one of the most urbanized and industrialized parts of the country. Therefore, studies that aim to calculate the water footprint are extremely important to the society to inform upon water security, elaborate discussions on the topic and ensure the future of the production.
We calculated the water footprint of pigs slaughtered in 2008 in south-central states of Brazil. Calculations considered indirect water consumed in grain production (corn and soybean), and direct water, drinking and washing water consumed on the farm. Rio Grande do Sul was the state with the largest water footprint (2,702,000hm3, 99.9% green and 0.09% blue), followed by Santa Catarina (2,401,000hm3, 99.88% green and 0.12% blue), and Parana (1,089,000hm3, 99.85% green and 0.15% blue). These are the states where slaughter is practised most. Although, Rio Grande do Sul is the second in terms of animals slaughtered, its water footprint was the largest due to dry climatic conditions, which require more water to produce the same amount of corn and soybean. States with high corn and soybean productivity had a lower ratio of
Wat
er fo
otpr
int o
f con
sum
ptio
n (m
³/ca
p/yr
)
Urug
uay
Gre
nada
Boliv
iaDo
min
ica
Para
guay
Braz
ilEc
uado
rBa
ham
asM
exico
Barb
ados
Sain
t Vice
ntJa
mai
caVe
nezu
elaC
uba
Sain
t Kitts
and
Nev
isAr
genti
naTri
nida
d an
d To
bago
Guy
ana
Beliz
eSa
int L
ucia
Antig
ua a
nd B
arbu
dsDo
min
ican
Rep.
Col
ombi
aC
osta
Rica
Pana
ma
Hon
dura
sH
aiti
Peru
Chi
leG
uate
mal
aEl
Salva
dor
Nica
ragu
a
500
1000
1500
2000
2500
3000
3500
0
Average global water consumption of agricultural products (period 1996–2005)Average LAC water consumption of agricultural products (period 1996–2005)Blue WFGreen WF
Figure 7.3 Water footprint (in cubic metres per inhabitant per year) of the consumption of agricultural products (green and blue) in the LAC region (average 1996–2005). Source: own elaboration based on data from Mekonnen and Hoekstra (2011).
Box 7.1 Water footprint of poultry and swine production per Brazilian state
1 8 7
PA R T 3 :WAT E R F O R F O O D A N D N O N – F O O D
water volume consumed per kg of meat, namely Distrito Federal (2.49m3/kg), Parana (2.53m3/kg), and Goias (2.77m3/kg).
The water footprint of broiler chicken slaughtered in the decade 2000–2010 in each of Brazil’s south-central states was also calculated. Similarly the calculation considered indirect water, consumed in grain production, and direct water, consumed on the farm. South states had the largest water footprints and the largest number of animals slaughtered during the period. The average footprint for Parana in the decade in question (2000–2010) was 4,334hm3 (99.7% green and 0.3% blue) and Rio Grande do Sul 4,216hm3 (99.8% green and 0.2% blue). Slaughters increased and/or remained constant in all states. Annual variation was determined by productivity of corn and soybeans.
Results show that water management in animal production should not only address the farm; but also include related agricultural supply chains, where most of the water consumed is green. Blue and grey water footprints, most notable in the direct water use of the farm, are also important as they are consumed in watersheds with an increased potential for water use conflicts (Palhares, 2012).
Potato (Solanum Toberusum) is a South American tuber that grows in a wide variety of environments, ranging from cold to temperate climates, and in altitudes ranging from sea level to 4,700m. It is the fourth most important crop in the world behind rice, wheat and maize and the third most important in human consumption, feeding more than one billion people worldwide (CIP, 2010).
FAO (2008) indicates that potatoes are very productive from the nutritional viewpoint. For each m3 of water applied to potato crops, 5,600 calories are produced. By comparison, 1m3 of water applied to corn produces 3,800 calories and only 2,000 calories if it is applied to rice. In addition, 1m3 of water applied to potatoes produces 150g of proteins and 540mg of calcium. Therefore, potatoes’ protein content per cubic metre is more than double that of maize and wheat and offers twice the calcium provided by wheat and four times that of rice.
The average European consumption is 87.8kg potatoes/year/person. By comparison, per capita consumption of potatoes per year is 60kg in North America, 13.9kg in Africa, 23.9kg in Oceania and 20.7kg in Latin America, although its consumption is steadily growing in the latter region (FAO, 2008).
In Latin America, the highest yields are obtained in Argentina (28.7t/ha) and the lowest yields are obtained in Bolivia (5.6t/ha). In the Andean countries potato cultivation is mostly in hands of small farmers. Higher yields are related to improved technology, sufficient water supply and better management.
The Andean population uses productive domesticated species to overcome the limitations of poor productivity of wild plants, although these do not grow at altitudes
Box 7.2 Importance of potatoes in the Peruvian diet
1 8 8
C H A P T E R 7WAT E R A N D A G R I C U L T U R E
greater than 4,500m. Solanum jozepozukii and Solanum curtilobum are frost-resistant potatoes that grow at high elevations where agriculture is practised (Moran, 1982).
An ongoing study (LA-Peru, 2012) indicates that, on average, production of 1kg of potatoes requires only 469 litres of water. Mekonnen and Hoekstra (2011) provide a lower global average WF figure of 290litre/kg: 66% related to green, 11% to blue and 22 % to grey WF. Potato cultivation is concentrated in the mountainous area of the Andean region and the Pacific Basin. Crops are rain-fed during the wet season (January–March) and during the rest of the year in which precipitation is negligible, flood or furrow irrigation is used. In some cases, water is not applied in the last months of the vegetative period, and the yield is very low (Egúsquiza, 2000). Initial watering appears to be sufficient to achieve an acceptable growth and even with a low yield potatoes help to cover part of the basic nutritional needs of poor communities in the Andean Highlands.
Further population growth and shortage of water resources in some areas in the near future may force a substantial change in crop cultivation patterns. For instance, rice is grown in a number of valleys where water is scarce. It might be more advantageous from the water conservational, nutritional and even economic point of view to grow potatoes instead. In addition, potato productivity ought to be increased, particularly in the Andean countries.
The most well-known effects of agriculture on water quality are due to chemical contamination by fertilizers and pesticides that accumulate in water sources. Additionally the reuse of sewage effluent for irrigation, known to transmit a number of pathogens even after secondary water treatments, can seriously affect the quality of the water used in agriculture. Significant water pollution due to irrigation has been reported in Barbados, Mexico, Nicaragua, Panama, Peru, Dominican Republic and Venezuela (Biswas et al., 2006). In addition, the problem of salinity caused by irrigation is a serious constraint in Argentina, Cuba, Mexico, and Peru and, to a lesser extent, in the arid regions of northeastern Brazil, north and central Chile and some small areas of Central America (ibid.).
This section focuses mainly on the agricultural grey water footprint caused by nitrogen pollution in LAC due to the use of fertilizers. The total of which amounted to 44,412hm3/yr for the period 1996 to 2005. This value corresponds to 46% of the total grey water footprint in the region; 96,649hm3/yr including the industrial and domestic sectors (17% and 37%, respectively). The countries contributing the most to the total agricultural grey WF of the region are Brazil, Mexico, Argentina, Chile, Colombia and Peru. The total agricultural grey WF of these six countries was 39,017hm3/yr, corresponding to 88% of the agricultural grey WF in the LAC region. Brazil and Mexico alone already constitute 61% of the agricultural grey water footprint in the region (and 51% of the LAC area).
Water qualit y7.3.2
1 8 9
PA R T 3 :WAT E R F O R F O O D A N D N O N – F O O D
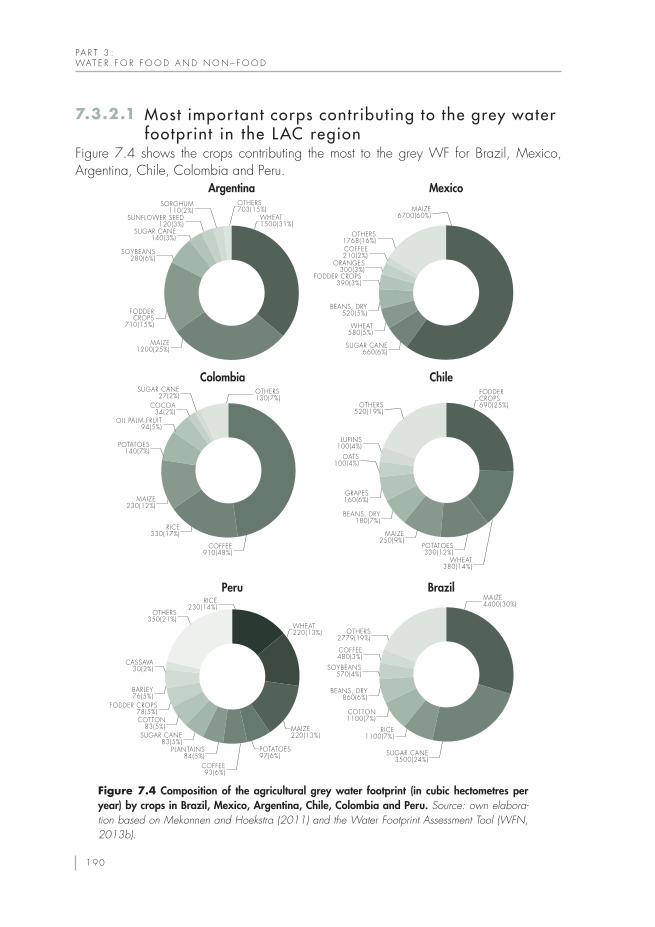
Figure 7.4 shows the crops contributing the most to the grey WF for Brazil, Mexico, Argentina, Chile, Colombia and Peru.
MAIZE220(13%)
POTATOES97(6%)
WHEAT220(13%)
WHEAT1500(31%)
OTHERS703(15%)
OTHERS130(7%)
FODDER CROPS690(25%)
Peru
Colombia
RICE230(14%)
OTHERS350(21%)
CASSAVA30(2%)
COTTON83(5%)
FODDER CROPS78(5%)
BARLEY76(5%)
SUGAR CANE83(5%)
PLANTAINS84(5%)
MAIZE230(12%)
RICE330(17%)
COFFEE910(48%)
COFFEE93(6%)
COCOA34(2%)
OIL PALM FRUIT94(5%)
POTATOES140(7%)
SUGAR CANE27(2%)
Argentina
Brazil
SOYBEANS280(6%)
SOYBEANS570(4%)
COFFEE480(3%)
OTHERS2779(19%)
MAIZE4400(30%)
SUGAR CANE140(3%)
SUNFLOWER SEED120(3%)
SORGHUM110(2%)
FODDER CROPS
710(15%)
BEANS, DRY860(6%)
COTTON1100(7%)
RICE1100(7%)
SUGAR CANE3500(24%)
MAIZE1200(25%)
Mexico
Chile
FODDER CROPS390(3%)
ORANGES300(3%)
COFFEE210(2%)
OTHERS1768(16%)
MAIZE6700(60%)
OTHERS520(19%)
LUPINS100(4%)
OATS100(4%)
BEANS, DRY520(5%)
WHEAT580(5%)
SUGAR CANE660(6%)
GRAPES160(6%)
BEANS, DRY180(7%)
MAIZE250(9%)
POTATOES330(12%)
WHEAT380(14%)
Figure 7.4 Composition of the agricultural grey water footprint (in cubic hectometres per year) by crops in Brazil, Mexico, Argentina, Chile, Colombia and Peru. Source: own elabora-tion based on Mekonnen and Hoekstra (2011) and the Water Footprint Assessment Tool (WFN, 2013b).
Most impor tant corps contributing to the grey water footprint in the LAC region
7.3.2.1
1 9 0
C H A P T E R 7WAT E R A N D A G R I C U L T U R E
These figures show that maize is a heavily fertilized crop and contributes significantly to the grey WF in all six countries: 35% of the agricultural grey WF of these six countries corresponds to this crop. In Mexico alone it contributes to 60% of the agricultural grey WF. Sugar cane contributes 12% of the total agricultural grey water footprint of these six countries, whereas coffee, rice and fodder crops contribute 5%. Notably coffee contributes 48% of the agricultural grey WF of Colombia.
These above-mentioned grey water footprint results are only with respect to nitrogen, for which the grey water footprint for all the countries and products is publicly available (Mekonnen and Hoekstra, 2011). This allows for straightforward comparisons, however, a large number of agrochemicals are used in the LAC region. For example, Costa Rica tops the list of Latin American countries using multiple agrochemicals, which counter-balances many of their environmental policies seeking to improve environmental quality in the country (LA-Costa Rica, 2012). Costa Rica annually imports about 13,000t of some 300 active ingredients, many of which are restricted and/or prohibited in other countries and are even included in international disposal agreements (ibid.). A portion of the active ingredients is repackaged and re-exported. Although there are no precise data on the exported quantities, it is estimated that around 20–25% of total imports are re-exported (Ramirez et al., 2009). The import data therefore does not accurately reflect the quantities used in the fields, but they serve to check usage trends (LA-Costa Rica, 2012).
The average world WF of consumption of agricultural products was 1,268m3/capita/yr during the period 1996–2005, with 1,156m3/capita/yr corresponding to the blue and green WF and 112m3/capita/yr to the grey WF, equivalent to 91 and 9% of the total respectively (Mekonnen and Hoekstra, 2011). For the LAC region, the average was 1,560m3/capita/yr, with 1,473m3/capita/yr corresponding to the blue and green WF and 87m3/capita/yr to the grey WF, equivalent to 94 and 6 % respectively. Grey WF values range from 272.4m3/capita/yr for Belize and 19.5m3/capita/yr for Bolivia.
The externalization of the grey WF is equivalent to the externalization of pollution due to importing of agricultural products. Argentina has the lowest external grey water footprint as a proportion of their total grey WF (6%), together with Paraguay and Belize (9%). On the other hand, countries like Bahamas, Saint Lucia, Grenada, Trinidad and Tobago, Saint Vincent and the Grenadines, Antigua and Barbuda and Dominican Republic have a 100% external grey water footprint. This indicates that while for Argentina, Paraguay and Belize the pollution caused by consumption of agricultural products (in this case due to nitrogen) is mostly internal, i.e. caused within the borders of the countries, pollution caused due to consumption of agricultural products in the Antilles is borne by other countries.
The net virtual water import of a country or region during a given period of time is defined as the gross import of virtual water minus the gross export. A positive net import of virtual water implies net inflow of virtual water to the country or region. A negative net import
Virtual water flows related to trade of agricultural products7.3.3
Grey water footprint of consumption of agricultural products in LAC
7.3.2.2
1 9 1
PA R T 3 :WAT E R F O R F O O D A N D N O N – F O O D
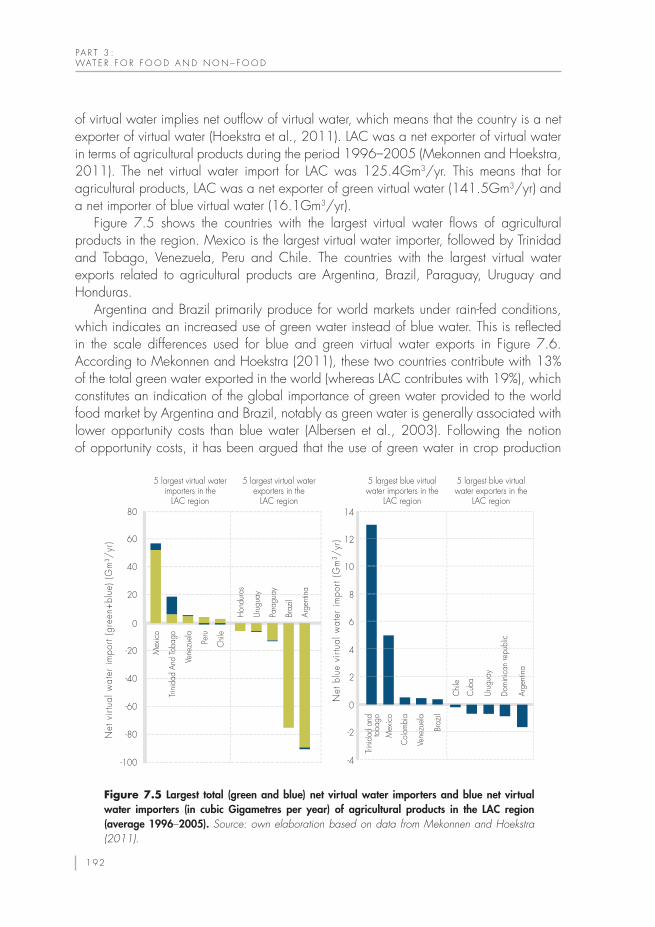
of virtual water implies net outflow of virtual water, which means that the country is a net exporter of virtual water (Hoekstra et al., 2011). LAC was a net exporter of virtual water in terms of agricultural products during the period 1996–2005 (Mekonnen and Hoekstra, 2011). The net virtual water import for LAC was 125.4Gm3/yr. This means that for agricultural products, LAC was a net exporter of green virtual water (141.5Gm3/yr) and a net importer of blue virtual water (16.1Gm3/yr).
Figure 7.5 shows the countries with the largest virtual water flows of agricultural products in the region. Mexico is the largest virtual water importer, followed by Trinidad and Tobago, Venezuela, Peru and Chile. The countries with the largest virtual water exports related to agricultural products are Argentina, Brazil, Paraguay, Uruguay and Honduras.
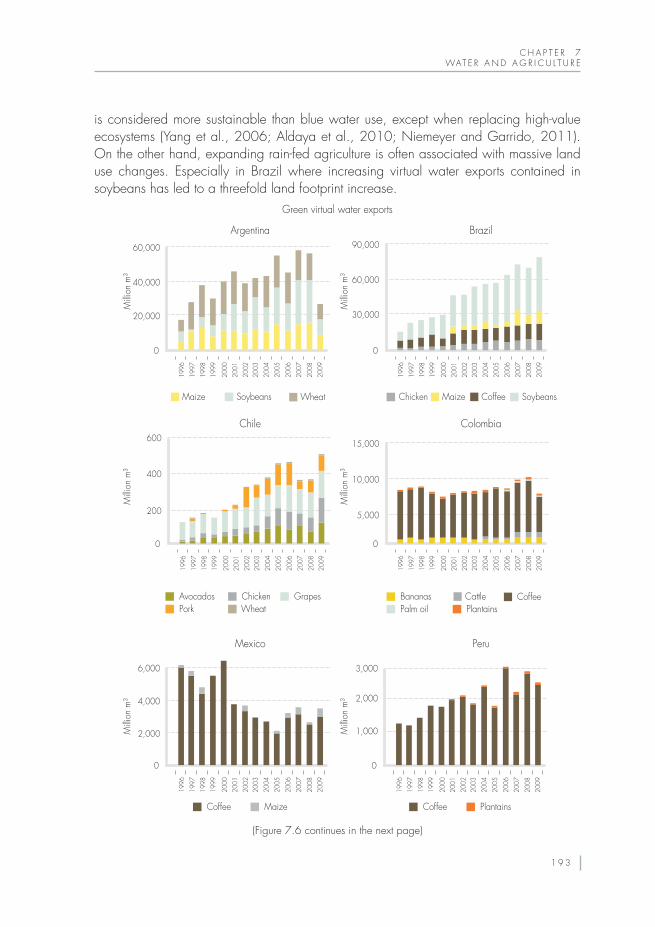
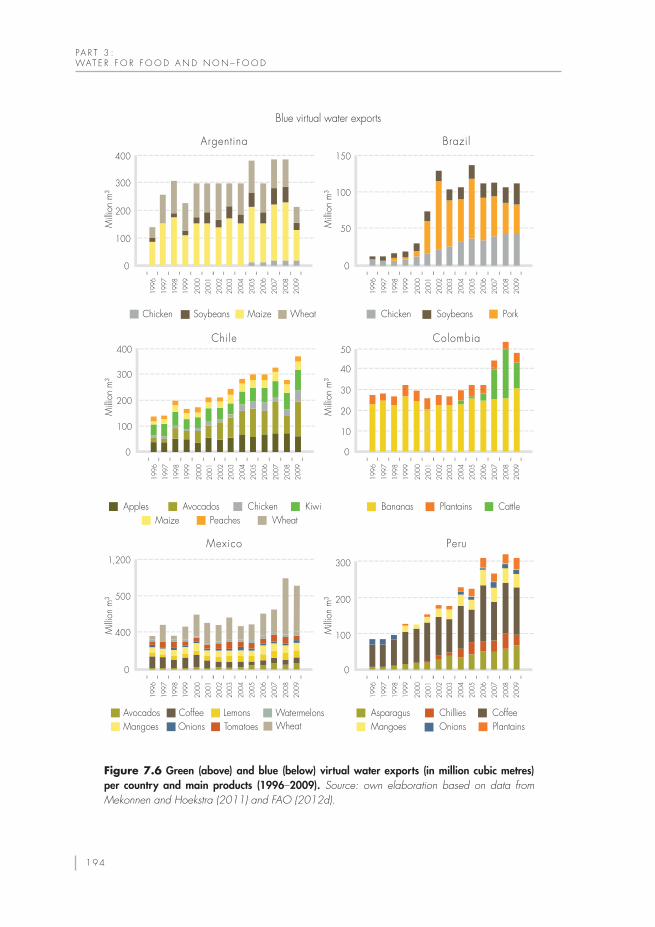
Argentina and Brazil primarily produce for world markets under rain-fed conditions, which indicates an increased use of green water instead of blue water. This is reflected in the scale differences used for blue and green virtual water exports in Figure 7.6. According to Mekonnen and Hoekstra (2011), these two countries contribute with 13% of the total green water exported in the world (whereas LAC contributes with 19%), which constitutes an indication of the global importance of green water provided to the world food market by Argentina and Brazil, notably as green water is generally associated with lower opportunity costs than blue water (Albersen et al., 2003). Following the notion of opportunity costs, it has been argued that the use of green water in crop production
Net
virt
ual w
ater
impo
rt (g
reen
+blu
e) (G
m³/
yr)
Mex
ico
Trini
dad
And
Toba
go
Vene
zuel
a
Peru
Chi
le
Hon
dura
s
Urug
uay
Para
guay
Braz
il
Arge
ntin
a
-80
-100
-60
-40
-20
20
40
60
80
0
5 largest virtual water importers in the
LAC region
5 largest virtual water exporters in the
LAC region
Net
blu
e vi
rtual
wat
er im
port
(Gm
³/yr
)
Trini
dad
and
toba
goM
exic
o
Col
ombi
a
Vene
zuel
a
Braz
il
Chi
le
Cub
a
Urug
uay
Dom
inic
an re
publ
ic
Arge
ntin
a
-2
-4
0
2
4
6
8
10
12
14
5 largest blue virtual water importers in the
LAC region
5 largest blue virtual water exporters in the
LAC region
Figure 7.5 Largest total (green and blue) net virtual water importers and blue net virtual water importers (in cubic Gigametres per year) of agricultural products in the LAC region (average 1996–2005). Source: own elaboration based on data from Mekonnen and Hoekstra (2011).
1 9 2
C H A P T E R 7WAT E R A N D A G R I C U L T U R E
is considered more sustainable than blue water use, except when replacing high-value ecosystems (Yang et al., 2006; Aldaya et al., 2010; Niemeyer and Garrido, 2011). On the other hand, expanding rain-fed agriculture is often associated with massive land use changes. Especially in Brazil where increasing virtual water exports contained in soybeans has led to a threefold land footprint increase.
0
20,000
40,000
60,000
0
30,000
60,000
90,000
Argentina Brazil
Green virtual water exports
Chile Colombia
Mexico Peru
0
200
400
600
0
5,000
10,000
15,000
0
2,000
4,000
6,000
0
1,000
3,000
2,000
Maize WheatSoybeans
CattleBananasPalm oil Plantains
CoffeeChicken
Coffee
Maize Soybeans
AvocadosPork
ChickenWheat
Grapes
Coffee Maize Coffee Plantains
1996
1998
2000
2002
2004
2006
2008
1997
1999
2001
2003
2005
2007
2009
1996
1998
2000
2002
2004
2006
2008
1997
1999
2001
2003
2005
2007
2009
1996
1998
2000
2002
2004
2006
2008
1997
1999
2001
2003
2005
2007
2009
1996
1998
2000
2002
2004
2006
2008
1997
1999
2001
2003
2005
2007
2009
1996
1998
2000
2002
2004
2006
2008
1997
1999
2001
2003
2005
2007
2009
1996
1998
2000
2002
2004
2006
2008
1997
1999
2001
2003
2005
2007
2009
Milli
on m
³M
illion
m³
Milli
on m
³
Milli
on m
³M
illion
m³
Milli
on m
³
(Figure 7.6 continues in the next page)
1 9 3
PA R T 3 :WAT E R F O R F O O D A N D N O N – F O O D
0
100
200
300
40019
96
1998
2000
2002
2004
2006
2008
1997
1999
2001
2003
2005
2007
2009
1996
1998
2000
2002
2004
2006
2008
1997
1999
2001
2003
2005
2007
2009
1996
1998
2000
2002
2004
2006
2008
1997
1999
2001
2003
2005
2007
2009
1996
1998
2000
2002
2004
2006
2008
1997
1999
2001
2003
2005
2007
2009
1996
1998
2000
2002
2004
2006
2008
1997
1999
2001
2003
2005
2007
2009
1996
1998
2000
2002
2004
2006
2008
1997
1999
2001
2003
2005
2007
2009
0
50
100
150
Argentina Brazil
Chile Colombia
Mexico Peru
0
100
200
300
400
0
20
10
40
30
50
0
400
500
1,200
0
100
200
300
MaizeChicken WheatSoybeans
CattleBananas Plantains
PorkChicken Soybeans
Apples KiwiAvocadosMaize Wheat
ChickenPeaches
AvocadosMangoes
CoffeeOnions
LemonsTomatoes
AsparagusMangoes
ChilliesOnions
CoffeePlantains
WatermelonsWheat
Milli
on m
³M
illion
m³
Milli
on m
³
Milli
on m
³M
illion
m³
Milli
on m
³
Blue virtual water exports
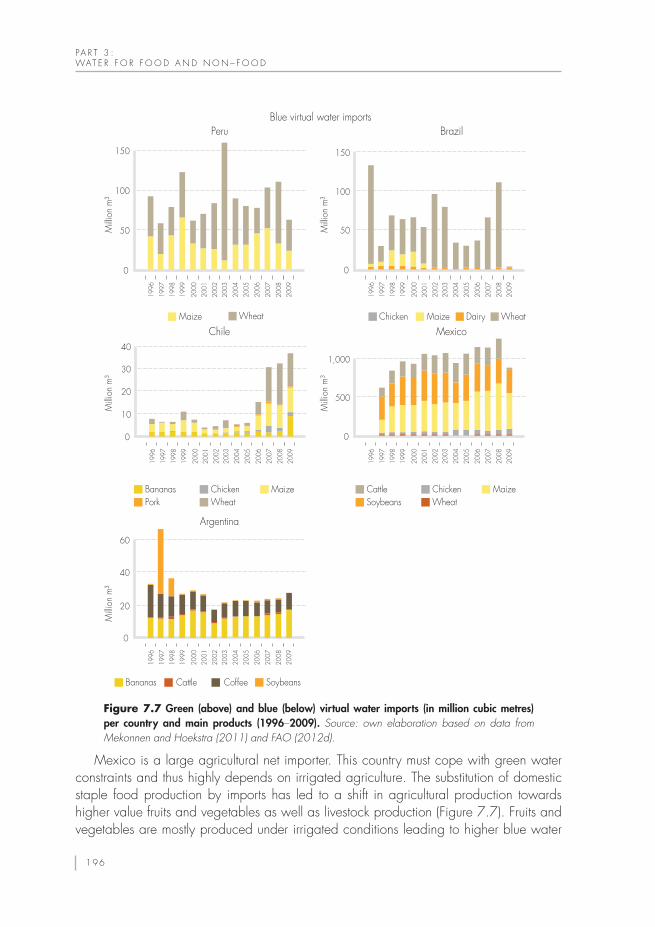
Figure 7.6 Green (above) and blue (below) virtual water exports (in million cubic metres) per country and main products (1996–2009). Source: own elaboration based on data from Mekonnen and Hoekstra (2011) and FAO (2012d).
1 9 4
C H A P T E R 7WAT E R A N D A G R I C U L T U R E
0
18,000
3,000
6,000
9,000
12,000
15,000
0
5,000
4,000
3,000
2,000
1,000
Mexico Peru
Argentina Brazil
Chile
0
1,000
800
400
200
600
0
10,000
20,000
0
500
1,000
1,500
Green virtual water imports
Maize Wheat
Bananas PorkCattle
Bananas Chicken
Coffee CattleSoybeans
DairyWheat
Maize
Maize
CattlePork Soybeans
ChickenWheatMaize
Soybeans
1996
1998
2000
2002
2004
2006
2008
1997
1999
2001
2003
2005
2007
2009
1996
1998
2000
2002
2004
2006
2008
1997
1999
2001
2003
2005
2007
2009
1996
1998
2000
2002
2004
2006
2008
1997
1999
2001
2003
2005
2007
2009
1996
1998
2000
2002
2004
2006
2008
1997
1999
2001
2003
2005
2007
2009
1996
1998
2000
2002
2004
2006
2008
1997
1999
2001
2003
2005
2007
2009
Milli
on m
³M
illion
m³
Milli
on m
³M
illion
m³
Milli
on m
³
(Figure 7.7 continues in the next page)
1 9 5
PA R T 3 :WAT E R F O R F O O D A N D N O N – F O O D
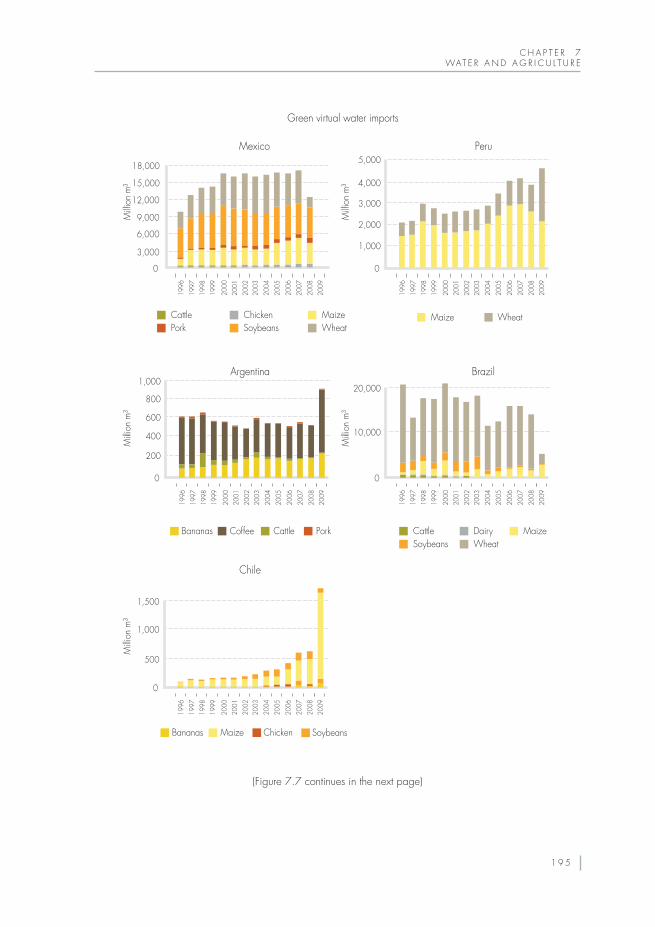
Mexico is a large agricultural net importer. This country must cope with green water constraints and thus highly depends on irrigated agriculture. The substitution of domestic staple food production by imports has led to a shift in agricultural production towards higher value fruits and vegetables as well as livestock production (Figure 7.7). Fruits and vegetables are mostly produced under irrigated conditions leading to higher blue water
0
50
100
150
0
50
100
150
Peru Brazil
Chile Mexico
Argentina
0
10
20
30
40
0
500
1,000
0
20
40
60
Maize Wheat Maize WheatDairyChicken
BananasPork
ChickenWheat
Maize
CoffeeBananas Cattle
CattleSoybeans
ChickenWheat
Maize
Soybeans
Blue virtual water imports
1996
1998
2000
2002
2004
2006
2008
1997
1999
2001
2003
2005
2007
2009
1996
1998
2000
2002
2004
2006
2008
1997
1999
2001
2003
2005
2007
2009
1996
1998
2000
2002
2004
2006
2008
1997
1999
2001
2003
2005
2007
2009
1996
1998
2000
2002
2004
2006
2008
1997
1999
2001
2003
2005
2007
2009
1996
1998
2000
2002
2004
2006
2008
1997
1999
2001
2003
2005
2007
2009
Milli
on m
³M
illion
m³
Milli
on m
³
Milli
on m
³M
illion
m³
Figure 7.7 Green (above) and blue (below) virtual water imports (in million cubic metres) per country and main products (1996–2009). Source: own elaboration based on data from Mekonnen and Hoekstra (2011) and FAO (2012d).
1 9 6
C H A P T E R 7WAT E R A N D A G R I C U L T U R E
use. Furthermore, agricultural production has increased substantially due to global market forces. This has resulted in accelerating blue water depletion rates. For example, the Rio Grande river basin has already reached or surpassed sustainable extraction rates during some months of the year (Chapter 6). A similar trend can be observed in Chile and Peru. In Argentina and Brazil blue water exports play a rather minor role.
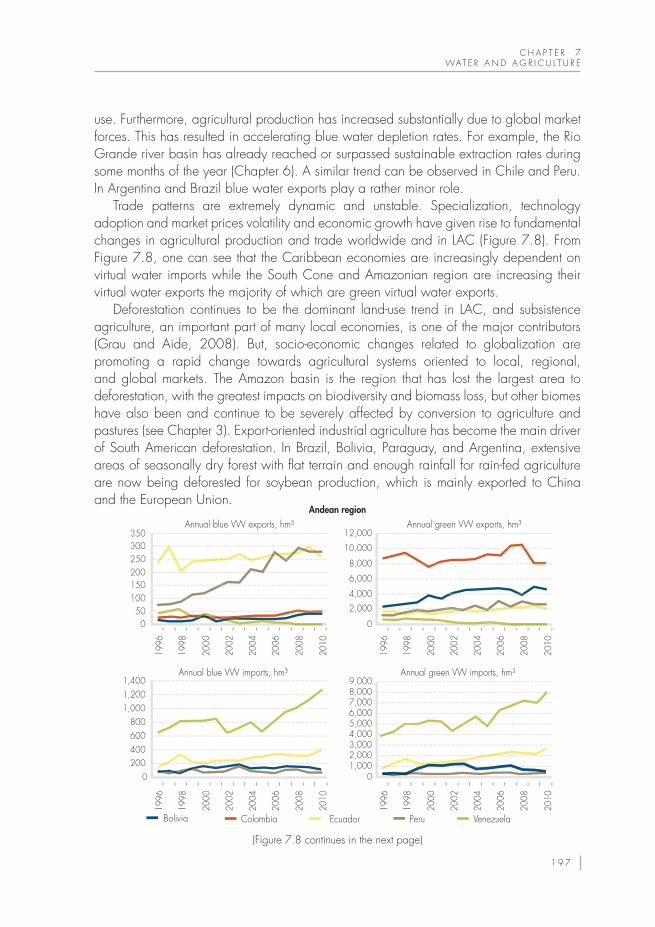
Trade patterns are extremely dynamic and unstable. Specialization, technology adoption and market prices volatility and economic growth have given rise to fundamental changes in agricultural production and trade worldwide and in LAC (Figure 7.8). From Figure 7.8, one can see that the Caribbean economies are increasingly dependent on virtual water imports while the South Cone and Amazonian region are increasing their virtual water exports the majority of which are green virtual water exports.
Deforestation continues to be the dominant land-use trend in LAC, and subsistence agriculture, an important part of many local economies, is one of the major contributors (Grau and Aide, 2008). But, socio-economic changes related to globalization are promoting a rapid change towards agricultural systems oriented to local, regional, and global markets. The Amazon basin is the region that has lost the largest area to deforestation, with the greatest impacts on biodiversity and biomass loss, but other biomes have also been and continue to be severely affected by conversion to agriculture and pastures (see Chapter 3). Export-oriented industrial agriculture has become the main driver of South American deforestation. In Brazil, Bolivia, Paraguay, and Argentina, extensive areas of seasonally dry forest with flat terrain and enough rainfall for rain-fed agriculture are now being deforested for soybean production, which is mainly exported to China and the European Union.
1996
1998
2000
2002
2004
2006
2008
2010
1996
1998
2000
2002
2004
2006
2008
2010
050
400200
600800
1,0001,2001,400
0
1996
1998
2000
2002
2004
2006
2008
2010
1996
1998
2000
2002
2004
2006
2008
2010
00
2,000
1,0002,0003,0004,0005,0006,0007,0008,0009,000
4,000
6,000
8,000
10,000
12,000
100150200250300350
Annual blue VW exports, hm³Andean region
Annual green VW exports, hm³
Annual blue VW imports, hm³ Annual green VW imports, hm³
Bolivia Colombia VenezuelaEcuador Peru
(Figure 7.8 continues in the next page)
1 9 7
PA R T 3 :WAT E R F O R F O O D A N D N O N – F O O D
02000
0200400600800
1,0001,2001,4001,600
200020002000200020001,4001,600
01,0002,0003,0004,0005,0006,0007,0008,000
01,0002,0003,0004,0005,0006,0007,0008,000
1996
1998
2000
2002
2004
2006
2008
2010
1996
1998
2000
2002
2004
2006
2008
2010
1996
1998
2000
2002
2004
2006
2008
2010
1996
1998
2000
2002
2004
2006
2008
2010
Annual blue VW expor ts, hm³ Annual green VW expor ts, hm³
Annual blue VW impor ts, hm³ Annual green VW impor ts, hm³
Costa Rica El Salvador
Belize
Guatemala Honduras
Mexico Nicaragua Panama
Mesoamerica
Amazonian region
100
200
300
400
500
600
020406080
100120140160
050
100150200250300350400450
0
20,000
40,000
60,000
80,000
100,000
120,00050
40
30
20
10
450
350
250
150
50
0.18
0.14
0.10
0.06
0.02
0.16
0.12
0.08
0.04
1996
1998
2000
2002
2004
2006
2008
2010
1996
1998
2000
2002
2004
2006
2008
2010
0
1996
1998
2000
2002
2004
2006
2008
2010
1996
1998
2000
2002
2004
2006
2008
2010
Annual blue VW expor ts, hm³ Annual green VW expor ts, hm³
Annual blue VW impor ts, hm³ Annual green VW impor ts, hm³
Guyana (right axis)
Suriname (right axis)
Brazil (left axis)
Guyana (right axis)
Suriname (right axis)
Brazil (left axis)
Guyana Guyana (right axis)Brazil Brazil (left axis)
(Figure 7.8 continues in the next page)
1 9 8
C H A P T E R 7WAT E R A N D A G R I C U L T U R E
0100200300400500600700800
0
2,000
4,000
6,000
8,000
10,000
12,000
14,000
0500
1,0001,5002,0002,5003,0003,5004,0004,500
0200400600800
1,0001,2001,4001,6001,800
1996
1998
2000
2002
2004
2006
2008
2010
1996
1998
2000
2002
2004
2006
2008
2010
1996
1998
2000
2002
2004
2006
2008
2010
1996
1998
2000
2002
2004
2006
2008
2010
Annual blue VW expor ts, hm³Caribbean
South Cone
Annual greenVW expor ts, hm³
Annual blue VW impor ts, hm³ Annual green VW impor ts, hm³
Bahamas Cuba
Dominica
Dominican R. Haiti
Saint Lucia Trinidad and Tobago Barbados
Grenada Jamaica
Saint Vicent and the Grenadines
0
200
400
600
800
1,000
1,200
0
20
40
60
80
100
120
010,00020,00030,00040,00050,00060,00070,000
050
100150200250300350400450500
1996
1998
2000
2002
2004
2006
2008
2010
1996
1998
2000
2002
2004
2006
2008
2010
1996
1998
2000
2002
2004
2006
2008
2010
1996
1998
2000
2002
2004
2006
2008
2010
Annual blue VW expor ts, hm³ Annual green VW expor ts, hm³
Annual blue VW impor ts, hm³ Annual green VW impor ts, hm³
Argentina Chile Paraguay Uruguay
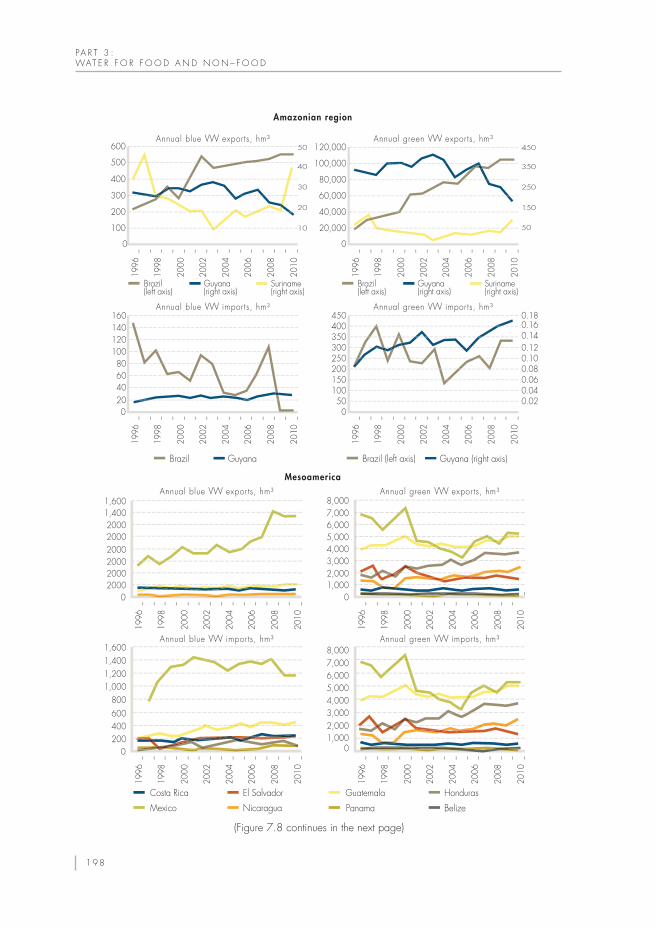
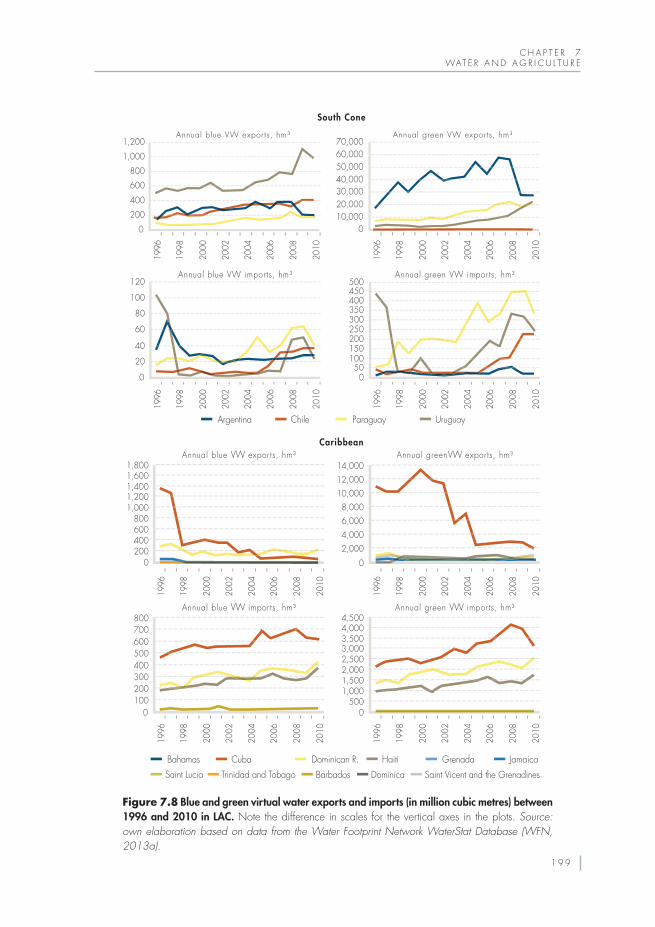
Figure 7.8 Blue and green virtual water exports and imports (in million cubic metres) between 1996 and 2010 in LAC. Note the difference in scales for the vertical axes in the plots. Source: own elaboration based on data from the Water Footprint Network WaterStat Database (WFN, 2013a).
1 9 9
PA R T 3 :WAT E R F O R F O O D A N D N O N – F O O D
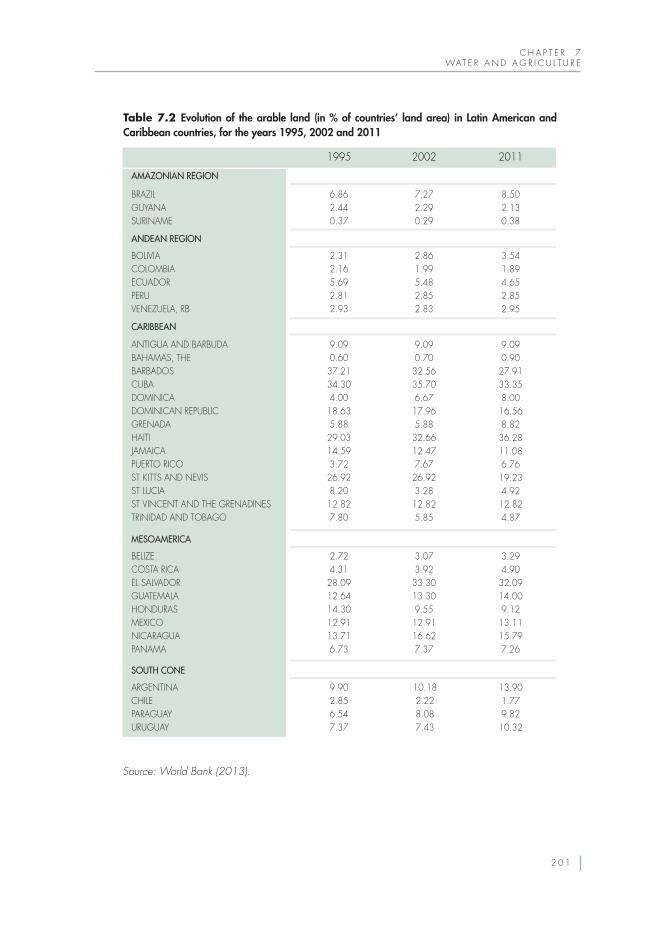
The evolution of arable lands in LAC since 1995 (Table 7.2) shows that arable land use has particularly increased for the countries in the Amazonian region, in the South Cone and in Mesoamerica. It has remained constant in the Andean region, and decreased in the Caribbean region. In 2011, average arable land values ranged between 3.2% for the Andean region and 14.9% for the Caribbean. However, the arable land per capita shows a decrease for all the LAC regions between 1995 and 2011, except for the South Cone region, which increased from 0.47ha/person in 1995 to 0.53ha/person in 2011. The lowest regional average of arable land per capita is registered for the Caribbean region (0.08ha/person), and the highest for the South Cone (0.49ha/person).
According to the CAWMA (2007), part of the increase in food production can be achieved by improving crop yields and increasing crop water productivity through appropriate investments in both irrigated and rain-fed agriculture. There is good scope for improved productivity in LAC rain-fed areas but less so in irrigated areas. Rain-fed agriculture holds great under-exploited potential for increasing water productivity through better water management practices – gaining more yield and greater value from water. This is an effective means of intensifying agricultural production and reducing environmental degradation (ibid.).
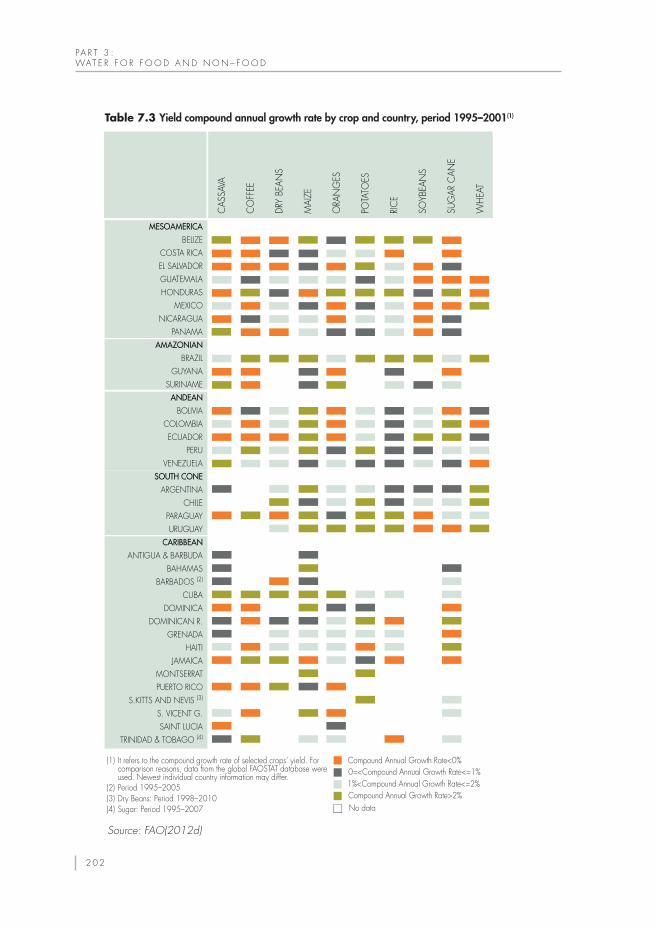
LAC is globally important in a number of crops and often achieves yields significantly above the developing world average (Hall, 2001). As shown in Table 7.3, the major cereal yields (e.g. maize, wheat, rice) have increased in line with their production, during the period 1995–2005. The average regional yield per unit of land for wheat in LAC is similar to the average yield output of 2.5–2.7t/ha in North America, while wheat yield in Western Europe is approximately twice as large (5t/ha) and in sub-Saharan Africa it remains below 2t/ha. Yield increases have also happened in tuberous crops (principally potato).
However, yield gaps are still significant in the region, though not so pronounced for the main exporters, such as Argentina or Brazil. Closing the yield gap on a large scale requires investments in rural infrastructure and institutions as well as technology transfer. In LAC, public sector agencies together with the private sector have made some headway in closing the yield gap.
Trends in agriculture: physical, economic and social aspects
7.4
Land accounting
Productivit y analysis
7.4.1
7.4.2
Yield7.4.2.1
2 0 0
C H A P T E R 7WAT E R A N D A G R I C U L T U R E
Table 7.2 Evolution of the arable land (in % of countries’ land area) in Latin American and Caribbean countries, for the years 1995, 2002 and 2011
Source: World Bank (2013).
AMAZONIAN REGION
BRAZILGUYANASURINAME
1995
6.862.440.37
2002
7.272.290.29
2011
8.502.130.38
BOLIVIACOLOMBIAECUADORPERUVENEZUELA, RB
2.312.165.692.812.93
2.861.995.482.852.83
3.541.894.652.852.95
ANTIGUA AND BARBUDABAHAMAS, THEBARBADOSCUBADOMINICADOMINICAN REPUBLICGRENADAHAITIJAMAICAPUERTO RICOST KITTS AND NEVISST LUCIAST VINCENT AND THE GRENADINESTRINIDAD AND TOBAGO
9.090.6037.2134.304.0018.635.8829.0314.593.7226.928.2012.827.80
9.090.70
32.5635.706.67
17.965.88
32.6612.477.67
26.923.28
12.825.85
9.090.90
27.9133.358.00
16.568.82
36.2811.086.76
19.234.92
12.824.87
BELIZECOSTA RICAEL SALVADORGUATEMALAHONDURASMEXICONICARAGUAPANAMA
2.724.3128.0912.6414.3012.9113.716.73
3.073.92
33.3013.309.55
12.9116.627.37
3.294.90
32.0914.009.12
13.1115.797.26
ARGENTINACHILEPARAGUAYURUGUAY
9.902.856.547.37
10.182.228.087.43
13.901.779.82
10.32
ANDEAN REGION
CARIBBEAN
MESOAMERICA
SOUTH CONE
2 0 1
PA R T 3 :WAT E R F O R F O O D A N D N O N – F O O D
MESOAMERICABELIZE
COSTA RICAEL SALVADORGUATEMALAHONDURAS
MEXICONICARAGUA
PANAMAAMAZONIAN
BRAZILGUYANA
SURINAMEANDEAN
BOLIVIACOLOMBIAECUADOR
PERUVENEZUELA
SOUTH CONEARGENTINA
CHILEPARAGUAYURUGUAY
CARIBBEANANTIGUA & BARBUDA
BAHAMASBARBADOS (2)
CUBADOMINICA
DOMINICAN R.GRENADA
HAITIJAMAICA
MONTSERRATPUERTO RICO
S.KITTS AND NEVIS (3)
S. VICENT G.SAINT LUCIA
TRINIDAD & TOBAGO (4)
CAS
SAVA
CO
FFEE
DRY
BEAN
S
MAI
ZE
ORA
NG
ES
POTA
TOES
RIC
E
SOYB
EAN
S
SUG
AR C
ANE
WH
EAT
1%<Compound Annual Growth Rate<=2%0=<Compound Annual Growth Rate<=1%
Compound Annual Growth Rate>2%
Compound Annual Growth Rate<0%
No data
It refers to the compound growth rate of selected crops’ yield. For comparison reasons, data from the global FAOSTAT database were used. Newest individual country information may differ.
(1)
Period 1995–2005(2)Dry Beans: Period 1998–2010(3)Sugar: Period 1995–2007(4)
Table 7.3 Yield compound annual growth rate by crop and country, period 1995–2001(1)
Source: FAO(2012d)
2 0 2
C H A P T E R 7WAT E R A N D A G R I C U L T U R E
Agricultural economic productivity (US$/ha)Agriculture is a significant economic sector for many of the LAC countries. It is so at the macro level, with some of the countries being major world players in the agricultural commodities markets, or at the micro level, with agriculture playing a significant role in terms of food security.
In the last decade, the largest producers in the Southern hemisphere have responded to demand by increasing their cultivated areas, especially that of cereals, oil crops and sugarcane, and most significantly the share of those products that are irrigated. However, the countries production differs greatly. Some countries have highly specialized production (Argentina, Brazil), while others rely on a wider array of products (Mexico, Colombia, Peru, Chile). Consequently the economic effects of world markets on each country’s agricultural sector will differ substantially.
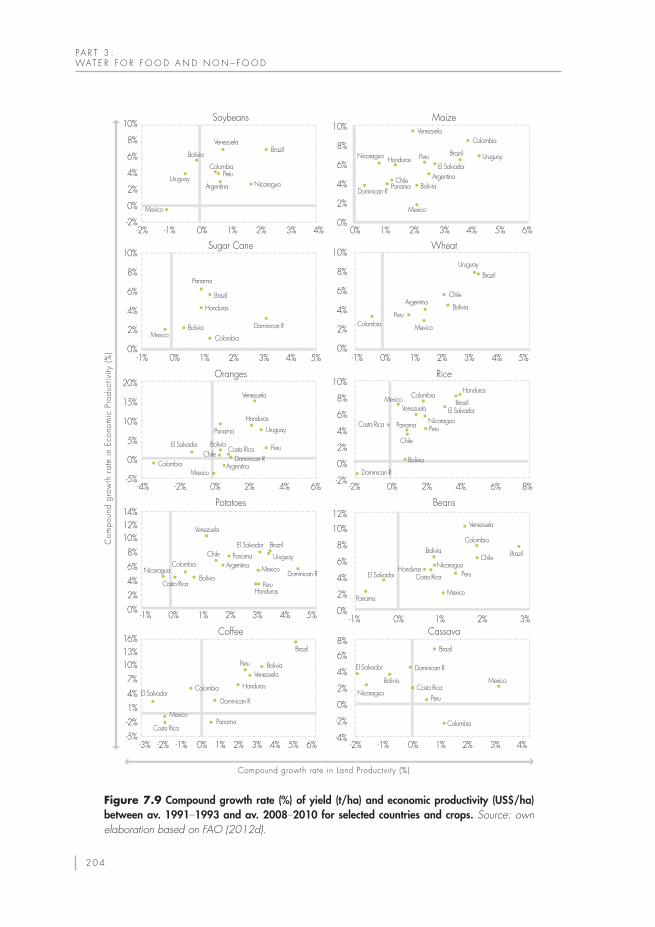
On average, yields in the region have improved in the period 2000–2010 by 9% whereas economic productivity of land grew a 19% (constant US$/ha, own calculations based on FAO, 2012d). As reported by FAO (2012a), the increase in production, productivity and income vary between the countries. Figure 7.9 shows the compound growth rate in agricultural land productivity in physical productivity, that is, yield (t/ha), and in economic productivity (US$/ha) between the average of the years 1991–1993 and 2008–2010 for the countries in Central and South America, for some specific products. Economic productivity growth rates are consistently higher than physical productivity growth rates. Particularly potatoes, coffee, wheat and maize have shown in average higher growth rates. Nevertheless, the behaviour of each product shows great variations among countries, as in the case of sugarcane or cassava.
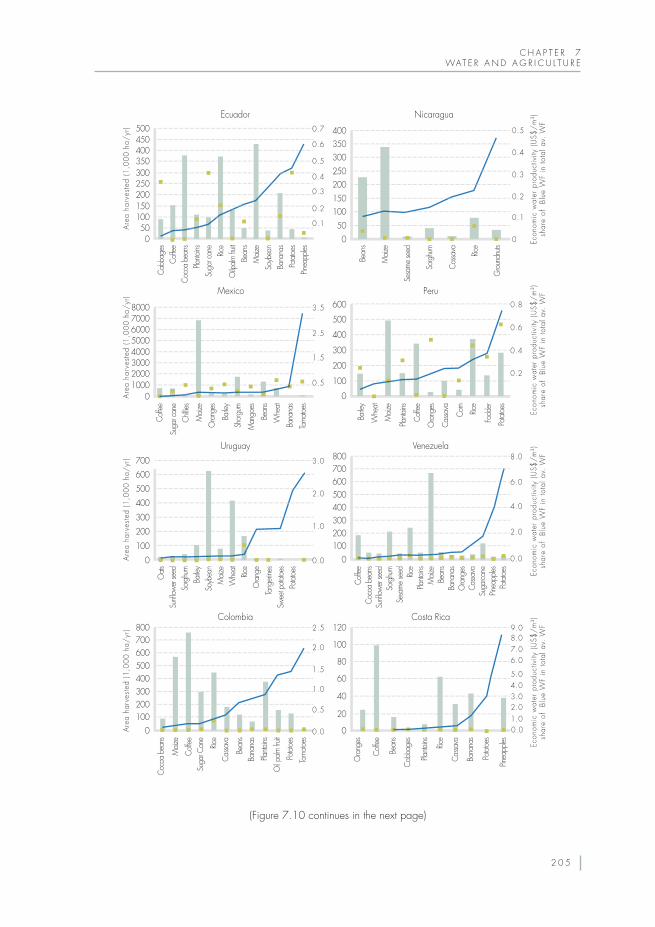
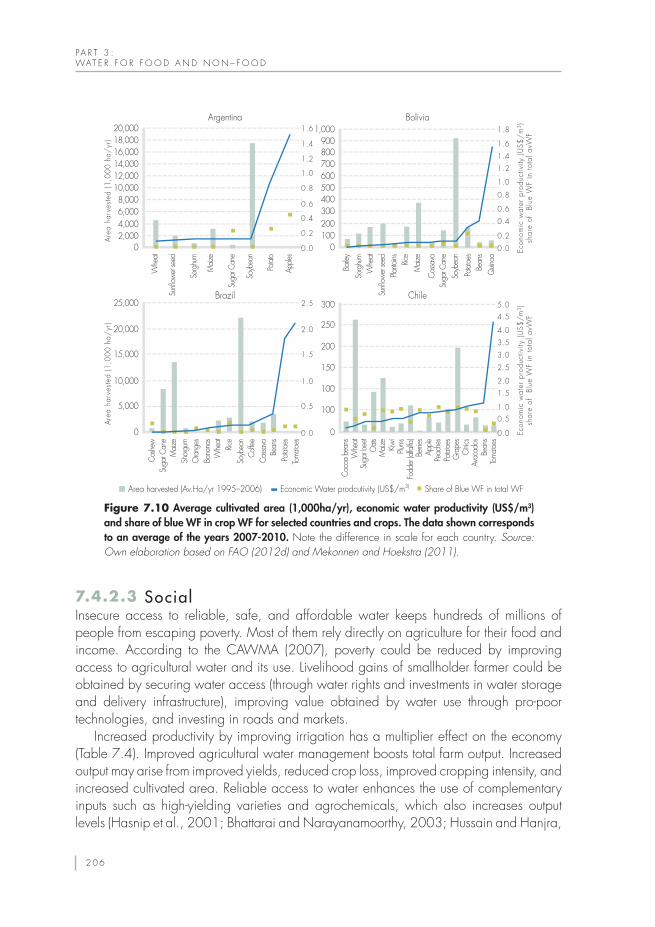
Economic blue water productivity: surface and groundwaterFor selected countries Figure 7.10 shows the area harvested and the economic water productivity per crop alongside the share of blue WF related to the total (green and blue) WF. These data are averages for the period 1996–2005. The cultivated surface data was obtained from FAO (2012d). Economic water productivity was calculated using the average producer’s price per crop (US$, constant prices) from FAO (2012d) divided by the green and blue water footprint. Data on green and blue water footprints was obtained from the respective countries report or, in the absence of a specific national figure, from Mekonnen and Hoekstra (2011).
Some countries show low economic water productivity, such as Argentina, Brazil, Nicaragua, Bolivia, Uruguay and Mexico. In very general terms, these countries dedicate significant areas for the cultivation of cereals, coffee, cocoa and sugarcane, which have lower economic productivity. Peru, Ecuador and Chile, and to a lesser extent Colombia and Costa Rica, do have a notable amount of area dedicated to crops with medium-high economic productivity, like grapes, onions, pineapples and potatoes. On average, Chile, Venezuela and Costa Rica show higher average productivities (0.57, 0.54 and 1.21US$/m3 respectively), whereas Bolivia, Argentina and Brazil show lower ones (0.13, 0.12 and 0.11US$/ m3).
Economic7.4.2.2
2 0 3
PA R T 3 :WAT E R F O R F O O D A N D N O N – F O O D
Soybeans Maize
Sugar Cane Wheat
Oranges Rice
Potatoes Beans
Coffee Cassava
Compound growth rate in Land Productvity (%)
Com
poun
d gr
owth
rat
e in
Eco
nom
ic P
rodu
ctiv
ity (
%)
10%
8%
6%
4%
2%
0%
-2%
10%
8%
6%
4%
2%
0%
-2%
10%
12%
8%
6%
4%
2%
0%
6%
8%
4%
2%
0%
-2%
-4%
10%12%14%
8%6%4%2%0%
10%13%16%
7%4%1%-2%-5%
0% 1% 2%-2%-3% -1% 3% 4% 5% 6%
-1% 0% 1% 2% 3% 4% 5%
-1% 0% 1% 2% 3% 4% 5%
-2% -1% 0% 1% 2% 3% 4%
-4% -2% 0% 2% 4% 6% -2%
-1% 0% 1% 2% 3%
0% 2% 4% 6% 8%
-1% 0% 1% 2% 3% 4% 5%
-1% 0% 1% 2% 3% 4%-2% 0% 1% 2% 3% 4% 5% 6%
10%
8%
6%
4%
2%
0%
10%
8%
6%
4%
2%
0%
10%
8%
6%
4%
2%
0%
20%
15%
10%
5%
0%
-5%
Nicaragua
VenezuelaBrazil
Peru
Peru
Peru
Peru
PeruPeru
Peru
Peru
Peru
Colombia
Colombia
Colombia
Colombia
Colombia
Colombia
Colombia
Colombia
Colombia
Colombia
NicaraguaArgentinaArgentina
Argentina
Argentina
Argentina
Brazil
Brazil
Brazil
Brazil
BrazilBrazil
Brazil
Honduras
Honduras
Honduras
Honduras
Honduras
Honduras
Honduras
Uruguay
Uruguay
Uruguay
Uruguay
UruguayEl Salvador
El Salvador
El Salvador
El Salvador
El Salvador
El Salvador
El Salvador
Nicaragua
Chile
Panama
Chile
Bolivia
Chile
Chile Chile
Nicaragua
NicaraguaNicaragua
Panama
Panama
Panama
Panama
Panama
PanamaChile
Dominican R
Dominican R
Dominican R
Dominican R
Dominican R
Dominican RCosta Rica
Costa RicaCosta Rica
Costa Rica
Costa Rica
Costa Rica
Dominican RBolivia
Bolivia
Bolivia
Bolivia
Bolivia
Bolivia
Bolivia
Bolivia
Bolivia
Mexico
Mexico
Mexico
Mexico
Mexico
Mexico
Mexico
Mexico
Brazil
Venezuela
Venezuela
Venezuela
Venezuela
Venezuela
VenezuelaMexico
Mexico
Figure 7.9 Compound growth rate (%) of yield (t/ha) and economic productivity (US$/ha) between av. 1991–1993 and av. 2008–2010 for selected countries and crops. Source: own elaboration based on FAO (2012d).
2 0 4
C H A P T E R 7WAT E R A N D A G R I C U L T U R E
Ecuador
Mexico
Nicaragua
Peru
Uruguay Venezuela
50
100150
200250
300350400
0
100
200
300
400
500
600
0
100200300400500600700800
0
100200300400500600700800
0
100
200
300
400
500
600
700
0
10002000300040005000600070008000
0
50100150200250300350400450500
Cabb
ages
Are
a ha
rves
ted
(1,0
00
ha/
yr)
Econ
omic
wat
er p
rodu
ctiv
ity (
US$
/m
³)sh
are
of
Blue
WF
in to
tal a
v. W
F
Are
a ha
rves
ted
(1,0
00
ha/
yr)
Econ
omic
wat
er p
rodu
ctiv
ity (
US$
/m
³)sh
are
of
Blue
WF
in to
tal a
v. W
F
Are
a ha
rves
ted
(1,0
00
ha/
yr)
Econ
omic
wat
er p
rodu
ctiv
ity (
US$
/m
³)sh
are
of
Blue
WF
in to
tal a
v. W
F
Coffe
e
Coffe
eO
atsSu
n�ow
er se
edSo
rghu
mBa
rley
Soyb
ean
Mai
zeW
heat
Rice
Ora
nge
Tang
erine
sSw
eet p
otatoe
sPo
tatoe
s
Coffe
eCo
coa
bean
sSu
n�ow
er se
edSo
rghu
mSe
same
seed Rice
Planta
insM
aize
Bean
sBa
nana
sO
rang
esCa
ssava
Suga
rcane
Pinea
pples
Potat
oes
Suga
r can
eCh
illies
Mai
ze
Ora
nges
Barle
ySh
orgu
m
Man
goes
Bean
s
Whe
at
Bana
nas
Toma
toes
Potat
oes
Fodd
er
Rice
Corn
Cassa
va
Coffe
e
Ora
nges
Planta
ins
Whe
at
Mai
ze
Barle
y
Coco
a be
ans
Planta
insSu
gar c
ane
Rice
Rice
Gro
undn
uts
Cassa
va
Sorg
hum
Sesa
me se
ed
Oilp
alm fru
itBe
ans
Bean
s
Mai
ze
Mai
ze
Soyb
ean
Bana
nas
Potat
oes
Pinea
pples
0.7 0.5
0.4
0.3
0.2
0.1
0
0.6
0.5
0.4
0.3
0.2
0.1
3.5 0.8
0.6
0.4
0.2
8.0
6.0
4.0
2.0
0.0
2.5
3.0
2.0
1.0
0.0
1.5
0.5
0
Colombia Costa Rica
20
40
60
80
100
120
0Are
a ha
rves
ted
(1,0
00
ha/
yr)
Econ
omic
wat
er p
rodu
ctiv
ity (
US$
/m
³)sh
are
of
Blue
WF
in to
tal a
v. W
F
Coco
a be
ans
Mai
ze
Coffe
eSu
gar C
ane
Rice
Cassa
va
Bean
sBa
nana
s
Planta
ins
Oil p
alm fru
it
Potat
oes
Toma
toes
Ora
nges
Coffe
e
Bean
s
Cabb
ages
Planta
ins Rice
Cassa
va
Bana
nas
Potat
oes
Pinea
pples
9.08.07.06.0
5.04.0
2.01.0
3.0
0.0
2.5
1.5
2.0
0.5
1.0
0.0
(Figure 7.10 continues in the next page)
2 0 5
PA R T 3 :WAT E R F O R F O O D A N D N O N – F O O D
Insecure access to reliable, safe, and affordable water keeps hundreds of millions of people from escaping poverty. Most of them rely directly on agriculture for their food and income. According to the CAWMA (2007), poverty could be reduced by improving access to agricultural water and its use. Livelihood gains of smallholder farmer could be obtained by securing water access (through water rights and investments in water storage and delivery infrastructure), improving value obtained by water use through pro-poor technologies, and investing in roads and markets.
Increased productivity by improving irrigation has a multiplier effect on the economy (Table 7.4). Improved agricultural water management boosts total farm output. Increased output may arise from improved yields, reduced crop loss, improved cropping intensity, and increased cultivated area. Reliable access to water enhances the use of complementary inputs such as high-yielding varieties and agrochemicals, which also increases output levels (Hasnip et al., 2001; Bhattarai and Narayanamoorthy, 2003; Hussain and Hanjra,
Argentina Bolivia
Brazil Chile
Are
a ha
rves
ted
(1,0
00
ha/
yr)
Are
a ha
rves
ted
(1,0
00
ha/
yr)
Econ
omic
wat
er p
rodu
ctiv
ity (
US$
/m
³)sh
are
of
Blue
WF
in to
tal a
vWF
Econ
omic
wat
er p
rodu
ctiv
ity (
US$
/m
³)sh
are
of
Blue
WF
in to
tal a
vWF
2,0004,0006,0008,000
10,00012,00014,00016,00018,00020,000
0
Whe
at
Apple
s
Potat
o
Soyb
ean
Suga
r Can
e
Mai
ze
Sorg
hum
Sun�
ower
seed
0.2
0.4
0.6
0.8
1.0
1.2
1.4
1.6
0.0
10,000
15,000
20,000
25,000
5,000
0
Cash
ewSu
gar C
ane
Mai
zeSh
orgu
mO
rang
esBa
nana
sW
heat
Rice
Soyb
ean
Coffe
eCa
ssava
Bean
sPo
tatoe
sTo
matoe
s
0.5
1.0
1.5
2.0
2.5
0.0
100
150
200
250
300
100
0
Coco
a be
ans
Whe
atSu
gar b
eet
Oats
Mai
zeKi
wi
Plums
Fodd
er (a
lfalfa
)Be
rries
Apple
Peac
hes
Potat
oes
Gra
pes
Citric
sAv
ocad
osBe
ans
Toma
toes
0.51.0
1.5
2.0
2.5
3.0
3.5
4.0
4.55.0
0.0
100200300400500600700800900
1,000
0
Barle
ySo
rghu
mW
heat
Sun�
ower
seed
Planta
ins Rice
Mai
ze
Cassa
vaSu
gar C
ane
Soyb
ean
Potat
oes
Bean
sQ
uinoa
0.2
0.4
0.6
0.8
1.0
1.2
1.4
1.6
1.8
0.0
Area harvested (Av.Ha/yr 1995–2006) Economic Water prodcutivity (US$/m3) Share of Blue WF in total WF
Figure 7.10 Average cultivated area (1,000ha/yr), economic water productivity (US$/m3) and share of blue WF in crop WF for selected countries and crops. The data shown corresponds to an average of the years 2007-2010. Note the difference in scale for each country. Source: Own elaboration based on FAO (2012d) and Mekonnen and Hoekstra (2011).
Social7.4.2.3
2 0 6
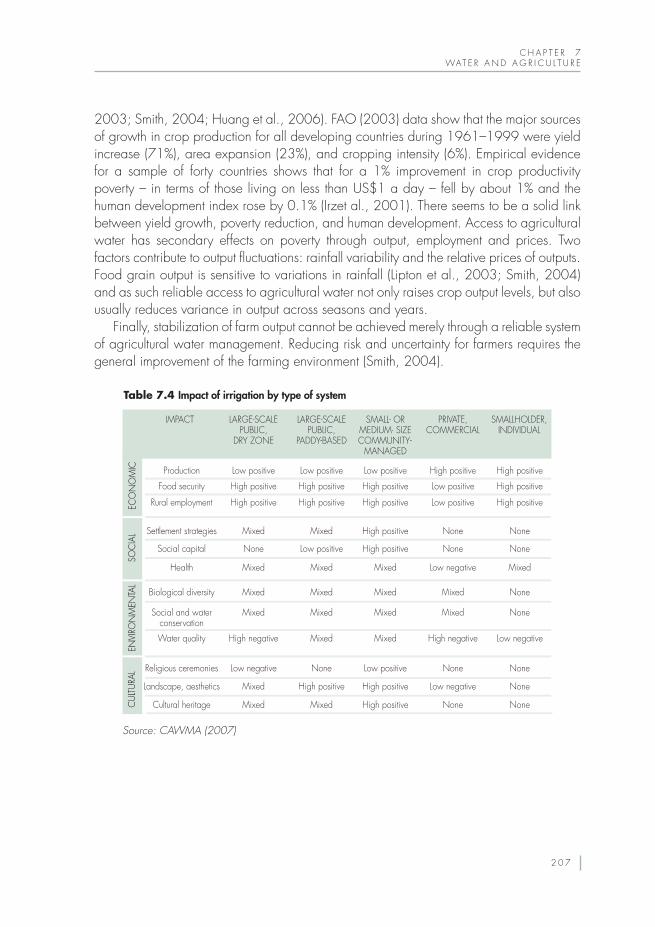
C H A P T E R 7WAT E R A N D A G R I C U L T U R E
2003; Smith, 2004; Huang et al., 2006). FAO (2003) data show that the major sources of growth in crop production for all developing countries during 1961–1999 were yield increase (71%), area expansion (23%), and cropping intensity (6%). Empirical evidence for a sample of forty countries shows that for a 1% improvement in crop productivity poverty – in terms of those living on less than US$1 a day – fell by about 1% and the human development index rose by 0.1% (Irzet al., 2001). There seems to be a solid link between yield growth, poverty reduction, and human development. Access to agricultural water has secondary effects on poverty through output, employment and prices. Two factors contribute to output fluctuations: rainfall variability and the relative prices of outputs. Food grain output is sensitive to variations in rainfall (Lipton et al., 2003; Smith, 2004) and as such reliable access to agricultural water not only raises crop output levels, but also usually reduces variance in output across seasons and years.
Finally, stabilization of farm output cannot be achieved merely through a reliable system of agricultural water management. Reducing risk and uncertainty for farmers requires the general improvement of the farming environment (Smith, 2004).
ECO
NO
MIC Low positive Low positive Low positive High positive High positive
LARGE-SCALE PUBLIC,
DRY ZONE
IMPACT
Production
High positive High positive High positive Low positive High positiveFood security
High positive High positive High positive Low positive High positiveRural employment
SOC
IAL Mixed Mixed High positive None NoneSettlement strategies
None Low positive High positive None NoneSocial capital
Mixed Mixed Mixed Low negative MixedHealth
ENVI
RON
MEN
TAL
Mixed Mixed Mixed Mixed NoneBiological diversity
Mixed Mixed Mixed Mixed NoneSocial and water conservation
High negative Mixed Mixed High negative Low negativeWater quality
CUL
TURA
L Low negative None Low positive None NoneReligious ceremonies
Mixed High positive High positive Low negative NoneLandscape, aesthetics
Mixed Mixed High positive None NoneCultural heritage
LARGE-SCALE PUBLIC,
PADDY-BASED
SMALL- OR MEDIUM- SIZE COMMUNITY-
MANAGED
PRIVATE, COMMERCIAL
SMALLHOLDER, INDIVIDUAL
Table 7.4 Impact of irrigation by type of system
Source: CAWMA (2007)
2 0 7
PA R T 3 :WAT E R F O R F O O D A N D N O N – F O O D
The LAC region’s economy is on average growing rapidly. With its green water and land availability, LAC could potentially represent a good opportunity to produce and supply more food for itself and for other parts of the world. This option also denotes the chance to boost economies in some of these emerging countries. This is the general case for the whole continent; however, particular areas, such as the Antilles, show severe water scarcity levels at the country level, with high levels of dependency on external water resources for food supply.
In spite of the positive agricultural development perspectives and the satisfactory water availability in most areas of the LAC region, if not carefully planned, using local water resources to satisfy this food demand may exert more pressure on water and land resources and increase the already severe water quality problem in the region. The combination of rapid urbanization over the past fifty years and more importantly weak governance are crucial factors affecting water scarcity in a water-rich region.
As economies emerge and there is more investment for natural resources exploitation and use, competition among sectors increases, such as in the case of biofuels and mining versus agriculture for food in the LAC region. The domestic, industrial and hydropower sectors also compete with agriculture. The complex trade-offs across sectors and across water users can best be managed through integrated water management at the river basin level, developed in agreement with the national policies and planning – but establishing appropriate institutions for inter- and intra-sectorial water allocation remains an important challenge under the fragmented management structure in most of LAC. Appropriate water accounting systems, including the green, blue and grey water footprint and the related socio-economic and environmental impacts can inform decision-makers, planners and developers at different levels (river basin, departmental, national) on the sustainability of different water management options. These water accounting systems can also inform about crop water consumption and its economical and social benefits to optimize the allocation of water resources when planning irrigation development (Box 7.3). Sustainable water management should not be seen as a barrier for the development of the region, but rather as the way to develop and grow as a region.
Overall, this chapter shows the strong links between water, agriculture and economy in LAC. Both green and blue water are a vital fuel for LAC’s economies and for its food security. Awareness of LAC’s virtual water trade volumes and water footprints will not alone solve the local or global water problems. However, the awareness gained increases the odds that optimized water allocation decisions, which consider the hydrological and economical aspects of water resources, are made (Allan, 2011).
Conclusions and recommendations7.5
2 0 8
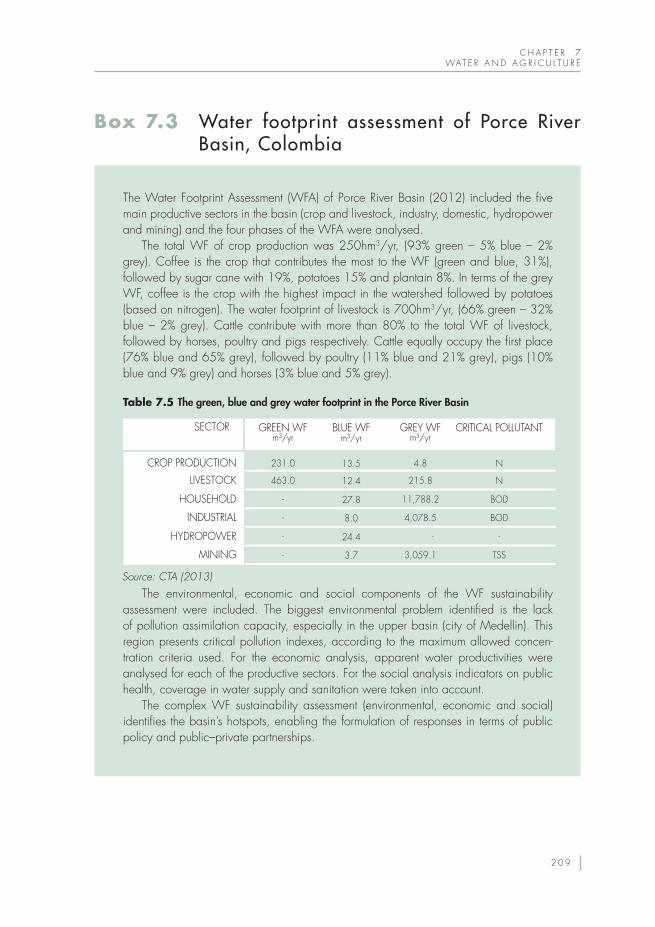
C H A P T E R 7WAT E R A N D A G R I C U L T U R E
The Water Footprint Assessment (WFA) of Porce River Basin (2012) included the five main productive sectors in the basin (crop and livestock, industry, domestic, hydropower and mining) and the four phases of the WFA were analysed.
The total WF of crop production was 250hm3/yr, (93% green – 5% blue – 2% grey). Coffee is the crop that contributes the most to the WF (green and blue, 31%), followed by sugar cane with 19%, potatoes 15% and plantain 8%. In terms of the grey WF, coffee is the crop with the highest impact in the watershed followed by potatoes (based on nitrogen). The water footprint of livestock is 700hm3/yr, (66% green – 32% blue – 2% grey). Cattle contribute with more than 80% to the total WF of livestock, followed by horses, poultry and pigs respectively. Cattle equally occupy the first place (76% blue and 65% grey), followed by poultry (11% blue and 21% grey), pigs (10% blue and 9% grey) and horses (3% blue and 5% grey).
The environmental, economic and social components of the WF sustainability assessment were included. The biggest environmental problem identified is the lack of pollution assimilation capacity, especially in the upper basin (city of Medellin). This region presents critical pollution indexes, according to the maximum allowed concen-tration criteria used. For the economic analysis, apparent water productivities were analysed for each of the productive sectors. For the social analysis indicators on public health, coverage in water supply and sanitation were taken into account.
The complex WF sustainability assessment (environmental, economic and social) identifies the basin’s hotspots, enabling the formulation of responses in terms of public policy and public–private partnerships.
SECTOR
CROP PRODUCTION
GREEN WFm³/yr
LIVESTOCK
HOUSEHOLD
INDUSTRIAL
HYDROPOWER
MINING
231.0
463.0
-
-
-
-
BLUE WFm³/yr
13.5
12.4
27.8
8.0
24.4
3.7
GREY WFm³/yr
4.8
215.8
11,788.2
4,078.5
-
3,059.1
CRITICAL POLLUTANT
N
N
BOD
BOD
-
TSS
Table 7.5 The green, blue and grey water footprint in the Porce River Basin
Source: CTA (2013)
Box 7.3 Water footprint assessment of Porce River Basin, Colombia
2 0 9
PA R T 3 :WAT E R F O R F O O D A N D N O N – F O O D
Allan, T. (2011). Virtual Water: Tackling the Threat to Our Planet’s Most Precious Resource. London, IB Tauris Publishers.
Albersen, P.J., Houba, H.E.D. & Keyzer, M.A. (2003). Pricing a raindrop in a process-based model: General methodology and a case study of the upper-zambezi, Physics and Chemistry of the Earth, 28: 183–192.
Aldaya, M.M., Allan, J.A. & Hoekstra, A.Y. (2010). Strategic importance of green water in international crop trade, Ecological Economics, 69 (4): 887–894.
Bhattarai, M., & Narayanamoorthy, A. (2003). Impact of Irrigation on Rural Poverty in India: An Aggregate Panel-Data Analysis. Water Policy, 5 (5–6): 443–458.
Biswas, A.K., Tortajada, C., Braga, B., & Rodriguez, D.J. (eds) (2006). Water Quality Management in the Americas. Water Resources Development and Management. The Netherlands, Springer.
Bovarnick, A., Alpizar, F. & Schnell, C. (eds) (2010). United Nations Development Programme. The Importance of Biodiversity and Ecosystems in Economic Growth and Equity in Latin America and the Caribbean: An economic valuation of ecosystems. UNDP.
CAWMA (2007). Comprehensive Assessment of Water Management in Agriculture. Water for Food, Water for Life: A Comprehensive Assessment of Water Management in Agriculture. London, Earthscan.
CIP (2010). Centro Internacional de la Papa. Facts and Figures about Potato. Lima, Peru, CIP. [Online] Available from: www.cipotato.org. [Accessed February, 2013].
CTA (2013). Centro de Ciencia y Tecnología de Antioquía. Evaluación de la huella hídrica de la cuenca del río Porce. Resumen de resultados. Mayo 2013. pp.102.
Egúsquiza, B.R. (2000). La Papa, Producción, Transformación y Comercialización. Convenio MSP ADEX-USAID. Lima, Perú, Universidad Nacional Agraria La Molina.
FAO (2003). Food and Agriculture Organization. World Agriculture: Towards 2015/2030. An FAO Perspective. FAO and Earthscan.
FAO (2008). Food and Agriculture Organization. Potato International Year. [Online] Available from: www.potato2008.org/es/mundo/america_latina.html. [Accessed February, 2013].
FAO (2012a). Food and Agriculture Organization. The State of Food and Agriculture. Rome. [Online] Available from: www.fao.org/docrep/017/i3028e/i3028e.pdf [Accessed February, 2013].
FAO (2012b). Food and Agriculture Organization. Panorama de la Seguridad Alimentaria y Nutricional en América Latina y el Caribe 2012. Rome, FAO. [Online] Available from: www.rlc.fao.org/es/publicaciones/panorama-2012/. [Accessed May, 2013].
FAO (2012c). Food and Agriculture Organization. The Outlook for Agriculture and Rural Development in the Americas: A Perspective on Latin America and the Caribbean. Santiago, Chile, CEPAL, FAO & IICA. [Online] Available from: www.rlc.fao.org/en/publications/outlook-2013 [Accessed February, 2013].
FAO (2012d). Food and Agriculture Organization. FAOSTAT. Production and Trade Statistics. [Online] Available from: faostat.fao.org/site/291/default.aspx. [Accessed December, 2012].
FAO (2013). Food and Agriculture Organization. AQUASTAT. [Online] Available from: www.fao.org/nr/water/aquastat/main/index.stm [Accessed February, 2013].
Grau, H.R., & Aide, M. (2008). Globalization and land-use transitions in Latin America. Ecology and Society,13 (2): 16.
References
2 1 0
C H A P T E R 7WAT E R A N D A G R I C U L T U R E
Hall, M. (ed.) (2001). Food and Agriculture Organization. Farming Systems and Poverty. Improving farmers’ livelihoods in a changing world. FAO-World Bank.
Hasnip, N., Mandal, S., Morrison, J., Pradhan, P. & Smith, L.E.D. (2001). Contribution of Irrigation to Sustaining Rural Livelihoods. Wallingford, UK, HR Wallingford.
Hoekstra, A.Y., Chapagain, A.K., Aldaya, M.M. & Mekonnen, M.M. (2011). The Water Footprint Assessment Manual: Setting the global standard. London, Earthscan.
Huang, Q., Rozelle, S., Lohmar, B., Huang, J. & Wang, J. (2006). Irrigation, agricultural performance and poverty reduction in China. Food Policy, 31 (1): 30–52.
Hussain, I. & Hanjra, M.A. (2003). Does irrigation water matter for rural poverty alleviation? Evidence from South and South-East Asia. Water Policy, 5 (5–6): 429–42.
Irzet, X., Lin, L., Thirtle, C. & Wiggins, S. (2001). Agricultural productivity growth and poverty alleviation. Development Policy Review, 19 (4): 449–66.
LA–Costa Rica (2012). Report of Costa Rica. Contribution to the Water and Food Security in Latin America Project. Water Observatory Project Madrid, Spain: Fundacion Botín.
LA–Peru (2012). Report of Peru. Contribution to the Water and Food Security in Latin America Project. Water Observatory Project Madrid, Spain: Fundacion Botín.
Lipton, M., Litchfield, J. & Faurès, J.M. (2003). The effects of irrigation on poverty: a framework for analysis. Water Policy, 5 (5–6): 413–27.
Mekonnen, M.M. & Hoekstra, A.Y. (2011). National Water Footprint Accounts: The Green, Blue and Grey Water Footprint of Production and Consumption. Volume 2: Appendices. Delft, The Netherlands, UNESCO-IHE. Value of water, Research Report Series No. 50.
Moran, E.F. (1982). Human Adaptability. An Introduction to Ecological Anthropology. Colorado, Westview Press.
Niemeyer, I. & Garrido, A. (2011). International farm trade in Latin America: does it favour sustainable water use globally? In: Hoekstra, A.Y., Aldaya, M.M. & Avril, B. (eds). Proceedings of the ESF Strategic Workshop on Accounting for Water Scarcity and Pollution in the Rules of International Trade. Delft, The Netherlands, UNESCO-IHE. Value of Water Research Report Series No. 54. pp. 63–84.
Oliviera, A.S., Trezza, R., Holzapfel, E., Lorite, I. & Paz, V.P.S. (2009). Irrigation water management in Latin America. Chilean Journal of Agricultural Research, 69: 7–16.
Palhares, J.C.P. (2012). Pegada Hídrica das aves abatidas no Brasil na década 2000–2010. In: Macari, M. & Soares, N.M. (Org.). Água na avicultura. Campinas, Brazil, Facta. pp. 40–53.
Proceso Regional de las Américas (2012). Agenda del Agua de las Américas. Agenda del agua de las Américas: Metas, soluciones y rutas para mejorar la gestión de los recursos hídricos., Marseille, France, 6th World Water Forum.
Ramírez, F., Chaverri, F., de la Cruz, E., Wesseling, C., Castillo, L. & Bravo, V. (2009). Importación de plaguicidas en Costa Rica. Periodo 1977–2006. Instituto Regional de Estudios en Sustancias Tóxicas. Facultad de Ciencias de la Tierra y el Mar. Heredia, Costa Rica, Universidad Nacional,. Serie Informes Técnicos IRET No. 6.
Rockström, J., Hatibu, N., Oweis, T. Y., Wani, S., Barron, J., Bruggeman, A., Farahani, J., Karlberg, L. & Qiang, Z. (2007). Managing water in rainfed agriculture. In: Molden, D. (ed.). Water for Food, Water for Life: A Comprehensive Assessment of Water Management in Agriculture. London, Earthscan. pp. 315–352
Smith, L.E.D. (2004). Assessment of the contribution of irrigation to poverty reduction and sustainable livelihoods. Water Resources Development, 20 (2): 243–257.
2 1 1
PA R T 3 :WAT E R F O R F O O D A N D N O N – F O O D
UN (2003). United Nations. Water for People, Water for Life. The first UN edition of the World Water Development Report (WWDR1).
UNCTAD (2011). United Nations Conference on Trade and Development. Water for Food. Innovative water management technologies for food security and poverty alleviation. [Online] Available from: http://unctad.org/en/Docs/dtlstict2011d2_en.pdf. [Accessed February, 2013]. Current Studies on Science, Technology and Innovation report no 4.
UNEP (2013). United Nations Environment Programme. The State of Natural Resource Management in LAC - Opportunities for Sustainable Practices and Prioritization of Resources. UNEP - Division of Technology, Industry and Economics (UNEP DTIE) and UNEP Regional Office for Latin America and the Caribbean (PNUMA ROLAC).
WFN (2013a). Water Footprint Network. WaterStat Database. [Online] Available from: www.waterfootprint.org/?page=files/WaterStat. [Accessed March, 2013].
WFN (2013b). Water Footprint Network. Water Footprint Assessment Tool. [Online] Available from: www.waterfootprint.org/?page=files/waterfootprintassessmenttool [Accessed February, 2013].
World Bank (2013). World Bank Development Indicators. [Online] Available from: data.worldbank.org/indicator. [Accessed May, 2013].
Yang, H., Wang, L., Abbaspour, K.C. & Zehnder, A.J.B. (2006). Virtual water trade: An assessment of water use efficiency in the international food trade, Hydrology and Earth System Sciences, 10: 443–454.
2 1 2