Embed Size (px)
Citation preview

Water and Energy Wasted
During Residential Shower
Events: Findings from a Pilot
Field Study of Hot Water
Distribution Systems
Jim Lutz
Energy Analysis Department
Lawrence Berkeley National Laboratory
Berkeley, CA 94720
September 2011
This work will be presented at the 2012 ASHRAE Winter
Conference.
This work was sponsored by the Department of Water
Resources, Office of Water Use Efficiency and Transfers,
under contract No. 4600004199
This work was supported by the U.S. Department of
Energy’s Office of Energy Efficiency and Renewable
Energy, Building Technologies Program under Contract
No. DE-AC02-05CH11231.

DISCLAIMER
This document was prepared as an account of work sponsored by the United States
Government. While this document is believed to contain correct information, neither the
United States Government nor any agency thereof, nor The Regents of the University of
California, nor any of their employees, makes any warranty, express or implied, or
assumes any legal responsibility for the accuracy, completeness, or usefulness of any
information, apparatus, product, or process disclosed, or represents that its use would not
infringe privately owned rights. Reference herein to any specific commercial product,
process, or service by its trade name, trademark, manufacturer, or otherwise, does not
necessarily constitute or imply its endorsement, recommendation, or favoring by the
United States Government or any agency thereof, or The Regents of the University of
California. The views and opinions of authors expressed herein do not necessarily state or
reflect those of the United States Government or any agency thereof or The Regents of
the University of California.

ABSTRACT
Heating water is one of the most energy-consumptive activities in a household, accounting for about 49 percent
of California’s residential natural gas consumption (Palmgren et al. 2010). Data collected during a pilot field study
in California indicate that significant amounts of water and energy are wasted while waiting for hot water to be
delivered to the point of end use. We calculate the water and energy wasted during shower events from data
collected using a wireless sensor network that monitored water flows and temperatures in three single-family
residences. The total calculated water waste for a typical shower event was 30 percent. Forty-one percent of the hot
water energy for the same event was wasted. This relatively low efficiency highlights the importance of examining
further the energy and water waste of residential hot water distribution systems in order to improve them.
BACKGROUND
This paper examines the waste of water and energy associated with the hot water distribution systems inside
residences. Figure 1 shows a schematic view of a typical hot water distribution system in a single-family residence.
The line labeled ”Hot Water” depicts the distribution system that conveys hot water from the water heater to each
end-use location within the house.
Fixture or
Appliance
Drain
Fuel
Source
Water
SourceSewer
Water
Heater
IndoorBoundary
Hot
Water Cold
Water
Mixed
Temperature
Water
Energy
Figure 1. Typical residential hot water distribution system.

There is a paucity of both studies and data on the water and energy wasted as part of hot water delivery and use
in residential settings. The Residential End Uses of Water Study (REUWS) remains the best description of
residential end uses of water (Mayer et al. 1999). REUWS employed compact data loggers to measure whole-house
water consumption. Using flow trace analysis, water draws were assigned to end uses for each house in the study. A
flow trace, which records flow through a water meter at 10-second intervals, provides sufficient resolution to
identify the patterns associated with various types of fixtures in a household. The flow pattern associated with
flushing a toilet, for instance, differs from that associated with running a dishwasher.
Other studies also have used flow trace analysis to disaggregate hot water draws by end use (Lowenstein and
Hiller 1996, 1998). Some studies have used temperature probes on pipes near end uses to help disaggregate hot
water draws (Weihl and Kempton 1985; Bohac et al. 2010). In one case the analysis was extended to estimate the
energy efficiency of the piping used to deliver hot water (Kempton 1988).
The losses of energy and water attributable to the design of hot water distribution systems have been noted
previously (Lutz 2004). In the case of showers, waiting for cooled-off hot water to clear from the pipe that connects
the water heater to the shower represents structural waste. Water that is hot enough, but runs down the drain before
the user makes use of the shower, represents behavioral waste. The useful portion of the shower event is when
someone is using the shower water to bathe.
Lutz (2004) used the REUWS data on total volume and duration of water draws, along with the peak and mode
flow rates during draws, to develop an equation for calculating wasted hot water during shower events (Lutz 2004).
Of the shower events in the REUWS database, 26,000 met the criteria for evaluation by the equation. Applying the
equation, Lutz (2004) calculated the average waste volume for the examined showers as 3.48 gallons (13.2 L).
According to the REUWS report, the average shower uses 17.2 gallons (65.1 L). For the 26,000 showers, therefore,
the wasted volume of water represents an average of 20 percent of the shower volume. All the calculations in Lutz
(2004) were noted as rough approximations, because they were not based on data collected at the point of end use.
That paper called for collecting field measurements of how hot water is used and wasted in a cross-section of
residences nationwide; the current study is the first to collect data directly at the site of an end use.
METHODS
The pilot phase of a California residential field study involved measuring water flow and temperature at three
single-family residences for about one week each. All the houses were concrete slab-on-grade construction. The

plumbing for both hot and cold water was copper pipe. All three houses employed natural draft gas storage water
heaters. In the field study, data were collected directly at showerheads, sink faucets, and dishwashers. Figure 2 is a
schematic of the points at which water temperature and flow were measured during the pilot project.
WaterHeater
ClothesWasher
Dishwasher Showerhead Faucet1
Wireless flow & temperature sensors
GasSub-meter
from utility gas meter
from water mains
Computer(PC)
HouseWaterMeter
Wireless base mote
Faucet2
hot water distribution system
cold water
Figure 2. Points at which water flow and temperature were measured during pilot project.
As described in detail in Lutz et al. (2011), water flow was measured with an inline turbine meter, and
temperature was measured with a thermistor probe inserted into the water flow (Lutz et al. 2011). The data acquired
by the sensors was read and transmitted to a local on-site computer by a wireless sensor network. Once per day the
data were sent via cell modem to a central server. The study established the feasibility of using the wireless sensor
network to measure directly the waste of water and energy in hot-water distribution systems. Figure 3 shows the

wireless sensor network Lutz et al. (2011) developed to measure flow and temperature of water at the water heater
and at several end-use points of the hot water distribution system.
Figure 3. Wireless data acquisition system.
The sensor network was intended to demonstrate a method for collecting water flow and temperature data from
every indoor end-use point and at the water heater in one-second intervals when water was flowing. The scheme to
process the data and transmit it to the central server included several automated scripts and batch files. Once
uploaded to the server, the field measurement data were processed sequentially by several software scripts. At the
central data-processing site, the field data were analyzed and aggregated into summary data about individual hot-
water draws. The data were processed record by record. The time at the start of the draw, the total duration of the
draw, the total volume of water for the draw, the weighted average temperature during the draw, and the time since

the previous draw were calculated and recorded for each draw. The time until hot water arrived at the site of an end
use could be calculated and recorded as well.
The current analysis focuses on the flow and temperature data collected at showerheads only. Figure 4 shows
the system for measuring the amounts of water and energy wasted through the pipe and shower. We did not
measure the energy going down the drain.
Tub
Drain
Fuel
Source
Water
SourceSewer
Residential
Boundary
Hot
Water
Cold
Water
Warm
Water
MixingValve
Shower
sensors
Water
Heater
Water Heater InletWater Heater Outlet
Showerhead
Figure 4. Locations of measurement points for calculating shower waste.
Figure 5 shows the sensors that measure water flow and temperature installed at a showerhead. Similar sensors
were installed on the inlet and outlet of the water heater.
We examined the data from 36 shower events in three households to evaluate the water and energy wasted
during shower events. Because of the developmental nature of the wireless sensor network and difficulties with
various pieces of equipment, we were unable to collect complete data for most shower events. The resulting data,

along with some reasonable extrapolation and cleaning, allowed for complete analysis of five shower events.
Missing data were filled in via linear interpolation or, when necessary, copying water flow from water heater outlet
to inlet. Obvious outliers were removed.
Figure 5. Flow and temperature sensors installed at showerhead.
RESULTS
Figure 6 shows the type of data collected by the wireless sensor network during a typical shower event. The
traces in the top part of the figure show the temperature of the water leaving the water heater, at the showerhead, and
when it enters the water heater. The temperature is indicated by scale along the right axis of the chart. The lower set
of traces represents flow measurements at the showerhead, entering the water heater and leaving the water heater.
The flowrate is shown on the left axis of the chart.

Figure 6. Flow and temperature records for typical shower event (2009-03-22).

We assumed that the useful portion of a shower starts when the temperature at the showerhead is no longer
being adjusted and ends when water flow stops. For the shower event shown in Figure 6, we considered the shower
as having started at 8:53:58 and ended at 8:59:38. The water drawn (and time) that pecedes the useful portion of the
shower is considered to be unused and, therefore, wasted. The energy content of the hot water measured at the water
heater outlet and at the showerhead was calculated relative to the temperature of the cold water delivered to the
house. We used the temperature of the water at the inlet to the water heater during the last minute of a shower event
as a proxy for temperature of the water delivered to the house. We calculated the useful energy of the water at the
showerhead and at the water heater outlet as shown in equation 1.
i
iii vtMththE )()()( 0
(1)
where,
h = molar enthalpy, Btu/mol (J/mol),
M = molar density, mol/gal (mol/L),
ti = temperature at time i, ºF (ºC)
t0 = mean temperature of water heater inlet water for the last minute of shower, ºF (ºC), and
vi = volume of water measured at time i, gal (L).
We calculated the energy delivered by the water heater as the energy content of the water leaving the water
heater during the entire shower event. The useful energy delivered at the showerhead was calculated as the energy
content of the water measured at the showerhead for the useful portion of the shower only. The wasted energy is the
difference between those two values.
As depicted in Figure 6, the user initiated the shower event by turning the water on full hot. The hot water
leaving the water heater, shown by the top trace, almost immediately became fully hot [approximately 110ºF
(43°C)]. The chart also shows that the water entering the water heater initially was hot. This initial temperature
reflects the water heater’s warming effect on the water in the inlet pipe close to the heater. The inlet water
temperature then decreased as new, unwarmed water arrived at the water heater. The unwarmed water entering the

water heater, was about 60ºF (16ºC) after the hot water in the line had cleared. For most of the shower, the water at
the showerhead was close to 104ºF (40ºC ).
When the water initially was turned on, the volume of water flowing into the water heater matched both the
flow out and the flow at the showerhead, as shown by the bottom three traces. This matching pattern indicates that
the valve at the shower was set for hot water only. Shortly thereafter, the flow rate at the showerhead diverged from
that at the water heater, indicating that the user had added cold water to adjust the shower’s water temperature. This
divergence also is reflected in the drop shown by the shower temperature trace. The flow at the showerhead was
then a mixture of hot and cold water.
About a minute passed before the temperature of the water at the showerhead exceeded the user’s preferred
showering temperature. The water at the showerhead never reached the temperature at the water heater outlet
because of heat losses along the water distribution route. Another minute or so passed as the user added cold water
to obtain the desired shower temperature. This second minute reflects the behavioural waste referred to earlier. After
adjusting the water temperature, the user began showering. Part way through the shower, the user adjusted the
temperature upward a few degrees. Figure 6 shows the entire data stream from turn-on to turn-off. We assume that
the shower started when the water temperature at the showerhead became stable, at 8:53:58. All water used before
that time is wasted. Waste occurred during three periods in the event: the period spent waiting for the water to attain
full temperature at the showerhead; the period before the user began adjusting the water temperature; and the time
the user spent adjusting the water temperature.
Figure 7 shows a shower that has a double temperature peak at the showerhead. The first peak likely is a pulse
of hot water remaining in the pipe from a prior use. The second peak shows when the user adjusted the shower
temperature, causing the flow rate at the showerhead to diverge from the flow rate through the water heater. The
user adjusted the water temperature by changing the relative flow of hot and cold water while retaining a constant
flow at the showerhead. Before the user adjusted the temperature, some cold water was already flowing to the
shower. This is visible as more water was flowing through the showerhead than through the water heater. This figure
may reflect a shower facility equipped with a valve that allows adjustments temperature only.
Figure 8 shows a situation in which the temperature setpoint of the water heater is dangerously high. Water at
the temperatures indicated in the figure can produce scalding and third-degree burns in less than 3 seconds
(ASHRAE 2011). Like the event depicted in Figure 7, the shower event shown here appears to have a constant-flow

shower valve. Figure 8 also indicates that more water was flowing through the water heater than coming out of the
showerhead, which could indicate a combination shower bathtub with a leaky tub spout diverter. The tub spout
diverter probably leaked throughout the shower event. The leaking water was not included in the calculation of
wasted water.
Figure 9 represents a relatively efficient shower event, in which the user apparently entered the shower almost
as soon as water reached the desired temperature at the showerhead. The shower facility for the event recorded in
Figure 9 is located close to the water heater. Notice that at the beginning of the event more water is flowing through
the showerhead than through the water heater. This figure indicates that the user pre-set the shower valve to include
a small amount of cold water flow initially, then added more cold water when it became clear that the temperature
was not as desired.
DISCUSSION
Table 1 summarizes the amounts of time associated with five shower events at three single-family residences.
Table 1 shows that the total duration of each of the five shower events differed significantly (from 5 to 8
minutes), although the time of actual showering was fairly consistent. The percent of time wasted varied from 22
percent to 48 percent.
Table 2 summarizes the volumes of water used and wasted during the same five shower events as delineated in
Table 1.
From the data in Table 2 we see that the percent of wasted water does not consistently reflect the total volume
of water used, in that 20 percent of the water for the 12.5 gallon (47.2 L) shower event was wasted, whereas 31
percent of the water was wasted for the 10.5 gallon (39.7 L) shower event.
Table 3 summarizes the amount of energy used and wasted during the same five shower events.
All of the shower events wasted a higher percentage of energy than of water. Both values track well for most
shower events. The shower event of February 27, however, is an outlier. That event wasted a little more than 31
percent of the water used for it. Almost 70 percent of the energy the water heater provided in the form of hot water
for that event was wasted .

Figure 7. Flow and temperature records for a shower event on 2009-03-21.

Figure 8. Flow and temperature records for a shower event on 2009-02-27.
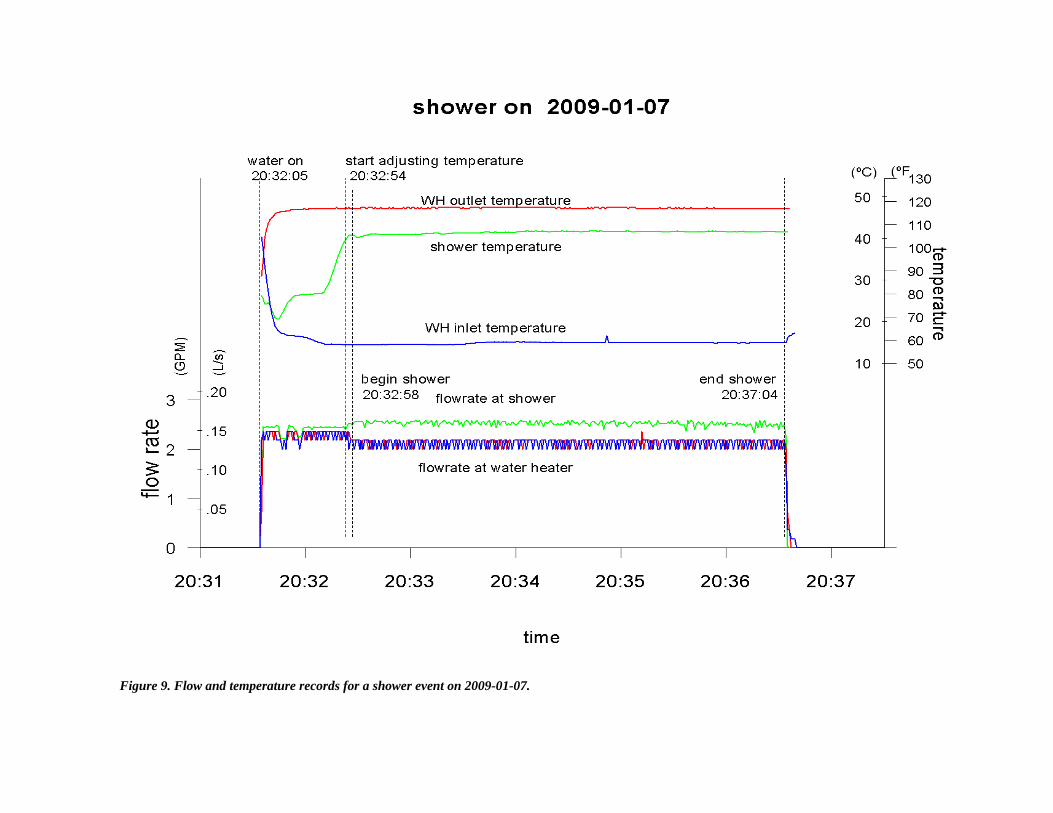
Figure 9. Flow and temperature records for a shower event on 2009-01-07.

Table 1. Durations of five shower events
Date Total Duration of
Water Flow
(minutes)
Duration of
Shower
(minutes)
Time Wasted
(minutes)
% of Time
Wasted
1/7/2009 4:59 4:06 0:53 21.5%
2/27/2009 5:46 4:22 1:24 32.1%
3/20/2009 6:19 4:16 2:03 48.0%
3/21/2009 5:48 4:34 1:14 27.0%
3/22/2009 8:02 5:40 2:22 41.8%
average 6:11 4:36 1:35 34.5%
Table 2. Water used and wasted during five shower events
Date Total Water Flow Water Used for Shower
Water Wasted % of Water Wasted
1/7/2009 12.5 gal ( 47.2 L ) 10.4 gal ( 39.4 L ) 2.1 gal ( 7.8 L ) 19.9%
2/27/2009 10.5 gal ( 39.7 L ) 8.0 gal ( 30.2 L ) 2.5 gal ( 9.4 L ) 31.2%
3/20/2009 11.6 gal ( 44.0 L ) 8.4 gal ( 31.7 L ) 3.3 gal ( 12.3 L ) 39.0%
3/21/2009 11.6 gal ( 43.8 L ) 9.2 gal ( 34.7 L ) 2.4 gal ( 9.0 L ) 26.0%
3/22/2009 15.5 gal ( 58.9 L ) 11.5 gal ( 43.4 L ) 4.1 gal ( 15.5 L ) 35.7%
average 12.3 gal ( 46.7 L ) 9.5 gal ( 35.9 L ) 2.9 gal ( 10.8 L ) 30.2%
Table 3. Energy used and wasted during five shower events
Date Total Energy From Water Heater
Energy Used at Shower Energy Wasted % of Energy Wasted
1/7/2009 5169 BTU ( 5.454 MJ ) 4114 BTU ( 4.340 MJ ) 1055 BTU ( 1.113 MJ ) 25.7%
2/27/2009 4335 BTU ( 4.573 MJ ) 2554 BTU ( 2.695 MJ ) 1780 BTU ( 1.878 MJ ) 69.7%
3/20/2009 4151 BTU ( 4.379 MJ ) 2847 BTU ( 3.004 MJ ) 1304 BTU ( 1.375 MJ ) 45.8%
3/21/2009 4192 BTU ( 4.423 MJ ) 3122 BTU ( 3.294 MJ ) 1070 BTU ( 1.128 MJ ) 34.3%
3/22/2009 5499 BTU ( 5.801 MJ ) 3902 BTU ( 4.117 MJ ) 1596 BTU ( 1.684 MJ ) 40.9%
average 4669 BTU ( 4.926 MJ ) 3308 BTU ( 3.490 MJ ) 1361 BTU ( 1.436 MJ ) 41.1%
CONCLUSIONS
When Lutz (2004) performed a rough calculation using data from the REUWS report and found an average of
20 percent of the volume of shower water was wasted, the approximation probably was low. Based on the data
recorded for this study, the average volume of wasted shower water for showers is closer to 30 percent. The average
waste of energy in the hot water is about 40 percent.
Further study could benefit from evaluating the type, diameter, and length of the piping between the water
heater and shower. Such an evaluation would enable a prediction of the "structural" water waste from information in

the ASHRAE Handbook, Service Water Heating chapter, to be compared to what was measured in this study and
used to calculate what the actual flow to pipe volume ratio was for a given shower event. (ASHRAE 2011)
An additional factor that could be evaluated is the effect of a shower having a single valve or separate valves for
hot and cold water and whether valve style affects shower flow volumes.
In general, the delivery efficiencies indicated by Tables 1 through 3 should be accounted for when determining
both the water and energy consumption of showering. Further research is needed to better quantify the types of
losses and determine ways to reduce them. Clearly the plumbing related to providing showers warrants thorough
examination and improvement.
ACKNOWLEDGEMENTS
This work was supported by the California Department of Water Resources through the U.S. Department of
Energy under Contract No. DE-AC02-05CH11231.
REFERENCES
ASHRAE. 2011. Heating, Ventilating, and Air-Conditioning Applications Handbook.Chapter 50, Service Water
Heating. Atlanta: American Society of Heating Refrigerating and Air-Conditioning Engineers, Inc.
Bohac, D., B. Schoenbauer, M. Hewett, M.S. Lobenstein, and T. Butcher. 2010. Actual Savings and
Performance of Natural Gas Tankless Water Heaters. Center for Energy and Environment, Minneapolis MN,
August 30.
Kempton, W. 1988. Residential hot water: A behaviorally-driven system. Energy 13:107-114.
Lowenstein, A., and C.C. Hiller. 1996. Disaggregating residential hot water use. ASHRAE Transactions:
102:1019-1027.
Lowenstein, A., and C.C. Hiller. 1998 Disaggregating residential hot water use—Part II. ASHRAE Transactions
104:1852-1863.
Lutz, J.D. 2004. Feasibility study and roadmap to improve residential hot water distribution systems. American
Water Works Association Annual Conference, Orlando, Florida.
Lutz, J.D., P. Biermayer, and D.A. King. 2011. Pilot phase of a field study to determine waste of water and
energy in residential hot-water distribution systems. ASHRAE Transactions 117:755-768.

Mayer, P.W., W.B. DeOreo, E.M. Opitz, J.C. Kiefer, W.Y. Davis, B. Dziegielewski, and J.O. Nelson. 1999.
Residential End Uses of Water. Denver:
Palmgren, C., N. Stevens, M. Goldberg, R. Barnes, and K. Rothkin. 2010. Consultant report: 2009 California
Residential Appliance Saturation Study, Executive summary. California Energy Commission, Sacramento. October.
Weihl, J.S. , and W. Kempton. 1985. Residential hot water energy analysis: Instruments and algorithms. Energy and
Buildings 8(3):197-204.