Embed Size (px)
Citation preview
Environment for Development
Discussion Paper Series July 2015 EfD DP 15-17
Water and Sanitation Service Delivery, Pricing, and the Poor
An Empirical Estimate of Subsidy Incidence in Nairobi, Kenya
David Fuent e , Josephi ne G ak i i Gat ua , M oses I k ia r a , Jane Kabubo -
Mar iar a , Mbut u Mw aura , and Da le Whi t t ing ton

Environment for Development Centers
The Environment for Development (EfD) initiative is an environmental economics program focused on international
research collaboration, policy advice, and academic training. Financial support is provided by the Swedish
International Development Cooperation Agency (Sida). Learn more at www.efdinitiative.org or contact
Central America Research Program in Economics and Environment for Development in Central America Tropical Agricultural Research and Higher Education Center (CATIE) Email: [email protected]
Chile Research Nucleus on Environmental and Natural Resource Economics (NENRE) Universidad de Concepción Email: [email protected]
China Environmental Economics Program in China (EEPC) Peking University Email: [email protected]
Ethiopia Environmental Economics Policy Forum for Ethiopia (EEPFE) Ethiopian Development Research Institute (EDRI/AAU) Email: [email protected]
Kenya Environment for Development Kenya University of Nairobi with Kenya Institute for Public Policy Research and Analysis (KIPPRA) Email: [email protected]
South Africa Environmental Economics Policy Research Unit (EPRU) University of Cape Town Email: [email protected]
Sweden Environmental Economics Unit University of Gothenburg
Email: [email protected]
Tanzania Environment for Development Tanzania University of Dar es Salaam Email: [email protected]
USA (Washington, DC) Resources for the Future (RFF) Email: [email protected]

Discussion papers are research materials circulated by their authors for purposes of information and discussion. They have
not necessarily undergone formal peer review.
Water and Sanitation Service Delivery, Pricing, and the Poor: An
Empirical Estimate of Subsidy Incidence in Nairobi, Kenya
David Fuente, Josephine Gakii Gatua, Moses Ikiara, Jane Kabubo-Mariara,
Mbutu Mwaura, and Dale Whittington
Abstract
The increasing block tariff (IBT) is among the most widely used tariffs by water utilities,
particularly in developing countries. This is in part due to the perception that the IBT can effectively
target subsidies to low-income households. Combining data on households’ socioeconomic status and
metered water use, this paper examines the distributional incidence of subsidies delivered through the
water tariff in Nairobi, Kenya. Contrary to conventional wisdom, we find that high-income residential
and non-residential customers receive a disproportionate share of subsidies and that subsidy targeting is
poor even among households with a private metered connection. We also find that stated expenditure on
water, a commonly used means of estimating water use, is a poor proxy for metered use and that
previous studies on subsidy incidence may dramatically underestimate the magnitude of the subsidy
delivered through water tariffs. These findings have implications for both the design and evaluation of
water tariffs in developing countries.
Key Words: water tariff, water pricing, increasing block tariff, subsidy targeting, water
utilities, Kenya, developing countries
JEL Codes: Q25, L95, D63

Contents
1. Introduction ......................................................................................................................... 1
2. Background and Literature Review .................................................................................. 2
3. Empirical Strategy .............................................................................................................. 7
4. Data .................................................................................................................................... 11
5. Results ................................................................................................................................ 14
6. Discussion and Conclusions ............................................................................................. 17
References .............................................................................................................................. 20
Tables and Figures ................................................................................................................ 23
Appendix 1. Summary of Subsidy Incidence Literature ................................................... 28
Appendix 2. Cost Estimates Used in the Literature ........................................................... 31
Environment for Development Fuente et al.
1
Water and Sanitation Service Delivery, Pricing, and the Poor: An
Empirical Estimate of Subsidy Incidence in Nairobi, Kenya
David Fuente, Josephine Gakii Gatua, Moses Ikiara, Jane Kabubo-Mariara,
Mbutu Mwaura, and Dale Whittington
1. Introduction
The increasing block tariff (IBT) is among the most widely used tariffs by water utilities,
particularly in developing countries. According to a recent survey of water utilities across the
globe, 53% percent of utilities in the sample implement an IBT, with 74% percent of utilities in
developing countries doing so (GWI 2013). The popularity of the IBT reflects two widely held
perceptions about its potential merits. First, policy makers believe the lifeline block of the IBT
can be used to ensure low-income households have access to a certain quantity of water at a price
deemed affordable. Second, they believe that higher prices in the upper block(s) of the IBT can
both prevent wasteful or extravagant water use and provide an opportunity to improve cost
recovery from households who use more water. The intuitive appeal of the IBT rests on the
implicit assumptions that all households have a private piped connection to the water network
and that low-income households use less water than high-income households.
Scholars have long questioned whether these assumptions are valid in low and middle-
income countries (Whittington 1992; Boland and Whittington 2000; Komives et al. 2005). This
has led to a body of empirical work that has challenged common intuition about the poor, access
to water and sanitation services, and the relationship between income and water use (e.g.,
Komives et al. 2006; Komives et al. 2007; Banerjee et al. 2008; Banerjee and Morella 2011;
Barde and Lehman 2014). In this paper, we examine the distributional incidence of subsidies
delivered through the water tariff in Nairobi, Kenya. In particular, we combine socioeconomic
data from a household survey with data on metered water use to estimate the distribution of
David Fuente, Department of City and Regional Planning, University of North Carolina-Chapel Hill (UNC-CH),
USA, corresponding author: [email protected]. Josephine Gakii Gatua, Department of Economics, School
of Business, Economics and Law, University of Gothenburg, Sweden. Moses Ikiara, Environment for Development-
Kenya. Jane Kabubo-Mariara, Environment for Development-Kenya, School of Economics, University of Nairobi,
Kenya. Mbutu Mwaura, Nairobi City Water and Sewer Company, Kenya. Dale Whittington, Department of City and
Regional Planning, University of North Carolina-Chapel Hill (UNC-CH), USA, Department of Environmental
Sciences and Engineering - Gillings School of Public Health, UNC-CH, USA, Manchester Business School,
University of Manchester, UK.

Environment for Development Fuente et al.
2
subsidies among residential customers with a private metered connection in Nairobi. We then use
a complete set of individual billing records from Nairobi City Water and Sewer Company
(NCWSC) to estimate the distribution of subsidies among all residential customers, including
those with shared connections. Finally, we expand the scope of our analysis and examine the
distribution of subsidies among residential and nonresidential customers in Nairobi.
Our analysis departs from existing studies in the subsidy incidence literature in three
ways. First, studies in the literature typically use stated expenditure on water to estimate water
use. To our knowledge, this study is the first to combine household-level socioeconomic data
with data on metered water use to estimate subsidy incidence in the water sector. Second, unlike
the majority of studies in the literature, we use empirical city-specific estimates of the cost of
providing water and wastewater services to estimate subsidy incidence. Finally, all studies in the
literature focus on the distribution of subsidies among residential customers. Our study extends
the literature by examining the distribution of subsidies among all customer classes.
Overall, we find that the IBT implemented in Nairobi is not effectively targeting
subsidies to low-income households. Among households with a private metered connection,
households in the lowest wealth quintile receive less than 20% of the subsidies delivered to these
customers. Subsidy targeting improves slightly when we examine subsidy incidence among all
residential customers, but higher-income customers still receive a disproportionate share of
subsidies. Our analysis of subsidy incidence among all customer classes indicates that non-
residential customers, who constitute 5% of customer accounts, receive over a third of the
subsidies delivered through the tariff. We also find that stated expenditure is a poor proxy for
metered water and that the magnitude of the subsidy delivered through the water tariff is
substantially larger than previous studies would suggest.
The remainder of the article is organized as follows. The second section of the paper
discusses the issue of subsidy incidence and provides a review of the subsidy incidence literature
in the water sector. The third and fourth sections describe our empirical strategy and the data
used in our analysis, respectively. The fifth section presents our results. The final section
provides a discussion of our results and some concluding remarks.
2. Background and Literature Review
Despite the intuitive appeal of IBTs, there are a number of reasons why the IBT may not
effectively target subsidies to low-income households in these contexts. For example, in order
for a household to receive a subsidy that is delivered through the water tariff, it must have a

Environment for Development Fuente et al.
3
piped connection. However, poor households often lack a piped water connection.1 Similarly,
low-income households are also more likely than wealthier households to have a shared
connection to the piped water network (e.g., a yard tap) and to live in multi-unit dwellings that
are served by a single meter. Households that share a connection or live in a multi-unit dwelling
served by a single meter pay a higher volumetric price for water than if they had an individual
meter because the collective water use of those who share a connection falls in the upper, more
expensive, blocks of the IBT. Finally, the extent to which income and water use are highly
correlated is an empirical question, even among households with a private connection.2 Indeed,
the limited empirical evidence in the literature suggests that the correlation between income and
water use may not be as strong as many assume (Whittington et al. 2015).
Concerns about the extent to which the IBT, and utility tariffs more broadly, can be used
to effectively target subsidies to low-income households has led to a body of empirical research
on subsidy incidence. (See Appendix 1 for a summary of studies that have been published on
subsidy incidence since 2000.) To calculate the distributional incidence of subsidies delivered
through the water tariff, the analyst needs information on the magnitude of the subsidy received
by each household and the relative income or wealth of each household. The subsidy received by
each household is simply the difference between what it costs to provide the particular household
a particular level of service (e.g., water or water and wastewater service) and what the household
actually pays for this service.
The cost of serving each household is a function of households’ water use, whether the
household has only water or water and wastewater service, and the unit cost of providing water
and wastewater services. The amount households pay for water and sanitation service is a
function of households’ water use, their level of service, and the tariff the utility uses to assess
1 The fact that the poorest residents in the city, who lack access to piped water and sanitation services, cannot
benefit from subsidies delivered through the water tariff is not a sufficient argument against subsidizing water use
among some segment of the population. The lowest-income residents in a city are often concentrated in informal
settlements. It can either be physically difficult or not possible to service informal settlements due to their density
and it may not be legally possible to service them due to issues related to land tenure. In both instances, there can be
little a water utility can do to extend services to these households. Thus, whether, to what extent, and how a utility or
government should subsidize water use should be evaluated on other criteria (e.g., subsidy incidence, economic
efficiency, fiscal viability, etc.).
2 One reason for this is that household size and income may be inversely related. Thus, even if wealthier individuals
use more water than poor individuals on a per capita basis, it does not necessarily follow that the poor households
use less water than non-poor households.

Environment for Development Fuente et al.
4
fees for water and sanitations service. Thus, in total the analyst must have five pieces of
information to estimate subsidy incidence: households’ water use, households’ service level, the
unit cost of providing water and wastewater services, the tariff, and some measure of
households’ wealth or socioeconomic status. Assembling this information can be quite difficult
in practice. In particular, the analyst faces two primary challenges. (See Gomez-Lobo et al.
(2000) for an overview of information and modeling challenges associated with designing water
and sanitation tariffs.)
First, it can be difficult or expensive to obtain accurate measures of water use and income
for the same household. Data on households’ socioeconomic status and demographics are
typically available in secondary household survey data, such as national income and expenditure
surveys, World Bank Living Standards Measurement Study (LSMS) data, and some national
censuses. However, these surveys typically do not contain information on household water use.
Similarly, utility billing records contain information on household water use, provided customers
are metered, the meters are working, and the utility regularly reads customers’ meters. Due to
confidentiality requirements, however, it is typically not possible to match household level
socioeconomic data in nationally representative household income and expenditure surveys and
customer data in utility billing records.
The second challenge facing analysts is associated with estimating the cost of providing
water and wastewater service. To do this, the analyst must first define cost, which can range
from financial operations and maintenance (O&M) costs, financial O&M costs and capital costs,3
and full economic costs.4 The analyst must then estimate the appropriate cost of providing each
level of service.5
Studies in the subsidy incidence literature have addressed these two challenges in a
variety of ways. Because it can be difficult or not possible to obtain good measures of both
3 Capital costs are not consistently defined in the literature. For example, capital costs may include the financial
depreciation of historical investments, the current financial costs of repairing and replacing the existing capital
stock, and the financial costs of expanding the existing water and wastewater networks.
4 Economic costs include the opportunity cost of the raw water supply, the shadow price of all inputs, the economic
costs associated with wastewater discharge, and the opportunity cost of capital.
5 Estimating the cost of providing water and sanitation services can be difficult. One reason for this is the way in
which capital projects are financed in many countries. Financing for large water and sanitation projects often comes
in a variety of forms (e.g., fiscal transfers, grants, and loans) from a variety of sources (e.g., national or sub-national
governments and international donor organizations). Indeed, in many countries, national ministries or asset holding
companies, not utilities that provide water and sanitation services, are responsible for capital projects.

Environment for Development Fuente et al.
5
socioeconomic status and water use for the same household, studies in the literature typically use
a single data source to obtain information on both households’ socioeconomic status and water
use. In particular, most studies use households’ stated expenditure on water to estimate
households’ water use.6 They collect this information either through primary household surveys
(e.g., Foster 2004, Bardasi and Wodon 2008, and Angel-Urdinola and Wodon 2012) or from
nationally representative household budget and expenditure surveys (e.g., World Bank LSMS
data).
To estimate household water use from stated expenditure on water and sanitation
services, the analyst must have three types of information. First, she must be able to identify
whether or not a household is connected to the piped network, and whether or not the household
receives only piped water services or piped water and sewer services. Second, the analyst must
also be able to identify which utility serves each household. This information is typically not
contained in household income and expenditure survey data, but rather must be inferred based on
the geographical extent of utilities’ service areas. Third, the analyst must have information on the
tariffs applied by each of the utilities that serve the households in the survey data. Once the
analyst has this information, she can back calculate (impute) water use from stated expenditure
on water and sanitation services by applying the official tariff of the relevant water utility.
There are a number of reasons why imputed water use may not be a good proxy for
metered water use. Households may not be able to accurately recall how much they spend on
water and sanitation services.7 Even if households can perfectly recall their monthly expenditure
on water and sanitation services, there are additional reasons why expenditure on these services
might be a poor proxy for actual water use. For example, income and expenditure surveys often
do not contain information on whether a household connection is metered. If households do have
6 Some studies use alternative means to estimate water use. For example, some studies that use primary data
collected through household surveys obtain water use data by asking households to show a recent copy of their
water bill (e.g., Walker et al. 2000 and Foster 2004). However, even when analysts obtain information on household
water use from previous water bills, some households may not be metered, may not have functioning meters, or may
not be able to produce copies of previous water bills during the interview.
7 Households incur a variety of expenses each month and throughout the year and survey evidence suggests that
water constitutes a very small portion of monthly household expenditure (often less than 3%) for households with
piped connections (Appendix C.4 in Komives et al. 2005). Thus, it is possible that households may have difficulty
recalling expenditure on water and sanitation services because they do not represent a major portion of their total
expenditures. Indeed, in a 2,500 household survey conducted in Argentina, Foster (2004) reports that only 30% of
the households were able to recall the amount of their most recent bill.

Environment for Development Fuente et al.
6
metered connections, the meters may not be working or the utility may not read them on a
regular basis. Households may also have a shared connection. In these instances, households’
water bills will not reflect their metered water use.
Additionally, household budget and expenditure surveys ask households how much they
spent on water last month. They typically do not ask households specifically how much they
spent on piped water services, nor do they ask households how much they spent on sanitation
services.8 Thus, household recall of expenditure on water in these surveys may include the
amount they spent on water from vendors and sewer services.
Water bills may also include fees that are unrelated to water consumption in the most
recent billing period. This could include fees for other services (e.g., solid waste collection9),
pro-rated connection charges, arrears, or penalties for non-payment. Additionally, countries in
Latin America and elsewhere are experimenting with including payment for environmental
services in water bills to promote watershed protection (see Whittington and Pagiola 2012).
Studies in the literature address the issue of cost in three general ways. (See Appendix 2
for a summary of cost estimates used in the literature.) First, studies may use generic cost
estimates, or international benchmarks, to calculate subsidy incidence (e.g., Komives et al. 2005,
Komives et al. 2006, Foster and Yepes 2006).10
Common sources for generic cost estimates
include GWI (2004) and Kingdom et al. (2004). Other studies use empirical, site-specific cost
estimates (e.g., Groom et al. 2008, Banerjee and Morella 2011, Walker et al. 2000). However,
these studies typically do not explicitly state what the cost estimates include or precisely how
they were derived. Finally, studies may make ad hoc assumptions about the cost of providing
water and wastewater services. For example, Barde and Lehmann (2014) assume that the average
tariff currently implemented in Lima, Peru (approximately 0.64 USD/m311
) represents full cost
recovery.
8 For example, the most recent Kenya Integrated Household Budget and Expenditure survey asks households “What
was the total cost of water for your household last month?” (KNBS 2006).
9 See Gomez-Lobo et al. (2000).
10 For example, Foster and Araujo (2004) state, “[a]lthough there is no available information about the cost of
potable water in Guatemala, international benchmarks would suggest a full cost of around 0.30 to 0.40 USD/m3,
exclusive of sewerage” (35). The authors do not explicitly state whether this “full cost” is for O&M costs or for
O&M and capital costs. They also do not indicate the source for the international benchmarks to which they refer.
11 Assuming an exchange rate of 0.36 USD/PEN.

Environment for Development Fuente et al.
7
There is broad consensus in the literature that de facto subsidies delivered through the
water tariff are poorly targeted and largely regressive. Indeed, many studies find that subsidies
delivered through the water tariff perform worse than if the subsidies were equally distributed
among the population. This is principally due to the fact that low-income households are less
likely to have a private connection to the piped water network and, thus, do not receive subsidies
delivered through the water tariff.
Studies that examine subsidy incidence only among households with a piped connection
also find that subsidies are poorly targeted. This is primarily due to facts that income and water
use are often not highly correlated and that the tariff implemented by many utilities is not
sufficient to cover the cost of providing service. These empirical results are supported by
simulations conducted by Whittington et al. (2015) that suggests little can be done to improve
subsidy targeting when tariffs are not sufficient to cover costs.
A careful review of the literature highlights three gaps. First, studies in the literature
either focus only on subsidies associated with the delivery of piped water service or do not
explicitly state whether they include subsidies associated with wastewater service. Wastewater
service is often more expensive to provide than water service. To the extent that wastewater
services are sold below cost and to the extent that higher-income households are more likely to
have connections to the piped wastewater network, estimates in the literature may overestimate
the performance of subsidies delivered through the tariff.
Second, nearly all of the studies in the literature use stated expenditure to estimate water
use. As discussed above, there are several reasons why stated expenditure may be a poor proxy
for metered water use. Thus, it is unclear whether the broad consensus in the literature is
attributable to the fact that studies use the same, potentially flawed, measure of water use.
Finally, all of the studies in Appendix 1 focus on subsidy incidence only among
residential customers. This is not surprising given that these studies use data from household
surveys. As a result, however, the literature ignores the distributional issues between residential
and non-residential customers. Depending on the tariff applied to non-residential customers,
failing to include non-residential customers may over or understate the magnitude of total
subsidies delivered through the water tariff.
3. Empirical Strategy
This study was designed to fill the gaps in the subsidy incidence literature highlighted in
the previous section. Our empirical strategy proceeds in three analytical steps. In the first step of

Environment for Development Fuente et al.
8
our analysis, we combine socioeconomic and demographic data from a survey of 656 households
with data on metered water use from NCWSC billing records. We use these data to: 1) estimate
the distribution of subsidies among households with a private metered connection, and 2)
examine the extent to which stated expenditure is an accurate proxy of metered water use.
According to the most recent census, less than a quarter of households in Nairobi
reported using a private connection to the piped water network as their primary drinking source
(KNBS 2009). Approximately half of households used piped water that is not piped into their
dwelling as their primary drinking water source. Thus, in the second step of our analysis, we
examine the distribution of subsidies among all NCWSC’s residential customers, including
residential customers with shared connections.12
In the third, final, step we expand the scope of
our analysis to examine the distribution of subsidies among residential and non-residential
customers in Nairobi.
Subsidy Incidence
We obtain information on customer water use directly from 21 months of NCWSC’s
billing records. Like many utilities, NCWSC does not read each meter every month.13
To address
this, we calculate monthly water use directly from actual meter readings in the NCWSC billing
data as described in Equation 1.
𝑊𝑈𝑆𝐸𝑖,𝑡 = [𝑅𝐸𝐴𝐷𝐼𝑁𝐺𝑖,𝑡−𝑅𝐸𝐴𝐷𝐼𝑁𝐺𝑖,𝑡−1
𝑅𝐷𝐴𝑇𝐸𝑖,𝑡−𝑅𝐷𝐴𝑇𝐸𝑖,𝑡−1] ∙ 30.5 𝑑𝑎𝑦𝑠 (1)
where:
WUSEi,t is the water use for household i in month t;
READINGi,t is the meter reading for household i in month t;
READINGi,t-1 is the previous actual meter reading for household i;
RDATEi,t is the date on which NCWSC read the meter for household i in month t; and
RDATEi,t-1 is the date of the previous actual meter reading for household i.
12 Seventeen percent of households cited water vendors as their primary water source. Thus, the 52% noted above
reflects households that obtain water from a shared connection or a neighbor.
13 NCWSC attempts to read 75% of customer meters each month. When the company does not read a customer’s
meter, it estimates the customer’s water bill for that billing period.

Environment for Development Fuente et al.
9
We then use the estimates of households’ monthly water use obtained in Equation 1 to
calculate households’ average monthly water use over the period covered by the billing
records.14
We define the subsidy received by each customer as the difference between the cost to
serve each household and what the households pay for service. We calculate how much a
customer pays by applying NCWSC’s official tariff to our estimates of customers’ average
monthly water use. We define the cost of serving a particular customer as in Equation 2.
𝐶𝑂𝑆𝑇𝑖 = 𝑊𝑈𝑆𝐸𝑖 ∙ 𝑊𝐶𝑂𝑆𝑇 + 𝐼𝑤𝑤,𝑖 ∙ (𝑊𝑈𝑆𝐸𝑖 ∙ 𝑊𝑊𝐶𝑂𝑆𝑇) (2)
where:
COSTi is the average monthly cost of serving household i (USD/month);
WUSEi is the average water use of household i from Equation 1 (m3/month);
WCOST is the average volumetric cost of providing water service (USD/m3);
WWCOST is the average volumetric cost of providing wastewater service (USD/m3);
and
Iww,i is an indicator variable that takes the value 1 if a household has wastewater service
and 0 otherwise.
We develop empirical estimates of the average cost of providing water and wastewater
services. Our cost estimates include both operations and maintenance as well as capital costs.
They do not include the opportunity cost of the raw water supply.
We use subsidy shares, the share of subsidies received by different groups of customers,
to assess subsidy incidence.15
Equation 3 defines the share of subsidies going to a particular
group of customers.
𝑆𝑗 =∑ 𝑆𝑈𝐵𝑖
𝑛𝑗𝑖=1
∑ ∑ 𝑆𝑈𝐵𝑖
𝑛𝑗𝑖=1
𝐽𝑗=1
(3)
14 Metered water use may not reflect the total amount of water households use. For example, due to the fact that
NCWSC does not provide 24x7 water supply, households may purchase water from vendors or have a private
borehole to supplement their piped water supply. Households might also purchase bottled water for drinking even if
they receive an adequate supply from their piped connection. Finally, water meters may themselves not accurately
record actual water use when water supply is intermittent.
15 Coady et al. (2004) and Van de Walle (1998) provide a comprehensive overview of alternative measures of
subsidy targeting.

Environment for Development Fuente et al.
10
where:
Sj is the share of subsidies received by customer group j (j=1…J), and
SUBi is the share of subsidies received by household i.
We calculate the distribution of subsidies among residential customers of different
income levels. Our analysis of subsidy incidence among all customer classes examines the
distribution of subsidies among residential and non-residential customers.
Stated Expenditure as a Proxy for Water Use
Nearly all studies in the subsidy incidence literature use stated expenditure to estimate
household water use (see Appendix 1). We examine whether stated expenditure is an accurate
proxy for metered water use by estimating household water use from households’ stated
expenditure on water and comparing this to their metered water use. To do this, during the
household survey we ask households if they can recall the amount of their last bill from NCWSC
and the number of months of service the bill covered. Equation 4 shows how we impute water
use for customers with only piped water service. We use an analogous approach to impute water
use for customers with both water and sewer service.
𝐼𝑀𝑃𝑈𝑆𝐸𝑖
= (𝐸𝑋𝑃𝑆𝑖 − 𝑅𝐸𝑁𝑇) 𝑝1 𝑖𝑓 𝐸𝑋𝑃𝑆𝑖 > 0 & 𝐸𝑋𝑃𝑆𝑖 ≤ 𝑏1𝑚𝑎𝑥𝑤 ⁄
(4)
= 𝑏1 + (𝐸𝑋𝑃𝑆𝑖 − 𝑏1𝑚𝑎𝑥𝑤) 𝑝2 𝑖𝑓 𝐸𝑋𝑃𝑆𝑖 > 𝑏1𝑚𝑎𝑥𝑤 & 𝐸𝑋𝑃𝑆𝑖 ≤ 𝑏2𝑚𝑎𝑥𝑤 ⁄
= 𝑏2 + (𝐸𝑋𝑃𝑆𝑖 − 𝑏2𝑚𝑎𝑥𝑤) 𝑝3 𝑖𝑓 𝐸𝑋𝑃𝑆𝑖 > 𝑏2𝑚𝑎𝑥𝑤 & 𝐸𝑋𝑃𝑆𝑖 ≤ 𝑏3𝑚𝑎𝑥𝑤 ⁄
= 𝑏3 + (𝐸𝑋𝑃𝑆𝑖 − 𝑏3𝑚𝑎𝑥𝑤) 𝑝4 𝑖𝑓 𝐸𝑋𝑃𝑆𝑖 > 𝑏3𝑚𝑎𝑥𝑤 ⁄
where:
IMPUSEi is the imputed water use for household i (m3/mo.);
EXPSi is the stated expenditure for household i (Ksh/mo.);
RENT is the monthly meter rent charged in the NCWSC tariff (Table 1);
pX is the volumetric price for water in the Xth block in the NCWSC tariff (Table 1);
bX is the volumetric upper bound for the Xth block in the NCWSC tariff (Table 1); and
bXmaxw is the amount a water customer would be charged for consuming the maximum
amount in the Xth block of the NCWSC tariff.

Environment for Development Fuente et al.
11
4. Data
The first step of our analysis examines subsidy incidence among households with a
private connection to the piped water network. For this analysis, we use data from a sample of
656 households that were randomly drawn from two of Nairobi’s six service regions.16
The
survey was conducted between November 2013 and January 2014 and collected a range of
socioeconomic and demographic information from households, including data on monthly
income, household expenditure, and asset ownership. Following Filmer and Pritchett (2001) and
Filmer and Scott (2008), we use principal component analysis to construct an asset index to serve
as a proxy for wealth.17
We obtain information on customer water use from 21 months of NCWSC’s billing
records. The billing data cover the period from August 2012 to May 2014. The principal
challenge in our empirical strategy was to identify households in our survey sample in the billing
records. Like many cities in developing countries, Nairobi does not have a formal system of
addresses. Thus, it was not possible to first construct our sample from the billing records
and then locate households to conduct the household survey.18 To address this, we used
households’ account numbers to identify households in our sample in the billing records.
Because households do not typically know their NCWSC account number, however, we obtained
households’ account numbers by matching the serial number on the households’ water meter
with the account number on the NCWSC marketing assistant’s itinerary.
16
Each day, survey enumerators were paired with NCWSC marketing assistants (meter readers). Each pair of
enumerators would then shadow a marketing assistant on their meter reading route for that day. Starting at the
beginning of the itinerary the marketing assistant was reading that day, the enumerators were instructed to select the
tenth customer account as the first household. The marketing assistant would then introduce one of the enumerators
to the household and continue on his meter reading route. The second enumerator would select the twentieth account
on the list and do the same. Once the enumerators completed an interview, they would call the marketing assistant
and meet them where they were in their current meter reading route. The enumerator would then use the next
account as a sample household. If nobody was at the household, enumerators were instructed to note the address and
attempt two call-backs. If someone from the household was home, but did not have time to complete the survey, or
the head of household or spouse was not home, enumerators were instructed to take the contact information of the
head of household and attempt to schedule a call-back two times before replacing the household in the sample.
17 Assets included in the index include: LPG as a main cooking fuel, biomass or kerosene as a main cooking fuel,
separate kitchen, security guard, connection to the electricity grid, mobile phone, internet connection, TV, radio,
computer, private car, washing machine, refrigerator, borewell, and additional land in/out of Nairobi.
18 The survey team attempted to do this during three days of the survey pre-test. However, it proved logistically
infeasible.
Environment for Development Fuente et al.
12
Our analysis of NCWSC’s billing records confirms that the utility implements the official
tariff to calculate customers’ water and sewer bills. Thus, we use the official tariff to calculate
customers’ water bills (Table 1).19
NCWSC implements an IBT with 4 usage blocks. In addition
to the fixed charge for meter rent, NCWSC applies a minimum charge for 10 m3/mo.
Households that use less than 10 m3/mo. are charged for 10 m3/mo. NCWSC charges customers
with a connection to the sewer network an additional 75% of the volumetric portion of their
water bill for wastewater service.
We use data from five years of audited financial statements (FY 2007 to 2012) to
estimate NCWSC’s average operations and maintenance costs. We derive capital cost estimates
from data in NCWSC’s water master plan (MoWI & AWSB 2014) and interviews with senior
water and sanitation engineers at NCWSC, Athi Water Services Board, and local engineering
firms. Table 2 presents the cost estimates we use in our analysis. Assuming 35% non-revenue
water, we estimate the full cost (O&M plus capital costs) of water service to be 1.40 USD/m3
and 1.46 USD/m3 for wastewater service. These estimates are higher than the cost estimates used
in many studies, but of similar magnitude to the cost estimates in GWI (2004) and Kingdom et
al. (2004) once non-revenue is accounted for (see Tables A2.1 and A2.2 in Appendix 2).
For the analysis of subsidy incidence among all residential customers and among all
customer classes, we obtain information on customer water use from NCWSC billing records.
However, NCWSC does not have socioeconomic or demographic information about its
customers. In the absence of household-level data on income or socioeconomic status, one could
potentially use household budget and expenditure survey data or recent census data to obtain
aggregate data on household characteristics. This is not possible in Nairobi for two reasons. First,
the most recent Kenya Integrated Household Budget and Expenditure Survey (2005-6) contains
only 685 observations from Nairobi. Second, data from the most recent census are not publicly
available.
To address this, we obtain information on household socioeconomic status in the
following manner. NCWSC groups customers into itineraries that marketing assistants (meter
readers) use to read meters on a daily basis. NCWSC has over 2000 itineraries, with each
itinerary having approximately 100-200 accounts. We asked the staff in charge of billing in each
of NCWSC’s six service regions to work with their marketing assistants to rank each itinerary as
19 Throughout the analysis, we assume a conversion rate of 90 KSH/USD.

Environment for Development Fuente et al.
13
predominantly low-income, middle-income, high-income or mixed income. For itineraries that
were mixed income, the regional teams were asked to indicate which incomes were represented.
We also asked the regional teams to indicate whether the itinerary included accounts in informal
settlements. Finally, because NCWSC does not have information on whether meters are shared
or individual connections, we asked the regional teams to approximate the percent of accounts on
the itinerary that are served by shared meters.
This method of obtaining information on the socioeconomic status of each household has
both strengths and weaknesses. The regional teams’ classification of itineraries into different
socioeconomic strata relies on their perceptions of what constitutes low, middle, and high-
income in Nairobi. While this approach does not provide an objective measure of households’
socioeconomic status, it does take advantage of the meter readers’ and regional teams’ in-depth,
local knowledge of their service area.
NCWSC has approximately 180,000 active residential accounts. NCWSC staff in the
regional offices were able to provide an income classification for itineraries serving
approximately 90% of the residential accounts. Approximately 15% of NCWSC accounts are
located on itineraries that NCWSC staff indicated are predominantly low-income. Twenty-five
percent of NCWSC accounts are located in itineraries identified as predominantly high-income.
The remaining accounts are located in itineraries classified as middle-income. Only 3% of
accounts are located in itineraries that primarily serve informal settlements.20
The income classifications at the itinerary level reflect the fact that low-income
households are more likely than wealthier households to have a shared connection. According to
NCWSC’s classifications, 94% of accounts in itineraries characterized as high-income are served
predominantly by individual meters.21
Over 70% of households characterized as low-income are
predominantly served by shared meters.
The income classifications of itineraries also comport well with the household level asset
index we construct for our survey sample. Indeed, 80% of households in our survey sample
located on itineraries characterized as high-income are in the top two wealth quintiles. Similarly,
20 Approximately 95% percent of itineraries that serve informal settlements are in itineraries characterized as low-
income.
21 We characterize an itinerary as being predominantly served by individual (shared) meters if NCWSC staff
indicate that more than 80% of accounts on the itinerary have individual (shared) meters.

Environment for Development Fuente et al.
14
80% of households in our survey sample located on itineraries characterized as low-income are
in the bottom two wealth quintiles, with nearly 60% in the lowest wealth quintile.
For our analysis of subsidy incidence among all customer classes, we obtain water use
data from the same set of NCWSC billing records described above. NCWSC billing data include
13 different customer classes. We group these customer classes into four general types:
residential, non-residential, bulk, and kiosk. Our non-residential customer type includes, but is
not limited to, accounts classified as government, community, and industrial.
5. Results
Household Survey—Subsidy Incidence
Table 3 presents some basic characteristics of households in our sample. The average
household in our sample has four members, which is consistent with the average household size
in Nairobi from the latest census. Approximately half of the households in our sample rent their
home. Seventy-eight percent of households in our survey report using their piped water
connection as their primary drinking water source. The remaining 22% report using bottled water
for their primary drinking water source. Over a quarter of households in our sample report
purchasing water from a vendor in the previous year, which reflects the fact that NCWSC does
not provide customers 24x7 water service.
Mean and median water use in our sample are 19 m3/mo. and 13 m3/mo., respectively
(Figure 1). Average water use among all residential customers in the NCWSC billing data is 31
m3/mo. However, the mean water use of households on itineraries with 100% individual meters
is 20 m3/mo., similar to what we find in our sample of households. Nearly 40% of households in
the sample fall in the lifeline block (0 to 10 m3/mo.). Over 80% of the sample’s water use falls in
the first two usage blocks (below 30 m3/mo.). Only 4% of the sample falls in the upper-most
block of NCWSC’s tariff (>60 m3/mo.).
We find considerable heterogeneity in water use, both within and across wealth quintiles.
Figure 2 plots household water use versus the wealth index score. The correlation between a
household’s wealth index score and water use in our sample is 0.20. Mean water use is 16
m3/hh/mo. for households in the first (lowest) wealth quintile and 30 m3/hh/mo. for households
in the fifth (highest) wealth quintile (Table 4).
Environment for Development Fuente et al.
15
Table 4 also shows the monthly bill for households in the five wealth quintiles.22
The
mean bill for households in the lowest quintile is 931 Ksh/hh/mo. (approximately 10
USD/hh/mo.). The mean bill for households in the highest wealth quintile is 1509 Ksh/hh/mo.
(approximately 17 USD/hh/mo.). As a point of comparison, these representative bills are a
fraction of what households report spending on electricity. The mean water and sewer bill for
households in the lowest quintile is nearly 60% of what these households report paying for
electricity. For the wealthiest households in the sample, the mean bill is less than a quarter of
what they report spending on electricity.
Table 4 presents the average price paid by households in each wealth quintile. For the full
sample, the mean average price ranges from 79 Ksh/m3 (0.90 USD/m3) to 50 Ksh/m3 (0.56
USD/m3). The mean average price for households in the lowest wealth quintile is 70 Ksh/m3
(0.79 USD/m3) and 50 Ksh/m3 (0.56 USD/m3) for households in the highest wealth quintile.
These average price estimates reflect the fact that over 90% of households in our sample have a
sewer connection.
Figure 3 shows the distribution of subsidies across wealth quintiles. If the subsidy were
evenly, or randomly, distributed among the population, each wealth quintile would receive 20%
of the total subsidy. A well-targeted subsidy would deliver a substantial share of the total
subsidies to low-income households. In our sample, households in the lowest quintile receive
16% of the total subsidy. Households in the top three wealth quintiles receive nearly 70% of the
total subsidy, with households in the highest wealth quintile receiving almost 30% of the total
subsidy.
Household Survey—Stated Expenditure as a Proxy for Metered Water Use
During the survey, we asked households if they can recall the amount of their last bill
from NCWSC. Nearly 85% of households in our sample indicated that they could recall the
amount of their last bill.23
Figure 4 presents a scatter plot of metered versus imputed water use
for households who could recall the amount of their previous water bill. The 45 degree line in
Figure 4 traces a line of equality for which imputed and metered water use would be the same for
22 “Representative bill” here refers to the amount a household would pay per month based on its average water use
and NCWSCs tariff.
23 This percentage is much higher than the 30% percent reported in Foster (2004).
Environment for Development Fuente et al.
16
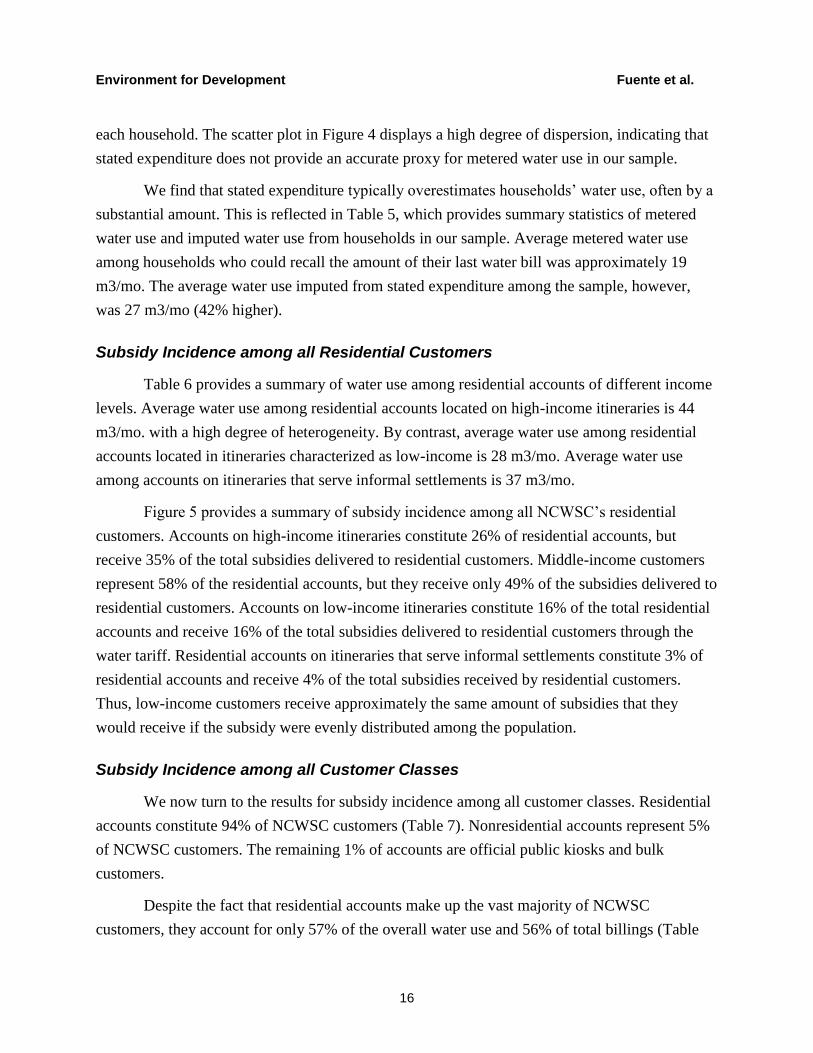
each household. The scatter plot in Figure 4 displays a high degree of dispersion, indicating that
stated expenditure does not provide an accurate proxy for metered water use in our sample.
We find that stated expenditure typically overestimates households’ water use, often by a
substantial amount. This is reflected in Table 5, which provides summary statistics of metered
water use and imputed water use from households in our sample. Average metered water use
among households who could recall the amount of their last water bill was approximately 19
m3/mo. The average water use imputed from stated expenditure among the sample, however,
was 27 m3/mo (42% higher).
Subsidy Incidence among all Residential Customers
Table 6 provides a summary of water use among residential accounts of different income
levels. Average water use among residential accounts located on high-income itineraries is 44
m3/mo. with a high degree of heterogeneity. By contrast, average water use among residential
accounts located in itineraries characterized as low-income is 28 m3/mo. Average water use
among accounts on itineraries that serve informal settlements is 37 m3/mo.
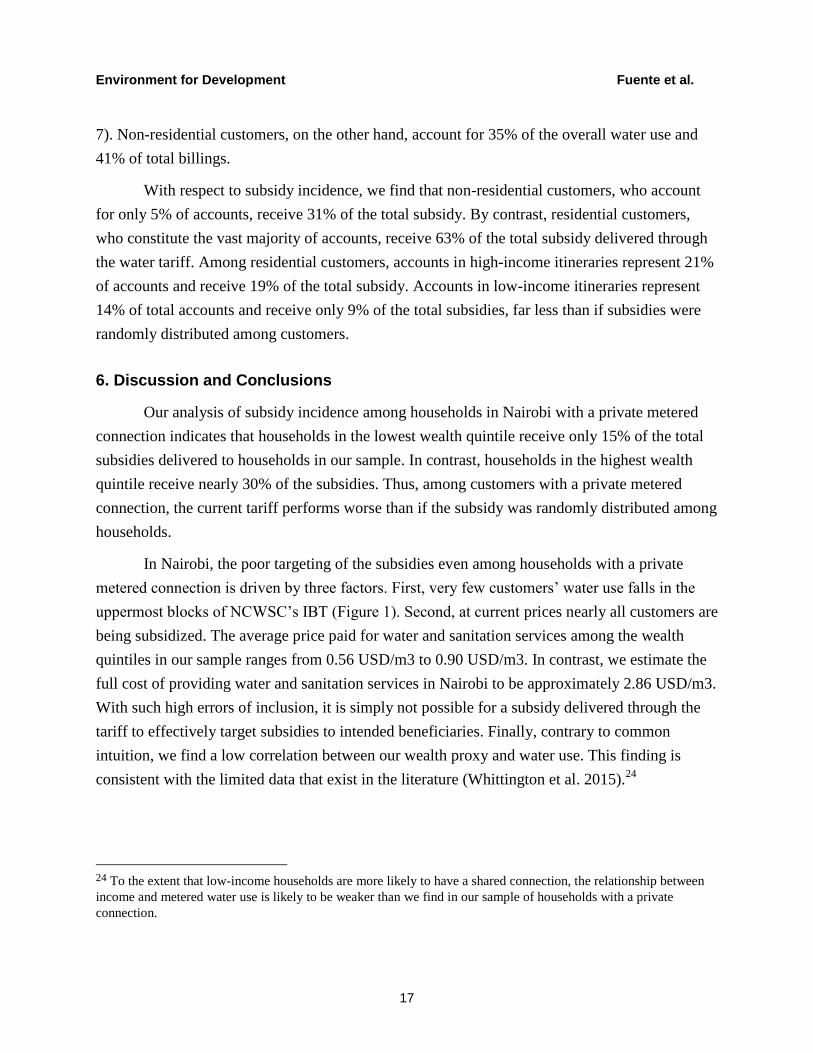
Figure 5 provides a summary of subsidy incidence among all NCWSC’s residential
customers. Accounts on high-income itineraries constitute 26% of residential accounts, but
receive 35% of the total subsidies delivered to residential customers. Middle-income customers
represent 58% of the residential accounts, but they receive only 49% of the subsidies delivered to
residential customers. Accounts on low-income itineraries constitute 16% of the total residential
accounts and receive 16% of the total subsidies delivered to residential customers through the
water tariff. Residential accounts on itineraries that serve informal settlements constitute 3% of
residential accounts and receive 4% of the total subsidies received by residential customers.
Thus, low-income customers receive approximately the same amount of subsidies that they
would receive if the subsidy were evenly distributed among the population.
Subsidy Incidence among all Customer Classes
We now turn to the results for subsidy incidence among all customer classes. Residential
accounts constitute 94% of NCWSC customers (Table 7). Nonresidential accounts represent 5%
of NCWSC customers. The remaining 1% of accounts are official public kiosks and bulk
customers.
Despite the fact that residential accounts make up the vast majority of NCWSC
customers, they account for only 57% of the overall water use and 56% of total billings (Table
Environment for Development Fuente et al.
17
7). Non-residential customers, on the other hand, account for 35% of the overall water use and
41% of total billings.
With respect to subsidy incidence, we find that non-residential customers, who account
for only 5% of accounts, receive 31% of the total subsidy. By contrast, residential customers,
who constitute the vast majority of accounts, receive 63% of the total subsidy delivered through
the water tariff. Among residential customers, accounts in high-income itineraries represent 21%
of accounts and receive 19% of the total subsidy. Accounts in low-income itineraries represent
14% of total accounts and receive only 9% of the total subsidies, far less than if subsidies were
randomly distributed among customers.
6. Discussion and Conclusions
Our analysis of subsidy incidence among households in Nairobi with a private metered
connection indicates that households in the lowest wealth quintile receive only 15% of the total
subsidies delivered to households in our sample. In contrast, households in the highest wealth
quintile receive nearly 30% of the subsidies. Thus, among customers with a private metered
connection, the current tariff performs worse than if the subsidy was randomly distributed among
households.
In Nairobi, the poor targeting of the subsidies even among households with a private
metered connection is driven by three factors. First, very few customers’ water use falls in the
uppermost blocks of NCWSC’s IBT (Figure 1). Second, at current prices nearly all customers are
being subsidized. The average price paid for water and sanitation services among the wealth
quintiles in our sample ranges from 0.56 USD/m3 to 0.90 USD/m3. In contrast, we estimate the
full cost of providing water and sanitation services in Nairobi to be approximately 2.86 USD/m3.
With such high errors of inclusion, it is simply not possible for a subsidy delivered through the
tariff to effectively target subsidies to intended beneficiaries. Finally, contrary to common
intuition, we find a low correlation between our wealth proxy and water use. This finding is
consistent with the limited data that exist in the literature (Whittington et al. 2015).24
24 To the extent that low-income households are more likely to have a shared connection, the relationship between
income and metered water use is likely to be weaker than we find in our sample of households with a private
connection.

Environment for Development Fuente et al.
18
Using our survey sample, we also examine the extent to which stated expenditure on
water and sanitation services is an accurate proxy for metered water use. We find that stated
expenditure is a poor proxy for metered water use.25
This is striking given that nearly all studies
in the subsidy incidence literature use stated expenditure to estimate water use.
Despite the significant measurement error associated with using stated expenditure as a
proxy for water use, we find that using stated expenditure to estimate subsidy incidence does not
change the policy implications of our results. This is true in our sample because the majority of
NCWSC customers have arrears or credits on their accounts and we find a low correlation
between income and whether customers have arrears or credits. This may not be true in other
locales. Thus, our findings suggest that researchers should exercise caution when using stated
expenditure to estimate water use.
When we expand our analysis to the distribution of subsidies among all NCWSC’s
180,000 residential customers, we find that customers located on itineraries classified as low-
income account for approximately 16% of total residential accounts and receive 16% of the total
subsidies delivered to residential customers. While subsidy targeting among all residential
customers is slightly better than when we examine subsidy incidence among only households
with a private connection, errors of inclusion remain high and customers in low-income
itineraries receive the same amount of subsidies as if subsidies were randomly distributed among
residential customers.
Finally, our analysis of subsidy incidence among all customer classes indicates that non-
residential customers receive over one-third of the total subsidies delivered through NCWSC’s
tariff. Residential customers, who represent 94% of NCWSC accounts, receive only 63% of the
total subsidies. This is not surprising given that non-residential customers account for nearly
40% of total water use and over 40% of the total billings for NCWSC. However, policy makers
often implement an IBT with a lifeline block specifically to target subsidies to low-income,
residential customers. We find that this is not occurring in Nairobi. Our results highlight the
25 Close inspection of the billing data reveals that over 70% of NCWSC’s residential customers have arrears or
credits on their accounts. Indeed, we find that the arrears or credits on customers’ accounts are often more than
double the charge for the customers’ previous month of service.

Environment for Development Fuente et al.
19
importance of examining subsidy incidence among all customer classes, which has largely been
ignored in the literature.
In addition to our findings related to subsidy incidence, our analysis raises important
issues about the magnitude of the subsidy delivered through the water tariff. Most studies on
subsidy incidence focus on subsidies associated with piped water service among only residential
customers. They do not examine subsidies associated with sewer service or subsidies delivered to
non-residential customers. Our analysis suggests that limiting the scope of subsidy incidence in
this manner would lead to a substantial underestimate of the magnitude of the subsidy delivered
through the water tariff.
In Nairobi, examining subsidies associated with piped water service among residential
customers would result in a total subsidy that is approximately 40% less than the subsidy
associated with both piped water and sanitation services for residential customers. Similarly, we
find that examining subsidies associated with both piped water and sewer services among only
residential customers would underestimate the total subsidy delivered through the water tariff by
45%. In total, focusing only on subsidies associated with providing water service to residential
customers would underestimate the magnitude of the subsidy delivered through the water tariff
by 65%. We estimate that the total subsidy delivered through the tariff is approximately one and
half times NCWSC’s total billings. Thus, such errors in estimating the total subsidy delivered
through the water tariff can be substantial.
Policy makers in the water sector often express concern about the affordability of water
and wastewater services, especially for low-income households. This concern is often used to
justify keeping water prices low and for implementing an IBT that includes a lifeline block. Our
findings add to a growing body of empirical literature that suggests that IBTs implemented by
many utilities do not effectively target subsidies to low-income households. In Nairobi, we find
this is particularly true when examining subsidy incidence among all customer classes, but also
when we restrict our analysis to households with private metered connections. This is striking
given that the poorest households often lack access to piped water and sanitation services
altogether. This growing body of evidence suggests that the IBT is an ineffective and often
expensive means of delivering subsidies to low-income households. Thus, if policy makers want
to subsidize water and sanitation services for low-income households, they should explore
alternative subsidy delivery mechanisms, including both connection subsidies and means-tested
subsidies.

Environment for Development Fuente et al.
20
References
Angel-Urdinola, D., and Q. Wodon. 2007. Do Utility Subsidies Reach the Poor? Framework and
Evidence for Cape Verde, Sao Tome, and Rwanda. Economics Bulletin 9(4): 1-7.
Angel-Urdinola, D.F., and Q. Wodon. 2012. Does Increasing Access to Infrastructure Services
Improve the Targeting Performance of Water Subsidies? Journal of International
Development 24(1): 88-101.
Banerjee, S.G., and E. Morella. 2011. Africa’s Water and Sanitation Infrastructure: Access,
Affordability and Alternatives. Washington, DC: World Bank.
Banerjee, S., V. Foster, Y. Ying, H. Skilling, and Q. Wodon. 2008. Cost Recovery, Equity and
Efficiency in Water Tariffs: Evidence from African Utilities. World Bank Policy
Research Working Paper No. 5384. Washington, DC: World Bank.
Bardasi, E., and Q. Wodon. 2008. Who Pays the Most for Water? Alternative Providers and
Service Costs in Niger. Economics Bulletin 9(20): 1-10.
Barde, J.A., and P. Lehmann. 2014. Distributional Effects of Water Tariff Reforms–an Empirical
Study for Lima, Peru. Water Resources and Economics. (In press).
Boland, J., and D. Whittington. 2000. “The Political Economy of Water Tariff Design in
Developing Countries: IBTs versus Uniform Price with Rebate.” In The Political
Economy of Water Pricing Reforms, edited by Ariel Dinar. New York: Oxford University
Press.
Coady, D., Grosh, M., and J. Hoddinott. 2004. The Targeting of Transfers in Developing
Countries: Review of Experience and Lessons. Social Safety Net Primer Series,
Washington, DC: World Bank.
Diakité, D., Semenov, A. and A. Thomas. 2009. A Proposal for Social Pricing of Water Supply
in Côte d'Ivoire. Journal of Development Economics 88(2): 258-268.
Fankhauser, S., and S. Tepic. 2007. Can Poor Consumers Pay for Energy and Water? An
Affordability Analysis for Transition Countries. Energy Policy 35(2): 1038-1049.
Filmer, D., and L. Pritchett. 2001. Estimating Wealth Effects without Expenditure Data - or
Tears: An Application to Educational Enrollments in States in India. Demography 38(1):
115-32.
Filmer, D., and K. Scott. 2008. Assessing Asset Indices. World Bank Policy Research Paper
4605. Washington, DC: World Bank.

Environment for Development Fuente et al.
21
Foster, V. 2004. Toward a Social Policy for Argentina's Infrastructure Sectors: Evaluating the
Past and Exploring the Future. World Bank Policy Research Working Paper No. 3422.
Washington, DC: World Bank.
Foster, V., Gómez-Lobo, A., and J. Halpern. 2000. Designing Direct Subsidies for Water and
Sanitation Services-Panama: A Case Study. World Bank Policy Research Working Paper
No. 2344. Washington, DC: World Bank.
Foster, V., and C. Araujo. 2004. Does Infrastructure Reform Work for the Poor? A Case Study
From Guatemala. World Bank Policy Research Working Paper No. 3185. Washington,
DC: World Bank.
Foster, V., and T. Yepes. 2006. Is Cost Recovery a Feasible Objective for Water and Electricity?
The Latin American Experience. World Bank Policy Research Working Paper No. 3943.
Washington, DC: World Bank.
García-Valinas, M.A., R. Martínez-Espineira, and F. González-Gómez. 2010. Affordability of
Residential Water Tariffs: Alternative Measurement and Explanatory Factors in Southern
Spain. Journal of Environmental Management 91(12): 2696-2706.
Groom, B., X. Liu, T. Swanson, and S. Zhang. 2008. “Resource Pricing and Poverty Alleviation:
the Case of Block Tariffs for Water in Beijing.” In Coping with Water Deficiency 48:
213-37. Dordrecht: Springer Netherlands. doi:10.1007/978-1-4020-6615-3_9.
GWI. 2004. How Much Should Water Cost? Global Water Intelligence 5(9).
GWI. 2013. Global Water Tariff Survey. Available at: http://www.globalwaterintel.com/global-
water-intelligence-magazine/tariff-survey/.
Gómez-Lobo, A., and D. Contreras. 2003. Water Subsidy Policies: A Comparison of the Chilean
and Colombian Schemes. The World Bank Economic Review 17(3): 391-407.
Gómez-Lobo, A., V. Foster, and J. Halpern. 2000. Information and Modeling Issues in
Designing Water and Sanitation Subsidy Schemes. World Bank Policy Research
Working Paper 2345. Washington, DC: World Bank.
Kenya National Bureau of Statistics (KNBS). 2006. Kenya Integrated Household Budget and
Expenditure Survey 2005/6.
Kenya National Bureau of Statistics (KNBS). 2009. Population and Housing Census 2009.

Environment for Development Fuente et al.
22
Kingdom, W., M. Van Ginneken, and C. Brocklehurst. 2004. Full Cost Recovery in the Urban
Water Supply Sector: Implications for Affordability and Subsidy Design. Unpublished
working paper.
Komives, K., J. Halpern, V. Foster, Q. Wodon, and R. Abdullah. 2006. The Distributional
Incidence of Residential Water and Electricity Subsidies. World Bank Policy Research
Paper No. 3878. Washington, DC: World Bank.
Komives, K., J. Halpern, V. Foster, Q. Wodon, and R. Abdullah. 2007. Utility Subsidies as
Social Transfers: An Empirical Evaluation of Targeting Performance. Development
Policy Review 25(6): 659-679.
Komives, K., J. Halpern, V. Foster, Q. Wodon, and R. Abdullah. 2005. Water, Electricity, and
the Poor: Who Benefits From Utility Subsidies? Washington, DC: World Bank.
Ministry of Water and Irrigation (MoWI) and Athi Water Services Board (AWSB). 2012.
Feasibility Study and Master Plan for Nairobi and Satellite Towns. November 2012.
Ruijs, A. 2009. Welfare and Distribution Effects of Water Pricing Policies. Environmental and
Resource Economics 43(2): 161-182.
Ruijs, A., A. Zimmermann, and M. van den Berg. 2008. Demand and Distributional Effects of
Water Pricing Policies. Ecological Economics 66(2-3): 506-516.
Van de Walle, D. 1998. Targeting Revisited. The World Bank Research Observer 13(2): 231.
Walker, I., P. Ordoñez, P. Serrano, and J. Halpern. 2000. Pricing Subsides and the Poor: Demand
for Improved Water Services in Central America. World Bank Policy Research Paper No.
2468. Washington, DC: World Bank.
Whittington, D. 1992. Possible Adverse Effects of Increasing Block Water Tariffs in Developing
Countries. Economic Development and Cultural Change 41(1): 75-87.
Whittington, D., and S. Pagiola. 2012. Using Contingent Valuation in the Design of Payments
for Environmental Services Mechanisms: A Review and Assessment. The World Bank
Research Observer 27(2): 261-287.
Whittington, D., C. Nauges, D. Fuente, and X. Wu. 2015. A Diagnostic Tool for Estimating the
Incidence of Subsidies Delivered by Water Utilities in Low - and Medium-income
Countries, with Illustrative Simulations. Utilities Policy 34: 70-81.

Environment for Development Fuente et al.
23
Tables and Figures
Table 1. Summary of the Tariff Implemented by NCWSC
Tariff Component USD/m3a
Residential, Commercial, and Industrial
0 to 10b m3/mo. 0.22
11 to 30 m3/mo. 0.45
31 to 60 m3/mo. 0.50
> 60 m3/mo. 0.63
Water Kiosk
All units 0.18
Bulk Supply
All units 0.31
Other Charges
Seweragec 75%
Meter Rent 0.59
Connection Charges 29 a Conversion rate = 90 KSH/USD.
b Customers charged for a minimum of 10 m3/mo.
c Applied to the volumetric component of the water bill.
Table 2. Summary of Cost Estimates Used to Calculate Subsidy Incidence
Cost Component USD/m3 a
Water Serviceb 1.40
O&M 0.30
Capital Costsc 1.10
Water & Wastewater Serviceb 1.46
Operations & Maintenance 0.30
Capital Costsc 1.16 a Conversion rate = 90 KSH/USD.
b Cost estimates assume 35% non-revenue water.
c 10% real discount rate; 30-year average useful life of capital.

Environment for Development Fuente et al.
24
Table 3. Basic Characteristics of Survey Households
Household Characteristic Value
Household size (s.d.)* 4
(1.78)
Home owner 51%
Primary drinking water source Piped water connection 78%
Bottled water 22%
Water vendor (previous year) 26%
Household water treatment 68%
Sewer connection 93% *Standard deviation
Table 4. Water Use, Representative Bill, and Average Price among Wealth Quintiles
Wealth Quintile
Unit 1 2 3 4 5 Overall
Mean water use (s.d.)* m3/hh/mo. 16 14 14 24 30 19
(30) (15) (17) (25) (32) (26)
Representative water bill USD/hh/mo. 10.35 8.39 8.19 14.18 16.76 11.58
Average price USD/m3 0.79 0.90 0.83 0.62 0.56 0.74 *Standard deviation
Table 5. Summary Statistics for the Distributions of Metered and Imputed Water Use
Water Use Unit Mean Std. Dev. Min Max
Metered m3/mo. 19 24 0.7 292
Imputed m3/mo. 27 34 0.3 436
Table 6. Summary of Water Use Among NCWSC Residential Customers
Income Water Use
(m3/acct./mo.)
Classification Mean Median Std. Dev
High Income 44 16 322
Middle Income 25 12 107
Low Income 28 10 186
Informal 37 11 196
All residential 31 12 194

Environment for Development Fuente et al.
25
Table 7. Summary of the Share of Accounts, Water Use, Billings, and Subsidies Among Four NCWSC Customer Classes
Customer class % Total
Accounts % Total
Water Use % Total Billings
% Total Subsidy
Residential 94% 57% 56% 63%
Non-residential 5% 35% 41% 31%
Kiosk 1% 3% 1% 2%
Bulk 0% 4% 2% 3%
Total 100% 100% 100% 100%
Figure 1. Distribution of Water Use among Survey Sample with NCWSC Tariff Blocks
0.00
0.10
0.20
0.30
0.40
0.50
0.60
0.70
0
10
20
30
40
50
60
70
0 10 20 30 40 50 60 70 80 90 100
Fre
qu
en
cy
Water use (m3/hh/mo)
Frequency Current Tariff
Median= 13 m3/hh/mo.
Mean= 19 m3/hh/mo.

Environment for Development Fuente et al.
26
Figure 2. Scatter Plot of Monthly Household Water Use Versus Wealth
* Nine observations with water use above 100 m3/mo. not shown on the graph for scale purposes.
Figure 3. Share of Subsidies Received by Each Wealth Quintile
20% 20% 20% 20% 20%
16% 15% 15%
25%
29%
0%
5%
10%
15%
20%
25%
30%
35%
1 2 3 4 5
Wealth Quintile
Account Share Subsidy Share

Environment for Development Fuente et al.
27
Figure 4. Imputed Versus Metered Water Use
Figure 5. Share of Total Residential Accounts and Subsidies Received by Each Income Group
16%
58%
26%
16%
49%
35%
0%
10%
20%
30%
40%
50%
60%
70%
Low income Middle income High income
Account Share Subsidy Share

Environment for Development Fuente et al.
28
Appendix 1. Summary of Subsidy Incidence Literature
Table A1. Summary of Studies in the Subsidy Incidence Literature (Adapted from Whittington et al. 2015)
Study Country Service Data Source** Data Year Sample Size Water Use Measure** Indicator(s)***
Barde and Lehmann (2014)
Lima, Peru Water* Billing data, expenditure survey, tariff
2010 2570 Stated expenditure
Affordability; subsidy share; EOI; EOE; Leakage rate
Angel-Urdinola and Wodon (2012)
Nicaragua Water HH survey data and tariffs
2001 & 2005
3641 (2001) 6102 (2005)
Stated expenditure
Concentration coefficient
Banerjee and Morella (2011)
Multi-country - Africa
Water* HH surveys and tariffs
Varies Varies Stated expenditure
Affordability (share of HH total expenditure); Concentration coefficient
Banerjee et al. (2010)
45 utilities in 23 African Countries
Water LSMS and tariffs Varies Varies Stated expenditure
Affordability (share of HH total expenditure); Concentration coefficient
Garcia-Valinas et al. (2010)
Spain Water Municipal surveys
2005 301 municipalities
Aggregate Affordability
Diakite et a.l (2008) Cote d'Ivore Water HH panel data 1998-2002 780 total in panel
(aggregate)
Aggregate Welfare gain/loss
*Study did not clearly state whether it focused only on water service. Service level inferred from text of the study.
** Aggregate refers to data averaged over a geographic area (e.g., service region, metropolitan area, county, etc.).
*** EOE=Errors of exclusion. EOI=Errors of inclusion.

Environment for Development Fuente et al.
29
Table A1. Summary of Studies in the Subsidy Incidence Literature (Adapted from Whittington et al. 2015)
Study Country Service Data Source** Data Year Sample Size Water Use Measure** Indicator(s)***
Ruijs (2009) Sao Paolo, Brazil Water HH data 1997-2002 63 MRSP Aggregate Welfare gain/loss
Ruijs et al. (2008) Sao Paolo, Brazil Water Aggregate panel data for demand est.
1997-2002 Panel of 39 MRSPs
(aggregate data)
Aggregate Affordability
Bardasi and Wodon (2008)
Niger Water HH survey 1998 533 Stated use Average price
Groom et al (2008) Beijing, China Water HH income and expenditure survey - Panel 1987 2002
1987-2002 645 HH plus aggregate
data on quintiles
Stated expenditure
Welfare gain/loss
Fankhauser and Tepic (2007)
Transition countries
Water* LSMS Varies Varies Stated expenditure
Affordability, % of HH expenditure
Angel-Urdinola and Wodon (2007)
Cape Verde, Sao Tome, Rwanda
Water Nationally rep HH surveys
Varies 1999-2002
Varies Stated expenditure
Concentration coefficient
Foster and Yepes (2006)
Multi-country Latin America
Water* LSMS Not stated Not stated Stated expenditure
Affordability (% of HH that would spend more than x% if tariffs were raised)
*Study did not clearly state whether it focused only on water service. Service level inferred from text of the study.
** Aggregate refers to data averaged over a geographic area (e.g., service region, metropolitan area, county, etc.).
*** EOE=Errors of exclusion. EOI=Errors of inclusion.

Environment for Development Fuente et al.
30
Table A1 (cont’d). Summary of Studies in the Subsidy Incidence Literature (Adapted from Whittington et al. 2015)
Study Country Service Data Source** Data Year Sample Size Water Use Measure ** Indicator(s) ***
Komives et al. (2006)
Multi-country Water Secondary literature Varies Varies Stated expenditure
EOE; Concentration coefficient
Komives et al. (2005)
Multi-country Water LSMS Varies Varies Stated expenditure
Omega; EOI, EOE; "Material impact"
Foster and Araujo (2004)
Guatemala Water LSMS style national survey (ENCOVI 2000)
2000 7,276 Stated expenditure
EOE, EOI
Foster (2004) Argentina Water Primary HH Survey (2500 HH)
2002 2,500 Previous bill; Stated
expenditure; Imputed using
regression
Cumulative dist; concentration coefficient; EOI; EOE
Gomez-Lobo and Contreras (2003)
Chile and Columbia
Water National HH surveys (Chile - CASEN 1998; Columbia - 1997 NQLS)
1997/98 Chile 48,107; Columbia
4,094
Stated expenditure
Concentration curves; EOI; EOE
Foster et al. (2000) Panama Water LSMS 1997 n.a. Stated expenditure
EOE; EOI
Walker et al. (2000) Central America
Water Household survey Varies 1995-1998
Varies Previous bill EOI; EOE; Average subsidy per HH per mo; subsidy share
*Study did not clearly state whether it focused only on water service. Service level inferred from text of the study.
EOE=Errors of exclusion. EOI=Errors of inclusion.

Environment for Development Fuente et al.
31
Appendix 2. Cost Estimates Used in the Literature
Table A2.1. Summary of Cost Estimates Used in the Literature
Study Location Cost Estimates
(USD/m3) Service Includes Source
Foster and Araujo (2004) Guatemala 0.30 - 0.40 Water Indicates "full cost" Cites "international benchmarks"
Komives et al. (2005) Multi-country See Table A2.2 Water Varies Not stated
Komives et al. (2006) Multi-country See Table A2.2 Water Varies Not stated
Foster and Yepes (2006) Multi-country 0.30 Water O&M Kingdom et. al (2004)
Foster and Yepes (2006) Multi-country 0.90 Water O&M plus capital costs Kingdom et. al (2004)
Groom et al. (2008) China 0.85 Water “Full financial” cost recovery Not stated
Walker et al. (2000) Multi-country 0.09 - 0.27 Water O&M Not stated
Walker et al. (2000) Multi-country 0.17 - 0.47 Water Capital costs including "financing charges plus depreciation"
Not stated
Barde and Lehman (2014) Peru 0.64 Water Not stated Average tariff

Environment for Development Fuente et al.
32
Table A2.2. Cost Estimates from GWI (2004)
Developing country Industrialized countries
<0.20 USD/m3 Tariff insufficient to cover basic O&M costs
Tariff insufficient to cover basic O&M costs
0.20 - 0.40 USD/m3 Tariff sufficient to cover operation and some maintenance costs
Tariff insufficient to cover basic O&M costs
0.40 - 1.00 USD/m3 Tariff sufficient to cover operation, maintenance, and most investment needs
Tariff sufficient to cover basic O&M costs
>1.00 USD/m3 Tariff sufficient to cover operation, maintenance, and most investment needs in the face of extreme supply shortage
Tariff sufficient to cover full cost of modern water systems in most high-income cities
Source: GWI (2004) in Komives et al (2005)