Embed Size (px)
Citation preview

WATER CONSUMPTION
chap 09
European Green Capital Award Nantes 2012 2013
133

The Water Department, which manages the supply of drinking water for the metropolitan area, has been ISO 9001 quality certifi ed since 2001, OHSAS Safety 18001 since 2004 and ISO 14,001 Environment since May 2010.
09 A Current situation.Established in 2001, Nantes Métropole set up a Water Skill and Water Department in order to satisfy the 590,000 users in the 24 cities. Each year, the inhabitants of Nantes Métropole consume 30 million cubic metres of drinking water. This water is distributed by three operators : a public operator, the Community Authority, and two private operators.All the inhabitants of the urban community today paid the same water rate : €2.5626, tax included, per cubic metre (outside of the subscription in 2009).
European Green Capital Award Nantes 2012 2013
134
Water operators for Nantes Metropole.
The operators
WATER PUBLICAUTHORITY
SAUR
VEOLIA WATER

European Green Capital Award Nantes 2012 2013
135
Water consumption
1990 - unknown
2000 - 59,256 litres/inhabitant/year (21,702,027 m3 for an est. 366,242 inhabitants)
2009 - 50,323 litres/inhabitant/year (29,564,341 m3 for an est. 587,489 inhabitants)
Population density
Population growth rates from 1968 to 2010
1968-75 1975-82 1982-90 1900-99 1999-2006
0
3 %
6 %
9 %
12 %
1968 1975 1982 1999 2006
0
300
600
900
1200
19000
With respect to water supply, the fl ow withdrawn in the area is of the order of 1.53 m3/second. The water is with-drawn from the Loire River, which has an average fl ow of 500 m3/second (minimum : 120/m3/second; maximum : 3000/m3/second). The fl ow withdrawn is therefore only 0.3% of the average fl ow of the Loire. As such, it is even more negligible as the volume of raw water pumped at Mauves is returned 20 km upstream at Saint-Herblain.
The watershed of the Loire and its tributaries covers some 110,000 km2. The Loire River, the longest in France, stretches 1010 km. The resource is therefore abundant and does not depend on a specifi c region.
The supply of drinking water is one of the three aspects of Nantes Métropole's water policy, developed and implemented within the context of the NEPTUNE Programme.
Water consumption per inhabitant (excluding industrial and agricultural water loss) :
In 1999 - 59 m3/inhabitant/year. 21,453,358 m3/362,631 inhabitants
In 2004 - 59.4 m3/inhabitant/year. 32,915,549 m3/554,466 inhabitants.
In 2008 - 50.8 m3/inhabitant/year. 30,239,896 m3/595,000 inhabitants.
m3/inhab/year
year
20041999 200846
48
50
52
54
56
58
60
62
year
year
inhab/km²

European Green Capital Award Nantes 2012 2013
136
Annual rainfall
1990 - 656 mm/year
2000 - 990 mm/year
2008 - 889 mm/year
Annual consumption of water compared to total rainfall
2008 - 34 015 631 m3/year (30 239 896 m3/0,889 m)
Water resource depletion rate (surface and subsurface water)
Not applicable
Percentage of water lost to leaks in the city’s water supply network
15,6%
Percentage of processed drinking water supply (different water sources)
100 %
Water use today
Home
Large consumers
Local government offi ces and agencies78 %
12 %
10 %

European Green Capital Award Nantes 2012 2013
137
Furthermore, the Water Department has implemented a policy of metering transported water, equipping all operators in the urban space with mobile or fi xed meters : enterprises acting on behalf of Nantes Métropole, construction projects, internal street-cleaning services and watering services.
Consumption per inhabitant category.The increase in population during the last 10 years has been twice the national average.We are today at the same level of consumption as during the 1970s, in spite of population increase (+ 30% between 1968 and 2009).
Individual water meters in apartment buildings
Number of meters (under SRU law)
year0
5000
10000
15000
20000
25000
30000
35000
2003 2004 2005 2006 2007 2008 2009
production per inhabitant, m3
Linear (production per inhabitant, m3)
Proportion of infrastructures subject to metering
At the present time, almost all of the water distributed is metered.
Houses have been systematically equipped with individual meters and implementation of the SRU Act has made it possible progressively to increase the percentage of individual meters in apartments. This policy is intended to make each individual consumer responsible for consumption of drinking water. Out of 35,000 residences, 83% were provided with individual meters in 2009.
Water production per inhabitant from 1970 to 2009
0
20
40
60
80
100production/inhab./m3
year
1970 1972 1974 1976 1978 1980 1982 1984 19861 9881 9901 992 1994 1996 1998 20002 2004 2006

Between 2004 and 2008, daily average household consumption dropped from 139 to 122 l/day/inhabitant, a value that falls within the low range of the national average, between 120 and 150 l/day/inhabitant.
Certainly, the virtuous behaviour of users has improved and the water policy applied in recent years is one of the factors that explain these good results.
The 2009 Annual Report shows that consumption has dropped for all user categories. From 2003 to 2009, water savings amounted to more than 3 million m3.
European Green Capital Award Nantes 2012 2013
138
Water consumption breakdown by user category in Nantes Métropole
Household
Others
0
5 000 000
10 000 000
15 000 000
20 000 000
25 000 000
30 000 000
35 000 000
2003 2004 2005 2006 2007 2008 2009
m3
year
Water for daily life.
For the domestic category, improvements in appliances and water savers is undoubtedly one of the rea-sons for decreased consumption. Nantes Métropole has accompanied the movement with awareness-raising measures in favour of water saving ("How to use water", instructions accompanying water bills, "Ecobox" water information, overconsumption notices).
The SRU Act has been applied since 2003 in order to make rental users more responsible. The recent and progressive application of the Act does not, however, yet make it possible easily to assess its impact.
Nevertheless, the reduction is more marked in the non-domestic category.
Nantes Métropole's policy of billing enterprises at the real rate, and not at a sliding rate as a function of volume (as previously agreed) partially explains this reduction.
The systematic metering in place since 2001 and the meter-subscription regulation for all users has been a strong incentive for administrations and local-authorities to implement actions to manage water consumption (actions on the internal network).
Furthermore, the rates are determined within the context of a long-term technical and fi nancial estimate, initiated in 2001 with the creation of the urban community to ensure rate harmonisation. This estimate makes it possible to make the necessary investments in metropolitan area development, to maintain the heritage and to achieve the objectives of the local authority in terms of environmental protection and sus-tainable development by managing price development.
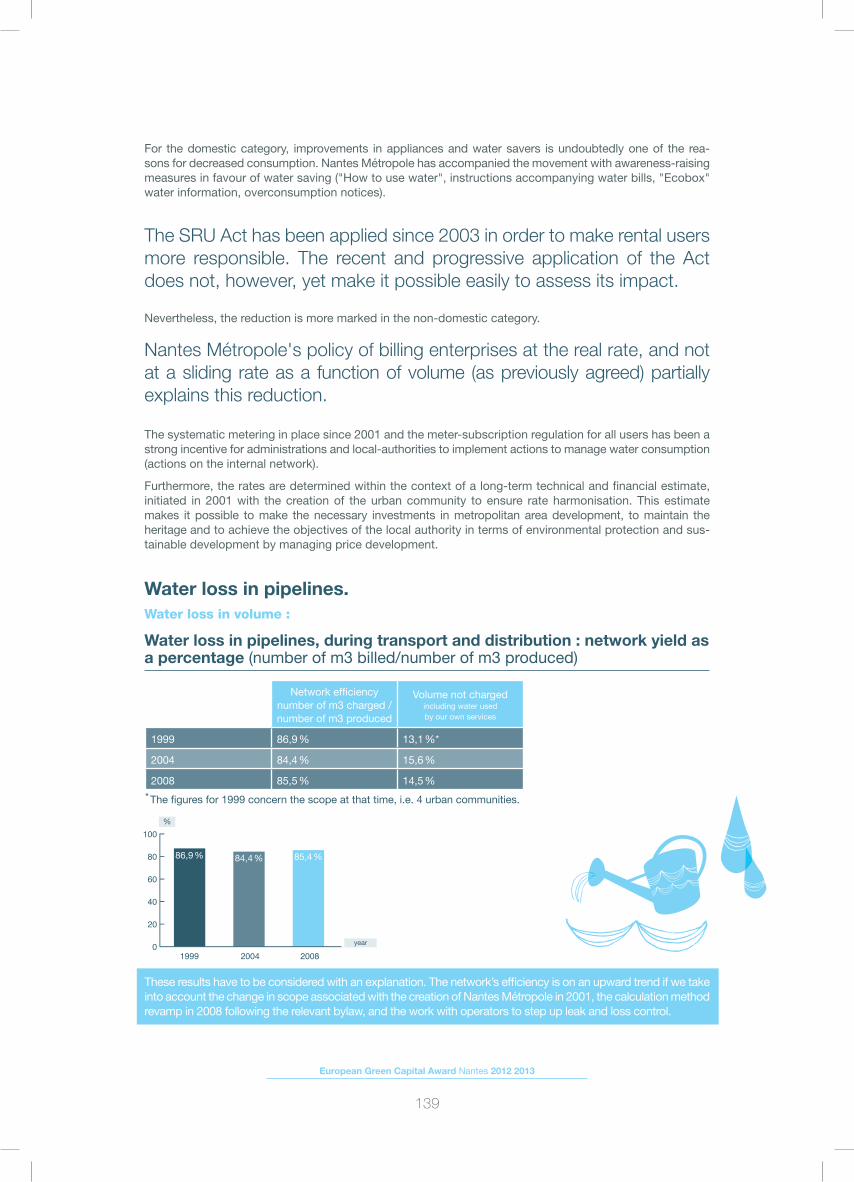
Water loss in pipelines.Water loss in volume :
European Green Capital Award Nantes 2012 2013
139
These results have to be considered with an explanation. The network’s effi ciency is on an upward trend if we take into account the change in scope associated with the creation of Nantes Métropole in 2001, the calculation method revamp in 2008 following the relevant bylaw, and the work with operators to step up leak and loss control.
Water loss in pipelines, during transport and distribution : network yield as a percentage (number of m3 billed/number of m3 produced)
Network effi ciency number of m3 charged / number of m3 produced
Volume not chargedincluding water used by our own services
1999 86,9 % 13,1 %*
2004 84,4 % 15,6 %
2008 85,5 % 14,5 %
* The fi gures for 1999 concern the scope at that time, i.e. 4 urban communities.
year0
20
40
60
80
100
1999
86,9 %
2004
84,4 %
2008
85,4 %
%
The Water Department has encouraged operators to achieve performance objectives, particularly with respect to network yield and to linear loss index, by means of fi nancial incentives connected with these indices.
Water meters installed in 2009.
There were 189,132 meters installed in the territory as a whole in 2009. They break down as follows : 55,491 are from Veolia (29%), 13,903 from Saur (7%) and 119,738 (63%) from the water authority (the fi gure for the latter is number of subscriptions). These meters are 7 years old on average.
Complying with the European Framework Water Directive.
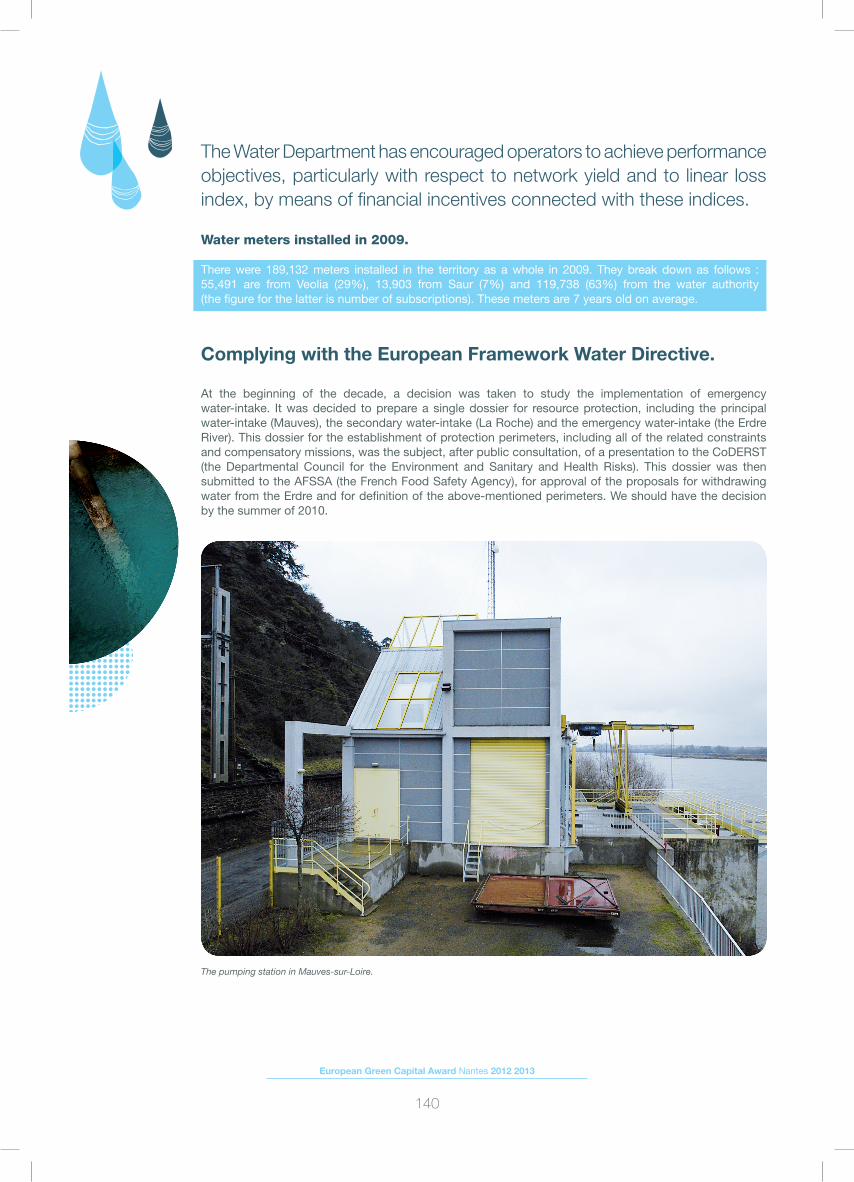
At the beginning of the decade, a decision was taken to study the implementation of emergency water-intake. It was decided to prepare a single dossier for resource protection, including the principal water-intake (Mauves), the secondary water-intake (La Roche) and the emergency water-intake (the Erdre River). This dossier for the establishment of protection perimeters, including all of the related constraints and compensatory missions, was the subject, after public consultation, of a presentation to the CoDERST (the Departmental Council for the Environment and Sanitary and Health Risks). This dossier was then submitted to the AFSSA (the French Food Safety Agency), for approval of the proposals for withdrawing water from the Erdre and for defi nition of the above-mentioned perimeters. We should have the decision by the summer of 2010.
European Green Capital Award Nantes 2012 2013
140
The pumping station in Mauves-sur-Loire.

The De La Roche drinking water production plant.
Figures refl ecting Drinking Water Directive standard achievement
60% to build protection systems around water intakes (the case is under review at AFSSA, the French agency in charge of food safety).
Indicator of conformity with the European Framework Directive on water (as percentage protection of the resource)
In 1999 - 0%
In 2004 - 10% (fi rst studies for resource protection)
In 2008 - 50% (prefectural decisions in the process of being obtained)
In 2009 - the Water Directorate increases to 60%
year
%
010
20041999 2008 20090
20
40
60
80
100
5060
European Green Capital Award Nantes 2012 2013
141

09 B Actions carried out during the last fi ve to 10 years.Since 2001, Nantes Métropole has implemented multi-year investment plans (2001-2008 and 2009-2014).
Nantes Métropole has ensured the continuity of the service with dynamic management of the network and its equipments in complete security, particularly at the level of the quantity produced and distributed and the quality of the water.
As an example, from 2001 to 2008 : €13 million to service production and storage facilities€28 million to refurbish the network €5.8 million to purchase meters
Efforts to protect the quality of water in the network from 2000 to 2008 included eliminating more than 25,000 lead connections, for a total of €28 million
The metropolitan Master Plan in the process of being completed is intended to optimise network structure. For example : the abandonment of a certain number of network branches, considered as useless and the source of potential leaks.
During this period, Nantes Métropole has applied a single rate for the water/water-treatment bill. This has resulted in, among other things, removal of sliding rates, particularly for industry and local authorities. This in turn has made it possible for the latter to participate in general saving of drinking water by lowering their consumption levels.
European Green Capital Award Nantes 2012 2013
142
High-quality water at the same price for every city in Municipality of Nantes.

During this same period, all operators have been encouraged to improve the detection of leaks in their activity sectors. These methods include sectorisation for detecting leaks at night, systematic monitoring of the entire network (one third per year), and correlation. This enables operators to improve the leak ratio.
At the same time, diagnostics were carried out of water-tightness in reservoirs and has led to a multi-year investment plan. Two reservoirs have already been reconditioned, totalling 24,000 m3 (13% of stored volume) and reconditioning is planned for three further reservoirs, for a total of 4500m3, (3% of stored volume).
As already mentioned, the SRU Act has made it possible to limit individual water consumption in public buildings and to raise the awareness of the population to reasonable consumption. Similarly, most of the equipment metering the purchase and sale of wholesale water has been equipped with remote reading, which contributes to better remote management, in real time, of the exchanges. An abnormal fl ow would immediately be detected.
Regulatory renewal of meters also contributes to this overall saving (better awareness of fl ow transferred).
The efforts made in order to reduce water consumption have to do with raising the awareness of the population. In order to do so, several actions have been carried out. Various documents have been made available to users, particularly (cf. Annexes) a document entitled "How to Use Water" has been sent to subscribers with the bill twice a year, an awareness-raising campaign for users about water consumption ("Ecobox") has been carried out, notices of overconsumption of water have been sent to users, and Nantes Métropole has created and put on-line an interactive booklet about water.
A decision taken by the Prefect on 20 August 2009 concerns restrictions on water withdrawal in the Department. It recommends economic use of the water resource. (see the Decision, annexed). Press releases are also distributed in order to inform the population.
In addition, previous years' consumption is indicated on the water bill so that users have a better overview. This action is also part of the Cit’ergie label, promoted by the City of Nantes in relationship to the actions carried out in terms of water saving.
APPENDIX
The booklet containing a water trivia gamehttp://www.cmaintenant.eu/fi les/fi le/l_eau_en_question.pdf
The Prefecture bylaw temporarily banning or limiting water intake in the Loire-Atlantique departmenthttp://www.cmaintenant.eu/fi les/fi le/arrete_prefectoral_etiage_2009.pdf
A press release on waterway management during low waterhttp://www.cmaintenant.eu/fi les/fi le/communique_presse_etiage_aout09.pdf
The charter on water as a public service, Municipality of Nantes’s 12 pledgeshttp://www.cmaintenant.eu/fi les/fi le/charte_service_eau_potable.pdf
The regulations governing drinking water distribution in the territory of Municipality of Nanteshttp://www.cmaintenant.eu/fi les/fi le/reglement_du_service_de_distribution_d_eau_potable.pdf
The 2008 annual report on the price and quality of the water distribution public service waterhttp://www.cmaintenant.eu/fi les/fi le/rapport_annuel_2008_prix_qualite_eau_potable.pdf
Dressing up your meter for winterhttp://www.cmaintenant.eu/fi les/fi le/habillez_votre_compteur_hiver.pdf
Managing your consumption of waterhttp://www.cmaintenant.eu/fi les/fi le/maitriser_sa_conso_eau.pdf
The certifi cate from the Water Department in Municipality of Nanteshttp://www.cmaintenant.eu/fi les/fi le/certifi cat_QSE_Direction_Eau.pdf
Everything you wanted to know about the quality of water in Basse-Goulaine, Mauves-sur-Loire and Vertouhttp://www.cmaintenant.eu/fi les/fi le/qualite_eau_basse_goulaine.pdf
Everything you wanted to know about the quality of water in Bouaye, Le Pellerin, Saint-Jean-de-Boiseau, Saint-Léger-les-Vignes, Saint Aignan de Grand Lieu and Brainshttp://www.cmaintenant.eu/fi les/fi le/qualite_eau_bouaye.pdf
Everything you wanted to know about the quality of water in Bourguenais, La Montagne, Les Sorinières and Rezéhttp://www.cmaintenant.eu/fi les/fi le/qualite_eau_bouguenais.pdf
Everything you wanted to know about the quality of water in Carquefou, Nantes, Orvault, Sainte-Luce-sur-Loire, Saint-Herblain, Saint-Sébastien-sur-Loire and Thouaré-sur-Loirehttp://www.cmaintenant.eu/fi les/fi le/qualite_eau_carquefou.pdf
Everything you wanted to know about the quality of water in Couëron, Indre and Sautronhttp://www.cmaintenant.eu/fi les/fi le/qualite_eau_coueron.pdf
Everything you wanted to know about the quality of water in La-Chapelle-sur-Erdrehttp://www.cmaintenant.eu/fi les/fi le/qualite_eau_chapelle_erdre.pdf
European Green Capital Award Nantes 2012 2013
143

European Green Capital Award Nantes 2012 2013
144
Water preservation measures.
On a daily basis, the quality of water produced in plants is monitored continuously by sensors, which makes it possible for teams in central locations to check the water in real time. Management of water renewal du-ring storms is ensured by minimum threshold levels in reservoirs, while guaranteeing suffi cient autonomy for network security (approximately 1 day of consumption).
With respect to water distribution, monitoring sensors ensure an accep-table level of residual chlorine in the network.
Furthermore, with respect to intervention in the network, teams have equipment and information enabling them to verify turbidity and chlorine concentration before the water is returned, in order to guarantee the continuity of water quality throughout the network.
Finally, non-return valves have been systematically installed on all meters, at the responsibility of Nantes Métropole.
Operation is analysed by looking for a weak points in the network. This work is done primarily in areas where the water circulates slowly, with signifi cant holding time, which could result in deterioration of water quality. These studies make it possible for the network to operate optimally in order to improve water quality.
The Water Department monitors water usage in order better to manage the risks of water return, particularly by means of studies of consumers at risk.
Steps taken by the City of Nantes concerning buildings.
Water consumption in Nantes City municipal buildings dropped 26% from 152,444 m3 per year in 2001 to 96,941 m3 per year in 2007. In 1999, those buildings consumed an average of 769 litres/sqm/year in 2004 and 479 litres/sqm/year in 2008.
City authorities have also substantially cut water consumption in green spaces. From 2000 to 2004, consumption grew from 359,000 to 397,000 m3 of water a year. In 2007, the fi gure had dropped to 211,000 m3, i.e. 41% less than in 2004 whereas, at the same time, green spaces grew 12% from 940 ha in 1999 to 1050 ha in 2009.

European Green Capital Award Nantes 2012 2013
145
The management process has two goals in the near future.- The fi rst is to integrate follow-up of all actions in overall management of activities and services, by making
players responsible at appropriate levels. This overall management system is being set in place and will be operative in 2011, with certifi cation underway. This implementation meets the objective of "ensuring the effectiveness of the public service at a controlled water price", starting with knowledge and management of activities at the level of the environment, as well as with quality, security and cost analysis.Working groups are preparing the description of this new system that will integrate all of these components.
- Secondly, the Water Department intends to consolidate its management process and have all of its activities certifi ed.This new fi eld will concern the organisation of the public water service with commissioning services, plant and network management, plant and network operations and contracting, fi nancial planning and estimating, with the management services, a consumption observatory, and awareness-raising about the public water service. This overall management system is being set in place and will be operative at the beginning of 2011.Certifi cation of this new model is planned for mid-2011.Finally, the Water Department has undertaken to carry out a carbon assessment 2010-2012 for all operators working in the territory.
In addition, private operators have as a future project a commitment to deploy HACCP, ISO 22000, as of 2010 (quality monitoring of interventions and health quality of water) for Véolia and a commitment to carry out carbon assessments, particularly at the Basse-Goulaine plant with respect to Municipality of Nantes, for SAUR.
The Water Directorate is already quality/security/environment certifi ed (ISO 9001, OHSAS 18001 and ISO 14001) for its public operator, the Authority, and for one of its two private operators, La Saur (the second private operator, Véolia, is in the process of QSE certifi cation with ISO 9001).
09 C Measures scheduled for the short and long term.
QSE certifi cate.

European Green Capital Award Nantes 2012 2013
146
With respect to improvement of water-quality management : Emergency water-intake from the Erdre was carried out in 2010. This withdrawal was part of the Neptune III Plan, one of the objectives of which was to guarantee the continuity of water supply to the Nantes metropolitan area.
The River Erdre.

European Green Capital Award Nantes 2012 2013
147
Future investments.
Major maintenance and water-distribution equipment, as well as metering equipment, represent a total investment of €7 million over six years (2009-2014).As an incentive to reduce consumption, particular attention is drawn to the sending out of use instructions to all users, with a budget of €240,000 for the 2009-2014 period.
A multi-year investment plan for 2009-2014 is in place, representing €67 million, of which €9 million for maintenance of heritage production (plants and reservoirs) and €58 million for maintenance and renewal of the water-distribution network.
In addition, this same multi-year investment plan takes into consideration the fi nancing of total restructuring of the production plant, for an amount approaching €60 million between 2013 and 2018, all of which will be fi nanced through water bills, which remain under control.
Preparation to face the future impact of change.
The impact of climate change is integrated into the concept of the new plant (budget of €60 million for the 2013-2018 period), by integrating, for example, the fl ood danger in connection with its geographic location near the Loire, its size (to match the water needs of populations), its design phase (materials used) and in the economic and energy-related approach, such as by adapting the pumps.
With respect to the network, climate change is taken into consideration in the habits of users, by implemen-ting a communal Master Plan and by adapting the size of the network as needed.
The projects to carry out carbon assessments of operators will make it possible to take into consideration actions in favour of the climate (energy expense, work on transport, etc).
The Loire is considered as the unique drinking water ressource. Nantes Métropole participates actively in the setting up of an inter-metropolitan area network to ensure that the population has a secure resource, as a cargot of solidarity.
European Green Capital Award Nantes 2012 2013
148
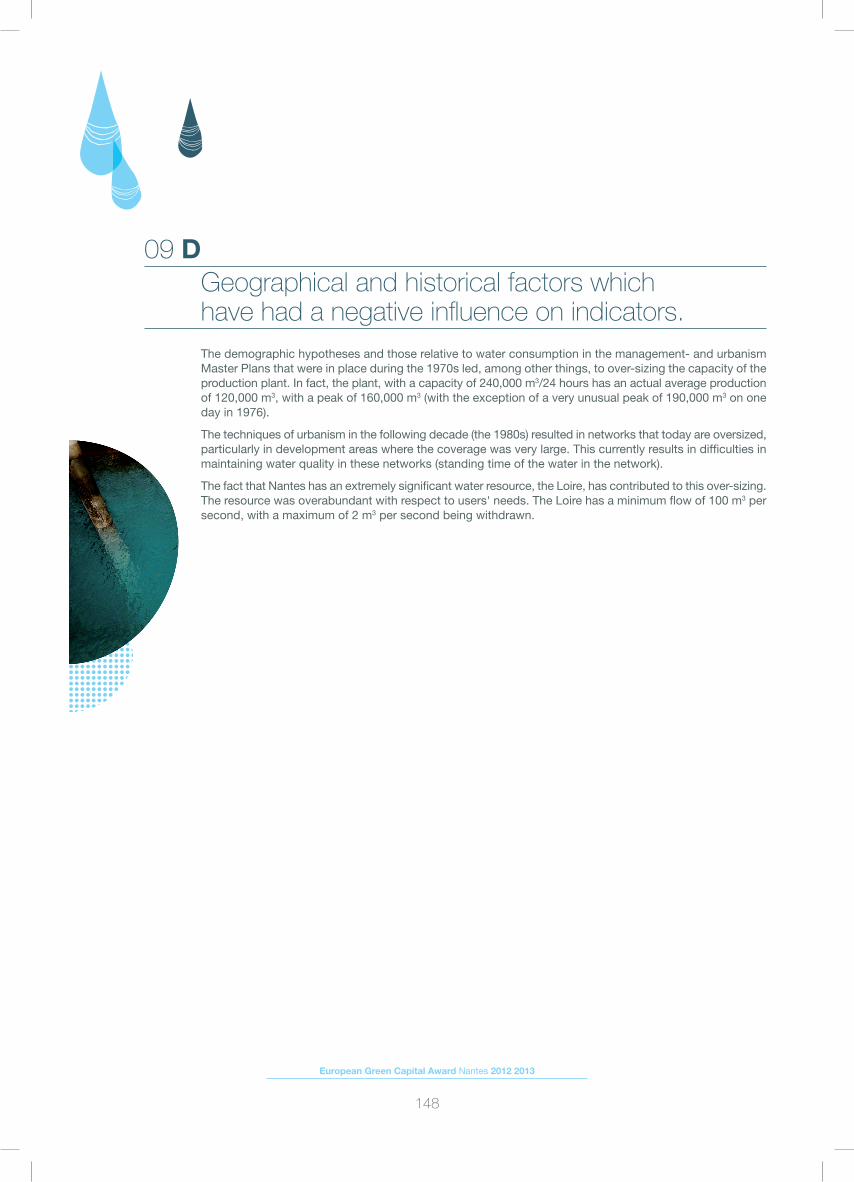
09 D Geographical and historical factors which have had a negative infl uence on indicators. The demographic hypotheses and those relative to water consumption in the management- and urbanism Master Plans that were in place during the 1970s led, among other things, to over-sizing the capacity of the production plant. In fact, the plant, with a capacity of 240,000 m3/24 hours has an actual average production of 120,000 m3, with a peak of 160,000 m3 (with the exception of a very unusual peak of 190,000 m3 on one day in 1976).
The techniques of urbanism in the following decade (the 1980s) resulted in networks that today are oversized, particularly in development areas where the coverage was very large. This currently results in diffi culties in maintaining water quality in these networks (standing time of the water in the network).
The fact that Nantes has an extremely signifi cant water resource, the Loire, has contributed to this over-sizing. The resource was overabundant with respect to users' needs. The Loire has a minimum fl ow of 100 m3 per second, with a maximum of 2 m3 per second being withdrawn.