Embed Size (px)
DESCRIPTION
Water Content Measurement Methods and Field Applications. Doug Cobos Ph.D. Decagon Devices and Washington State University. Background. About the presenter Ph.D. in Soil Physics, 2003, University of Minnesota Director of Research and Development, Decagon Devices, Inc. - PowerPoint PPT Presentation
Citation preview
Water Content Measurement Methods and Field Applications
Doug Cobos Ph.D.Decagon Devices and Washington
State University
Background About the presenter
Ph.D. in Soil Physics, 2003, University of Minnesota
Director of Research and Development, Decagon Devices, Inc.
Adjunct Faculty in Environmental Biophysics, Washington State University
Lead Engineer on TECP instrument for NASA 2008 Phoenix Mars Lander
2
Outline Direct vs. Indirect measurements Water content: Gravimetric vs. Volumetric Water content measurement techniques
Neutron probe Dual-needle heat pulse Gravimetric sampling Dielectric sensors
Time Domain Frequency Domain
Sensor installation methods Field applications/examples
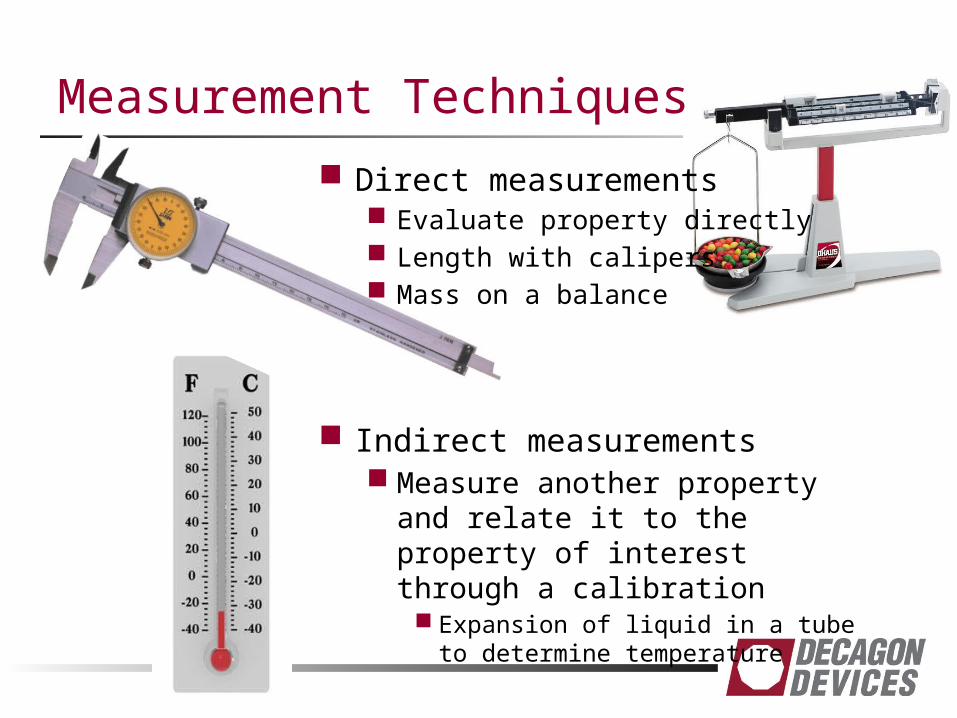
Measurement Techniques
Direct measurements Evaluate property directly Length with calipers Mass on a balance
Indirect measurements Measure another property and
relate it to the property of interest through a calibration Expansion of liquid in a tube to
determine temperature
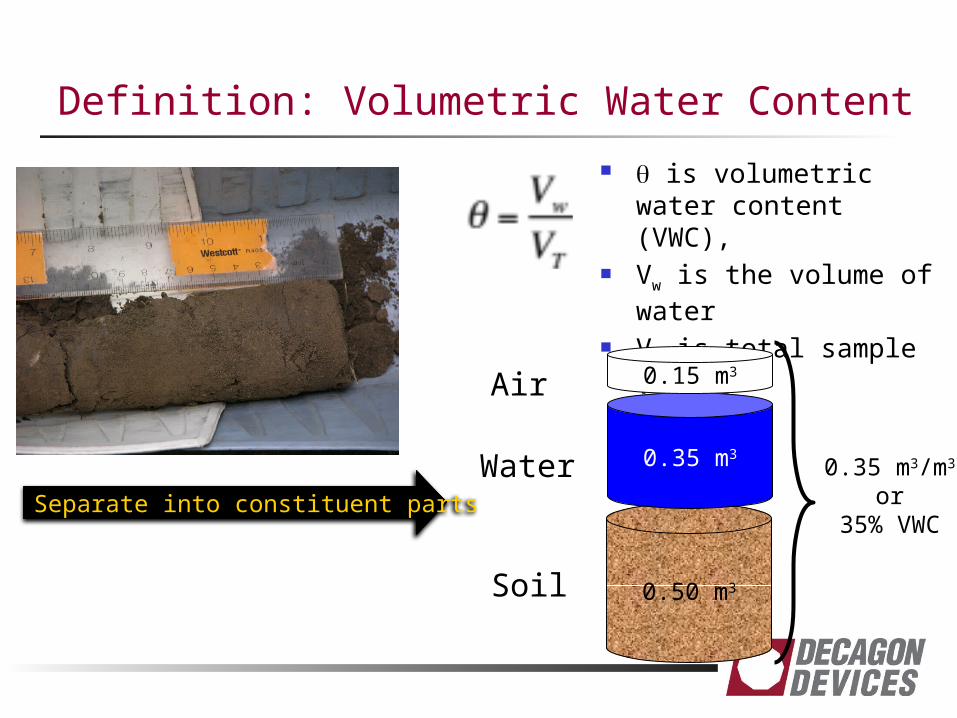
Definition: Volumetric Water Content
Separate into constituent parts
q is volumetric water content (VWC),
Vw is the volume of water
VT is total sample volume
0.50 m3
0.35 m3
0.15 m3Air
Water
Soil
0.35 m3/m3
or35% VWC
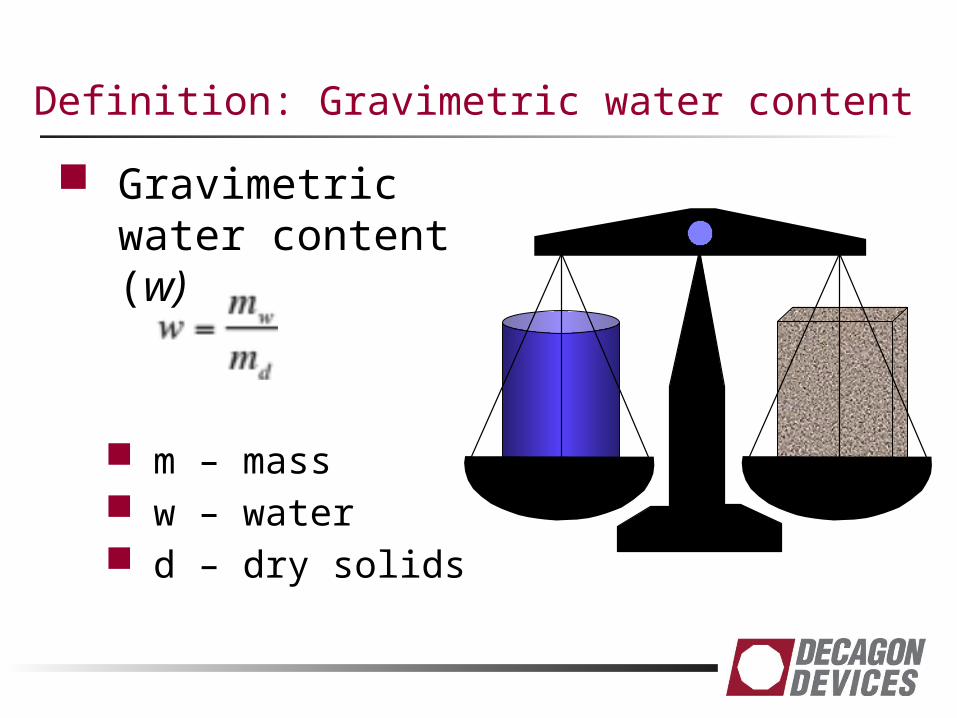
Definition: Gravimetric water content
Gravimetric water content (w)
m – mass w – water d – dry solids
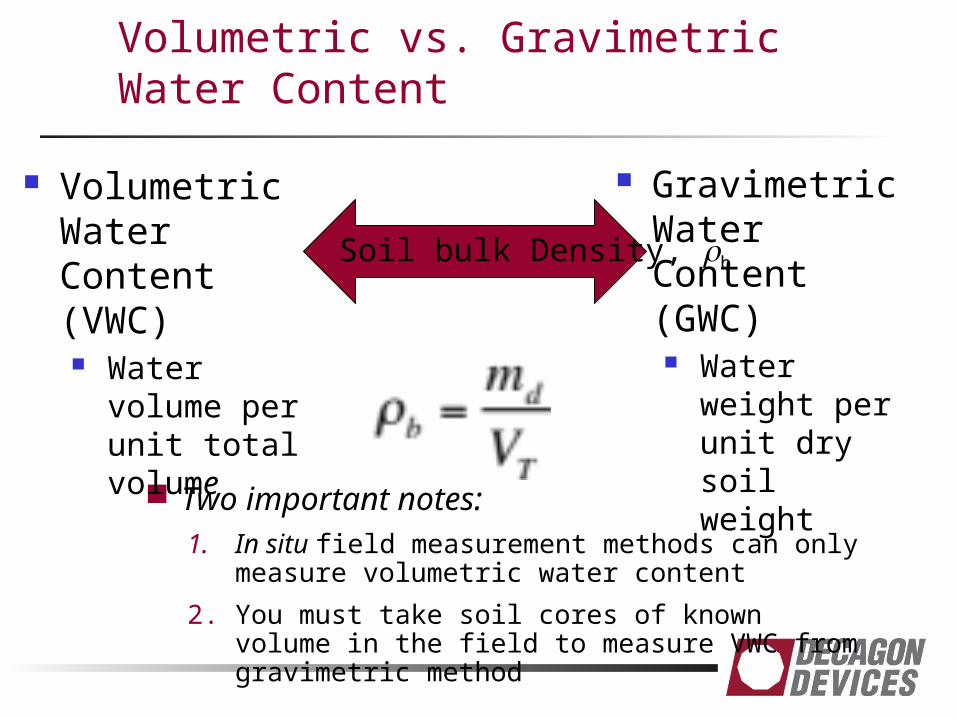
Volumetric vs. Gravimetric Water Content
Two important notes:1. In situ field measurement methods can only
measure volumetric water content
2. You must take soil cores of known volume in the field to measure VWC from gravimetric method
Volumetric Water Content (VWC) Water
volume per unit total volume
Gravimetric Water Content (GWC) Water
weight per unit dry soil weight
Soil bulk Density, rb
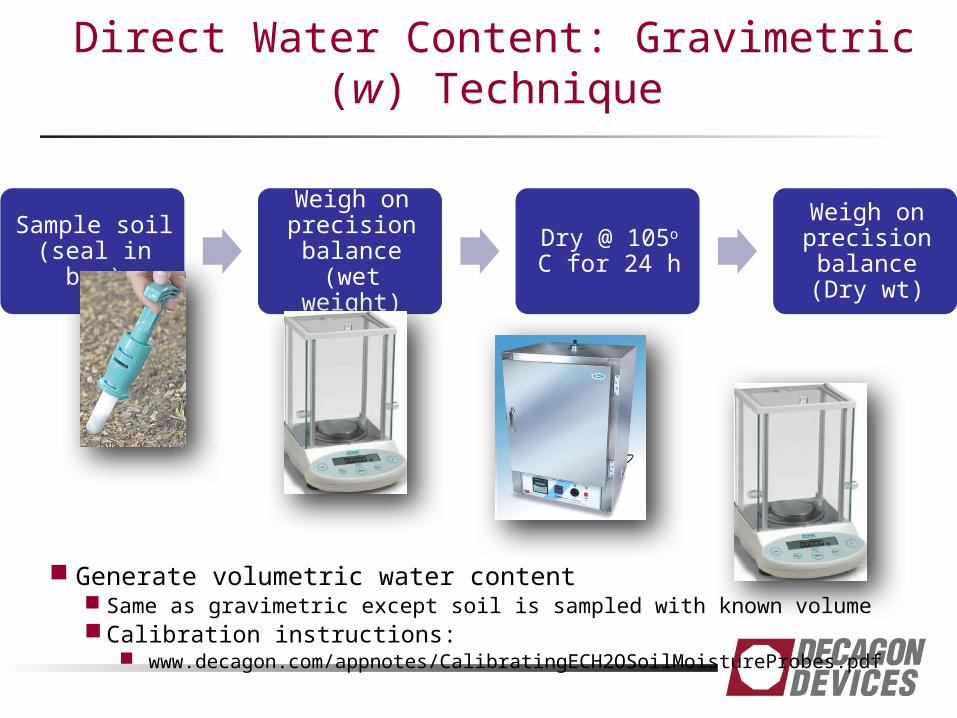
Sample soil (seal in bag)
Weigh on precision
balance (wet weight)
Dry @ 105o C for 24 h
Weigh on precision
balance (Dry wt)
Direct Water Content: Gravimetric (w) Technique
Generate volumetric water content Same as gravimetric except soil is sampled with known volume Calibration instructions:
www.decagon.com/appnotes/CalibratingECH2OSoilMoistureProbes.pdf
Direct Water Content Measurements
AdvantagesSimple Direct measurementCan be inexpensive
DisadvantagesDestructive
does not account for temporal variabilityTime consumingRequires precision balance & oven
Instruments for Measuring in situ Water Content (indirect)
Neutron thermalizationNeutron probes
Dual needle heat pulse probeDielectric measurement
Capacitance/Frequency Domain Reflectometery (FDR)
Time Domain Reflectometry (TDR)
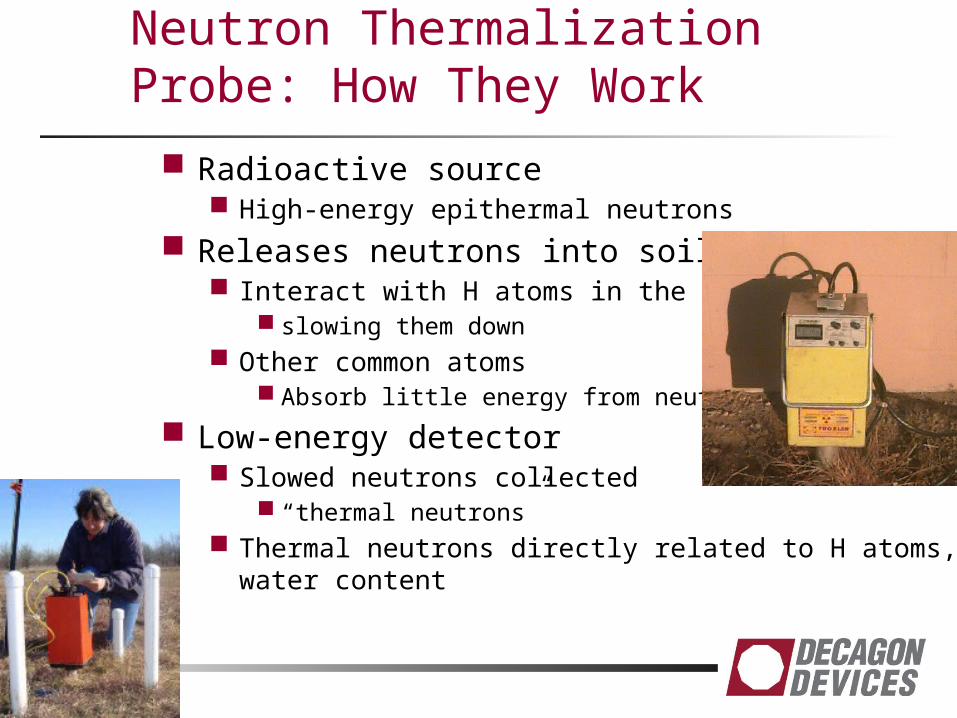
Neutron Thermalization Probe: How They Work
Radioactive source High-energy epithermal neutrons
Releases neutrons into soil Interact with H atoms in the soil
slowing them down Other common atoms
Absorb little energy from neutrons
Low-energy detector Slowed neutrons collected
“thermal neutrons” Thermal neutrons directly related to H atoms, water
content
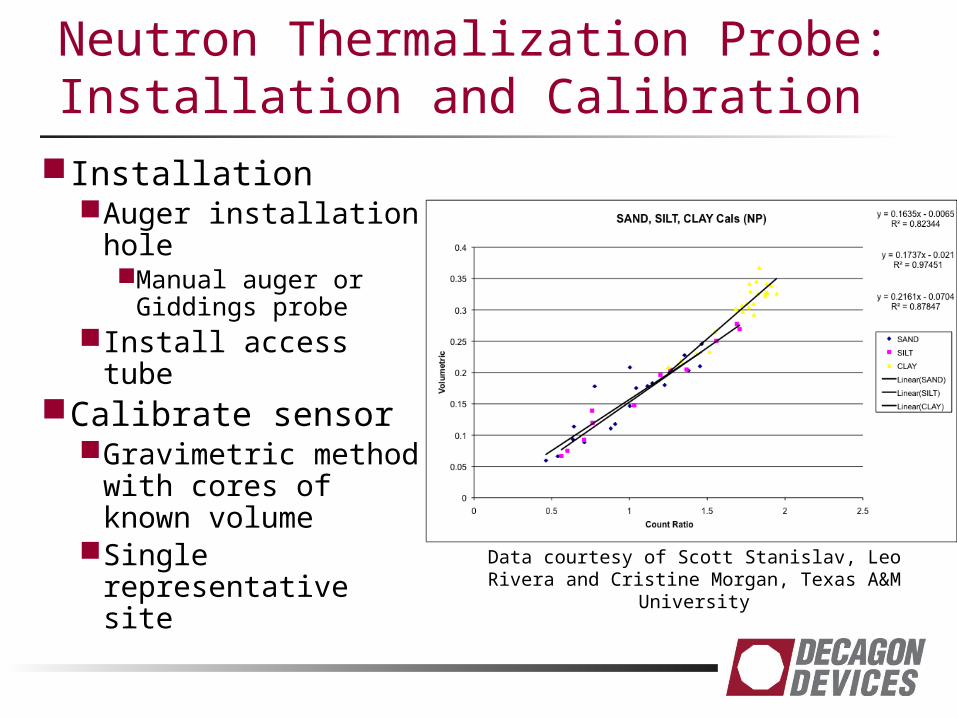
Neutron Thermalization Probe: Installation and Calibration
InstallationAuger installation
holeManual auger or
Giddings probe Install access tube
Calibrate sensorGravimetric
method with cores of known volume
Single representative site
Data courtesy of Scott Stanislav, Leo Rivera and Cristine Morgan, Texas A&M University

Neutron Probe Measurements Measurements
Uncap hole Lower probe to specific depth Take reading at each depth
14 s to 2 min per reading Longer read times give better
accuracy
Neutron Thermalization Probe
Advantages Large measurement
volume 10 to 20 cm radius,
depending on water content
Gets away from issues with spatial variability
Single instrument can measure multiple sites
Insensitive to salinity, temperature
DisadvantagesNo continuous
recordRequires radiation
certification to useExpensiveHeavy
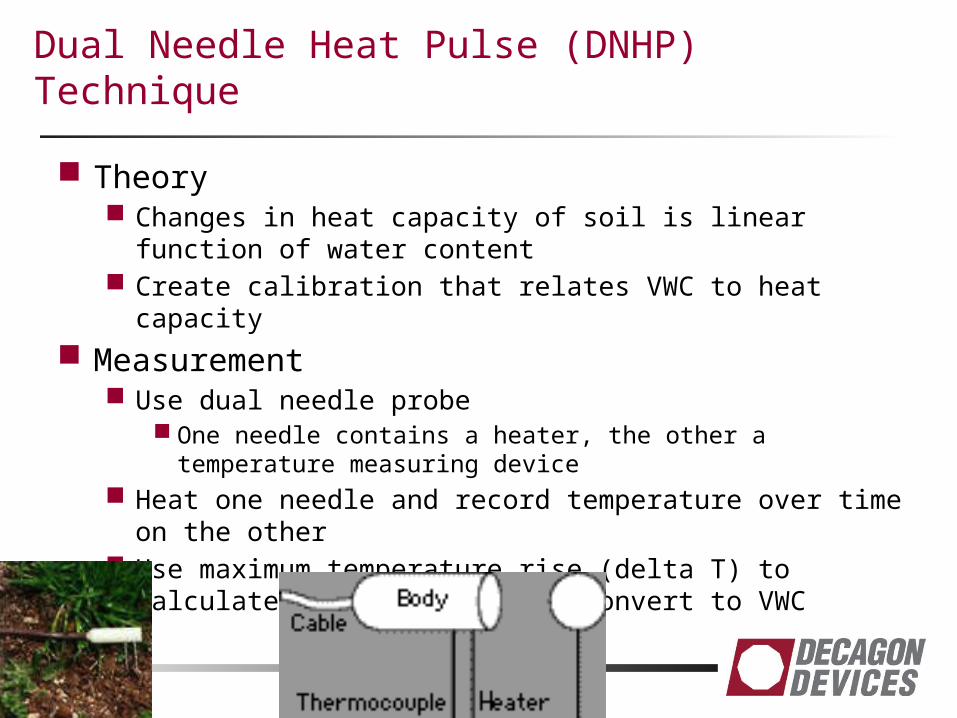
Dual Needle Heat Pulse (DNHP) Technique
Theory Changes in heat capacity of soil is linear function of water
content Create calibration that relates VWC to heat capacity
Measurement Use dual needle probe
One needle contains a heater, the other a temperature measuring device
Heat one needle and record temperature over time on the other
Use maximum temperature rise (delta T) to calculate heat capacity and convert to VWC
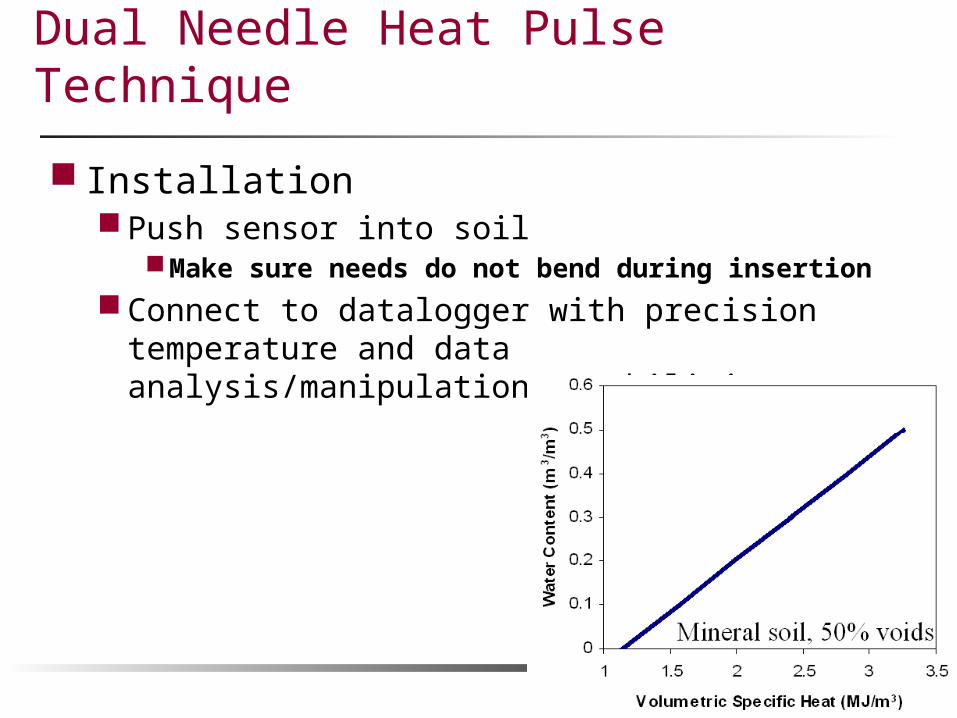
Dual Needle Heat Pulse Technique
InstallationPush sensor into soil
Make sure needs do not bend during insertionConnect to datalogger with precision
temperature and data analysis/manipulation capabilities

Dual Needle Heat Pulse Technique
AdvantagesSmall
measurement volumeMost location-
specific method available
Can measure water content around growing seed
DisadvantagesRequires datalogger
with precise temperature measurement and analysis
Can be susceptible to temperature gradients in soiltimedepth
Integrates small soil volume
FragileYoung et at. (2008) Correcting Dual-Probe Heat-Pulse Readings for Changes in Ambient Temperature, Vadose Zone Journal 7:22-30
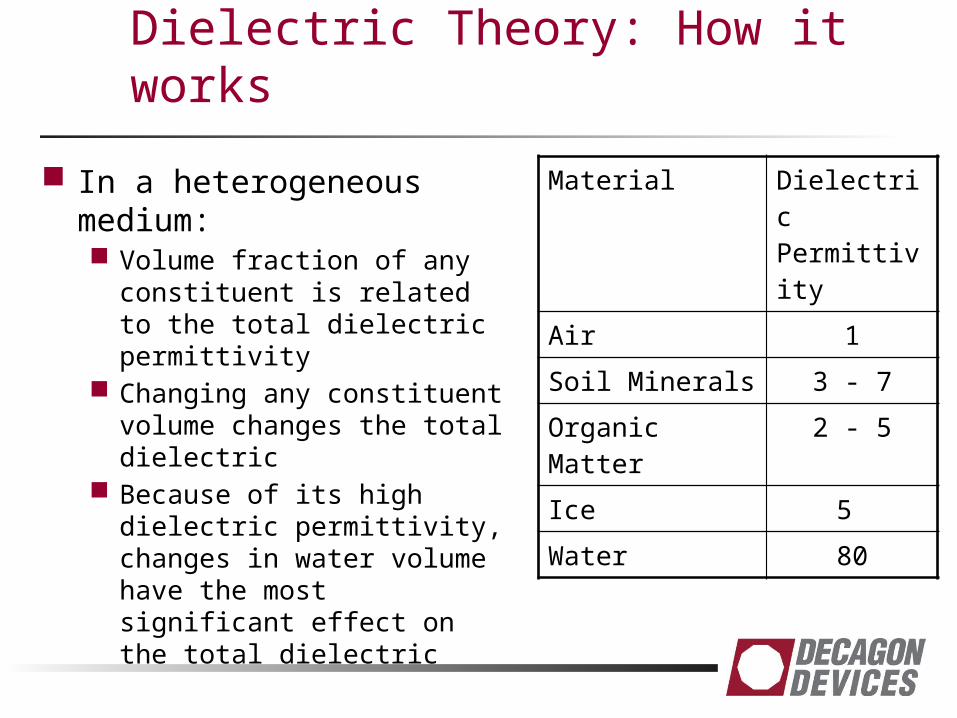
Dielectric Theory: How it works
In a heterogeneous medium: Volume fraction of any
constituent is related to the total dielectric permittivity
Changing any constituent volume changes the total dielectric
Because of its high dielectric permittivity, changes in water volume have the most significant effect on the total dielectric
Material Dielectric Permittivity
Air 1
Soil Minerals 3 - 7
Organic Matter 2 - 5
Ice 5
Water 80

Dielectric Mixing Model: FYIThe total dielectric of soil is made up
of the dielectric of each individual constituentThe volume fractions, Vx, are weighting
factors that add to unity
Where e is dielectric permittivity, b is a constant around 0.5, and subscripts t, m, a, om, i, and w represent total, mineral soil, air, organic matter, ice, and water.
ibiom
bom
bwa
bam
bm
b VVVVt
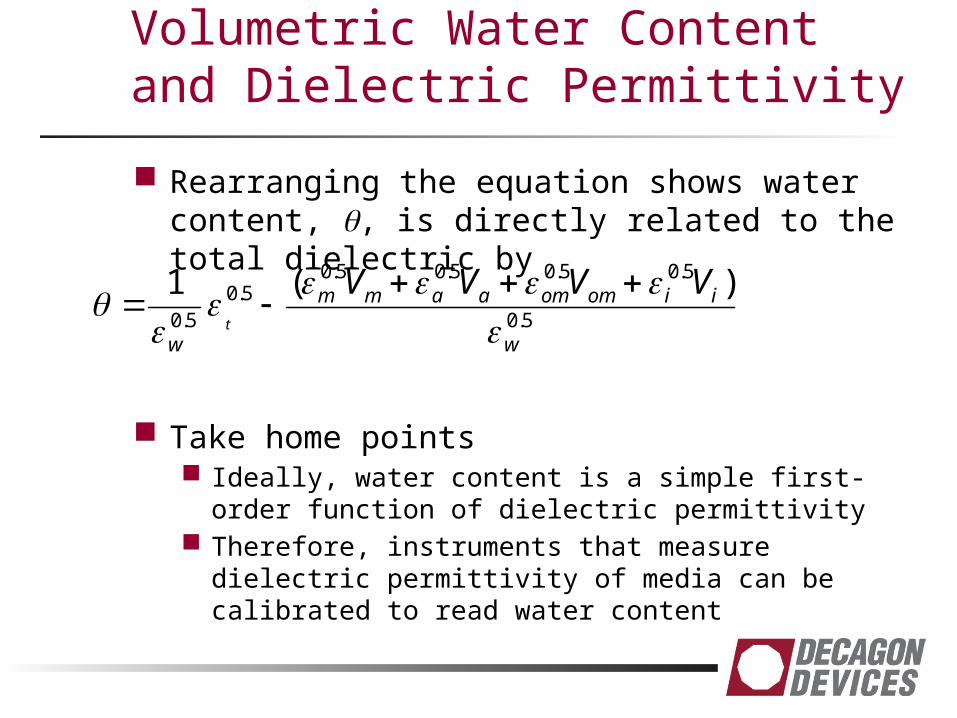
Volumetric Water Content and Dielectric Permittivity
Rearranging the equation shows water content, q, is directly related to the total dielectric by
Take home points Ideally, water content is a simple first-order function
of dielectric permittivity Therefore, instruments that measure dielectric
permittivity of media can be calibrated to read water content
5.0
5.05.05.05.05.0
5.0
)(1
w
iiomomaamm
w
VVVVt
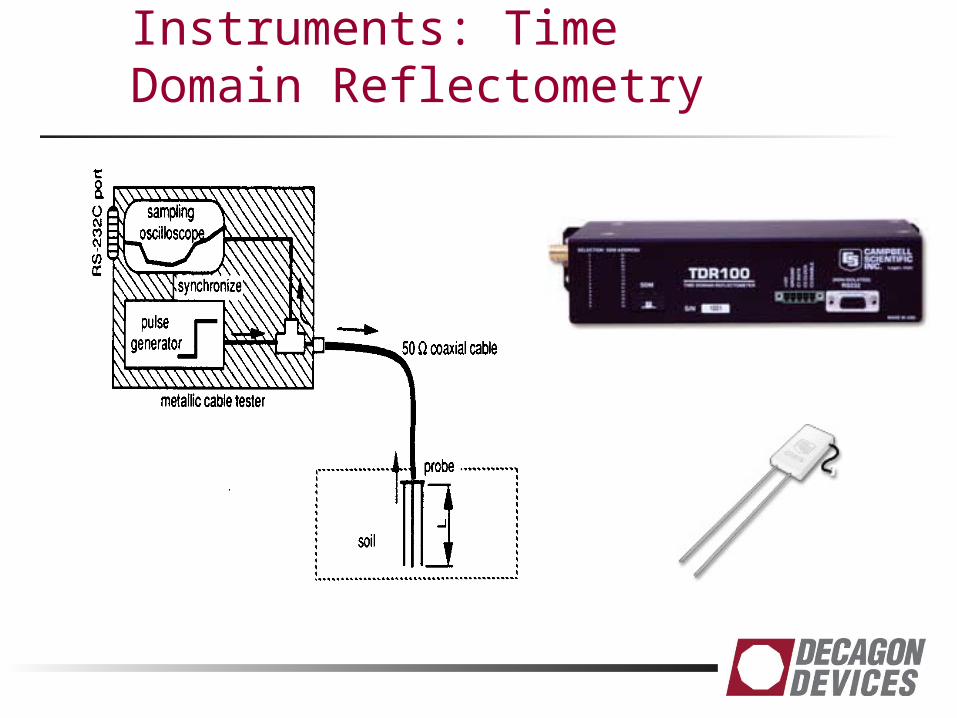
Dielectric Instruments: Time Domain Reflectometry
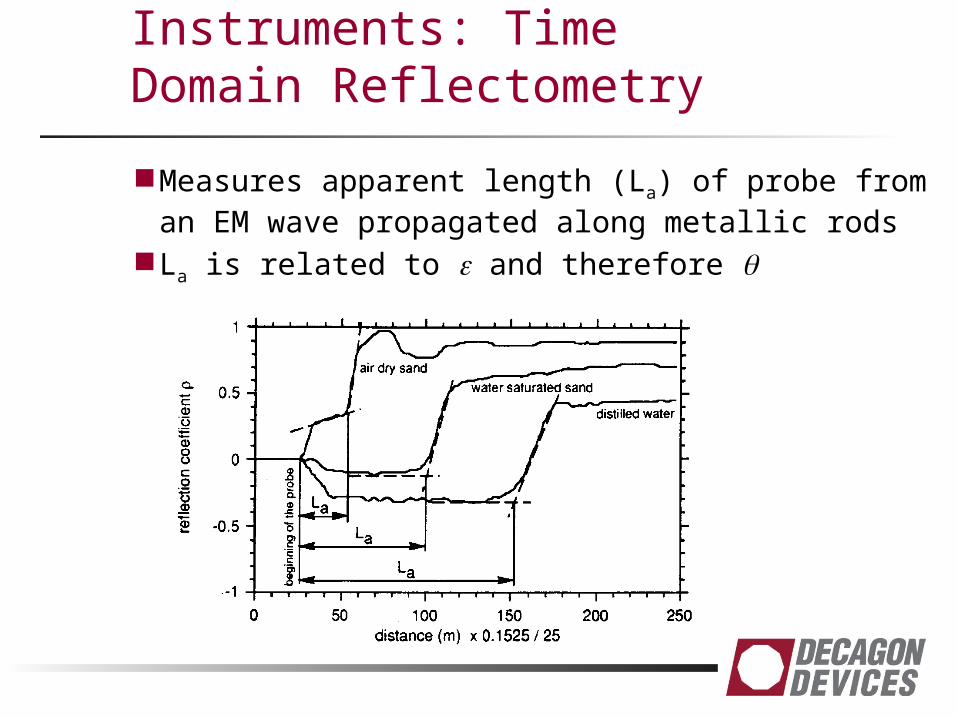
Dielectric Instruments: Time Domain Reflectometry
Measures apparent length (La) of probe from an EM wave propagated along metallic rods
La is related to e and therefore q
Time Domain Reflectometery
Advantages Calibration is
relatively insensitive to textural difference
Output wave provides electrical conductivity information
Good accuracyInsensitive to
salinity changes when EC is low to moderate.
DisadvantagesExpensiveDoes not work at
high EC (trace will flatten)
Requires waveform analysis (comes with most packages)
Sensitive to gaps in soil contact
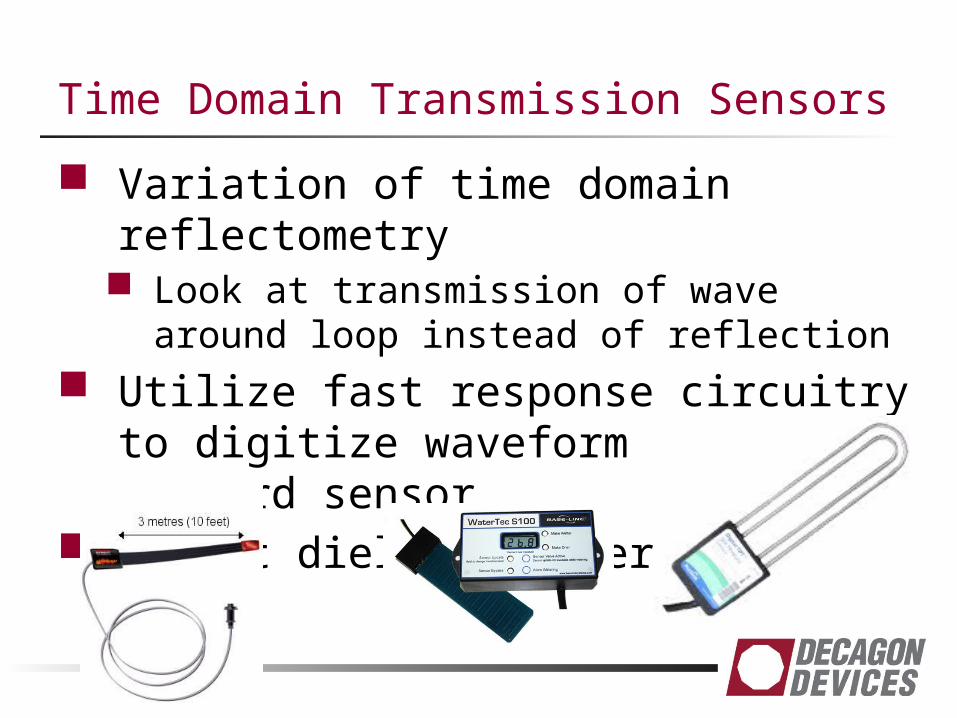
Time Domain Transmission Sensors
Variation of time domain reflectometry Look at transmission of wave around
loop instead of reflection Utilize fast response circuitry to
digitize waveform using onboard sensor
Output dielectric permittivity
Time Domain Transmission
Advantages Lower sensitivity to
temperature variation
Little salinity affect at low to medium electrical conductivity (EC) levels
Lower cost
Disadvantages Small volume of
influence Limited field in the
soilCannot be installed
into undisturbed soil Lose signal at high
soil ECs
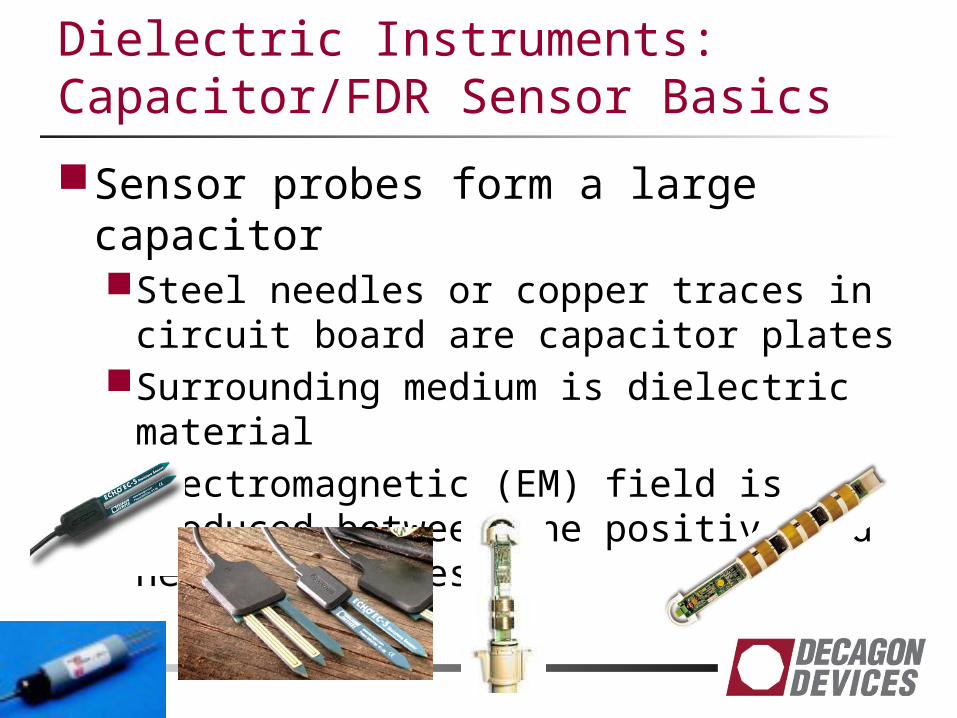
Dielectric Instruments:Capacitor/FDR Sensor Basics
Sensor probes form a large capacitorSteel needles or copper traces in circuit
board are capacitor platesSurrounding medium is dielectric materialElectromagnetic (EM) field is produced
between the positive and negative plates

Typical Capacitor
Capacitor
Electromagnetic Field
Dielectric Material
Positive Plate Negative Plate

Example: How Capacitance Sensors Function
EM Field
Sensor (Side View)
0 cm
1 cm
2 cm
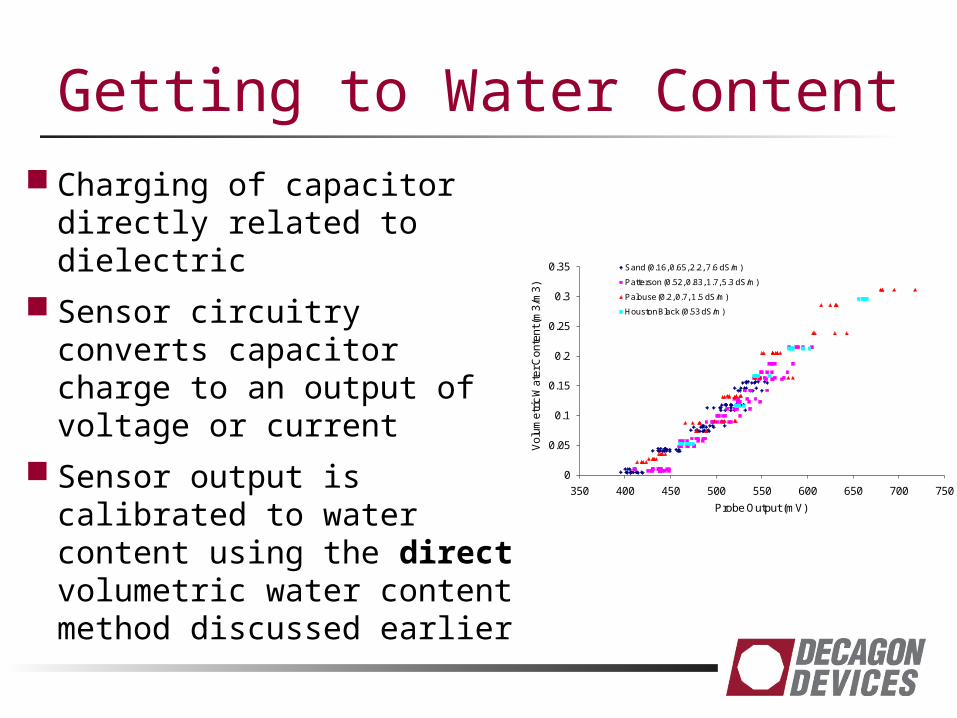
Getting to Water Content Charging of capacitor
directly related to dielectric
Sensor circuitry converts capacitor charge to an output of voltage or current
Sensor output is calibrated to water content using the direct volumetric water content method discussed earlier
0
0.05
0.1
0.15
0.2
0.25
0.3
0.35
350 400 450 500 550 600 650 700 750
Vo
lum
etr
ic W
ate
r Co
nte
nt (
m3
/m3
)
Probe Output (mV)
Sand (0.16, 0.65, 2.2, 7.6 dS/m)
Patterson (0.52, 0.83, 1.7, 5.3 dS/m)
Palouse (0.2, 0.7, 1.5 dS/m)
Houston Black (0.53 dS/m)
Capacitance/FDR
Advantages Lower cost Require simple readout
device Easy to install/use Best resolution to
changes in water content of any method Resolve changes of
0.00001 m3 m-3
Low Power
Disadvantages Some probes are
sensitive to soil texture and temperature fluctuations Depends on probe
measurement frequency Some require down-hole
installation Sensitive to air gaps in
soil contact
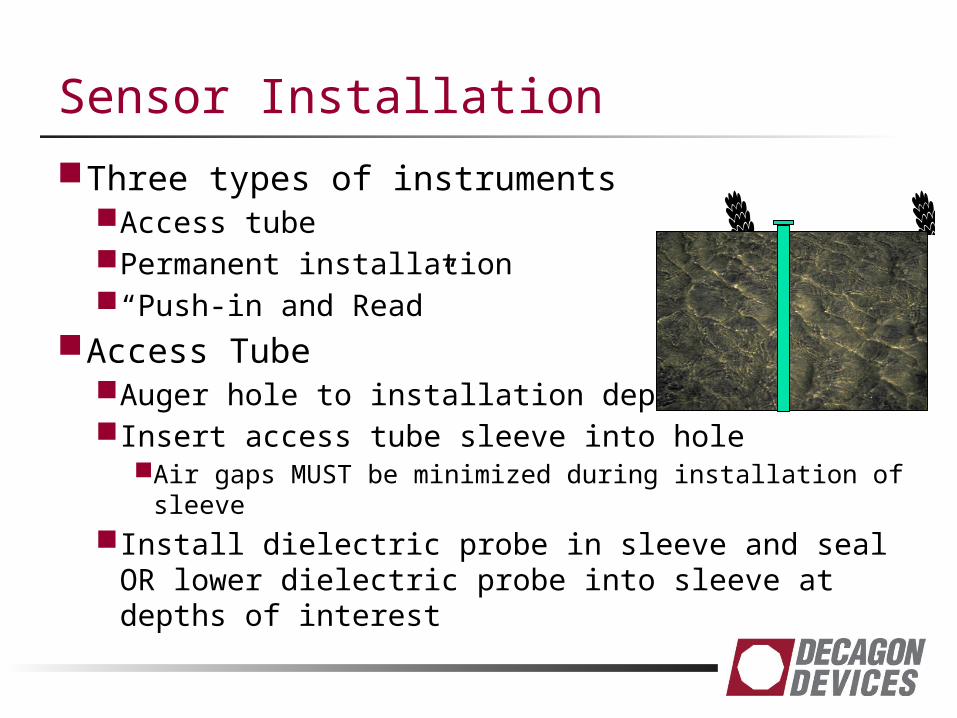
Sensor Installation
Three types of instrumentsAccess tubePermanent installation“Push-in and Read”
Access TubeAuger hole to installation depth Insert access tube sleeve into hole
Air gaps MUST be minimized during installation of sleeve
Install dielectric probe in sleeve and seal OR lower dielectric probe into sleeve at depths of interest
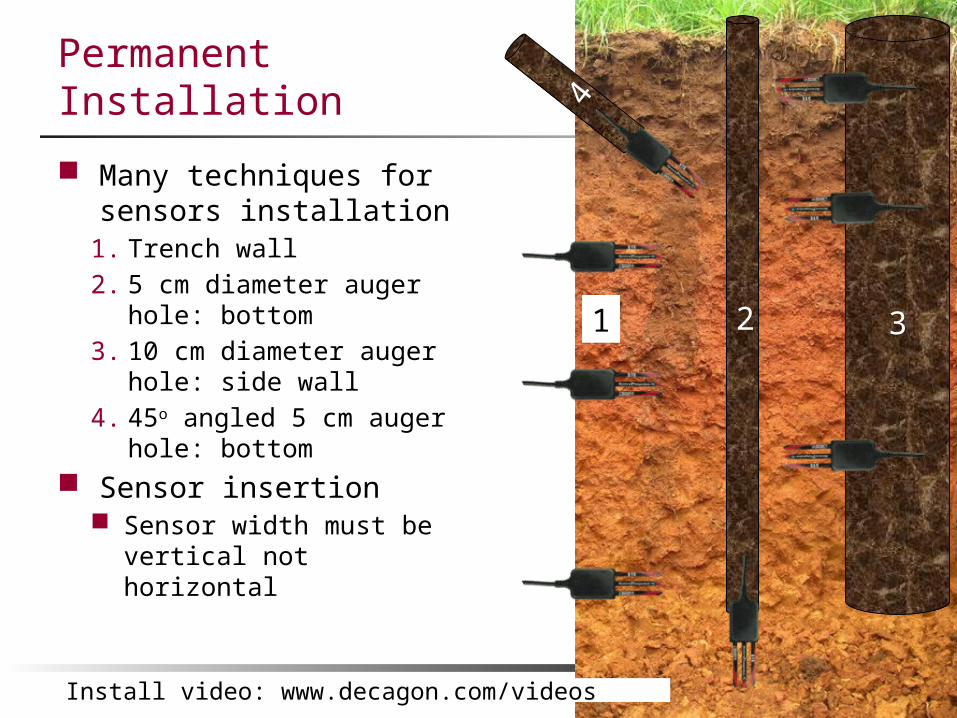
Permanent Installation
Many techniques for sensors installation
1. Trench wall2. 5 cm diameter auger
hole: bottom3. 10 cm diameter
auger hole: side wall4. 45o angled 5 cm
auger hole: bottom Sensor insertion
Sensor width must be vertical not horizontal
4
321
Install video: www.decagon.com/videos
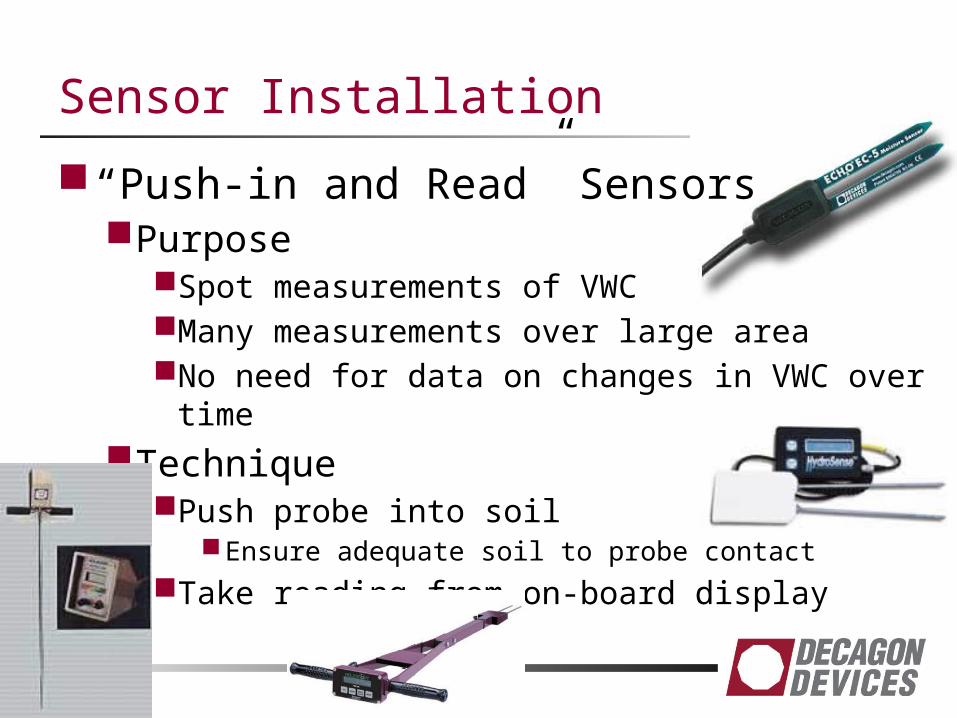
Sensor Installation
“Push-in and Read” SensorsPurpose
Spot measurements of VWCMany measurements over large areaNo need for data on changes in VWC over
timeTechnique
Push probe into soilEnsure adequate soil to probe contact
Take reading from on-board display

Question: What Technique is Best for My Research?
Answer: It depends on what you want. Every technique has advantages and disadvantages All techniques will give you some information about water
content So what are the important considerations?
Experimental needs Current inventory of equipment Budget Required accuracy/precision Manpower available to work Certification
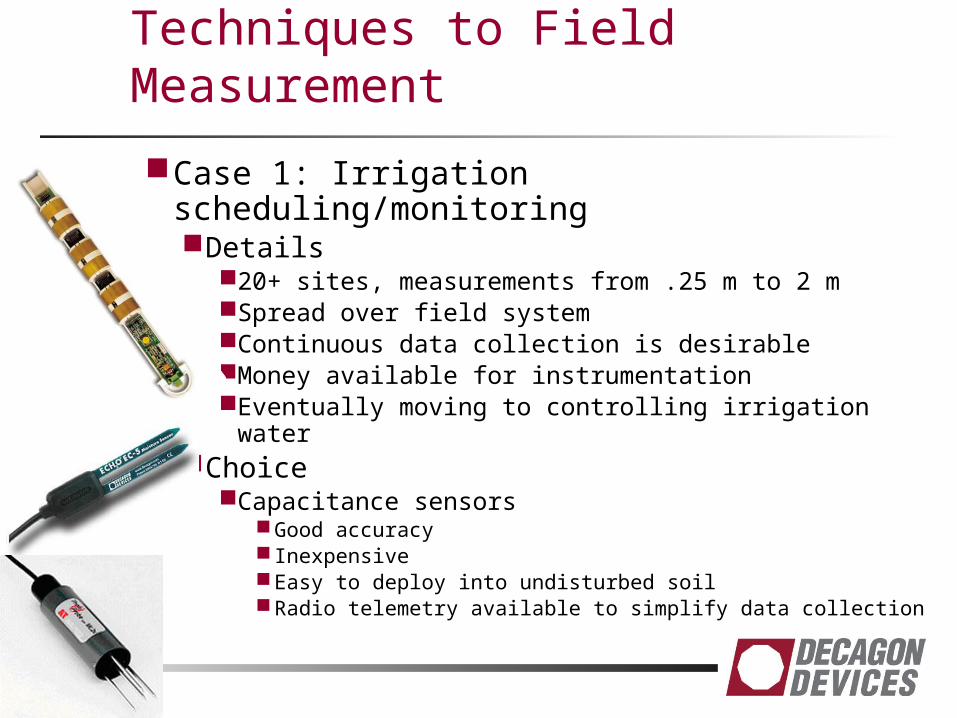
Examples: Applying Techniques to Field Measurement
Case 1: Irrigation scheduling/monitoringDetails
20+ sites, measurements from .25 m to 2 mSpread over field systemContinuous data collection is desirableMoney available for instrumentationEventually moving to controlling irrigation water
ChoiceCapacitance sensors
Good accuracy Inexpensive Easy to deploy into undisturbed soil Radio telemetry available to simplify data collection
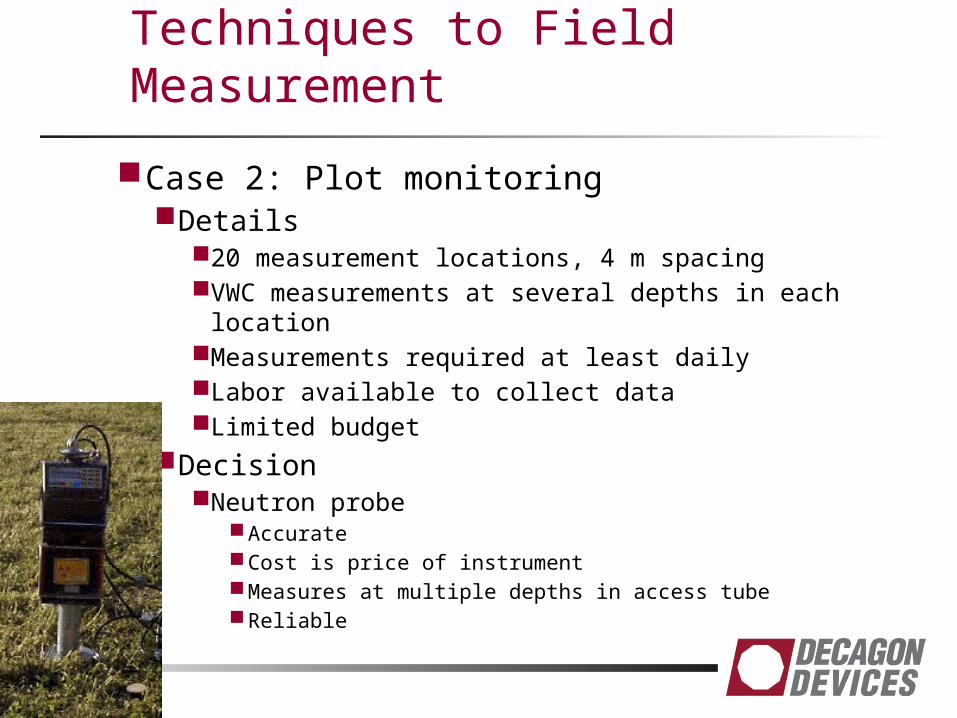
Examples: Applying Techniques to Field Measurement
Case 2: Plot monitoringDetails
20 measurement locations, 4 m spacingVWC measurements at several depths in each
locationMeasurements required at least daily Labor available to collect dataLimited budget
DecisionNeutron probe
Accurate Cost is price of instrument Measures at multiple depths in access tube Reliable

Examples: Applying Techniques to Field Measurement
Case 3: Geostatistical survey of catchment water contentDetails
Point measurement of water content at statistically significant intervals across a catchment
Low budgetLabor available to take measurementsSpatial variability key to analysis
DecisionSingle “Push-in and Read” capacitance
instrument Low cost, easy to use No installation necessary Standard calibration available
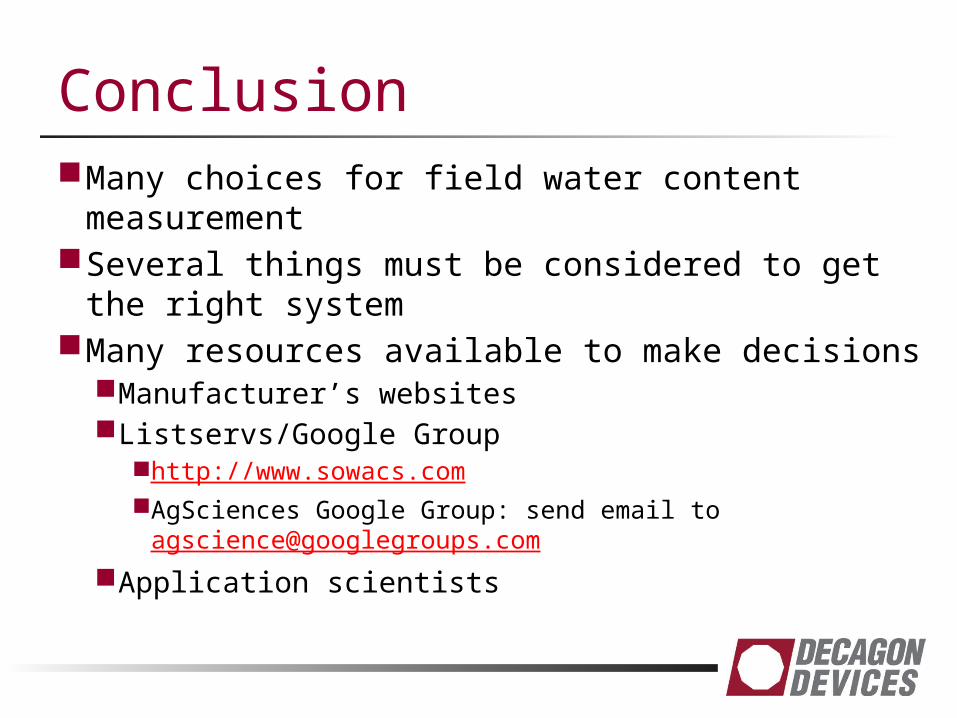
ConclusionMany choices for field water content
measurementSeveral things must be considered to get
the right systemMany resources available to make decisions
Manufacturer’s websitesListservs/Google Group
http://www.sowacs.comAgSciences Google Group: send email to
[email protected] Application scientists
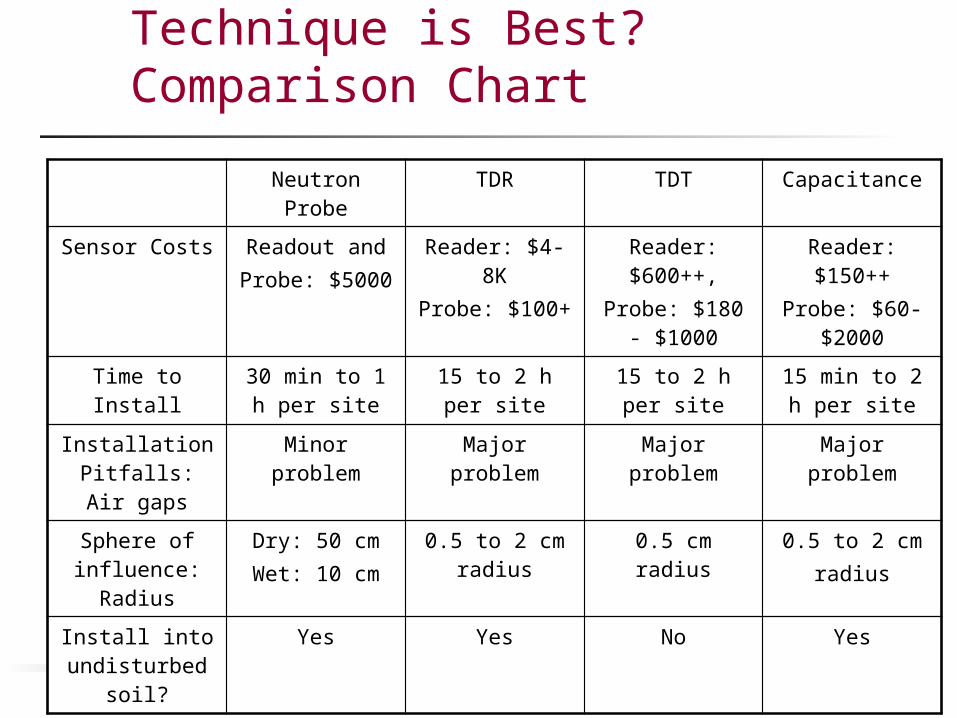
Which Measurement Technique is Best? Comparison Chart
Neutron Probe TDR TDT Capacitance
Sensor Costs Readout andProbe: $5000
Reader: $4-8KProbe: $100+
Reader: $600++,
Probe: $180 - $1000
Reader: $150++
Probe: $60-$2000
Time to Install 30 min to 1 h per site
15 to 2 h per site
15 to 2 h per site
15 min to 2 h per site
Installation Pitfalls: Air
gaps
Minor problem Major problem Major problem Major problem
Sphere of influence:
Radius
Dry: 50 cmWet: 10 cm
0.5 to 2 cm radius
0.5 cm radius 0.5 to 2 cmradius
Install into undisturbed
soil?
Yes Yes No Yes
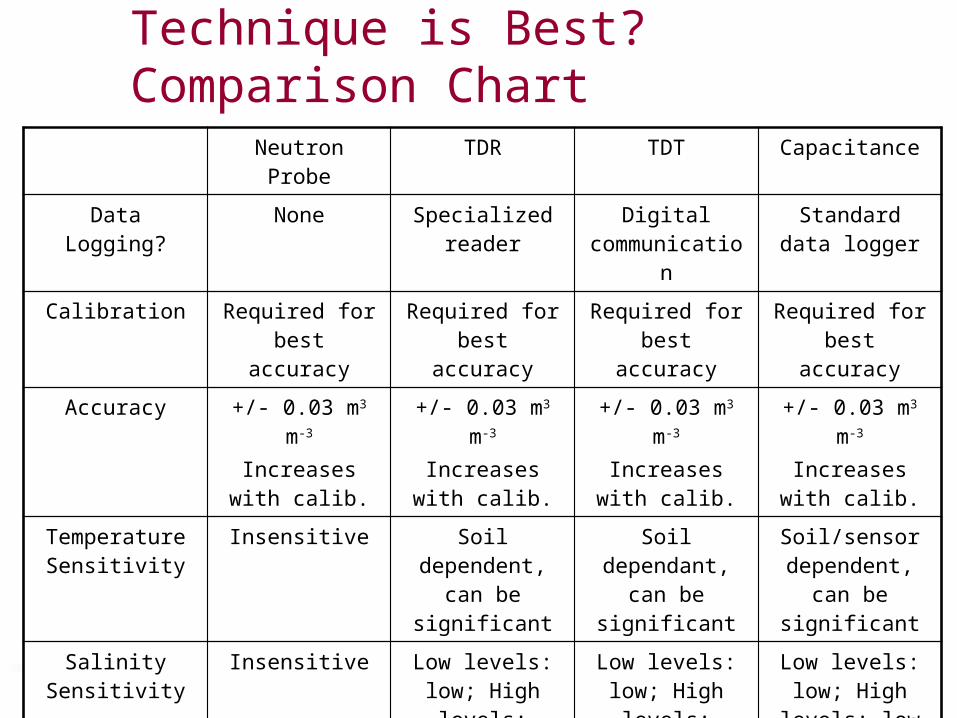
Which Measurement Technique is Best? Comparison Chart
Neutron Probe TDR TDT Capacitance
Data Logging? None Specialized reader
Digital communication
Standard data logger
Calibration Required for best accuracy
Required for best accuracy
Required for best accuracy
Required for best accuracy
Accuracy +/- 0.03 m3 m-3
Increases with calib.
+/- 0.03 m3 m-3
Increases with calib.
+/- 0.03 m3 m-3
Increases with calib.
+/- 0.03 m3 m-3
Increases with calib.
Temperature Sensitivity
Insensitive Soil dependent,
can be significant
Soil dependant,
can be significant
Soil/sensor dependent,
can be significant
Salinity Sensitivity
Insensitive Low levels: low; High
levels: Fails
Low levels: low; High
levels: Fails
Low levels: low; High
levels: low to high, probe
specific