Embed Size (px)
DESCRIPTION
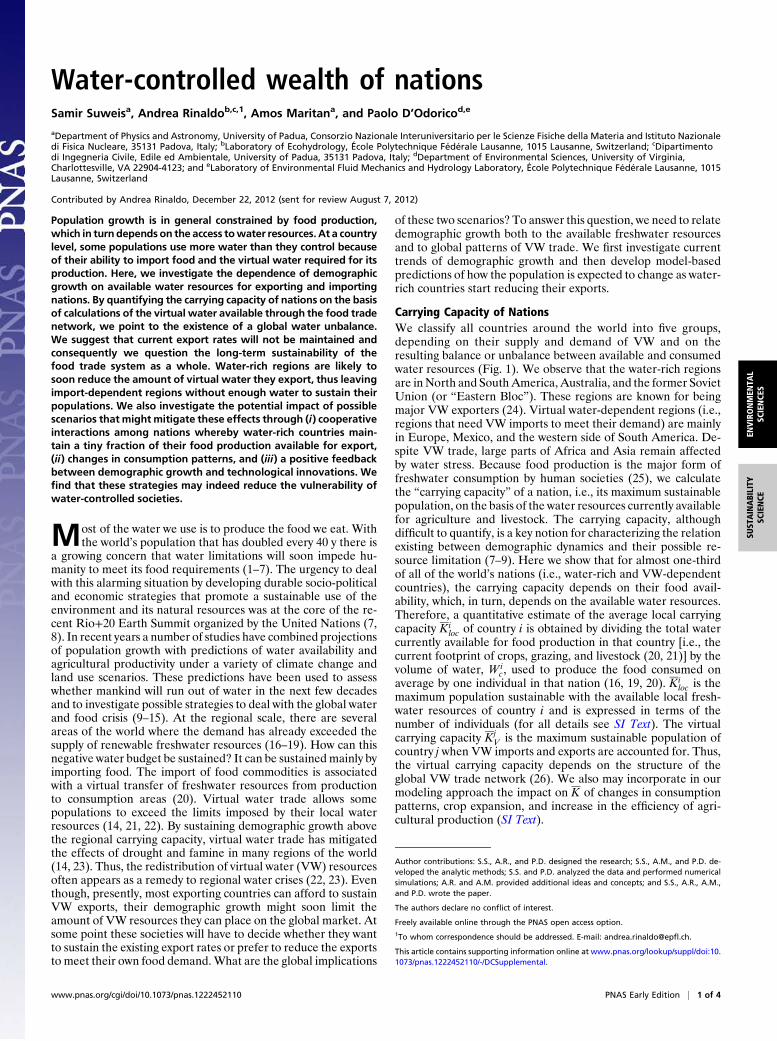
Water-rich regions are likely to soon reduce the amount of virtual water they export, thus leaving import-dependent regions without enough water to sustain their populations. We also investigate the potential impact of possible scenarios that might mitigate these effects through (i) cooperative interactions among nations whereby water-rich countries maintain a tiny fraction of their food production available for export, (ii) changes in consumption patterns, and (iii) a positive feedback between demographic growth and technological innovations. We find that these strategies may indeed reduce the vulnerability of water-controlled societies.
Citation preview
Water-controlled wealth of nationsSamir Suweisa, Andrea Rinaldob,c,1, Amos Maritana, and Paolo D’Odoricod,e
aDepartment of Physics and Astronomy, University of Padua, Consorzio Nazionale Interuniversitario per le Scienze Fisiche della Materia and Istituto Nazionaledi Fisica Nucleare, 35131 Padova, Italy; bLaboratory of Ecohydrology, École Polytechnique Fédérale Lausanne, 1015 Lausanne, Switzerland; cDipartimentodi Ingegneria Civile, Edile ed Ambientale, University of Padua, 35131 Padova, Italy; dDepartment of Environmental Sciences, University of Virginia,Charlottesville, VA 22904-4123; and eLaboratory of Environmental Fluid Mechanics and Hydrology Laboratory, École Polytechnique Fédérale Lausanne, 1015Lausanne, Switzerland
Contributed by Andrea Rinaldo, December 22, 2012 (sent for review August 7, 2012)
Population growth is in general constrained by food production,which in turn depends on the access towater resources. At a countrylevel, some populations use more water than they control becauseof their ability to import food and the virtual water required for itsproduction. Here, we investigate the dependence of demographicgrowth on available water resources for exporting and importingnations. By quantifying the carrying capacity of nations on the basisof calculations of the virtual water available through the food tradenetwork, we point to the existence of a global water unbalance.We suggest that current export rates will not be maintained andconsequently we question the long-term sustainability of thefood trade system as a whole. Water-rich regions are likely tosoon reduce the amount of virtual water they export, thus leavingimport-dependent regions without enough water to sustain theirpopulations. We also investigate the potential impact of possiblescenarios that might mitigate these effects through (i) cooperativeinteractions among nations whereby water-rich countries main-tain a tiny fraction of their food production available for export,(ii) changes in consumption patterns, and (iii) a positive feedbackbetween demographic growth and technological innovations. Wefind that these strategies may indeed reduce the vulnerability ofwater-controlled societies.
Most of the water we use is to produce the food we eat. Withthe world’s population that has doubled every 40 y there is
a growing concern that water limitations will soon impede hu-manity to meet its food requirements (1–7). The urgency to dealwith this alarming situation by developing durable socio-politicaland economic strategies that promote a sustainable use of theenvironment and its natural resources was at the core of the re-cent Rio+20 Earth Summit organized by the United Nations (7,8). In recent years a number of studies have combined projectionsof population growth with predictions of water availability andagricultural productivity under a variety of climate change andland use scenarios. These predictions have been used to assesswhether mankind will run out of water in the next few decadesand to investigate possible strategies to deal with the global waterand food crisis (9–15). At the regional scale, there are severalareas of the world where the demand has already exceeded thesupply of renewable freshwater resources (16–19). How can thisnegative water budget be sustained? It can be sustained mainly byimporting food. The import of food commodities is associatedwith a virtual transfer of freshwater resources from productionto consumption areas (20). Virtual water trade allows somepopulations to exceed the limits imposed by their local waterresources (14, 21, 22). By sustaining demographic growth abovethe regional carrying capacity, virtual water trade has mitigatedthe effects of drought and famine in many regions of the world(14, 23). Thus, the redistribution of virtual water (VW) resourcesoften appears as a remedy to regional water crises (22, 23). Eventhough, presently, most exporting countries can afford to sustainVW exports, their demographic growth might soon limit theamount of VW resources they can place on the global market. Atsome point these societies will have to decide whether they wantto sustain the existing export rates or prefer to reduce the exportsto meet their own food demand.What are the global implications
of these two scenarios? To answer this question, we need to relatedemographic growth both to the available freshwater resourcesand to global patterns of VW trade. We first investigate currenttrends of demographic growth and then develop model-basedpredictions of how the population is expected to change as water-rich countries start reducing their exports.
Carrying Capacity of NationsWe classify all countries around the world into five groups,depending on their supply and demand of VW and on theresulting balance or unbalance between available and consumedwater resources (Fig. 1). We observe that the water-rich regionsare in North and South America, Australia, and the former SovietUnion (or “Eastern Bloc”). These regions are known for beingmajor VW exporters (24). Virtual water-dependent regions (i.e.,regions that need VW imports to meet their demand) are mainlyin Europe, Mexico, and the western side of South America. De-spite VW trade, large parts of Africa and Asia remain affectedby water stress. Because food production is the major form offreshwater consumption by human societies (25), we calculatethe “carrying capacity” of a nation, i.e., its maximum sustainablepopulation, on the basis of the water resources currently availablefor agriculture and livestock. The carrying capacity, althoughdifficult to quantify, is a key notion for characterizing the relationexisting between demographic dynamics and their possible re-source limitation (7–9). Here we show that for almost one-thirdof all of the world’s nations (i.e., water-rich and VW-dependentcountries), the carrying capacity depends on their food avail-ability, which, in turn, depends on the available water resources.Therefore, a quantitative estimate of the average local carryingcapacity Ki
loc of country i is obtained by dividing the total watercurrently available for food production in that country [i.e., thecurrent footprint of crops, grazing, and livestock (20, 21)] by thevolume of water, Wi
c, used to produce the food consumed onaverage by one individual in that nation (16, 19, 20). Ki
loc is themaximum population sustainable with the available local fresh-water resources of country i and is expressed in terms of thenumber of individuals (for all details see SI Text). The virtualcarrying capacity Kj
V is the maximum sustainable population ofcountry j when VW imports and exports are accounted for. Thus,the virtual carrying capacity depends on the structure of theglobal VW trade network (26). We also may incorporate in ourmodeling approach the impact on K of changes in consumptionpatterns, crop expansion, and increase in the efficiency of agri-cultural production (SI Text).
Author contributions: S.S., A.R., and P.D. designed the research; S.S., A.M., and P.D. de-veloped the analytic methods; S.S. and P.D. analyzed the data and performed numericalsimulations; A.R. and A.M. provided additional ideas and concepts; and S.S., A.R., A.M.,and P.D. wrote the paper.
The authors declare no conflict of interest.
Freely available online through the PNAS open access option.1To whom correspondence should be addressed. E-mail: [email protected].
This article contains supporting information online at www.pnas.org/lookup/suppl/doi:10.1073/pnas.1222452110/-/DCSupplemental.
www.pnas.org/cgi/doi/10.1073/pnas.1222452110 PNAS Early Edition | 1 of 4
ENVIRONMEN
TAL
SCIENCE
SSU
STAINABILITY
SCIENCE
Demographic Growth and Water AvailabilityWe analyze and model the relation between demographicgrowth and the water balance of water-rich and VW-dependentcountries (for a total of n = 52 nations), using a stochastic logisticmodel. The population dynamics, xi(t), of nation i are expressedas (SI Text)
dxiðtÞdt
= αixiðtÞ�1−
xiðtÞKi
�; [1]
where i = 1, 2, . . . , N. Ki is treated as a random variable toaccount for stochastic fluctuations in available resources. Weuse this stochastic treatment because confidence intervals arenot available for estimates of the water footprint of agriculturalproducts used to calculate the carrying capacities (21). Thus, Ki
is expressed as Ki =Ki + ξ, ξ is a white Gaussian noise withmean〈ξ〉= 0 and covariance hξðtÞξðsÞi= σ2Kiδðt− sÞ (SI Text).〈·〉denotes the average with respect to the stochastic fluctuations,whereas σ2Ki is the intensity of the fluctuations, and δ(.) is theDirac delta function. The model is based on two key parameters:αi and Ki. The mean population growth coefficient αi is deter-mined for each nation, using demographic data for the period ofrecord 1970–2010 (SI Text). To assess whether the demographicgrowth of a nation is driven by either local or virtual water avail-ability, we consider both the case of population dynamics con-trolled by local water resources (i.e., with average carryingcapacity, Ki =Ki
loc) and the effect of VW trade (i.e., Ki =KiV ).
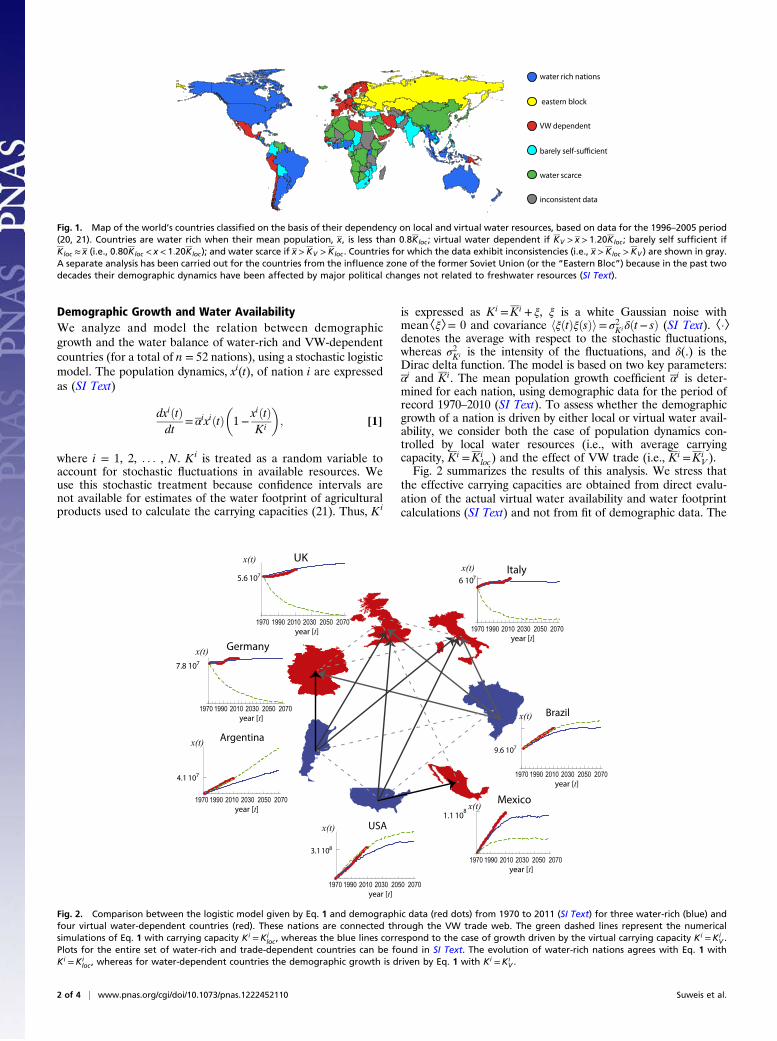
Fig. 2 summarizes the results of this analysis. We stress thatthe effective carrying capacities are obtained from direct evalu-ation of the actual virtual water availability and water footprintcalculations (SI Text) and not from fit of demographic data. The
water rich nations
eastern block
VW dependent
barely self-sufficient
water scarce
inconsistent data
Fig. 1. Map of the world’s countries classified on the basis of their dependency on local and virtual water resources, based on data for the 1996–2005 period(20, 21). Countries are water rich when their mean population, x, is less than 0:8Kloc ; virtual water dependent if KV > x > 1:20Kloc ; barely self sufficient ifKloc ≈ x (i.e., 0:80Kloc < x < 1:20Kloc); and water scarce if x >KV >Kloc . Countries for which the data exhibit inconsistencies (i.e., x >Kloc >KV ) are shown in gray.A separate analysis has been carried out for the countries from the influence zone of the former Soviet Union (or the “Eastern Bloc”) because in the past twodecades their demographic dynamics have been affected by major political changes not related to freshwater resources (SI Text).
Fig. 2. Comparison between the logistic model given by Eq. 1 and demographic data (red dots) from 1970 to 2011 (SI Text) for three water-rich (blue) andfour virtual water-dependent countries (red). These nations are connected through the VW trade web. The green dashed lines represent the numericalsimulations of Eq. 1 with carrying capacity Ki =Ki
loc , whereas the blue lines correspond to the case of growth driven by the virtual carrying capacity Ki =KiV .
Plots for the entire set of water-rich and trade-dependent countries can be found in SI Text. The evolution of water-rich nations agrees with Eq. 1 withKi =Ki
loc , whereas for water-dependent countries the demographic growth is driven by Eq. 1 with Ki =KiV .
2 of 4 | www.pnas.org/cgi/doi/10.1073/pnas.1222452110 Suweis et al.
average demographic growth of water-rich countries is well de-scribed by the logistic model (Eq. 1) with Ki =K
iloc, which indi-
cates that the growth of these populations is driven by local wateravailability and is not limited by the important export of VWsustained by these nations. Interestingly, several nations seem tohave just reached a critical phase in their demographic growth: thepoint of separation between the local water and the VW regime(SI Text). On the other hand, demographic growth of VW trade-dependent nations follows the logistic model with K
i=K
iV ; thus,
VW inputs may sustain the demographic growth of populationsthat increasingly rely on external VW resources (SI Text). In thesecountries population growth would not be sustainable withoutthe import of VW from other regions. The fact that demographicgrowth in water-rich countries is independent of their VW exports,whereas water-poor nations increasingly rely on VW imports, high-lights a situation that, in the long run, will be unbalanced and un-sustainable. These results indicate that both water-rich and trade-dependent populations are growing to rely on the same pool ofresources. At some point it will happen that, to meet their owndemand, water-rich countries will have to reduce their exports,thereby causing the emergence of water limitations in trade-dependent countries. For instance, during the 2008 food crisissome exporting countries panicked and banned the exports offood crops (27).Unless new freshwater resources become availableor investments for a more water-efficient agriculture are made,these populations will have to decrease.
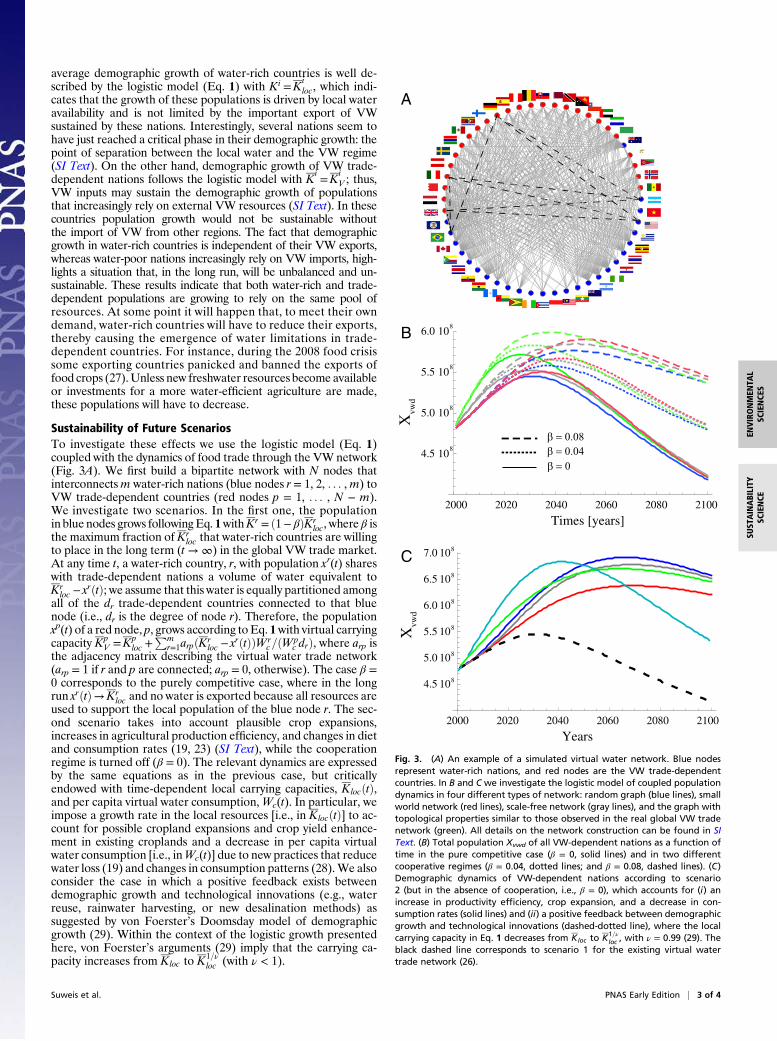
Sustainability of Future ScenariosTo investigate these effects we use the logistic model (Eq. 1)coupled with the dynamics of food trade through the VW network(Fig. 3A). We first build a bipartite network with N nodes thatinterconnectsm water-rich nations (blue nodes r = 1, 2, . . . ,m) toVW trade-dependent countries (red nodes p = 1, . . . , N − m).We investigate two scenarios. In the first one, the populationin blue nodes grows following Eq. 1withKr = ð1− βÞKr
loc, where β isthe maximum fraction of Kr
loc that water-rich countries are willingto place in the long term (t→∞) in the global VW trade market.At any time t, a water-rich country, r, with population xr(t) shareswith trade-dependent nations a volume of water equivalent toKr
loc − xrðtÞ; we assume that this water is equally partitioned amongall of the dr trade-dependent countries connected to that bluenode (i.e., dr is the degree of node r). Therefore, the populationxp(t) of a red node, p, grows according to Eq. 1with virtual carryingcapacity Kp
V =Kploc +
Pmr=1arpðKr
loc − xrðtÞÞWrc=ðWp
c drÞ, where arp isthe adjacency matrix describing the virtual water trade network(arp = 1 if r and p are connected; arp = 0, otherwise). The case β =0 corresponds to the purely competitive case, where in the longrun xrðtÞ→Kr
loc and no water is exported because all resources areused to support the local population of the blue node r. The sec-ond scenario takes into account plausible crop expansions,increases in agricultural production efficiency, and changes in dietand consumption rates (19, 23) (SI Text), while the cooperationregime is turned off (β = 0). The relevant dynamics are expressedby the same equations as in the previous case, but criticallyendowed with time-dependent local carrying capacities, KlocðtÞ,and per capita virtual water consumption,Wc(t). In particular, weimpose a growth rate in the local resources [i.e., in KlocðtÞ] to ac-count for possible cropland expansions and crop yield enhance-ment in existing croplands and a decrease in per capita virtualwater consumption [i.e., inWc(t)] due to new practices that reducewater loss (19) and changes in consumption patterns (28).We alsoconsider the case in which a positive feedback exists betweendemographic growth and technological innovations (e.g., waterreuse, rainwater harvesting, or new desalination methods) assuggested by von Foerster’s Doomsday model of demographicgrowth (29). Within the context of the logistic growth presentedhere, von Foerster’s arguments (29) imply that the carrying ca-pacity increases from Kloc to K1=ν
loc (with ν < 1).
B
C
A
4.5 108
5.0 108
5.5 108
6.0 108
2020 2040 2060 2080 21002000
Times [years]
Xvw
d
β = 0.08β = 0.04β = 0
4.5 108
5.0 108
5.5 108
6.0 108
6.5 108
7.0 108
2020 2040 2060 2080 21002000
Xvw
d
Years
Fig. 3. (A) An example of a simulated virtual water network. Blue nodesrepresent water-rich nations, and red nodes are the VW trade-dependentcountries. In B and C we investigate the logistic model of coupled populationdynamics in four different types of network: random graph (blue lines), smallworld network (red lines), scale-free network (gray lines), and the graph withtopological properties similar to those observed in the real global VW tradenetwork (green). All details on the network construction can be found in SIText. (B) Total population Xvwd of all VW-dependent nations as a function oftime in the pure competitive case (β = 0, solid lines) and in two differentcooperative regimes (β = 0.04, dotted lines; and β = 0.08, dashed lines). (C)Demographic dynamics of VW-dependent nations according to scenario2 (but in the absence of cooperation, i.e., β = 0), which accounts for (i) anincrease in productivity efficiency, crop expansion, and a decrease in con-sumption rates (solid lines) and (ii) a positive feedback between demographicgrowth and technological innovations (dashed-dotted line), where the localcarrying capacity in Eq. 1 decreases from Kloc to K1=ν
loc , with ν = 0.99 (29). Theblack dashed line corresponds to scenario 1 for the existing virtual watertrade network (26).
Suweis et al. PNAS Early Edition | 3 of 4
ENVIRONMEN
TAL
SCIENCE
SSU
STAINABILITY
SCIENCE
Discussion and ConclusionsTo evaluate the impact of the network structure, we investigate thesystem’s dynamics in the two above scenarios, using four types ofnetworks with different structural properties but the same numberof nodes and average number of links. For the first scenario, wefind that in the purely competitive case (β = 0) the population oftrade-dependent countries increases in the first 25 y and decreasesin the subsequent years as a result of water limitations arising fromthe exclusion from the access to water resources controlled andclaimed by water-rich countries (SI Text and ref. 30). This declinecontinues in the following decades as a result of demographicgrowth in water-rich populations (Fig. 3B). This behavior appearsto be very robust and independent of the topological properties ofthe underlying network. If trade-dependent countries use moreVW resources than they control, their population will stronglydecrease once the water-rich countries start reclaiming all of thewater resources they have access to, no matter how water isredistributed among the trade-dependent virtual water coun-tries. The results are robust and do not qualitatively changewith different strengths of the fluctuations of K in the range0< σK < 0:20K . Interestingly, this decrease in the trade-de-pendent population is reduced if a cooperative regime (i.e., β > 0)is considered. If water-rich countries keep a fraction, β> 0, of theirwater resources in the VW global market, VW-dependent coun-tries can sustain a larger population, which increases as a functionof β (Fig. 3B). The overall effect of a cooperative regime is a long-term increase in the total global population and thus a moresustainable demographic growth. In this cooperative regime, thenetwork topology affects the coupled VW-demographic dynamics(SI Text). We finally note that the sensitivity of the demographicdynamics on β is very strong, and just a small departure of β fromzero may lead to substantial reductions in the decrease of trade-dependent populations (Fig. 3B and SI Text). Similarly, strategiesbased on the enhancement of productivity efficiency and a de-crease in per capita global consumption result in a remarkable
relief for trade-dependent countries, whose populations are sub-jected to less pronounced declines (Fig. 3C). We also find thatchanges in consumption patterns and greater equity in per capitaconsumption would not be sufficient to meet the increasing de-mand of a growing human population. In fact, in the long run, ifthe growth rate of KlocðtÞ tends to zero, the trade-dependentpopulations will peak and then inevitably decline (SI Text). On thebasis of this analysis, in the absence of cooperation (β = 0) thedecline in the trade-dependent population is expected to startaround 2030, a date that is close to von Foerster’s Doomsday date(29). On the other hand, in the presence of cooperation (β> 0) thedecline is expected to occur between 2040 and 2060, depending onthe intensity of the cooperative regime (Fig. 3B). We note thatsimilar characteristic timescales have been discussed in ref. 31.Despite the presence of a number of other environmental,
cultural, and health-related factors not included in this study, thisanalysis points out how VW trade is only a temporary solution toa local-to-regional unbalance between populations and food pro-duction. The existence of this unbalanced condition might bemitigated if a cooperative regime among water-rich and VW-de-pendent nations continues to exist even once the excess of VW inthe exporting countries is strongly reduced by their demographicgrowth (β > 0). We finally show that strategies aiming at an in-crease in productivity efficiency through agricultural practices thatenhance crop yields while reducing water losses (e.g., water har-vesting, water conservation, genetically modified crops) or in-creased water use efficiency resulting from increased atmosphericCO2 concentrations improve the sustainability of trade-dependentsocieties with respect to a decrease in export rates from water-rich countries.
ACKNOWLEDGMENTS. A.M. and S.S. acknowledge the Cariparo Foundationand P.D. acknowledges the National Science Foundation (Grant DEB-0743678) for financial support. A.R. acknowledges the support provided bythe European Research Council advanced grant program RINEC-227612.
1. Brown LR, Flavin C, Postel S (1991) Saving the Planet: How to Shape an Environ-mentally Sustainable Global Economy, The Worldwatch Environmental Alert Series(Worldwatch Institute, Washington, DC).
2. Falkenmark MJ, Rockstrom J, Savenjie H (2004) Balancing Water for Humans andNature (Earthscan, London).
3. Tilman D, Balzer C, Hill J, Befort BL (2011) Global food demand and the sustainableintensification of agriculture. Proc Natl Acad Sci USA 108(50):20260–20264.
4. Barrett CB (2010) Measuring food insecurity. Science 327(5967):825–828.5. Gebbers R, Adamchuk VI (2010) Precision agriculture and food security. Science
327(5967):828–831.6. Barnaby W (2009) Do nations go to war over water? Nature 458(7236):282–283.7. Ehrlich PR, Kareiva PM, Daily GC (2012) Securing natural capital and expanding equity
to rescale civilization. Nature 486(7401):68–73.8. Wible B (2012) Rio+20. Science for sustainable development. Science 336(6087):1396.9. Ehrlich PR, Holdren JP (1971) Impact of population growth. Science 171(3977):
1212–1217.10. Rosegrant MW, Paisner M, Meijer S, Whitcover J (2001) Global Food Projections to
2020: Emerging Trends and Alternative Futures (International Food Policy ResearchInstitute, Washington, DC).
11. Rosegrant MW, Cline SA (2003) Global food security: Challenges and policies. Science302(5652):1917–1919.
12. Arnell NW (2004) Climate change and global water resources: SRES emissions andsocio-economic scenarios. Global Environ Change 14(1):31–52.
13. Foley JA, et al. (2011) Solutions for a cultivated planet. Nature 478(7369):337–342.14. Kumar MD, Singh OP (2005) Virtual water in global food and water policy making: Is
there a need for rethinking? Water Resour Manage 19(6):759–789.15. Foley JA, et al. (2005) Global consequences of land use. Science 309(5734):570–574.16. Oki T, Kanae S (2004) Virtual water trade and world water resources. Water Sci
Technol 49(7):203–209.17. Godfray HCJ, et al. (2010) Food security: The challenge of feeding 9 billion people.
Science 327(5967):812–818.
18. Postel SL, Daily GC, Ehrlich PR (1996) Human appropriation of renewable fresh water.Science 271(5250):785–786.
19. Rockstrom J, Karlberg J, Falkenmark M (2011) Global Food Production in a Water-Constrained World: Exploring ‘Green’, ‘Blue’Challenges and Solutions. (CambridgeUniv Press, Cambridge, UK).
20. Hoekstra A, Chapagain A (2008) Globalization of Water (Wiley Blackwell, Malden, MA).21. MekonnenMM, Hoekstra AY (2011) National Water Footprint Accounts: The Green, Blue
And Grey Water Footprint of Production And Consumption, Value of Water, ResearchReport Series No. 50 (UNESCO-IHE, Delft, The Netherlands), Vol 2: Appendices. Availableat http://www.waterfootprint.org/Reports/Report50-NationalWaterFootprints-Vol2.pdf.Accessed June 1, 2011.
22. Allan JA (1998) Virtual water: A strategic resource global solutions to regional defi-cits. Ground Water 36(4):545–546.
23. Hanjra MA, Qureshi ME (2010) Global water crisis and future food security in an era ofclimate change. Food Policy 35(5):365–377.
24. Konar M, et al. (2011) Water for food: The global virtual water trade network. WaterResour Res 47(5):W05520.
25. Fedoroff NV, et al. (2010) Radically rethinking agriculture for the 21st century. Science327(5967):833–834.
26. Suweis S, et al. (2011) Structure and controls of the global virtual water trade net-work. Geophys Res Lett 38(10):L10403.
27. Brown ME, et al. (2012) Country and regional staple food price indices for improvedidentification of food insecurity. Glob Environ Change 22(3):784–794.
28. Arrow K, et al. (2004) Are we consuming too much? J Econ Perspect 18(3):147–172.29. von Foerster H, Mora PM, Amiot LW (1960) Doomsday: Friday, November 13, AD
2026. Science 132:1291–1295.30. D’Odorico P, Laio F, Ridolfi L (2010) Does globalization of water reduce societal re-
silience to drought? Geophys Res Lett 37(13):L13403.31. Sornette D, Johensen A (2001) Finite-time singularity in the dynamics of the world
population, economic and financial indices. Physica A 294(3-4):465–502.
4 of 4 | www.pnas.org/cgi/doi/10.1073/pnas.1222452110 Suweis et al.