Embed Size (px)
Citation preview
Water Droplet Erosion: Influencing
Parameters, Representation and
Comparisons
Hany S. Kirols
A Thesis
in
The Department
Of
Mechanical and Industrial Engineering
Presented in Partial Fulfillment of Requirements
for the Degree of the Master of Applied Science (Mechanical Engineering) at
Concordia University Montreal, Quebec, Canada
2015
© Hany S. Kirols, 2015
ii
CONCORDIA UNIVERSITY
School of Graduate Studies
This is to certify that the thesis prepared
By: Hany Kirols
entitled : “Water Droplet Erosion: Influencing Parameters, Representation and
Comparisons” and submitted in partial fulfillment of the requirements for the degree of
Master of Applied Science (Mechanical Engineering)
complies with the regulations of the University and meets the accepted standards with respect to
originality and quality.
Signed by the final examining committee:
Dr. Muthu Packirisamy (Chair)
Dr. Michelle Nokken (Examiner)
Dr. Hoi Dick Ng (Examiner)
Dr. Mamoun Medraj (Supervisor)
Approved by ________________________________________________
Chair of Department or Graduate Program Director
________________________________________________
Dean of Faculty
Date ________________________________________________
iii
ABSTRACT
Water Droplet Erosion: Influencing Parameters, Representation
and Comparisons
Hany S. Kirols
Water Droplet Erosion (WDE) is defined as the progressive loss of original material from a solid
surface due to continuous impingements of water droplets or jets. In this work, parameters
affecting this wear phenomenon are discussed in detail through a literature review. The initial
surface roughness as a parameter that may influence WDE process was not given attention in the
literature. Therefore, its effect on erosion was studied experimentally. It was concluded that the
initial surface roughness has a significant effect on the length of the incubation stage, and may
influence the maximum erosion rate.
Another point tackled in this work is the WDE results representation. The traditional method of
representing erosion results is through a plot between material loss and time. However, this plot
neglects important information about the WDE experiment, for instance, the amount of water
which has impacted the sample during the test. Therefore, in this work a new representation
method of WDE test results was proposed. This new method represents WDE test results with
respect to the applied kinetic energy per unit area. WDE erosion result for tests done on 12% Cr
stainless steel were successfully represented and analyzed using this method.
Finally, the WDE found on ex-service steam turbine blades was studied. The progression of
erosion on the surface of the blades was illustrated by the aid of SEM micrographs. This work
confirmed that the formation of asperities and depressions are considered the main reasons for pit
initiation. In addition, it was also confirmed that the twist angle of the turbine blade around its
diagonal, is an important parameter that influences its WDE. Twist angle has an effect on: (a)
impact angle, (b) erosion appearance, (c) impact speed, (d) affected area. Furthermore, according
to the current experimental results, multi-ray rig erosion tests considered the closest simulation to
the actual ex-service blade in terms of damage appearance.

iv
ACKNOWLEDGEMENT
First of all, I wish to show my gratitude and gratefulness to Prof. Mamoun Medraj for giving me
this exquisite opportunity to be part of his outstanding research group, the “Thermodynamics of
Materials Group” (TMG). He also gave me the chance to work on such interesting research field
with an exposure to many practical applications. Sir, your great support and guidance were vital
for this work, and highly appreciated. I also wish to express my genuine thanks to Dr. Dmytro
Kevorkov for his patience and persistence in helping me to solve problems and develop the ideas
in this work.
I would like to thank Dr. Andreas Uihlein from Alstom Power, Switzerland. His great patience
and support were essential for this project to exist. His comments and ideas were also so
constructive and beneficial for this work.
I would like to express my appreciativeness to all my colleagues at TMG, Concordia University.
You guys made it possible for this work to emerge, thank you, Abdullahi Kachalla, Ahmad
Mostafa, Bolariewa Komolafe, Kayode Orimoloye, Madina Omarkhan, Benjamin Wallace, Mazen
Samara and of course last but not least Mohamad Mahdipoor.
This work was funded by ALSTOM power, Switzerland. I would like to acknowledge their
professionalism and their great support.
At the end, my deepest gratitude and love go to my parents and my only sister. You provided me
with all means of moral and personal support. Without your continuous encouragement, I would
not have reached this point in my life. No enough words can describe my gratefulness.
v
TABLE OF CONTENTS
Table of Contents ............................................................................................................................ v
List of Figures .............................................................................................................................. viii
List of Tables ............................................................................................................................... xiii
1. Introduction ............................................................................................................................. 1
1.1. Steam turbine failures....................................................................................................... 2
1.2. Water droplet erosion of LP blades .................................................................................. 3
1.3. Objectives ......................................................................................................................... 5
2. The water droplet erosion phenomenon .................................................................................. 7
2.1. Time dependence of WDE ............................................................................................... 7
2.2. Parameters affecting the water droplet/solid surface interaction and surface response. .. 9
2.2.1. Theoretical erosion model......................................................................................... 9
2.2.1.1 Water droplet behavior after impact .................................................................. 9
2.2.1.2 Erosion mechanism.......................................................................................... 10
2.2.2 Erosion parameters.................................................................................................. 13
2.2.2.1 Impact speed .................................................................................................... 13
2.2.2.2 Droplet size and shape ..................................................................................... 15
2.2.2.3 Impact angle .................................................................................................... 16
2.2.2.4 Initial surface conditions ................................................................................. 17
2.2.2.5 Mechanical properties ...................................................................................... 20
2.3 Erosion representation and test rigs ............................................................................... 21
2.3.1 Erosion representation ............................................................................................ 21
2.3.1.1 Energy balance of water droplet erosion. ........................................................ 21
2.3.1.2 Methods used to report WDE experimental results and their drawbacks ........ 24
2.3.2 WDE test rigs in the literature ................................................................................ 25
3. Experimental procedures ....................................................................................................... 27
3.1. Methodology ...................................................................................................................... 27
3.1. Erosion rig ...................................................................................................................... 27
3.1.1. Erosion test procedure............................................................................................. 30
3.1.2. Water droplet generation......................................................................................... 30
3.1.3. Tested materials ...................................................................................................... 38
3.1.4. Surface roughness test samples ............................................................................... 38
vi
3.2. Examining of ex-service turbine blades ......................................................................... 39
4. The effect of the initial surface roughness on water droplet erosion behavior ...................... 41
4.1. Experimental results for the effect of initial surface roughness ..................................... 42
4.2. Discussion ...................................................................................................................... 50
4.3. Summary ........................................................................................................................ 59
5. Erosion test results representation and comparisons ............................................................. 61
5.1. Erosion representation in terms of applied kinetic energy ............................................. 66
5.2. Analysis of experimental results after using the new energy representation method .... 69
5.2.1. Analysis of WDE data of tests having similar incubation energy and similar
maximum erosion slope ......................................................................................................... 71
5.2.2. Analysis of WDE data of tests having similar incubation energy and different
maximum erosion slope ......................................................................................................... 73
5.2.3. Analysis of WDE test results having different incubation energy and different
maximum slope of erosion .................................................................................................... 78
5.3. Summary ........................................................................................................................ 81
6. Analysis of ex-service turbine blades failure ........................................................................ 83
6.1. Visual inspections .............................................................................................................. 84
6.2. Metallography ................................................................................................................ 85
6.3. Fracture surface micro-analyses ..................................................................................... 87
6.3.1. Erosion progression ................................................................................................ 87
6.3.1.1 Surface roughening, and the formation of surface depressions and asperities 88
6.3.1.2 Detachment of asperities and the formation of pits on the surface ................. 89
6.3.1.3 The mechanism of pits coalescence ................................................................. 91
6.3.1.4 Severe erosion marks formation on the surface............................................... 92
6.3.2. Influence of the angle of twist on the WDE of turbine blades................................ 94
6.3.2.1 The effect of the blade’s angle of twist on the impact angle and the erosion
appearance 94
The effect of small angle of twist on the erosion appearance ............................................ 95
The effect of large angle of twist on the erosion appearance ............................................ 96
6.3.2.2 The effect of the blade’s angle of twist on the affected area ........................... 98
6.3.2.3 The effect of the blade’s angle of twist on the speed of impact ...................... 98
6.3.3. Failure modes of blades’ materials ......................................................................... 99
6.4. Comparison between WDE rig results and damage found on ex-service turbine blades
101
vii
6.5. Prediction of actual erosion damage using experimental results ................................. 102
6.6. Summary ...................................................................................................................... 104
7. Conclusions, contributions and suggestions for future work .............................................. 105
7.1. Conclusions .................................................................................................................. 105
7.2. Contributions ................................................................................................................ 106
7.3. Suggestions for future work ............................................................................................. 107
References ................................................................................................................................... 109
A. Appendix .......................................................................................................................... 113
Solved technical problems for high speed tests ................................................................... 113
viii
LIST OF FIGURES
Figure 1.1 Schematic for the water droplet formation, which leads to erosion in steam turbines
[12] .................................................................................................................................................. 4
Figure 1.2 Eroded ex-service turbine blade ................................................................................... 5
Figure 2.1 A typical erosion curve [10] ......................................................................................... 8
Figure 2.2 Method proposed by the ASTM G73 standard to extract data from the erosion curve 8
Figure 2.3 Schematic for different loading directions during a water droplet impact (a) water
hammering (b) lateral outflow ........................................................................................................ 9
Figure 2.4 WDE mechanism during the incubation stage for ductile materials [22]................... 12
Figure 2.5 Schematic showing the formation asperities due to successive impacts [22] ........... 12
Figure 2.6 Schematic of the formation of more surface pitting [26] ........................................... 12
Figure 2.7 Angle between the water droplet inclined surface and the solid surface [26] ............ 14
Figure 2.8 Effect of impact angle on the volume loss [6] ............................................................ 17
Figure 2.9 Schematic reported by Heymann [4] to explain the effect of surface asperities ........ 18
Figure 3.1 Schematic of the water droplet erosion rig ................................................................. 28
Figure 3.2 Different sample designs depending on speed range and material: (a) Flat samples for
tests below 350 m/s, (b) L-shaped samples for samples tested at 400 m/s, (c,d) T-shaped samples
for tests at 400 m/s and above for different materials, (e) Aerofoil sample which simulates the
blade’s cross section. .................................................................................................................... 29
Figure 3.3 Schematic to illustrate the injection of water droplets ............................................... 30
Figure 3.4 Nozzles used in the experiments (a) single-ray, (b) 3-ray, and (c) multi-ray ............. 31
Figure 3.5 Setup to characterize the water droplets ..................................................................... 32
Figure 3.6 Droplet size distribution for single-ray nozzle using parameters set number 1(Table
3.1) ................................................................................................................................................ 33
Figure 3.7 Droplet size distribution for single-ray nozzle using parameters set number 2 (Table
3.1) ................................................................................................................................................ 34
ix
Figure 3.8 Droplet size distribution for 3-ray nozzle using parameters set number 3 (Table 3.1)
....................................................................................................................................................... 34
Figure 3.9 Droplet size distribution for multi-ray nozzle using parameters set number 4 (Table
3.1) ................................................................................................................................................ 35
Figure 3.10 An example of images used to find the number of droplets impinging each sample in
each rotation for single-ray nozzle using parameters: (a) set number 1, (b) set number 2. (Table
3.1) ................................................................................................................................................ 36
Figure 3.11 An example of images used to find the number of droplets impinging each sample in
each rotation for single-ray nozzle using parameters: (a) set number 3, (b) set number 4. (Table
3.1) ................................................................................................................................................ 36
Figure 3.12 Eroded blade with sever erosion marks .................................................................... 40
Figure 3.13 The twist of a steam turbine blade around its axis [56] ............................................ 40
Figure 4.1 Optical macrograph of the exposed area to erosion on the surface of a polished 12%
Cr stainless steel sample ............................................................................................................... 44
Figure 4.2 Repeatability of the water droplet erosion measurements at impact speed of 350 m/s
and droplet diameter of 460 μm for two tests using the same surface condition. ......................... 45
Figure 4.3 Water droplet erosion of 12% Cr stainless steel at impact speed of 300 m/s and
droplet diameter of 460 μm for the two surface conditions. ......................................................... 46
Figure 4.4 Water droplet erosion of 12% Cr stainless steel at impact speed of 350 m/s and
droplet diameter of 460 μm for the two surface conditions. ......................................................... 46
Figure 4.5 Water droplet erosion of 12% Cr stainless steel at impact speed of 300 m/s and
droplet diameter of 603 μm for the two surface conditions. ......................................................... 47
Figure 4.6 Water droplet erosion of 12% Cr stainless steel at impact speed of 350 m/s and
droplet diameter of 603 μm for the two surface conditions. ......................................................... 47
Figure 4.7 Bar chart for the incubation specific impacts at different test conditions of the two
different surface conditions........................................................................................................... 48
Figure 4.8 Bar chart showing the relation between the lengths of incubation period of vibromet
polished and hand ground samples at different test conditions. ................................................... 49
Figure 4.9 Vibratory polished sample (a) before the WDE test (b) during the incubation stage 52
Figure 4.10 Manually ground sample before the WDE test ........................................................ 53
x
Figure 4.11 Optical macrographs for erosion progression ........................................................... 55
Figure 4.12 Water droplet erosion of annealed Ti6Al4V at impact speed of 300 m/s and droplet
diameter of 460 μm for the three surface conditions. ................................................................... 57
Figure 4.13 Water droplet erosion of annealed Ti6Al4V at impact speed of 350 m/s and droplet
diameter of 460 μm for the three surface conditions. ................................................................... 57
Figure 5.1 Water droplet erosion of 12%Cr stainless steel when tested using a single-ray
producing 460 µm droplets at 2 different impact speeds .............................................................. 63
Figure 5.2 Water droplet erosion of 12%Cr stainless steel when tested using a single-ray nozzle
producing 603 µm droplets at 2 different impact speeds .............................................................. 63
Figure 5.3 Averaged water droplet erosion of 12% Cr stainless steel when tested using a 3-ray
nozzle producing 220 µm droplets at 3 different impact speeds .................................................. 64
Figure 5.4 Water droplet erosion of 12%Cr stainless steel represented in terms of volume loss
per impacted area versus applied energy intensity ....................................................................... 68
Figure 5.5 Images inside the erosion rig of Concordia University at the moment of impact taken
at 16,000 fps for a test done at 300 m/s using 460 µm droplets (a) the water droplets falling
before impact; (b) the subdivision of water droplets just after impact (c) the migration of small
water droplets from the surface..................................................................................................... 70
Figure 5.6 Craters formed due to WDE of 12 %Cr stainless steel, when tested using (a) 220 µm
droplets, (b) 460 µm droplets ........................................................................................................ 74
Figure 5.7 Water droplet erosion of 12%Cr stainless steel represented in terms of volume loss
per impacted area versus the energy intensity, after applying (ξ) ................................................. 77
Figure 5.8 Graph showing the trend of (ξ) of change for tests done using 220 µm droplets in the
speed range 400-475 m/s .............................................................................................................. 78
Figure 5.9 Water droplet erosion of 12%Cr stainless steel for tests number 4 and 5 (Table 5.2)
after applying (ξ) ........................................................................................................................... 80
Figure 6.1 Received sections of the leading edge of Blade 1 ...................................................... 83
Figure 6.2 Eroded surface area of Blade 2 ................................................................................... 84
Figure 6.3 The angle of twist found on turbine blades[56] .......................................................... 85
Figure 6.4 Microstructure of Blade 1 ........................................................................................... 86
xi
Figure 6.5 Microstructure of oil quenched 420 stainless steel after austenitizing for 15 min at
1150 [69] ....................................................................................................................................... 86
Figure 6.6 Microstructure of Blade 2 ........................................................................................... 87
Figure 6.7 Combined images for an erosion region on the surface of section 4 of the ex-service
Blade 1 .......................................................................................................................................... 88
Figure 6.8 The formation of asperities between depressions on the surface of section 4 of Blade
1 (Figure 6.7 (a)) ........................................................................................................................... 89
Figure 6.9 The initiation of pitting due to asperities detachment (Figure 6.7 (b))....................... 90
Figure 6.10 Pits oriented in the direction of rotation (Figure 6.7 (b)) ......................................... 91
Figure 6.11 The formation of surface pitting due to the detachment of asperities ...................... 91
Figure 6.12 Showing the joining of formed pitting around depressions (Figure 6.7 (c)) ............ 92
Figure 6.13 Erosion at different levels of severity (a) to (b) ........................................................ 93
Figure 6.14 Studied sections (i) and (ii) of Blade 2 ..................................................................... 94
Figure 6.15 Combined images for an erosion region on the surface of section (i) of Figure 6.14
of ex-service Blade 2 .................................................................................................................... 95
Figure 6.16 Similarities in the erosion progression between sections of blade 1 and 2, (a) Blade
1, (b) Blade 2................................................................................................................................. 95
Figure 6.17 Combined images for an erosion region on the surface of section (ii) of Figure 6.14
of ex-service Blade2 ..................................................................................................................... 96
Figure 6.18 The progression of erosion in Figure 6.17 from sections (a) to (c) .......................... 97
Figure 6.19 The erosion appearance of a WDE rig experiment done using the multi-ray nozzle
producing 271 µm droplets at 400 m/s ......................................................................................... 97
Figure 6.20 Illustration for the proposed theory for the effect of the angle of twist .................... 98
Figure 6.21 The damage on section (i) of Figure 6.14 of blade 2 form a plan view ................... 99
Figure 6.22 The a the damage on section (i) of Figure 6.14 of Blade 2, after tilting the SEM
stage ............................................................................................................................................ 100
Figure 6.23 Size of pits formed on the surface of Blade 2......................................................... 100
xii
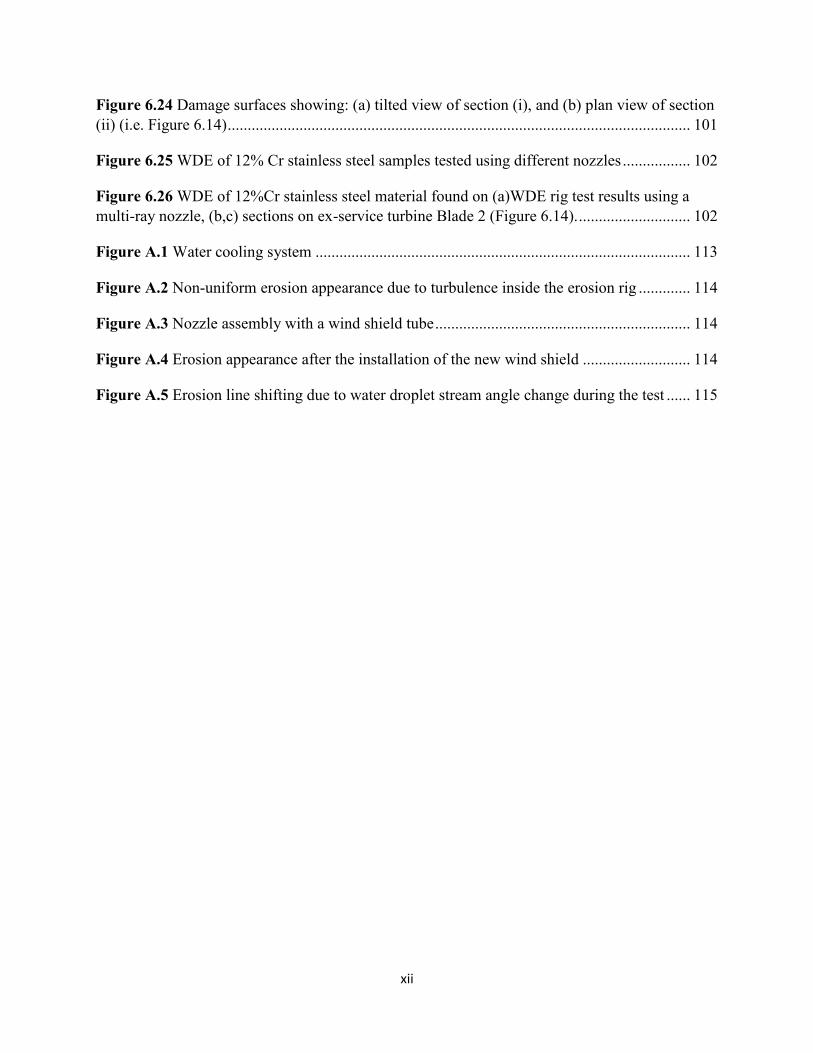
Figure 6.24 Damage surfaces showing: (a) tilted view of section (i), and (b) plan view of section
(ii) (i.e. Figure 6.14) .................................................................................................................... 101
Figure 6.25 WDE of 12% Cr stainless steel samples tested using different nozzles ................. 102
Figure 6.26 WDE of 12%Cr stainless steel material found on (a)WDE rig test results using a
multi-ray nozzle, (b,c) sections on ex-service turbine Blade 2 (Figure 6.14). ............................ 102
Figure A.1 Water cooling system .............................................................................................. 113
Figure A.2 Non-uniform erosion appearance due to turbulence inside the erosion rig ............. 114
Figure A.3 Nozzle assembly with a wind shield tube ................................................................ 114
Figure A.4 Erosion appearance after the installation of the new wind shield ........................... 114
Figure A.5 Erosion line shifting due to water droplet stream angle change during the test ...... 115
xiii
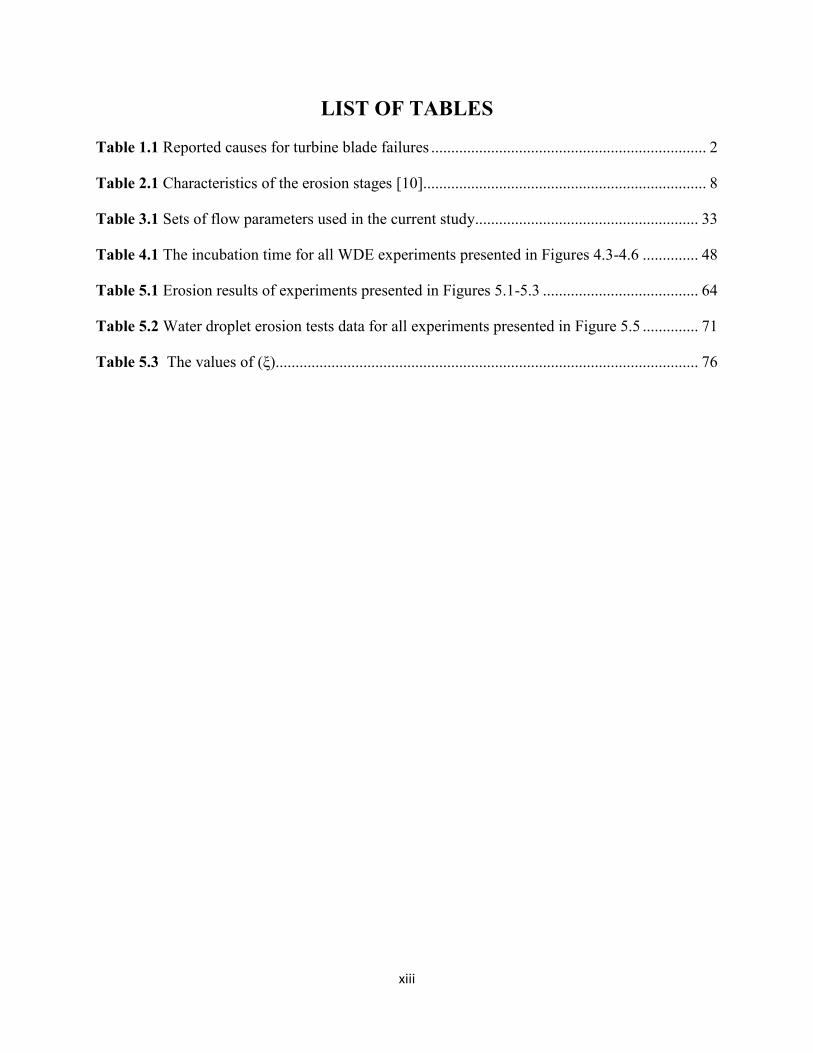
LIST OF TABLES
Table 1.1 Reported causes for turbine blade failures ..................................................................... 2
Table 2.1 Characteristics of the erosion stages [10]....................................................................... 8
Table 3.1 Sets of flow parameters used in the current study........................................................ 33
Table 4.1 The incubation time for all WDE experiments presented in Figures 4.3-4.6 .............. 48
Table 5.1 Erosion results of experiments presented in Figures 5.1-5.3 ....................................... 64
Table 5.2 Water droplet erosion tests data for all experiments presented in Figure 5.5 .............. 71
Table 5.3 The values of (ξ).......................................................................................................... 76
1
1. Introduction
For decades “Water Droplet Erosion” (WDE) has been a major concern for the steam turbine
industry. Study of the WDE started in the early 20th century [1-5] through researchers who were
interested in solving the wear problems of steam turbine blades. This type of wear damage causes
a great change in the optimized aerodynamics of these rotating components [6].
Erosion was defined by Heymann [4] as a gradual material loss from a surface due to the
application continuous impulsive forces, in the form of particles or fragments; however, his
description is general. The way impulsive forces are applied is what gives erosion its name. For
an instance, cavitation erosion is the erosion caused by the repeated formation and violent collapse
of liquid cavities or bubbles due to rapid change in pressure [7]. Solid particle erosion is defined
as the erosion caused by solid particles impingements on a solid surface [8]. The definition of
WDE would be apparent now, it is the progressive loss of original material from a solid surface
due to continuous impingements of water droplets or jets [9, 10].
In steam turbines, low pressure cycles are the most affected by water droplet erosion. In these
cycles, steam tends to condensate and forms small liquid droplets that imping supersonically
rotating blades causing erosion [3, 5, 11, 12]. Many researchers discovered the fatalness of this
phenomenon in different other applications. WDE is considered the major factor in pipe wall
thinning phenomenon, which occurs in the drainage systems used at power plants. Thinning of
pipe walls may cause water vapor leakage, leading to major consequences [13, 14]. Moreover,
compressor blades of gas turbines are usually cooled using what is called the fog/mist cooling
systems, where they are subjected to fine water droplets while rotation to reduce the temperature
2
of inlet air [15, 16]. This cooling method is considered as one of the most effective solutions to
improve the efficiency of the gas turbine [16].
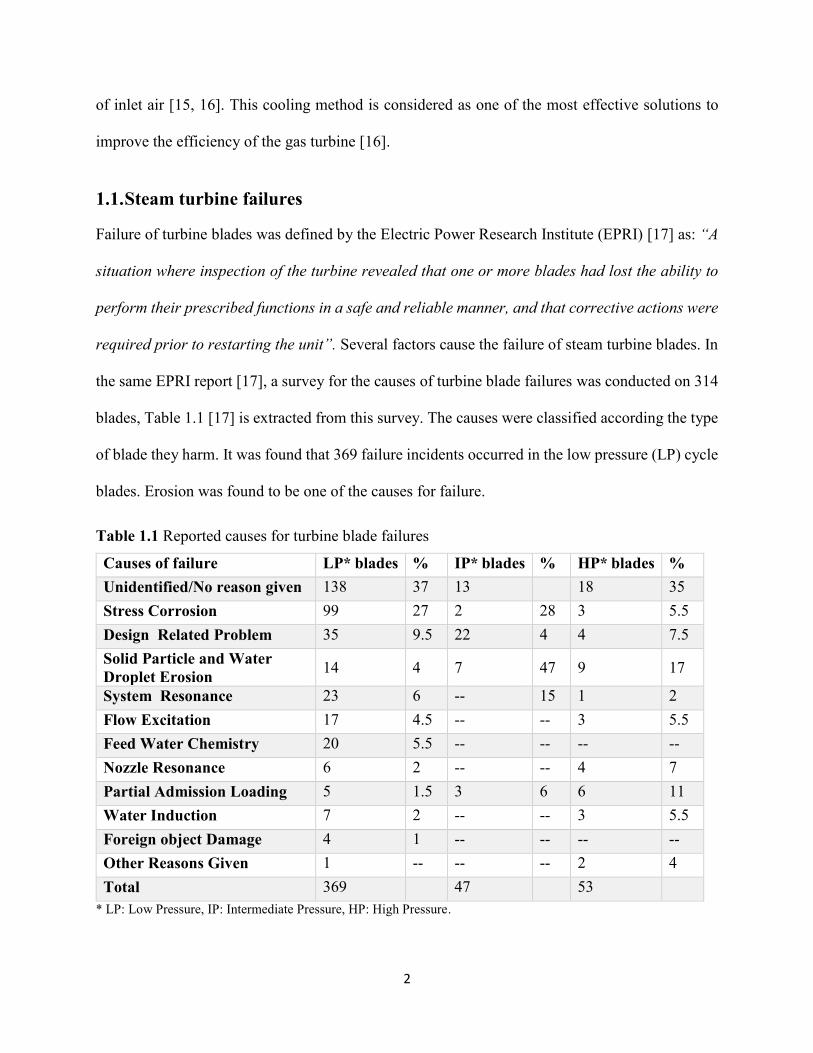
1.1. Steam turbine failures
Failure of turbine blades was defined by the Electric Power Research Institute (EPRI) [17] as: “A
situation where inspection of the turbine revealed that one or more blades had lost the ability to
perform their prescribed functions in a safe and reliable manner, and that corrective actions were
required prior to restarting the unit”. Several factors cause the failure of steam turbine blades. In
the same EPRI report [17], a survey for the causes of turbine blade failures was conducted on 314
blades, Table 1.1 [17] is extracted from this survey. The causes were classified according the type
of blade they harm. It was found that 369 failure incidents occurred in the low pressure (LP) cycle
blades. Erosion was found to be one of the causes for failure.
Table 1.1 Reported causes for turbine blade failures
Causes of failure LP* blades % IP* blades % HP* blades %
Unidentified/No reason given 138 37 13 18 35
Stress Corrosion 99 27 2 28 3 5.5
Design Related Problem 35 9.5 22 4 4 7.5
Solid Particle and Water
Droplet Erosion 14 4 7 47 9 17
System Resonance 23 6 -- 15 1 2
Flow Excitation 17 4.5 -- -- 3 5.5
Feed Water Chemistry 20 5.5 -- -- -- --
Nozzle Resonance 6 2 -- -- 4 7
Partial Admission Loading 5 1.5 3 6 6 11
Water Induction 7 2 -- -- 3 5.5
Foreign object Damage 4 1 -- -- -- --
Other Reasons Given 1 -- -- -- 2 4
Total 369 47 53
* LP: Low Pressure, IP: Intermediate Pressure, HP: High Pressure.
3
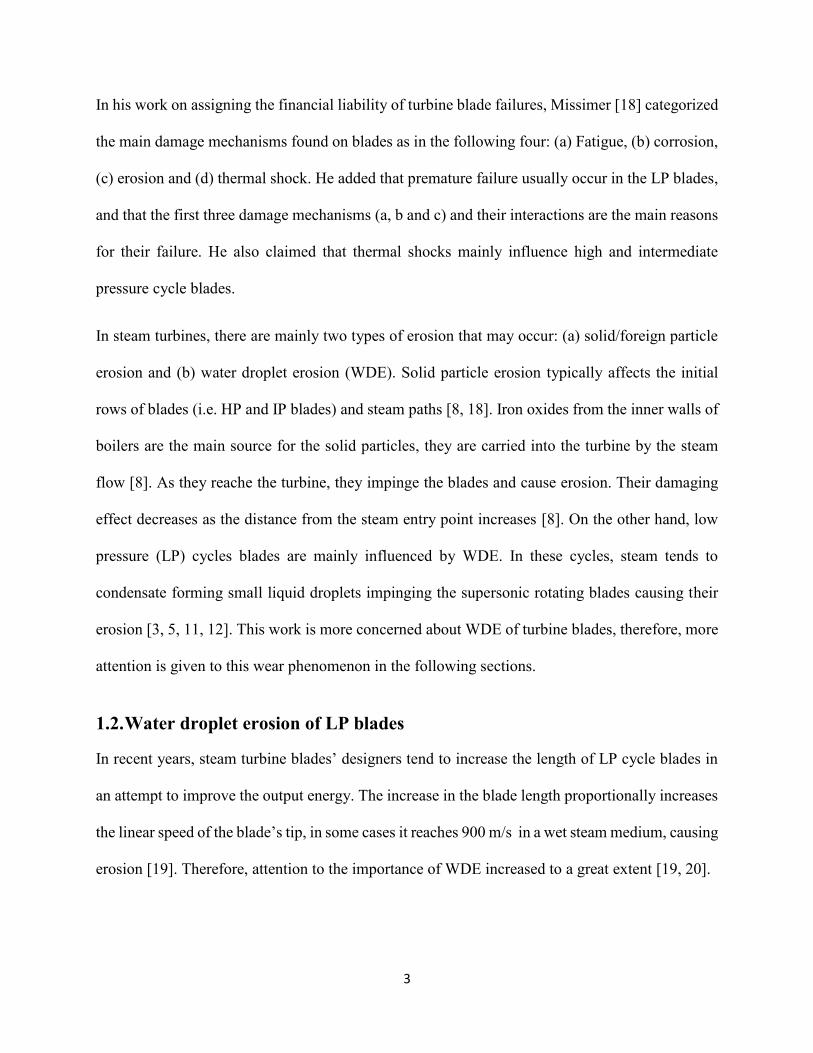
In his work on assigning the financial liability of turbine blade failures, Missimer [18] categorized
the main damage mechanisms found on blades as in the following four: (a) Fatigue, (b) corrosion,
(c) erosion and (d) thermal shock. He added that premature failure usually occur in the LP blades,
and that the first three damage mechanisms (a, b and c) and their interactions are the main reasons
for their failure. He also claimed that thermal shocks mainly influence high and intermediate
pressure cycle blades.
In steam turbines, there are mainly two types of erosion that may occur: (a) solid/foreign particle
erosion and (b) water droplet erosion (WDE). Solid particle erosion typically affects the initial
rows of blades (i.e. HP and IP blades) and steam paths [8, 18]. Iron oxides from the inner walls of
boilers are the main source for the solid particles, they are carried into the turbine by the steam
flow [8]. As they reache the turbine, they impinge the blades and cause erosion. Their damaging
effect decreases as the distance from the steam entry point increases [8]. On the other hand, low
pressure (LP) cycles blades are mainly influenced by WDE. In these cycles, steam tends to
condensate forming small liquid droplets impinging the supersonic rotating blades causing their
erosion [3, 5, 11, 12]. This work is more concerned about WDE of turbine blades, therefore, more
attention is given to this wear phenomenon in the following sections.
1.2. Water droplet erosion of LP blades
In recent years, steam turbine blades’ designers tend to increase the length of LP cycle blades in
an attempt to improve the output energy. The increase in the blade length proportionally increases
the linear speed of the blade’s tip, in some cases it reaches 900 m/s in a wet steam medium, causing
erosion [19]. Therefore, attention to the importance of WDE increased to a great extent [19, 20].
4
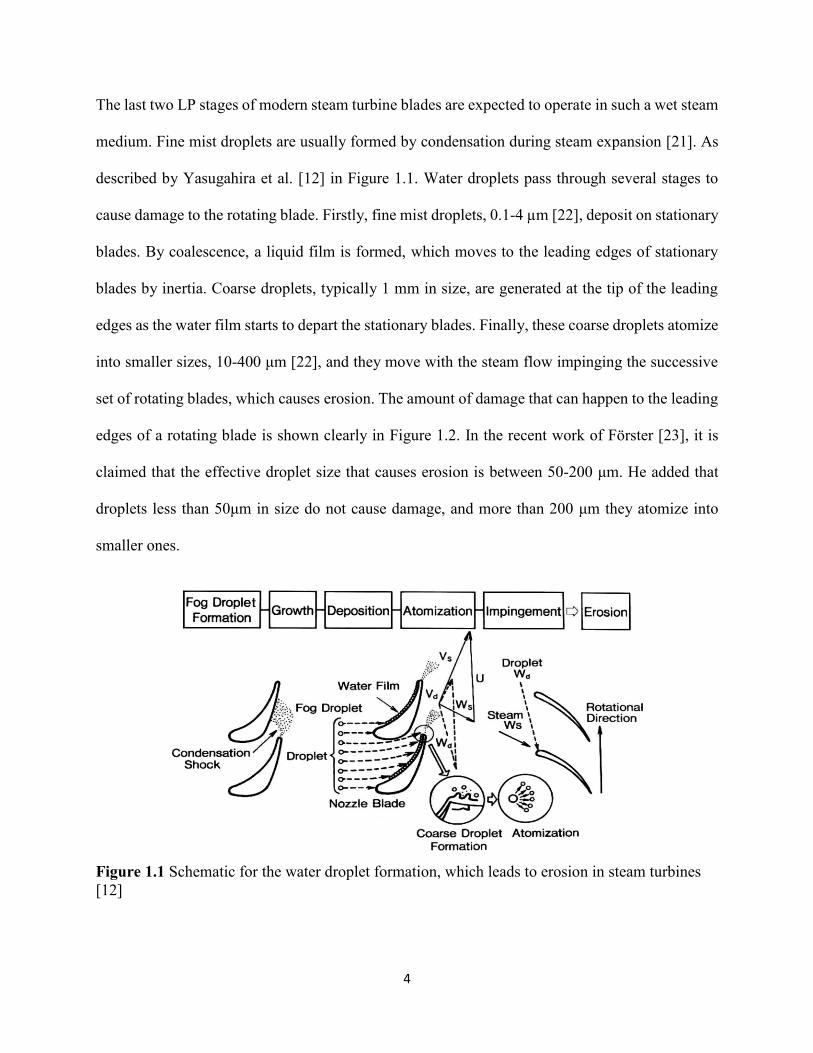
The last two LP stages of modern steam turbine blades are expected to operate in such a wet steam
medium. Fine mist droplets are usually formed by condensation during steam expansion [21]. As
described by Yasugahira et al. [12] in Figure 1.1. Water droplets pass through several stages to
cause damage to the rotating blade. Firstly, fine mist droplets, 0.1-4 µm [22], deposit on stationary
blades. By coalescence, a liquid film is formed, which moves to the leading edges of stationary
blades by inertia. Coarse droplets, typically 1 mm in size, are generated at the tip of the leading
edges as the water film starts to depart the stationary blades. Finally, these coarse droplets atomize
into smaller sizes, 10-400 μm [22], and they move with the steam flow impinging the successive
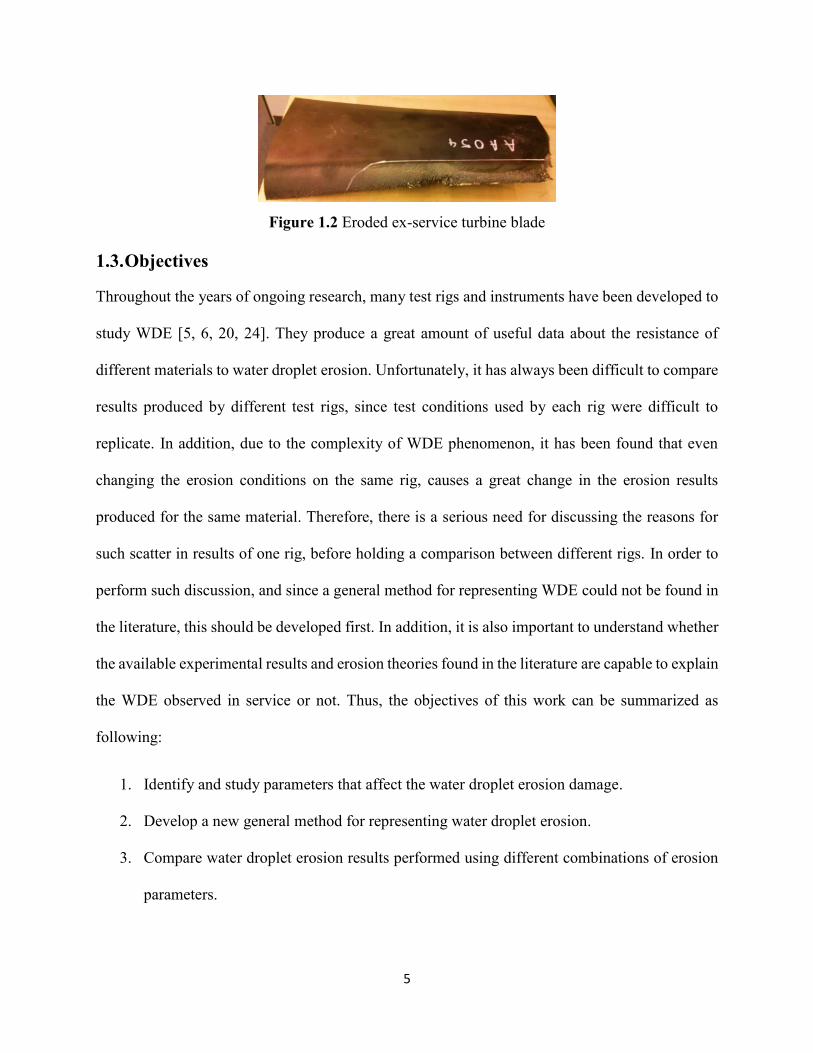
set of rotating blades, which causes erosion. The amount of damage that can happen to the leading
edges of a rotating blade is shown clearly in Figure 1.2. In the recent work of Förster [23], it is
claimed that the effective droplet size that causes erosion is between 50-200 μm. He added that
droplets less than 50μm in size do not cause damage, and more than 200 μm they atomize into
smaller ones.
Figure 1.1 Schematic for the water droplet formation, which leads to erosion in steam turbines
[12]
5
Figure 1.2 Eroded ex-service turbine blade
1.3. Objectives
Throughout the years of ongoing research, many test rigs and instruments have been developed to
study WDE [5, 6, 20, 24]. They produce a great amount of useful data about the resistance of
different materials to water droplet erosion. Unfortunately, it has always been difficult to compare
results produced by different test rigs, since test conditions used by each rig were difficult to
replicate. In addition, due to the complexity of WDE phenomenon, it has been found that even
changing the erosion conditions on the same rig, causes a great change in the erosion results
produced for the same material. Therefore, there is a serious need for discussing the reasons for
such scatter in results of one rig, before holding a comparison between different rigs. In order to
perform such discussion, and since a general method for representing WDE could not be found in
the literature, this should be developed first. In addition, it is also important to understand whether
the available experimental results and erosion theories found in the literature are capable to explain
the WDE observed in service or not. Thus, the objectives of this work can be summarized as
following:
1. Identify and study parameters that affect the water droplet erosion damage.
2. Develop a new general method for representing water droplet erosion.
3. Compare water droplet erosion results performed using different combinations of erosion
parameters.

6
4. Study the erosion damage of low pressure ex-service steam turbine blades, in an attempt to
correlate results generated by erosion experiments to the WDE encountered in real life.
7
2. The water droplet erosion phenomenon
2.1. Time dependence of WDE
WDE is described as a time dependent phenomenon, mainly because of its nonlinear progression.
This time dependent behavior makes it difficult to find an accurate long-term prediction for the
resulting damage [10]. The erosion damage in early stages can be explained easily to be the result
of surface initial conditions, and the fatigue-like failure mechanism due to successive water droplet
impacts. As erosion progresses, the rate of mass loss (erosion rate) decreases. Researchers [1, 3,
11] have tried to understand what causes the reduction of the mass loss rate during the erosion
process. Honegger [1] explained that upon successive impacts, erosion is formed on the surface.
As soon as the damage reaches a certain depth, a liquid film forms on the surface, which damps
following impacts. Heymann [11] proposed another theory to describe this decline in the erosion
rate. He claimed that some geometrical aspects play a significant role in the decline of the erosion
rate, these aspects will be discussed later in this chapter.
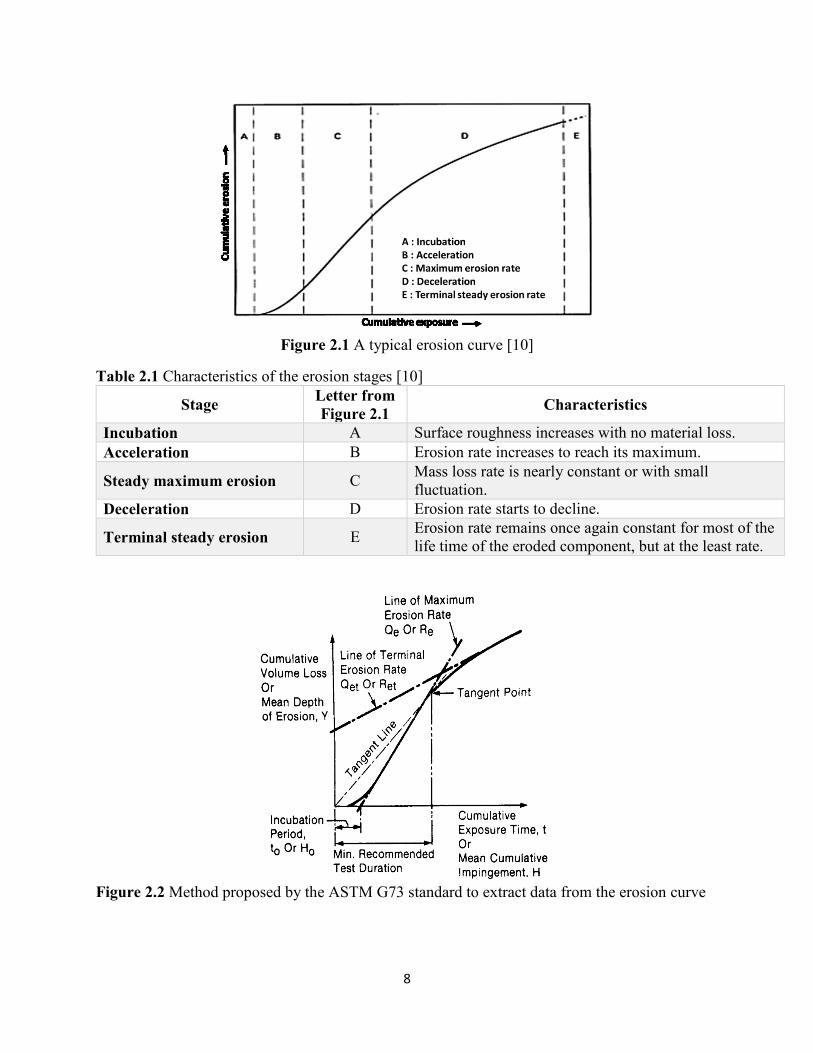
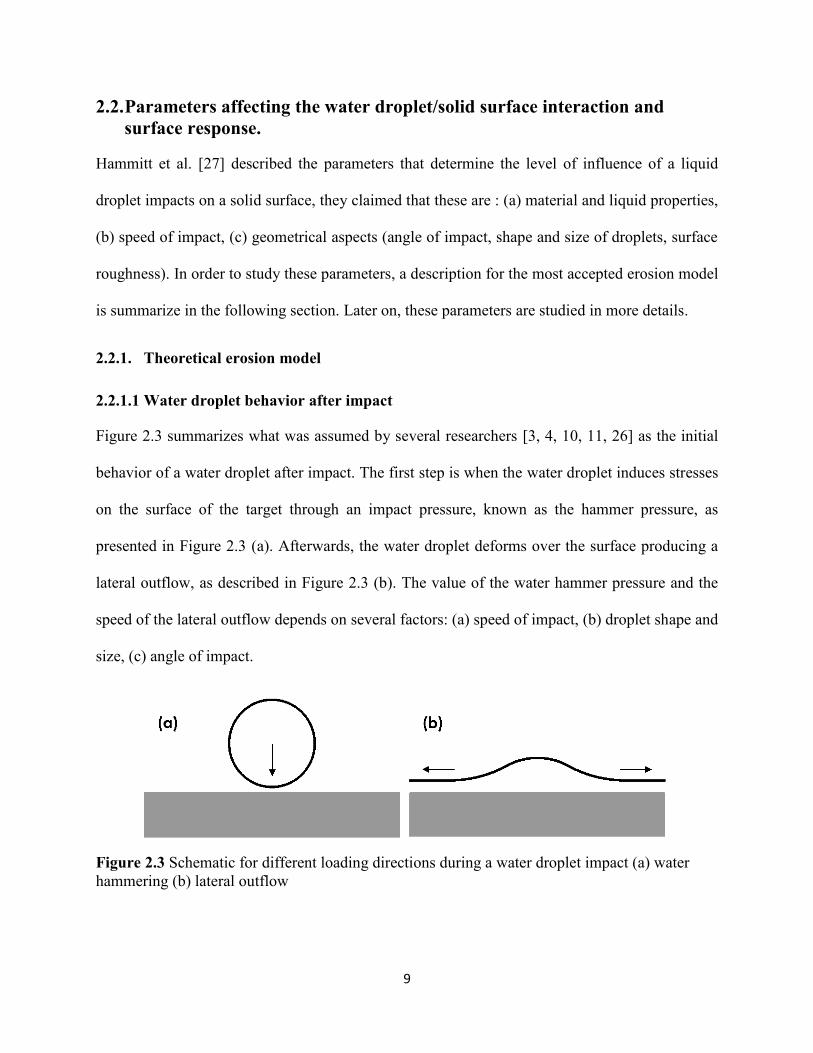
According to the ATSM standard G73-10 and Heymann [10, 25], a typical erosion curve is usually
divided into five stages, as shown in Figure 2.1. In Table 2.1 the definition of stages are presented.
In addition, the ASTM G73-10 standard [25] proposed a method to extract data from the erosion
curve as illustrated in Figure 2.2.
According to the literature [3, 9, 26, 27], as the water droplet impacts a solid surface, two aspects
should be considered. The first aspect is concerned with the interaction between the water droplet
and the solid target, as the droplet impacts the surface. The second aspect is the surface response
to this impact. Each aspect has its influencing parameters. These aspects are studied in more details
in the following section.
8
Figure 2.1 A typical erosion curve [10]
Table 2.1 Characteristics of the erosion stages [10]
Stage Letter from
Figure 2.1 Characteristics
Incubation A Surface roughness increases with no material loss.
Acceleration B Erosion rate increases to reach its maximum.
Steady maximum erosion C Mass loss rate is nearly constant or with small
fluctuation.
Deceleration D Erosion rate starts to decline.
Terminal steady erosion E Erosion rate remains once again constant for most of the
life time of the eroded component, but at the least rate.
Figure 2.2 Method proposed by the ASTM G73 standard to extract data from the erosion curve
9
2.2. Parameters affecting the water droplet/solid surface interaction and
surface response.
Hammitt et al. [27] described the parameters that determine the level of influence of a liquid
droplet impacts on a solid surface, they claimed that these are : (a) material and liquid properties,
(b) speed of impact, (c) geometrical aspects (angle of impact, shape and size of droplets, surface
roughness). In order to study these parameters, a description for the most accepted erosion model
is summarize in the following section. Later on, these parameters are studied in more details.
2.2.1. Theoretical erosion model
2.2.1.1 Water droplet behavior after impact
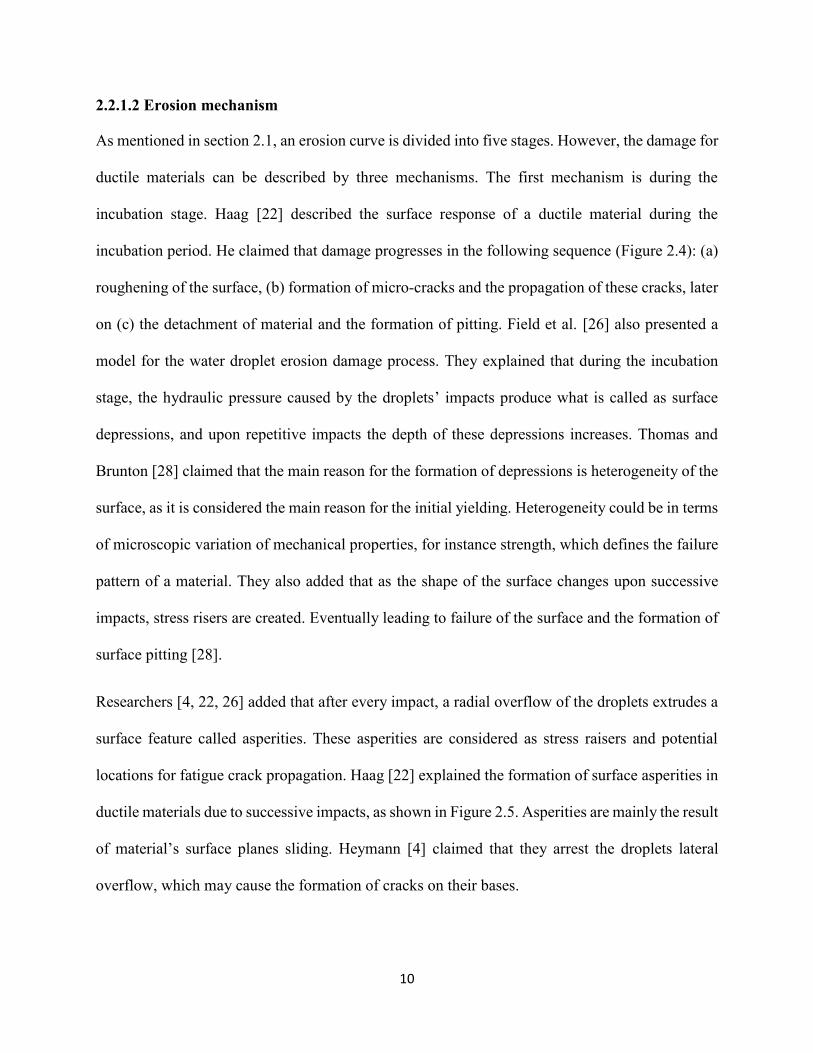
Figure 2.3 summarizes what was assumed by several researchers [3, 4, 10, 11, 26] as the initial
behavior of a water droplet after impact. The first step is when the water droplet induces stresses
on the surface of the target through an impact pressure, known as the hammer pressure, as
presented in Figure 2.3 (a). Afterwards, the water droplet deforms over the surface producing a
lateral outflow, as described in Figure 2.3 (b). The value of the water hammer pressure and the
speed of the lateral outflow depends on several factors: (a) speed of impact, (b) droplet shape and
size, (c) angle of impact.
Figure 2.3 Schematic for different loading directions during a water droplet impact (a) water
hammering (b) lateral outflow
10
2.2.1.2 Erosion mechanism
As mentioned in section 2.1, an erosion curve is divided into five stages. However, the damage for
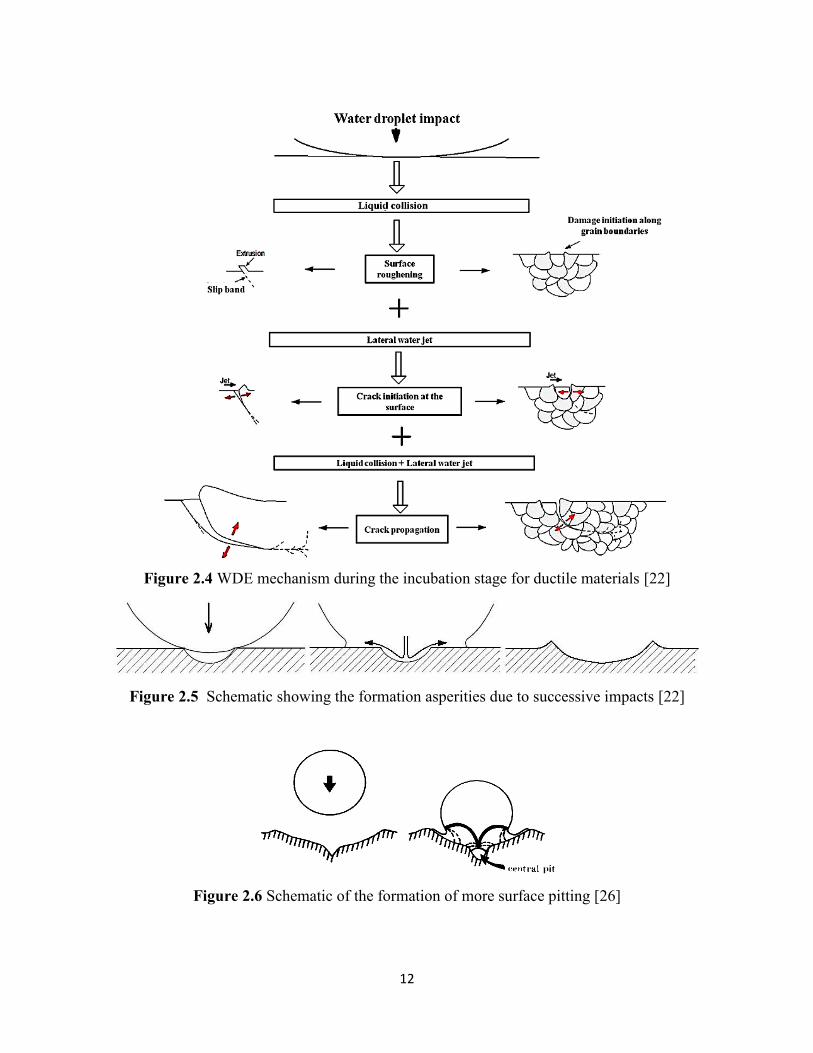
ductile materials can be described by three mechanisms. The first mechanism is during the
incubation stage. Haag [22] described the surface response of a ductile material during the
incubation period. He claimed that damage progresses in the following sequence (Figure 2.4): (a)
roughening of the surface, (b) formation of micro-cracks and the propagation of these cracks, later
on (c) the detachment of material and the formation of pitting. Field et al. [26] also presented a
model for the water droplet erosion damage process. They explained that during the incubation
stage, the hydraulic pressure caused by the droplets’ impacts produce what is called as surface
depressions, and upon repetitive impacts the depth of these depressions increases. Thomas and
Brunton [28] claimed that the main reason for the formation of depressions is heterogeneity of the
surface, as it is considered the main reason for the initial yielding. Heterogeneity could be in terms
of microscopic variation of mechanical properties, for instance strength, which defines the failure
pattern of a material. They also added that as the shape of the surface changes upon successive
impacts, stress risers are created. Eventually leading to failure of the surface and the formation of
surface pitting [28].
Researchers [4, 22, 26] added that after every impact, a radial overflow of the droplets extrudes a
surface feature called asperities. These asperities are considered as stress raisers and potential
locations for fatigue crack propagation. Haag [22] explained the formation of surface asperities in
ductile materials due to successive impacts, as shown in Figure 2.5. Asperities are mainly the result
of material’s surface planes sliding. Heymann [4] claimed that they arrest the droplets lateral
overflow, which may cause the formation of cracks on their bases.
11
As the erosion progresses, the second damage mechanism steps in. The number of cracks increases
and they start to coalesce forming loose material fragments. Further impacts cause the detachment
of these fragments increasing the erosion rate, and form large surface pits [4, 10, 22, 26]. These
large pits increase in number, and they merge forming an erosion crater causing a high erosion
rate.
Later on, Field [26] and Heymann [3] described the third damage mechanism. Field [26] explained
that as the depth of the formed crater increases, the angle between the droplet’s free surface and
the material surface reaches a critical value. When this angle is reached, most of the impact is
concentrated in the form of high pressure at center of the craters depression causing the formation
of deeper pits, as illustrated in Figure 2.6. Heymann [3] also noted that this damage mechanism is
the reason for the decline in the erosion rate. He stated that if the damage is large enough exceeding
the size of the droplet, the effect of impact is attenuated. He attributed this attenuation effect to
two factors. Firstly, the impact itself may often occur on a sloping surface. Secondly, the lateral
outflow will be disrupted and contained with less shearing effect.
As explained by Hammitt et al. [27], erosion from a material perspective depends on several
parameters. He grouped these parameters into two groups: (a) mechanical properties of the
material and (b) surface conditions.
12
Figure 2.4 WDE mechanism during the incubation stage for ductile materials [22]
Figure 2.5 Schematic showing the formation asperities due to successive impacts [22]
Figure 2.6 Schematic of the formation of more surface pitting [26]
13
2.2.2 Erosion parameters
In this section, parameters affecting the erosion process due to liquid droplet and solid surface
interaction are discussed in more detail.
2.2.2.1 Impact speed
In the literature, several researchers [3, 21, 27, 29-31] considered the impact speed as the main
parameter influencing the amount of energy transferred to the solid surface. Also, experimental
results [1, 6, 20, 31] indicated that the WDE rate and the damage mechanism change significantly
at different impact speeds. For an example, Lee et al. [21] stated that the volume loss increases
exponentially with increasing the impact speed, and that the erosion rate is proportional to the
impact speed raised to the 5th power. Researchers [3, 10, 26, 32-34] studied the influence of the
impact speed on three erosion parameters: (a) water hammer pressure, (b) radial outflow, (c)
erosion rate.
a) Water Hammer pressure
Heymann [10] proposed an equation that describes the relation between the impact speed and the
water hammer pressure:
𝑃 = 𝜌𝐶𝑜𝑉(1 +𝐾𝑉
𝐶𝑜) (2.1)
Where ρ is the liquid density, 𝐶𝑜 is the acoustic velocity of liquid, V is the impact speed and K=2
for water. He also gave an example of the induced pressure due to an impact speed of 500 m/s, as
1250 MPa, which is higher than the yield strength of most of known metals. In modern steam
turbines, the peripheral linear speed of the tip of the blade may reach to speeds up to 900 m/s,
which is usually considered as the impact speed as an approximation [19]. It is clear in Heymann’s
equation that he neglected the effect of the droplet size.
14
b) Radial outflow
Researchers investigated the magnitude of the lateral outflow speed [3, 32, 33, 35]. Engel [32] and
Jenkins et al. [35] assumed that the radial outflow speed should be in the order of several times of
the impact speed :
𝑉𝑅 = √2𝐶𝑉𝑜 (2. 2)
Where 𝑉𝑅 is the radial outflow speed, 𝐶 is the acoustic velocity of the tested substrate, 𝑉𝑜 is the
impact speed. Heymann [3] confirmed their formula and he added that using the laws of energy
conservation, the total kinetic energy of a water droplet cannot be greater than 1
2 𝑚 𝑉𝑜
2. Therefore,
only a small portion of the liquid is accelerated to reach a speed of 𝑉𝑅, while the other potion of
the liquid should be decelerated to a speed less than 𝑉𝑜.
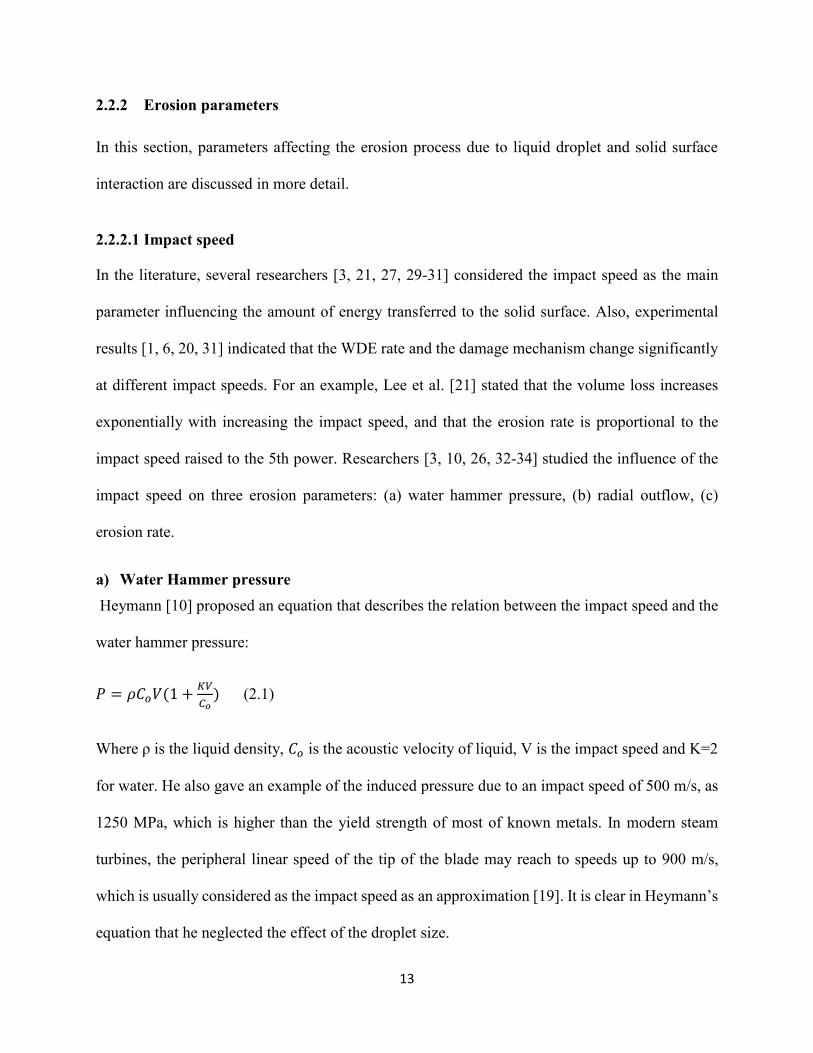
On the other hand, Bowden and Brunton [33] presented another equation that described the outflow
speed:
𝑉𝑅 = 𝑉𝑜 cot𝛽
2 (2.3)
Where β was defined as the angle between the inclined liquid surface and the originally flat solid
surface, as shown in the Figure 2.7 presented by Field et al. [26].
Figure 2.7 Angle between the water droplet inclined surface and the solid surface [26]
15
c) Erosion rate
Several models were developed to relate the erosion rate (ER) to the impact speed. These models
were summarized by Heymann [3] in the following 3 equations:
𝐸𝑅 = 𝑎𝑉𝑜𝑛 (2.4)
𝐸𝑅 = 𝑎(𝑉𝑜 − 𝑉𝑐)𝑛 (2.5)
𝐸𝑅 = 𝑎𝑒𝑛𝑉𝑜 (2.6)
Where ER is the maximum erosion rate, 𝑉𝑜 is the impact velocity, 𝑉𝑐 represents the threshold
velocity, in addition a and n are constants. Equation (2.4) is most commonly used to represent the
relation between the erosion rate and impact speed. However, it implies that WDE takes place
regardless how low the impact speed is. Whilst, the common thought is that there is a critical or
threshold velocity called 𝑉𝑐, below which erosion does not take place. Therefore, an erosion-
velocity relationship based on this concern was developed, and shown in Equation (2.5), to fit the
experimental data. Nevertheless, it was not as accurate in its representation of the experimental
results as Equation (2.4), in the usual range of impact speeds (1.5 < 𝑉𝑜
𝑉𝑐 <3) [3]. Another relationship
based on the analogy of fatigue is Equation (2.6); however, it was not referred to in the literature
as much as the first two equations [36].
2.2.2.2 Droplet size and shape
Droplet size and its shape are important impingement parameters. Unlike impact velocity, the
magnitude of impact pressure was defined as independent of the droplet size or shape [3, 10].
However, their influence on the erosion damage was observed in several experimental works [1,
37, 38]. Honegger et al. [1] carried out erosion experiments using 0.5 and 1.5 mm jets and they
reported significant difference in the erosion damage. The difference was function of the impact
16
velocity, as a higher difference was observed at the lower velocities. Heymann [39] compared the
erosion damage caused by six different jet diameters ranging from 1 to 2.5 mm. He reported no
considerable difference in the maximum erosion rates. However, for the jet diameters less than 1.6
mm, the incubation period increased considerably by decreasing jet diameter. In their study,
Hancox and Brunton [37] confirmed Heymann’s [39] results, as they showed that for droplets
smaller than 1 mm, the size matters. In addition, DeCorso [40] stated that there are two conditions,
if both were met, the droplet size will cease to have an effect on the erosion damage: (a) the same
volume of water is impinging the sample, (b) the samples are tested at speeds higher than the
threshold speed of no damage. Recently, Hattori et al. [14] and Ahmad et al. [15] reported that the
erosion rates of Aluminum and Ti6Al4V are directly proportional to the droplet diameter raised to
the power of 4.7 and 2.5, respectively.
Moreover, it is also believed that the droplet shape has an effect on the damage caused by water
droplet erosion. Adler [41] claimed that the damage caused by a water droplet is strongly
dependent on the radius of curvature at the point of contact; therefore, distorted droplets with larger
radius of curvature than their initial size would cause greater damage.
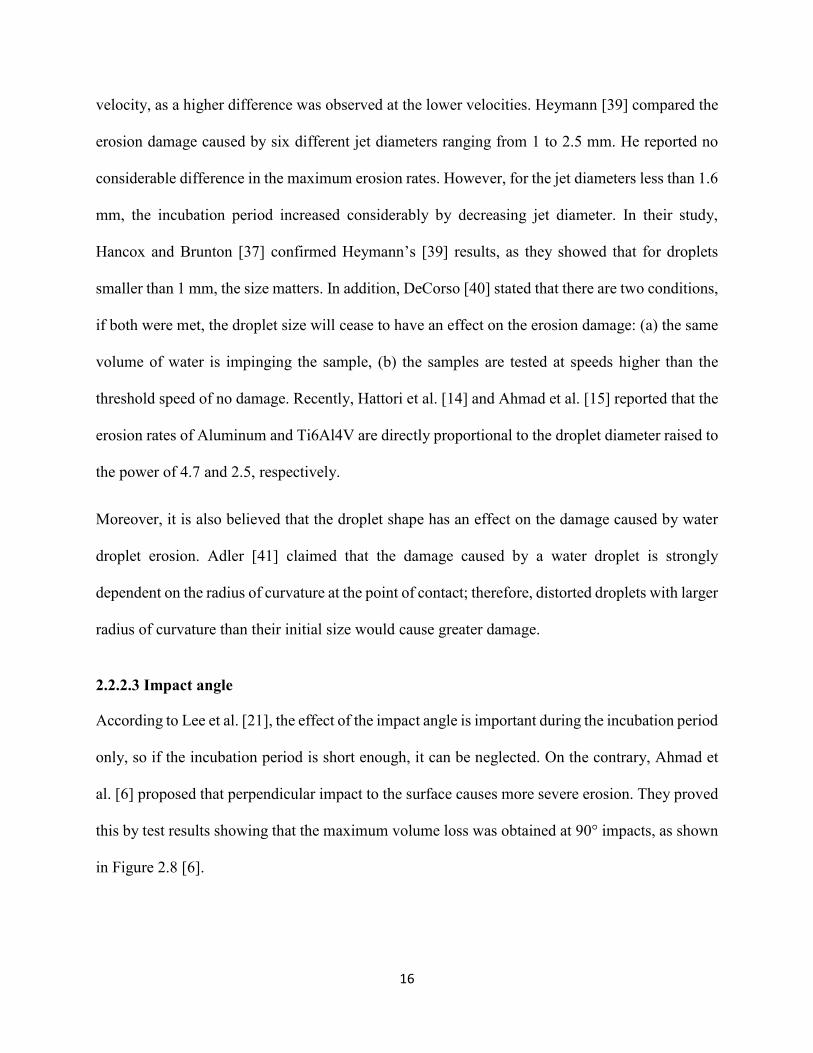
2.2.2.3 Impact angle
According to Lee et al. [21], the effect of the impact angle is important during the incubation period
only, so if the incubation period is short enough, it can be neglected. On the contrary, Ahmad et
al. [6] proposed that perpendicular impact to the surface causes more severe erosion. They proved
this by test results showing that the maximum volume loss was obtained at 90° impacts, as shown
in Figure 2.8 [6].
17
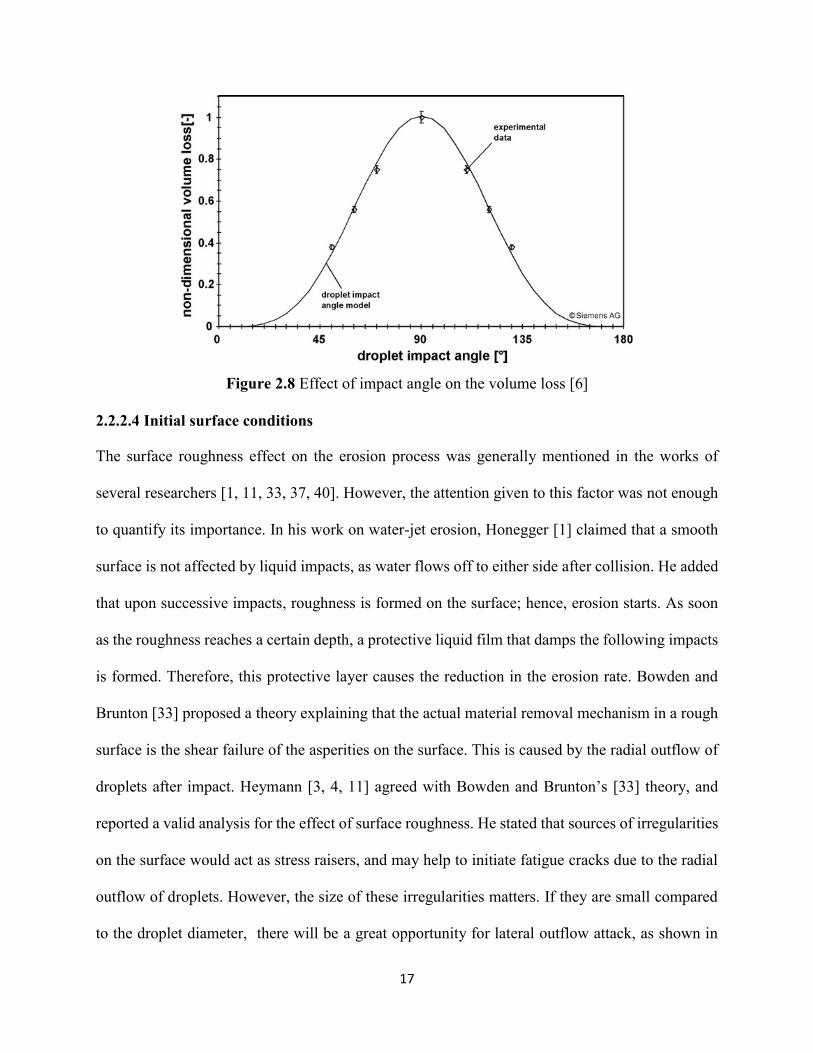
Figure 2.8 Effect of impact angle on the volume loss [6]
2.2.2.4 Initial surface conditions
The surface roughness effect on the erosion process was generally mentioned in the works of
several researchers [1, 11, 33, 37, 40]. However, the attention given to this factor was not enough
to quantify its importance. In his work on water-jet erosion, Honegger [1] claimed that a smooth
surface is not affected by liquid impacts, as water flows off to either side after collision. He added
that upon successive impacts, roughness is formed on the surface; hence, erosion starts. As soon
as the roughness reaches a certain depth, a protective liquid film that damps the following impacts
is formed. Therefore, this protective layer causes the reduction in the erosion rate. Bowden and
Brunton [33] proposed a theory explaining that the actual material removal mechanism in a rough
surface is the shear failure of the asperities on the surface. This is caused by the radial outflow of
droplets after impact. Heymann [3, 4, 11] agreed with Bowden and Brunton’s [33] theory, and
reported a valid analysis for the effect of surface roughness. He stated that sources of irregularities
on the surface would act as stress raisers, and may help to initiate fatigue cracks due to the radial
outflow of droplets. However, the size of these irregularities matters. If they are small compared
to the droplet diameter, there will be a great opportunity for lateral outflow attack, as shown in
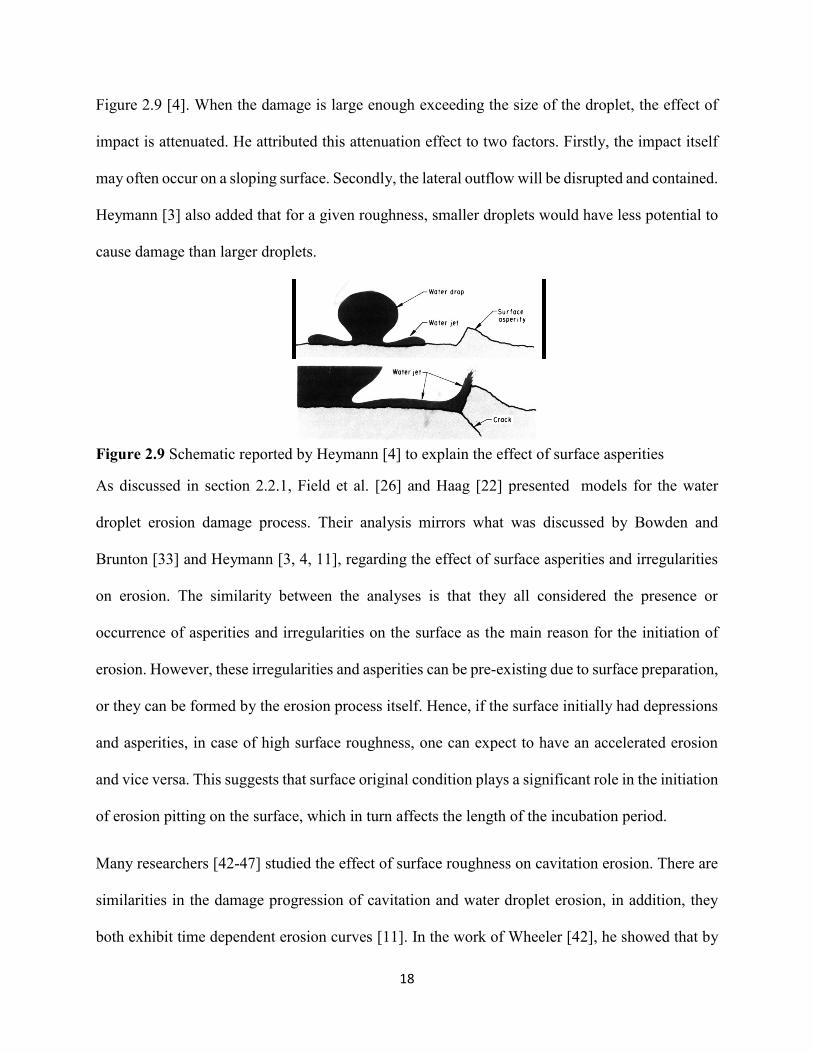
18
Figure 2.9 [4]. When the damage is large enough exceeding the size of the droplet, the effect of
impact is attenuated. He attributed this attenuation effect to two factors. Firstly, the impact itself
may often occur on a sloping surface. Secondly, the lateral outflow will be disrupted and contained.
Heymann [3] also added that for a given roughness, smaller droplets would have less potential to
cause damage than larger droplets.
Figure 2.9 Schematic reported by Heymann [4] to explain the effect of surface asperities
As discussed in section 2.2.1, Field et al. [26] and Haag [22] presented models for the water
droplet erosion damage process. Their analysis mirrors what was discussed by Bowden and
Brunton [33] and Heymann [3, 4, 11], regarding the effect of surface asperities and irregularities
on erosion. The similarity between the analyses is that they all considered the presence or
occurrence of asperities and irregularities on the surface as the main reason for the initiation of
erosion. However, these irregularities and asperities can be pre-existing due to surface preparation,
or they can be formed by the erosion process itself. Hence, if the surface initially had depressions
and asperities, in case of high surface roughness, one can expect to have an accelerated erosion
and vice versa. This suggests that surface original condition plays a significant role in the initiation
of erosion pitting on the surface, which in turn affects the length of the incubation period.
Many researchers [42-47] studied the effect of surface roughness on cavitation erosion. There are
similarities in the damage progression of cavitation and water droplet erosion, in addition, they
both exhibit time dependent erosion curves [11]. In the work of Wheeler [42], he showed that by
19
periodic polishing of the surface, erosion can be kept indefinitely in the incubation stage.
Karunamurthy et al. [43] and Litzow and Johannes [44] claimed that cavitation erosion is directly
proportional to surface roughness. Dullias and Zum Gahr [45] indicated that the wear loss during
reciprocating sliding and cavitation erosion decreases by decreasing the initial surface roughness.
Tomlinson and Talks [46] discussed the effect of increasing surface roughness by electrochemical
salt water corrosion of cast iron, and found that it reduces the cavitation erosion resistance,
especially, decreasing the length of the incubation stage. In addition, Espitia and Toro [47],
recorded the increase of surface roughness of stainless steel during the incubation stage of
cavitation erosion through topographical measurement. The work of Espitia and Toro [47] is
similar to what was presented by Tobin et al. [48] on water droplet erosion. Tobin et al. [48]
recorded the increase of surface roughness during their experiments using topographical
measurement as well. According to the reported results [42-48], and due to the similarity in the
erosion progression of both wear problems, it should be expected that the initial surface roughness
would affect resistance to water droplet erosion as it affects that of cavitation erosion.
Two experimental works were reported in the literature that held direct comparisons between the
effect of different initial surface qualities on the water droplet erosion behavior [37, 40]; however,
these experiments were mainly done using water-jets not actual water droplets. Firstly, Hancox
and Brunton [37] used a jet of 1.3 mm diameter and impact speeds of 60 m/s and 90 m/s to study
the effect of the initial surface roughness on the erosion behavior for two different materials, poly
methyl methacrylate and 18/8 stainless steel. A range of abrasive particle sizes, 1 µm to 37 µm,
were used to prepare the surfaces of the samples. It has been claimed that coarse polishing of the
samples increase the erosion rate. A drawback of their work is the low impact speed used for
eroding the stainless steel samples, 90 m/s, which is considered unpractical, if compared to the
20
actual in-service conditions of most WDE applications [15, 19]. Secondly, DeCorso [40] studied
the erosion behavior of two stellite alloys, 6% and 12% Cr. The surfaces of the studied samples
were prepared by two methods: mechanical-polishing and electro-polishing. The aim of this study
[40] was not to determine the effect of initial surface roughness of samples on the erosion damage,
but to study the effect of surface working due to mechanical polishing on the damage. It was
implied from the text that the surface roughness of the samples was less than 0.5 µm on average.
Samples were tested using the single shot technique at water-jet velocities up to 1060 m/s and jet
diameters up to 1.5 mm. The reported results were based on the measurement of dimensions of the
erosion crater at the end of each experiment. It was concluded that changing the polishing
technique did not have a significant effect on the erosion damage of both of the tested alloys. It is
worth mentioning that DeCorso [40] did not explicitly study the effect of using different polishing
techniques on WDE; however, it was only an issue he briefly raised.
2.2.2.5 Mechanical properties
Hardness, yield and ultimate strength, modulus of elasticity, ultimate resilience, toughness,
hardenability, and fracture toughness are the mechanical properties which were found to play roles
in erosion damage [10, 39, 49]. It was always difficult to choose a mechanical property as the only
index for erosion resistance. Hardness is the most common property that was related to the
difference in erosion performance of materials. Heymann [39] reported that erosion resistance of
metals is directly proportional to hardness raised to the power of 2.5. Moreover, he claimed [39]
that the WDE performance was directly proportional to an empirical value that is the product of
strength and modulus of elasticity, (𝜎𝑢2𝐸)2/3. Hence, the higher the strength and modulus of
elasticity, the higher the erosion resistance. However, such values can be assumed as primary
21
indications for the erosion performance. To study the WDE behavior, testing the erosion resistance
of materials is still the most accurate approach.
2.3 Erosion representation and test rigs
2.3.1 Erosion representation
Several mathematical equations were proposed to represent the WDE behaviour. Some of these
equations were based on the similarity between fatigue damage and erosion process [3, 31].
Another equation was based on correlating the essential erosion parameters with the erosion rate
[21]. Other equations tried to link the erosion damage to the applied energy flux to the surface [27,
50, 51]. The following section presents some of the attempts to relate the WDE behaviour to
materials properties using the energy flux approach.
2.3.1.1 Energy balance of water droplet erosion.
Due to the high plastic deformation encountered in the erosion process, it was logical that several
scientists [27, 50, 51] attempted to balance the energy involved in it, in order to relate erosion to
materials’ properties. The main obstacle that confounded researchers in this endeavor, was the
quantification of the amount of energy transferred to the solid surface after the droplets’
impingements.
One of the early attempts to explain the energy balance was the work done by Hoff et al. [50, 51].
They worked on the rain erosion problem. In their work, they developed a formula for a term called
erosion strength, ƒ, defined as a ratio between the applied energy flux and the volumetric material
loss. Hoff et al. [50, 51] made several assumptions for their equation for the erosion strength (ƒ).
They claimed that energy absorption by a solid surface is governed by a factor (𝜆), which can be
divided into two parts. The first part monotonically depends on the applied impact pressure, and
22
the second part depends on the sound impedances of both the target material and water. The final
formula for, 𝑓, is a combination of several functions that satisfied their assumptions. Heymann [3]
disputed their final formula, since it was more concerned with the response of the material, and
totally neglected the question of what portion of impact energy (𝐸) was actually applied on the
surface target material due to the impact. In addition, the formula neglected the fact that part of
the impact energy dissipates, for instance, through the subdivision of the water droplet into smaller
ones during impact, and may not affect the target material’s surface.
Later on, Hammitt et al. [27] worked more on Hoff’s basic energy flux model. They developed
an equation based on the relation between the mean depth of erosion penetration (MDPR) and the
applied kinetic energy. Moreover, they named a factor, ξ, defined as the efficiency of energy
transfer between the impinging droplet and the solid surface. It was mentioned in their work that
this efficiency will be function of several factors, including: (a) liquid and solid material properties,
mainly the acoustic impedance; (b) the geometric aspects of both the surface and the impinging
droplets (droplet shape, impingement angle, surface roughness); (c) the velocity of impingement.
However, they did not develop a formula that describes this efficiency.
Similar analysis was done by Heymann [3], he admitted that the liquid/solid energy balance was
very complex. He elaborated on the distribution of the droplet’s kinetic energy after impingement,
and claimed that: (a) part of the energy will remain as kinetic energy of the lateral outflow after
the impingement; (b) another part will be dissipated in the form of pressure waves inside of the
droplet itself; (c) the last part will be absorbed by the target material. Heymann [3] also added that
the amount of energy transferred to the solid surface is a function, not only, of the mass and speed
of the impinging droplets, but also, the behavior of the droplet after impingement. The water
23
droplet behavior after impingement means the change in size and shape of the liquid droplet after
impingement, and its possible subdivision into smaller droplets.
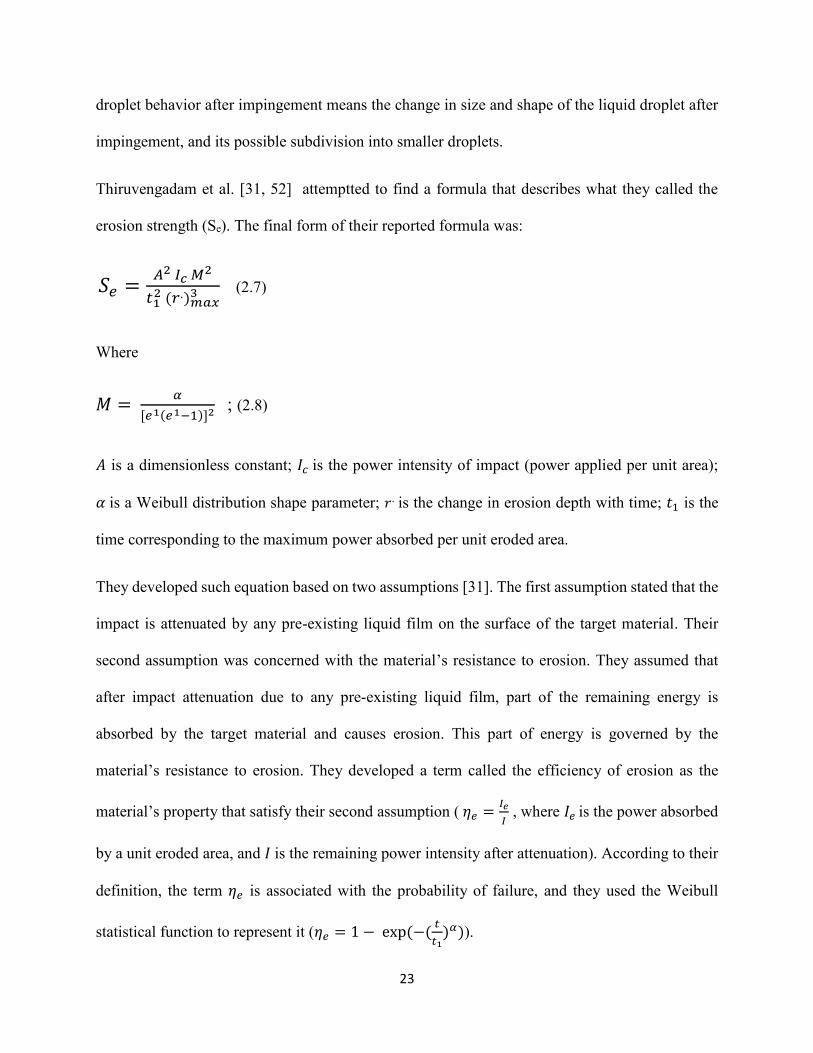
Thiruvengadam et al. [31, 52] attemptted to find a formula that describes what they called the
erosion strength (Se). The final form of their reported formula was:
𝑆𝑒 =𝐴2 𝐼𝑐 𝑀2
𝑡12 (𝑟.)𝑚𝑎𝑥
3 (2.7)
Where
𝑀 = 𝛼
[𝑒1(𝑒1−1)]2 ; (2.8)
𝐴 is a dimensionless constant; 𝐼𝑐 is the power intensity of impact (power applied per unit area);
𝛼 is a Weibull distribution shape parameter; 𝑟 . is the change in erosion depth with time; 𝑡1 is the
time corresponding to the maximum power absorbed per unit eroded area.
They developed such equation based on two assumptions [31]. The first assumption stated that the
impact is attenuated by any pre-existing liquid film on the surface of the target material. Their
second assumption was concerned with the material’s resistance to erosion. They assumed that
after impact attenuation due to any pre-existing liquid film, part of the remaining energy is
absorbed by the target material and causes erosion. This part of energy is governed by the
material’s resistance to erosion. They developed a term called the efficiency of erosion as the
material’s property that satisfy their second assumption ( 𝜂𝑒 =𝐼𝑒
𝐼 , where 𝐼𝑒 is the power absorbed
by a unit eroded area, and 𝐼 is the remaining power intensity after attenuation). According to their
definition, the term 𝜂𝑒 is associated with the probability of failure, and they used the Weibull
statistical function to represent it (𝜂𝑒 = 1 − exp (−(𝑡
𝑡1)𝛼)).
24
Although all of these approaches are more than 40 years old now, none of them proved to be a
general representation for what is so called the erosion strength. The reason for this might have
been the lack of accurate and consistent water erosion measurements during that time, in addition
to the methods used to report water droplet erosion results, which will be discussed in the following
section.
2.3.1.2 Methods used to report WDE experimental results and their drawbacks
According to the ASTM G73-10 standard [25], erosion is usually reported as a plot between the
cumulative erosion and the cumulative periodic interruption of the test to weigh the samples
(cumulative exposure). Exposure could be any physical quantity which is a function of the test
duration. In the literature, there were not many quantities used as cumulative exposure. This is due
to the lack of accurate measurement of such quantities. For instance, Thiruvengadam et al. [31,
52] expressed exposure in terms of erosion test time, which neither presented the exact amount of
water involved in the impingement, nor took the droplet size into consideration. Therefore, their
quantitative calculations for the power transmission to the samples during the test were based on
rough estimates of the amount of water impinging the surface. In the work of Hoff et al. [51],
exposure was expressed in terms of exposure time too, with no indication to the size of water
droplets used or the effective amount actually causing the erosion. It was mentioned in their work
that the droplets had a wide size distribution. In the recent work done by Kamkar et al. [53],
exposure was referred to as number of cycles, or the frequency of rotation multiplied by cumulative
time. Moreover, Ahmad et al. [6, 38] reported exposure as time. Therefore, one of the main issues
with the previous works, is how they reported cumulative exposure that cause the erosion damage.
Recently, in their work Ryzhenkov et al. [19] claimed that for a well-defined erosion experiment
the following parameters should be measured and identified: (a) impingement speed; (b) droplet
25
size distribution; (c) number of impinging liquid particles. In this thesis, these recommendations
were considered, and a new method has been proposed to represent and compare test results at
different erosion conditions. This new method used the applied kinetic energy of impact per area
as the exposure axis, as it includes all of the important erosion test parameters (i.e. impact speed,
droplet size, and number of droplets per impact, therefore the effective amount of water) in its
equation, the method is discussed in chapter 5.
2.3.2 WDE test rigs in the literature
Early experimental attempts to study water erosion can be traced back to the early 20th century [1,
2]. The usual way to test the WDE properties of a certain material is to attach a specimen to a
rotating arm or disk, and subject the rotating specimen to a water jet, spray or even simulated rain
drops. Normally specimens are disassembled from the rotating component of the test rig after
different intervals of testing. Specimens are weighed and compared to previous weight
measurement in order to indicate the weight loss after every testing cycle [5, 25]. Based on the
mentioned testing methodology several very different test rigs were built in research laboratories.
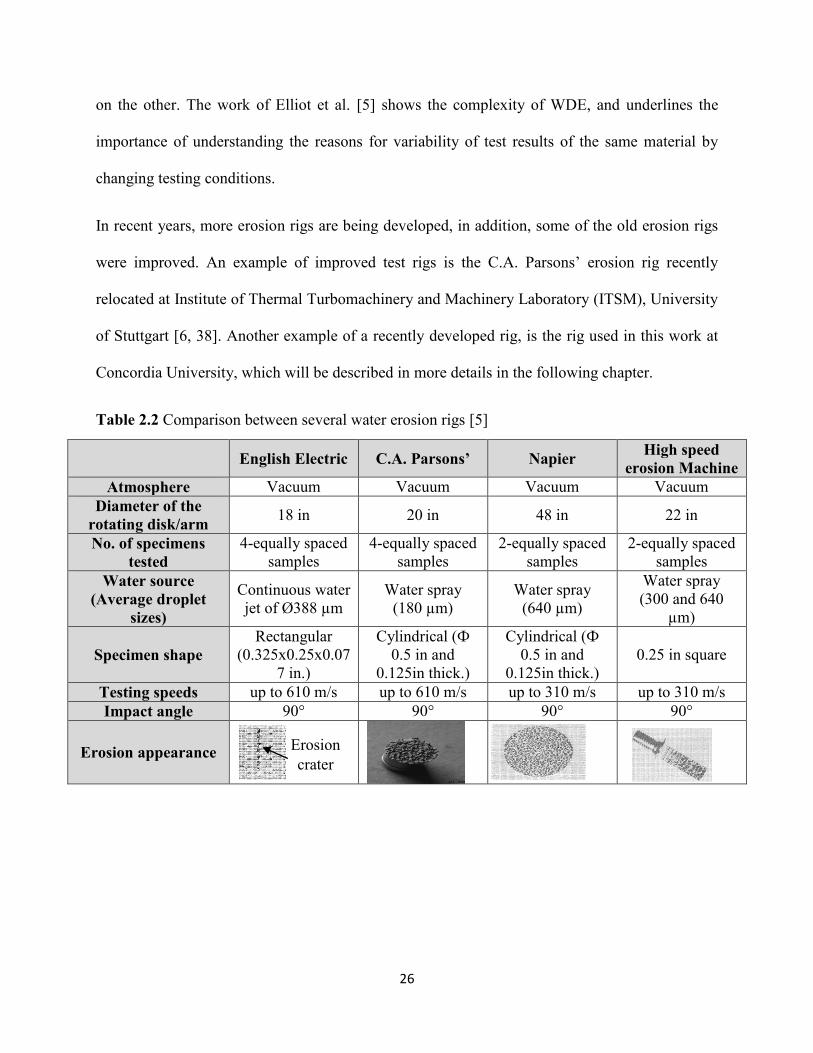
In 1970, Elliot et al. [5] compared the results obtained from testing the same materials using four
different erosion rigs. The comparison between the four WDE test rigs is presented in Table 2.2.
There are some similarities between the four rigs; however, the amount of water impacting the
samples in the experiments, droplet size distribution and test speeds used on each rig are all
different. Therefore, comparisons of WDE test results showed significant inconsistencies. Their
comparison [5] for experimental results could be considered as qualitative. They were more
interested in reporting the results in terms of shape of the erosion curves generated by each test
rig. In addition, they also studied the effects of speed and droplet size on test results of the same
rig. Some of the materials that showed superiority on one rig, did not show the same performance
26
on the other. The work of Elliot et al. [5] shows the complexity of WDE, and underlines the
importance of understanding the reasons for variability of test results of the same material by
changing testing conditions.
In recent years, more erosion rigs are being developed, in addition, some of the old erosion rigs
were improved. An example of improved test rigs is the C.A. Parsons’ erosion rig recently
relocated at Institute of Thermal Turbomachinery and Machinery Laboratory (ITSM), University
of Stuttgart [6, 38]. Another example of a recently developed rig, is the rig used in this work at
Concordia University, which will be described in more details in the following chapter.
Table 2.2 Comparison between several water erosion rigs [5]
English Electric C.A. Parsons’ Napier High speed
erosion Machine
Atmosphere Vacuum Vacuum Vacuum Vacuum
Diameter of the
rotating disk/arm 18 in 20 in 48 in 22 in
No. of specimens
tested
4-equally spaced
samples
4-equally spaced
samples
2-equally spaced
samples
2-equally spaced
samples
Water source
(Average droplet
sizes)
Continuous water
jet of Ø388 µm
Water spray
(180 µm)
Water spray
(640 µm)
Water spray
(300 and 640
µm)
Specimen shape
Rectangular
(0.325x0.25x0.07
7 in.)
Cylindrical (Ф
0.5 in and
0.125in thick.)
Cylindrical (Ф
0.5 in and
0.125in thick.)
0.25 in square
Testing speeds up to 610 m/s up to 610 m/s up to 310 m/s up to 310 m/s
Impact angle 90° 90° 90° 90°
Erosion appearance
Erosion
crater
27
3. Experimental procedures
3.1. Methodology
The main objective of this work is to compare the erosion results performed on the same WDE
test rig and to understand the reasons for variability in the test results. In order to do so, all
parameters affecting the erosion process should be identified. As indicated in chapter 2, there are
parameters related to the erosion conditions, and other related to the material itself. Most of these
parameters were studied earlier, for instance, droplet size, impact speed, impact angle and
mechanical properties of the material. On the contrary, other test parameters were not given enough
attention in the literature, an example is the initial surface roughness and its effect on the erosion
behavior. Therefore, the initial step of this work is to investigate the effect of surface roughness.
Afterwards, comparisons between test results done at various test conditions were carried out.
These comparisons will show the interaction between test parameters and how they influence
different stages of erosion. Later on, a comparison is held between ex-service turbine blade and
experimental results to relate erosion tests and existing erosion theories to real erosion damage in
service.
3.1. Erosion rig
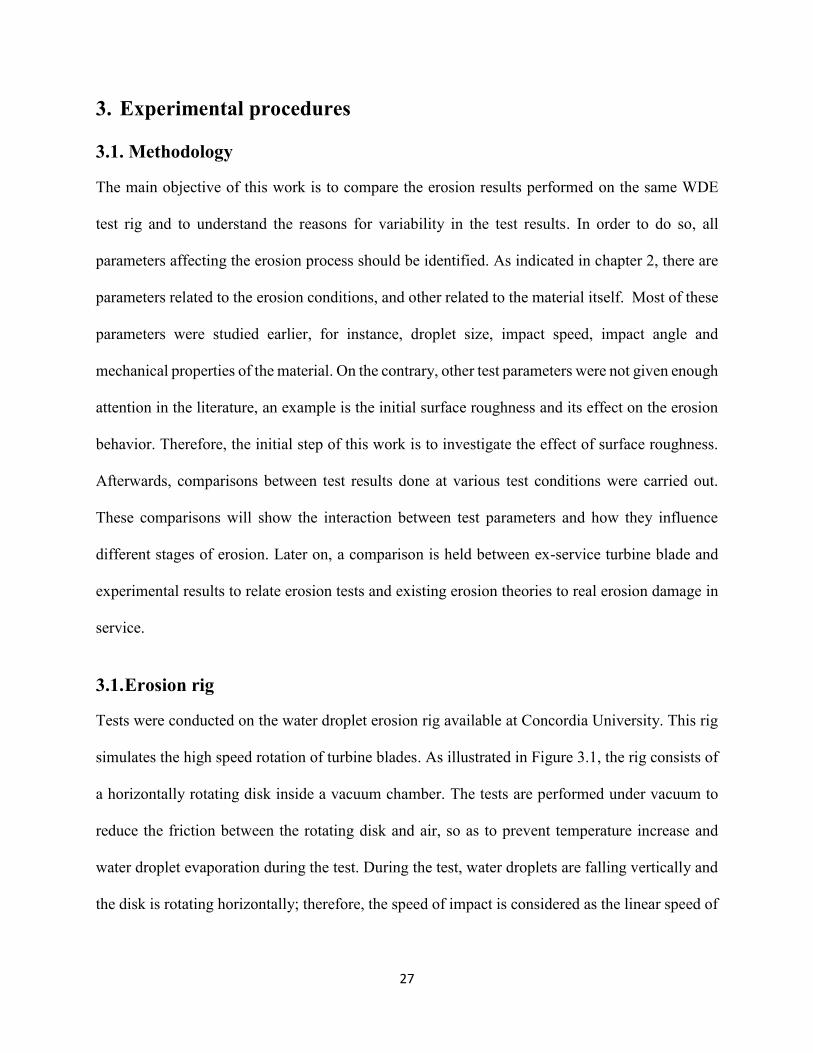
Tests were conducted on the water droplet erosion rig available at Concordia University. This rig
simulates the high speed rotation of turbine blades. As illustrated in Figure 3.1, the rig consists of
a horizontally rotating disk inside a vacuum chamber. The tests are performed under vacuum to
reduce the friction between the rotating disk and air, so as to prevent temperature increase and
water droplet evaporation during the test. During the test, water droplets are falling vertically and
the disk is rotating horizontally; therefore, the speed of impact is considered as the linear speed of
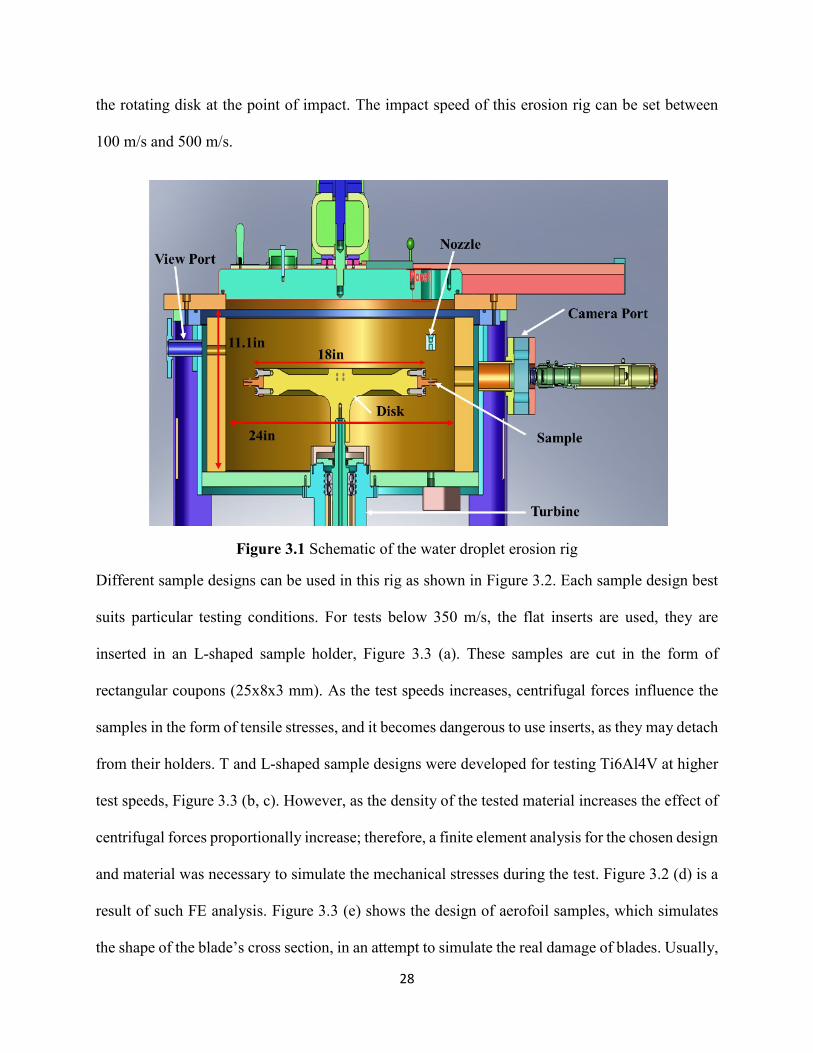
28
the rotating disk at the point of impact. The impact speed of this erosion rig can be set between
100 m/s and 500 m/s.
Figure 3.1 Schematic of the water droplet erosion rig
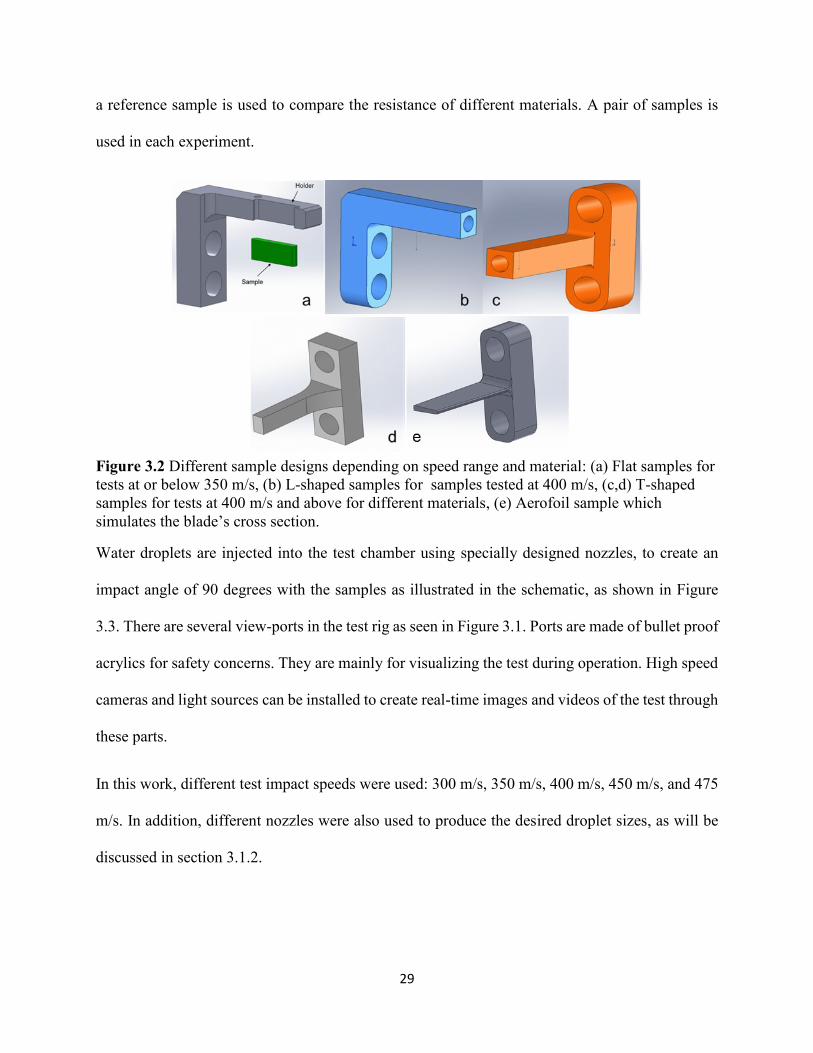
Different sample designs can be used in this rig as shown in Figure 3.2. Each sample design best
suits particular testing conditions. For tests below 350 m/s, the flat inserts are used, they are
inserted in an L-shaped sample holder, Figure 3.3 (a). These samples are cut in the form of
rectangular coupons (25x8x3 mm). As the test speeds increases, centrifugal forces influence the
samples in the form of tensile stresses, and it becomes dangerous to use inserts, as they may detach
from their holders. T and L-shaped sample designs were developed for testing Ti6Al4V at higher
test speeds, Figure 3.3 (b, c). However, as the density of the tested material increases the effect of
centrifugal forces proportionally increase; therefore, a finite element analysis for the chosen design
and material was necessary to simulate the mechanical stresses during the test. Figure 3.2 (d) is a
result of such FE analysis. Figure 3.3 (e) shows the design of aerofoil samples, which simulates
the shape of the blade’s cross section, in an attempt to simulate the real damage of blades. Usually,
29
a reference sample is used to compare the resistance of different materials. A pair of samples is
used in each experiment.
Figure 3.2 Different sample designs depending on speed range and material: (a) Flat samples for
tests at or below 350 m/s, (b) L-shaped samples for samples tested at 400 m/s, (c,d) T-shaped
samples for tests at 400 m/s and above for different materials, (e) Aerofoil sample which
simulates the blade’s cross section.
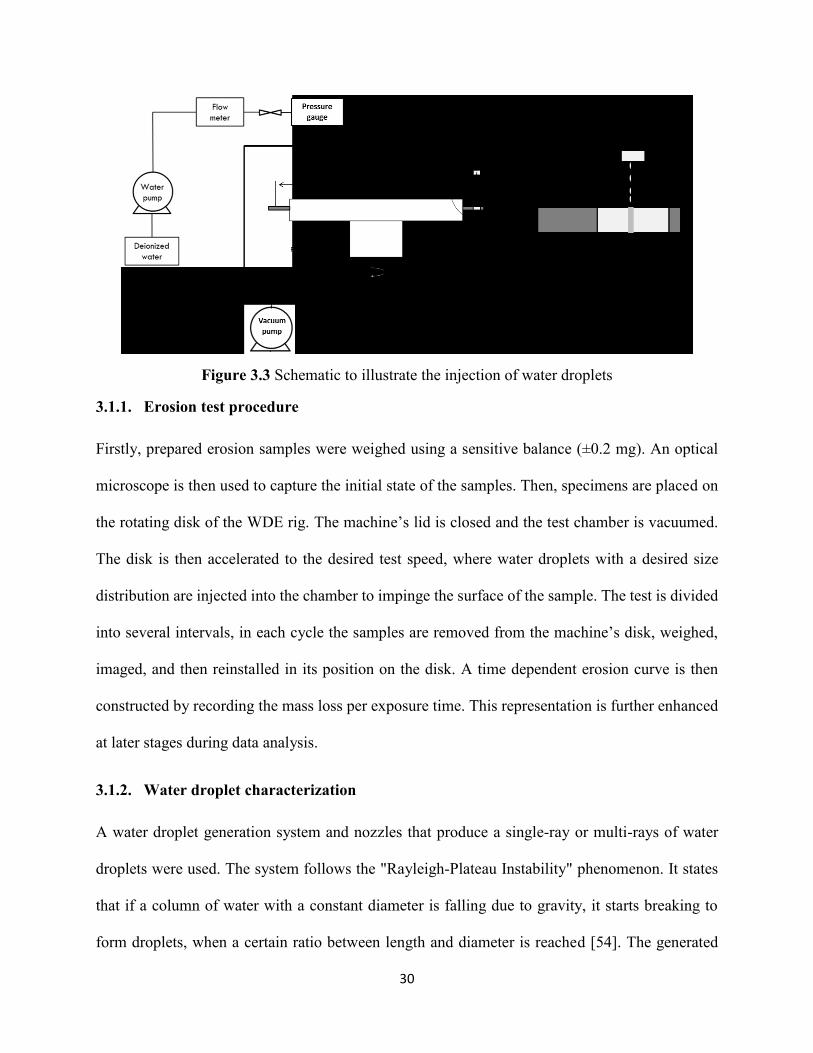
Water droplets are injected into the test chamber using specially designed nozzles, to create an
impact angle of 90 degrees with the samples as illustrated in the schematic, as shown in Figure
3.3. There are several view-ports in the test rig as seen in Figure 3.1. Ports are made of bullet proof
acrylics for safety concerns. They are mainly for visualizing the test during operation. High speed
cameras and light sources can be installed to create real-time images and videos of the test through
these parts.
In this work, different test impact speeds were used: 300 m/s, 350 m/s, 400 m/s, 450 m/s, and 475
m/s. In addition, different nozzles were also used to produce the desired droplet sizes, as will be
discussed in section 3.1.2.
30
Figure 3.3 Schematic to illustrate the injection of water droplets
3.1.1. Erosion test procedure
Firstly, prepared erosion samples were weighed using a sensitive balance (±0.2 mg). An optical
microscope is then used to capture the initial state of the samples. Then, specimens are placed on
the rotating disk of the WDE rig. The machine’s lid is closed and the test chamber is vacuumed.
The disk is then accelerated to the desired test speed, where water droplets with a desired size
distribution are injected into the chamber to impinge the surface of the sample. The test is divided
into several intervals, in each cycle the samples are removed from the machine’s disk, weighed,
imaged, and then reinstalled in its position on the disk. A time dependent erosion curve is then
constructed by recording the mass loss per exposure time. This representation is further enhanced
at later stages during data analysis.
3.1.2. Water droplet characterization
A water droplet generation system and nozzles that produce a single-ray or multi-rays of water
droplets were used. The system follows the "Rayleigh-Plateau Instability" phenomenon. It states
that if a column of water with a constant diameter is falling due to gravity, it starts breaking to
form droplets, when a certain ratio between length and diameter is reached [54]. The generated
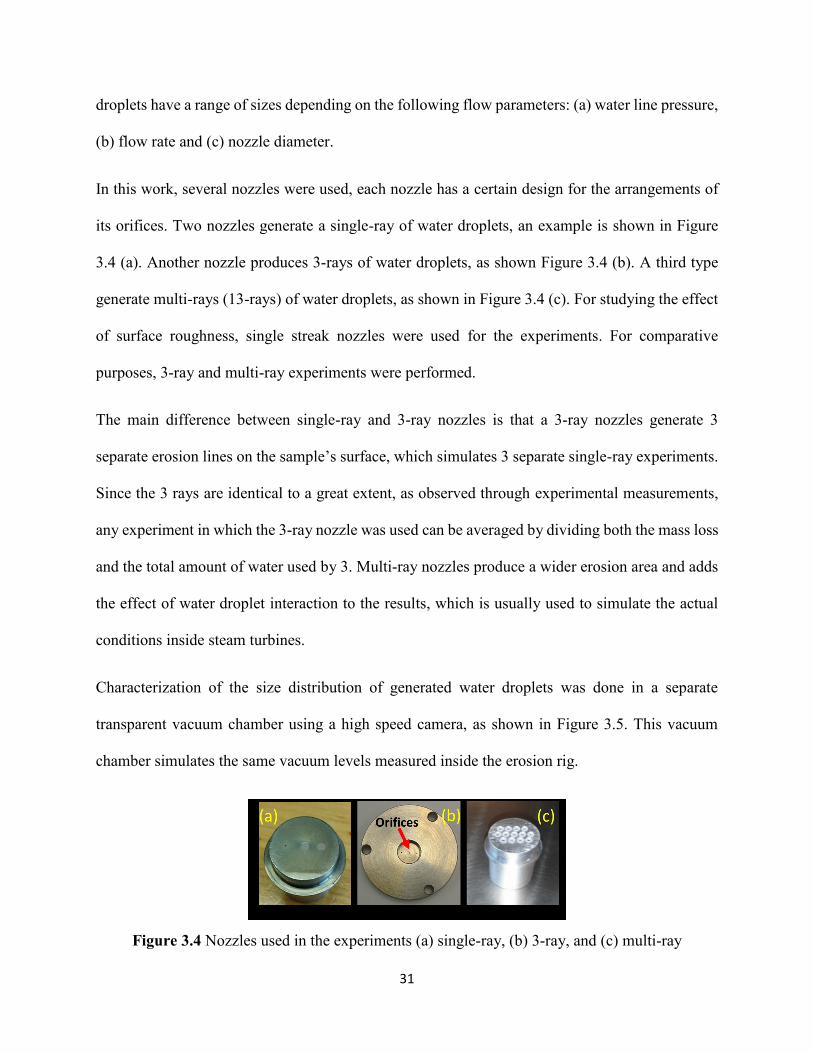
31
droplets have a range of sizes depending on the following flow parameters: (a) water line pressure,
(b) flow rate and (c) nozzle diameter.
In this work, several nozzles were used, each nozzle has a certain design for the arrangements of
its orifices. Two nozzles generate a single-ray of water droplets, an example is shown in Figure
3.4 (a). Another nozzle produces 3-rays of water droplets, as shown Figure 3.4 (b). A third type
generate multi-rays (13-rays) of water droplets, as shown in Figure 3.4 (c). For studying the effect
of surface roughness, single streak nozzles were used for the experiments. For comparative
purposes, 3-ray and multi-ray experiments were performed.
The main difference between single-ray and 3-ray nozzles is that a 3-ray nozzles generate 3
separate erosion lines on the sample’s surface, which simulates 3 separate single-ray experiments.
Since the 3 rays are identical to a great extent, as observed through experimental measurements,
any experiment in which the 3-ray nozzle was used can be averaged by dividing both the mass loss
and the total amount of water used by 3. Multi-ray nozzles produce a wider erosion area and adds
the effect of water droplet interaction to the results, which is usually used to simulate the actual
conditions inside steam turbines.
Characterization of the size distribution of generated water droplets was done in a separate
transparent vacuum chamber using a high speed camera, as shown in Figure 3.5. This vacuum
chamber simulates the same vacuum levels measured inside the erosion rig.
Figure 3.4 Nozzles used in the experiments (a) single-ray, (b) 3-ray, and (c) multi-ray
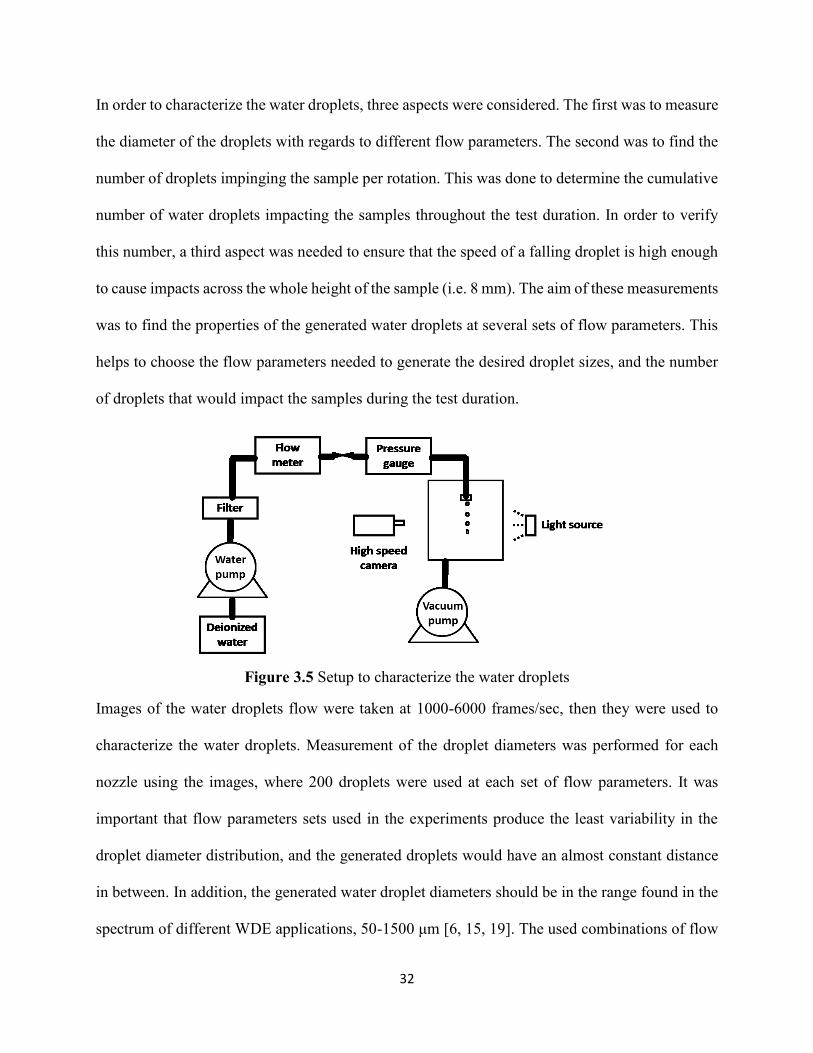
32
In order to characterize the water droplets, three aspects were considered. The first was to measure
the diameter of the droplets with regards to different flow parameters. The second was to find the
number of droplets impinging the sample per rotation. This was done to determine the cumulative
number of water droplets impacting the samples throughout the test duration. In order to verify
this number, a third aspect was needed to ensure that the speed of a falling droplet is high enough
to cause impacts across the whole height of the sample (i.e. 8 mm). The aim of these measurements
was to find the properties of the generated water droplets at several sets of flow parameters. This
helps to choose the flow parameters needed to generate the desired droplet sizes, and the number
of droplets that would impact the samples during the test duration.
Figure 3.5 Setup to characterize the water droplets
Images of the water droplets flow were taken at 1000-6000 frames/sec, then they were used to
characterize the water droplets. Measurement of the droplet diameters was performed for each
nozzle using the images, where 200 droplets were used at each set of flow parameters. It was
important that flow parameters sets used in the experiments produce the least variability in the
droplet diameter distribution, and the generated droplets would have an almost constant distance
in between. In addition, the generated water droplet diameters should be in the range found in the
spectrum of different WDE applications, 50-1500 μm [6, 15, 19]. The used combinations of flow
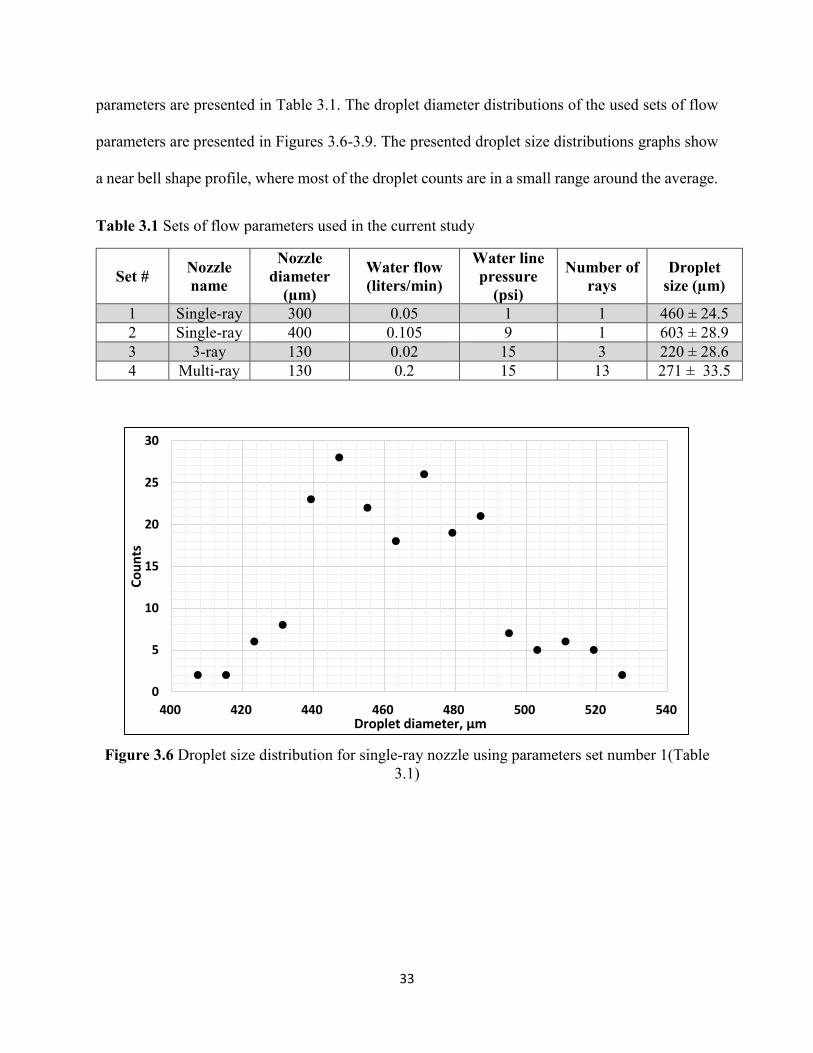
33
parameters are presented in Table 3.1. The droplet diameter distributions of the used sets of flow
parameters are presented in Figures 3.6-3.9. The presented droplet size distributions graphs show
a near bell shape profile, where most of the droplet counts are in a small range around the average.
Table 3.1 Sets of flow parameters used in the current study
Set # Nozzle
name
Nozzle
diameter
(µm)
Water flow
(liters/min)
Water line
pressure
(psi)
Number of
rays
Droplet
size (µm)
1 Single-ray 300 0.05 1 1 460 ± 24.5
2 Single-ray 400 0.105 9 1 603 ± 28.9
3 3-ray 130 0.02 15 3 220 ± 28.6
4 Multi-ray 130 0.2 15 13 271 ± 33.5
Figure 3.6 Droplet size distribution for single-ray nozzle using parameters set number 1(Table
3.1)
0
5
10
15
20
25
30
400 420 440 460 480 500 520 540
Co
un
ts
Droplet diameter, µm
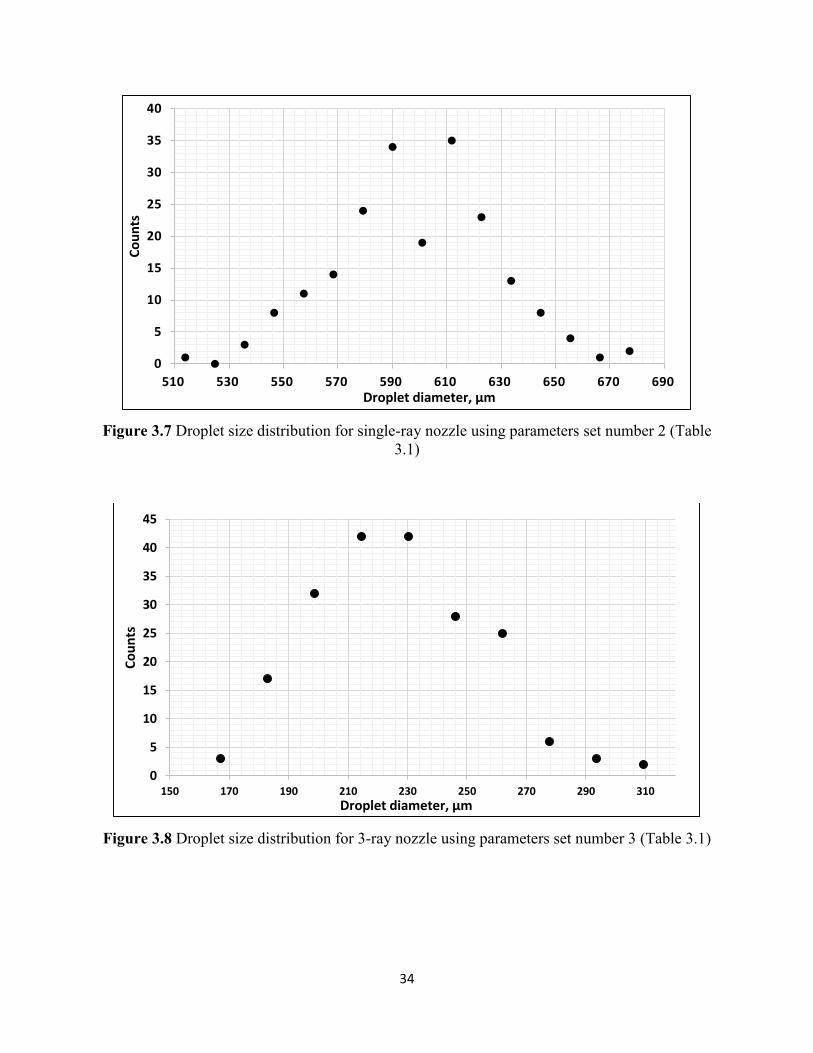
34
Figure 3.7 Droplet size distribution for single-ray nozzle using parameters set number 2 (Table
3.1)
Figure 3.8 Droplet size distribution for 3-ray nozzle using parameters set number 3 (Table 3.1)
0
5
10
15
20
25
30
35
40
510 530 550 570 590 610 630 650 670 690
Co
un
ts
Droplet diameter, µm
0
5
10
15
20
25
30
35
40
45
150 170 190 210 230 250 270 290 310
Co
un
ts
Droplet diameter, µm
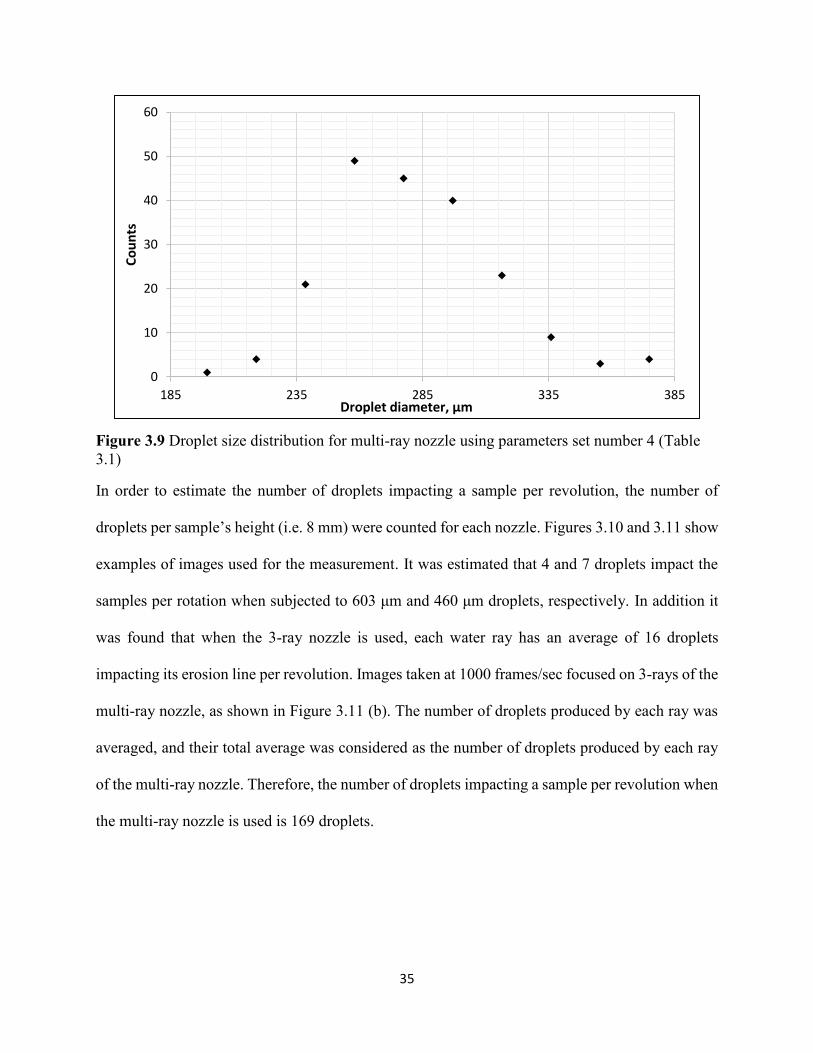
35
Figure 3.9 Droplet size distribution for multi-ray nozzle using parameters set number 4 (Table
3.1)
In order to estimate the number of droplets impacting a sample per revolution, the number of
droplets per sample’s height (i.e. 8 mm) were counted for each nozzle. Figures 3.10 and 3.11 show
examples of images used for the measurement. It was estimated that 4 and 7 droplets impact the
samples per rotation when subjected to 603 μm and 460 μm droplets, respectively. In addition it
was found that when the 3-ray nozzle is used, each water ray has an average of 16 droplets
impacting its erosion line per revolution. Images taken at 1000 frames/sec focused on 3-rays of the
multi-ray nozzle, as shown in Figure 3.11 (b). The number of droplets produced by each ray was
averaged, and their total average was considered as the number of droplets produced by each ray
of the multi-ray nozzle. Therefore, the number of droplets impacting a sample per revolution when
the multi-ray nozzle is used is 169 droplets.
0
10
20
30
40
50
60
185 235 285 335 385
Co
un
ts
Droplet diameter, µm
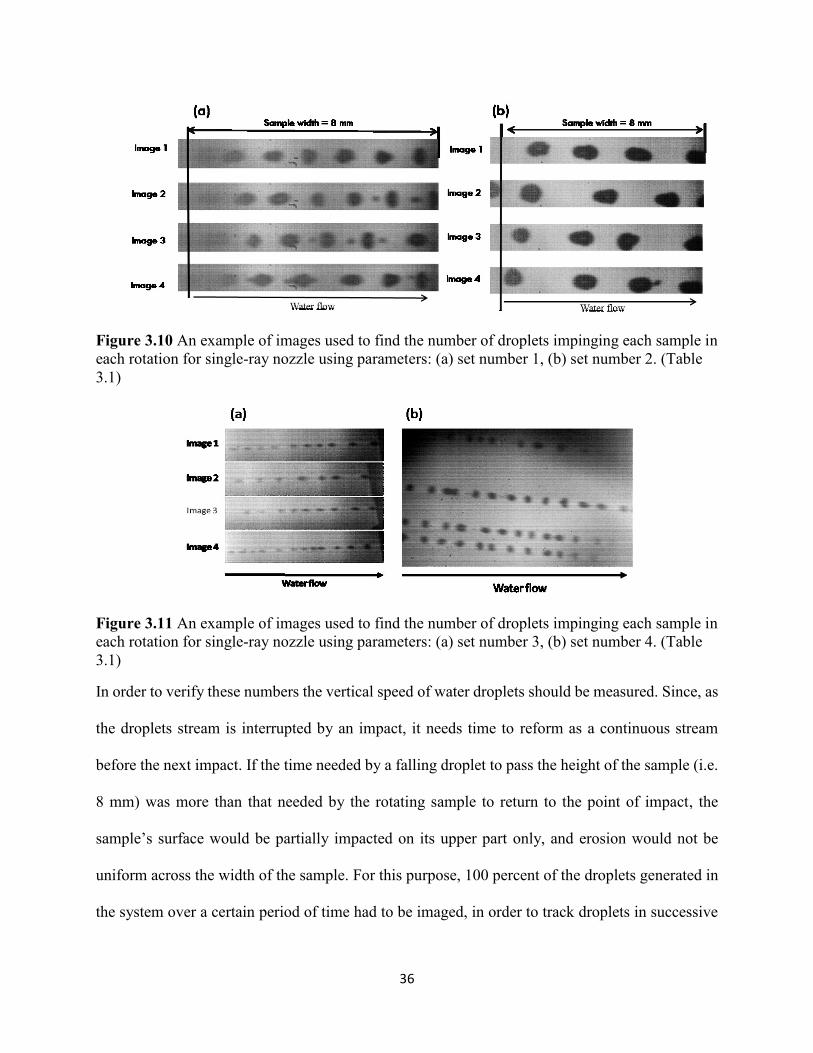
36
Figure 3.10 An example of images used to find the number of droplets impinging each sample in
each rotation for single-ray nozzle using parameters: (a) set number 1, (b) set number 2. (Table
3.1)
Figure 3.11 An example of images used to find the number of droplets impinging each sample in
each rotation for single-ray nozzle using parameters: (a) set number 3, (b) set number 4. (Table
3.1)
In order to verify these numbers the vertical speed of water droplets should be measured. Since, as
the droplets stream is interrupted by an impact, it needs time to reform as a continuous stream
before the next impact. If the time needed by a falling droplet to pass the height of the sample (i.e.
8 mm) was more than that needed by the rotating sample to return to the point of impact, the
sample’s surface would be partially impacted on its upper part only, and erosion would not be
uniform across the width of the sample. For this purpose, 100 percent of the droplets generated in
the system over a certain period of time had to be imaged, in order to track droplets in successive
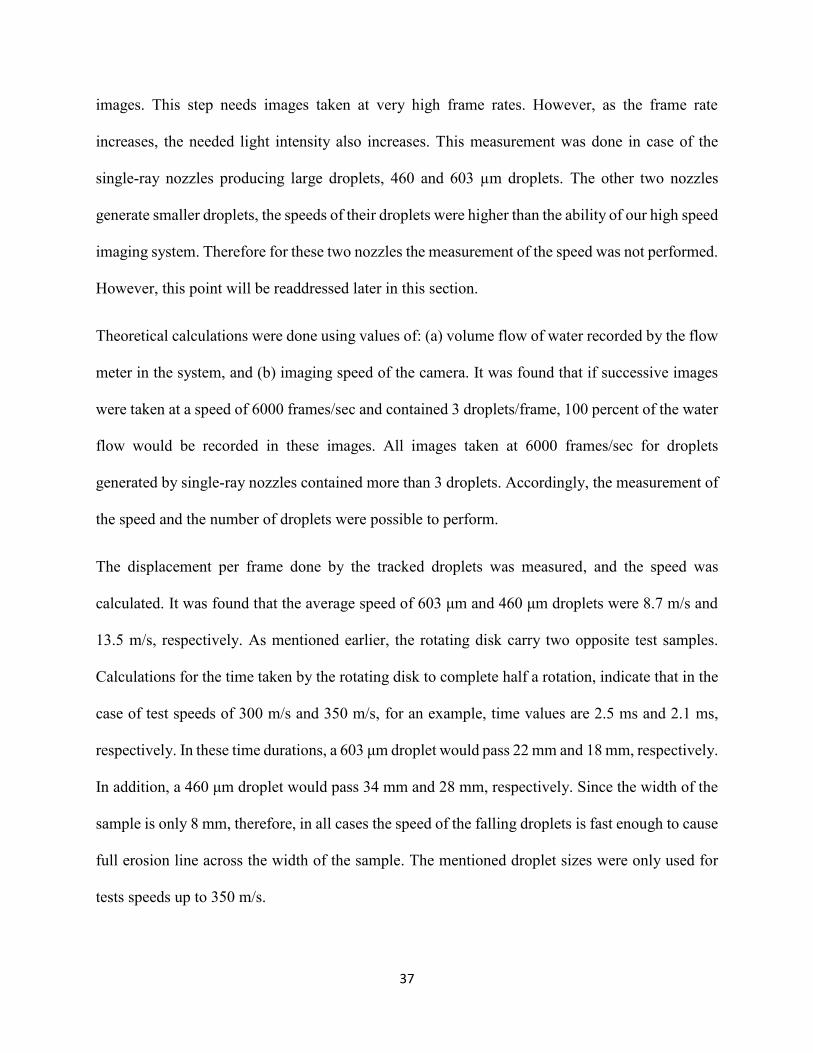
37
images. This step needs images taken at very high frame rates. However, as the frame rate
increases, the needed light intensity also increases. This measurement was done in case of the
single-ray nozzles producing large droplets, 460 and 603 µm droplets. The other two nozzles
generate smaller droplets, the speeds of their droplets were higher than the ability of our high speed
imaging system. Therefore for these two nozzles the measurement of the speed was not performed.
However, this point will be readdressed later in this section.
Theoretical calculations were done using values of: (a) volume flow of water recorded by the flow
meter in the system, and (b) imaging speed of the camera. It was found that if successive images
were taken at a speed of 6000 frames/sec and contained 3 droplets/frame, 100 percent of the water
flow would be recorded in these images. All images taken at 6000 frames/sec for droplets
generated by single-ray nozzles contained more than 3 droplets. Accordingly, the measurement of
the speed and the number of droplets were possible to perform.
The displacement per frame done by the tracked droplets was measured, and the speed was
calculated. It was found that the average speed of 603 μm and 460 μm droplets were 8.7 m/s and
13.5 m/s, respectively. As mentioned earlier, the rotating disk carry two opposite test samples.
Calculations for the time taken by the rotating disk to complete half a rotation, indicate that in the
case of test speeds of 300 m/s and 350 m/s, for an example, time values are 2.5 ms and 2.1 ms,
respectively. In these time durations, a 603 μm droplet would pass 22 mm and 18 mm, respectively.
In addition, a 460 μm droplet would pass 34 mm and 28 mm, respectively. Since the width of the
sample is only 8 mm, therefore, in all cases the speed of the falling droplets is fast enough to cause
full erosion line across the width of the sample. The mentioned droplet sizes were only used for
tests speeds up to 350 m/s.
38
As mentioned earlier, it was difficult to track the 220 µm droplets in successive images, this is
because of their small size and the insufficient light source. However, according to the speed
measurements, it was found that as the droplet size decreases the speed of the droplets increases.
Another reason for this assumption is that the used water pressure to produce the 220 µm and 271
µm droplets is higher than that used to produce the 460 and 603 µm droplets. It is expected that
the speed of the droplet is function of the water line pressure behind the nozzle. Therefore, it was
assumed that droplets generated from the 3-streak nozzle and multi-ray nozzle, were fast enough
to hit the samples with almost the same amount in every rotation.
Based on these measurements, the erosion results can be represented in terms of the actual amount
of water droplets impinging the surface of samples during the test.
3.1.3. Tested materials
A special martensitic stainless steel alloy (12% Cr-steel) provided by ALSTOM Power was tested
for all the experiments. This material is commonly used in the manufacture of steam turbine blades.
The composition and the mechanical properties of this alloy are proprietary.
In chapter 4 where the effect of surface roughness is investigated, annealed Ti6Al4V was also
tested. This material is widely used in the manufacture of gas turbine blades [19]. The main reason
for testing Ti6Al4V is to broaden the prospect of the investigation by studying another material.
3.1.4. Surface roughness test samples
In order to vary the surface roughness of the 12% Cr stainless steel samples, two surface
preparation methods were used. The first was to hand grind the surface of the samples using a 180
grit SiC paper using a grinding disk. The second method was to prepare the surface using a
vibratomet polisher for 24 hrs using 1 µm diamond paste. The average linear surface roughness
39
values (Ra) of the two surface preparation methods were, 0.2 µm and 0.035 µm, for grinding and
polishing, respectively. The roughness values were measured using a linear roughness
measurement device (Mitutoyo SJ-210). The purpose of using these two different surface
preparation methods was to induce a large difference in the initial surface conditions of the
samples.
The surfaces of Ti6Al4V samples were prepared by hand grinding and polishing. Rough samples
were ground using a 180 and 600 grit SiC paper, and the smooth sample was hand ground and
finally polished using 3 µm diamond paste. Average surface roughness values (Ra) of 0.3 µm, 0.1
µm and 0.06 µm were recorded for the ground and polished samples, respectively.
3.2. Examining of ex-service turbine blades
Martensitic stainless steel (12% Cr) ex-service steam turbine blades were examined in this study.
These blades were provided by ALSTOM Power for two main purposes: (a) identifying the WDE
mechanisms at different sections of the blades, (b) comparing the tested samples in the WDE rig
with the ex-service blades.
The service environment of these blades is considered harsh. Blades may work for several years
inside of a steam turbine before the first maintenance would be performed. The received blades
are samples of low pressure cycle blades in a typical steam turbine. These blades were rotating at
a speed of 3000-3500 RPM with an overall center of rotation to tip radius of 2 meters (i.e. linear
speed at the tip is around 630-730 m/s).
Severe erosion marks are clear on the leading edges of the blade as shown in Figure 3.12. However,
the erosion appearance varies over the span length, and the blades profile angle of twist. As it is
known that there is an angle of twist on the turbine blade around its axis for aerodynamic reasons,
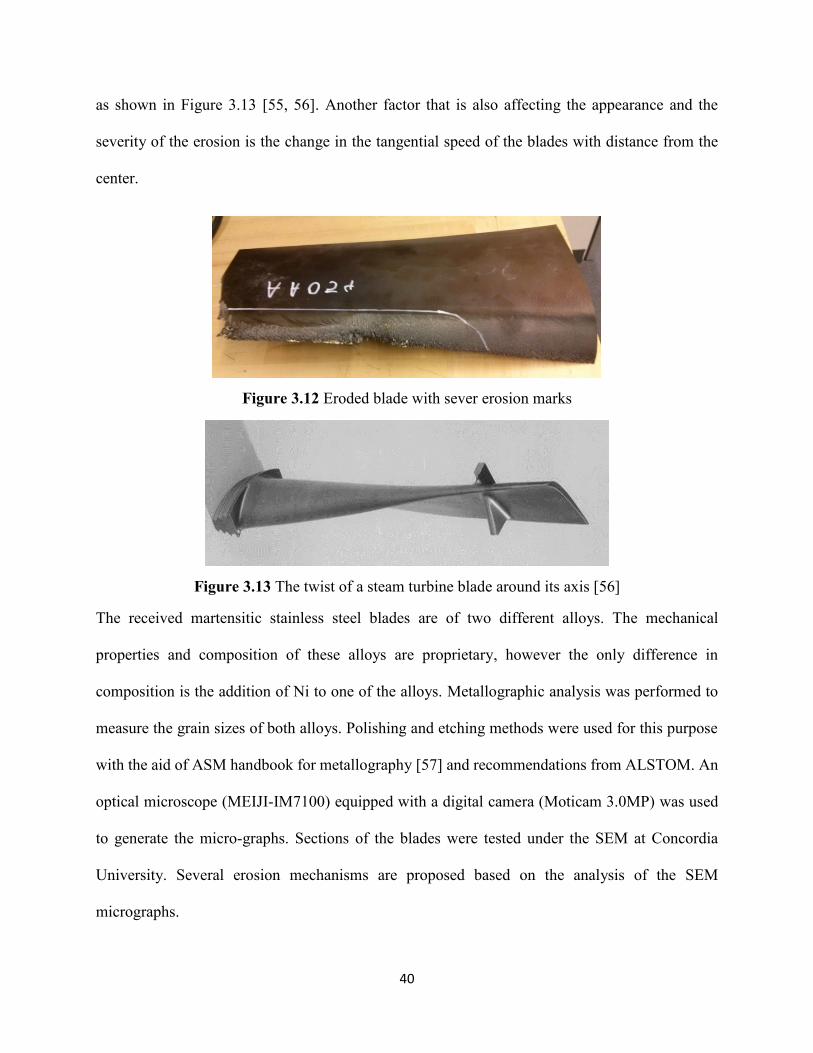
40
as shown in Figure 3.13 [55, 56]. Another factor that is also affecting the appearance and the
severity of the erosion is the change in the tangential speed of the blades with distance from the
center.
Figure 3.12 Eroded blade with sever erosion marks
Figure 3.13 The twist of a steam turbine blade around its axis [56]
The received martensitic stainless steel blades are of two different alloys. The mechanical
properties and composition of these alloys are proprietary, however the only difference in
composition is the addition of Ni to one of the alloys. Metallographic analysis was performed to
measure the grain sizes of both alloys. Polishing and etching methods were used for this purpose
with the aid of ASM handbook for metallography [57] and recommendations from ALSTOM. An
optical microscope (MEIJI-IM7100) equipped with a digital camera (Moticam 3.0MP) was used
to generate the micro-graphs. Sections of the blades were tested under the SEM at Concordia
University. Several erosion mechanisms are proposed based on the analysis of the SEM
micrographs.
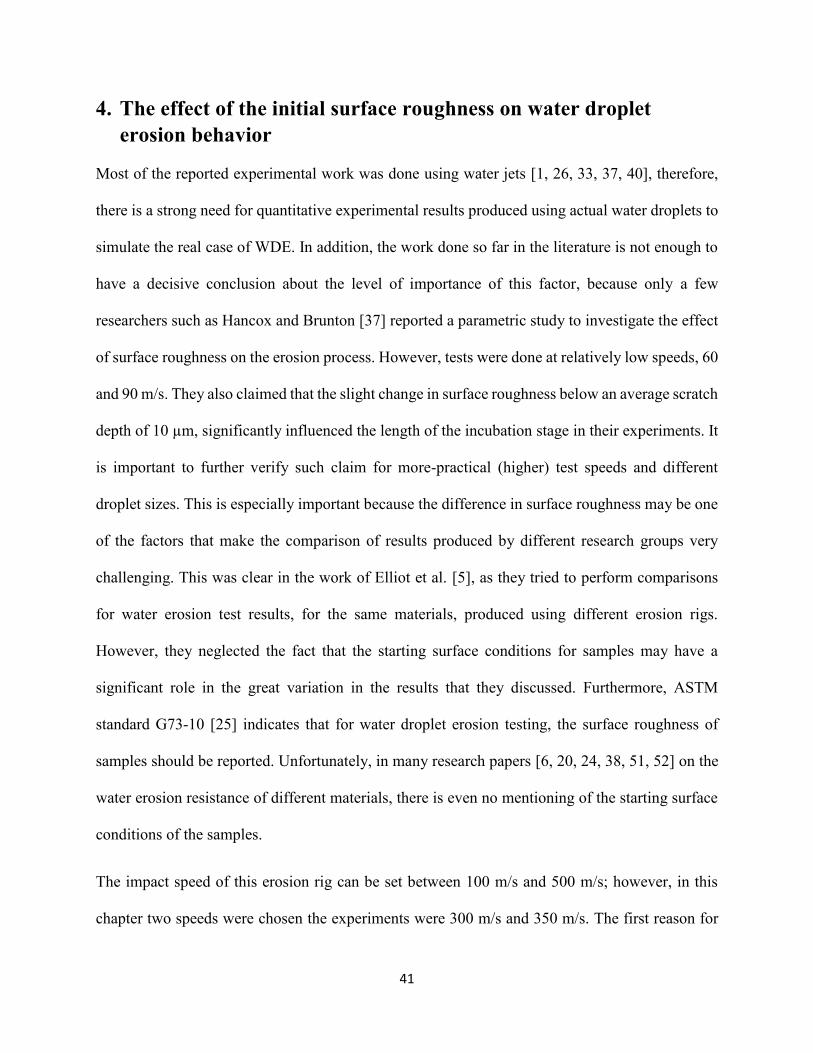
41
4. The effect of the initial surface roughness on water droplet
erosion behavior
Most of the reported experimental work was done using water jets [1, 26, 33, 37, 40], therefore,
there is a strong need for quantitative experimental results produced using actual water droplets to
simulate the real case of WDE. In addition, the work done so far in the literature is not enough to
have a decisive conclusion about the level of importance of this factor, because only a few
researchers such as Hancox and Brunton [37] reported a parametric study to investigate the effect
of surface roughness on the erosion process. However, tests were done at relatively low speeds, 60
and 90 m/s. They also claimed that the slight change in surface roughness below an average scratch
depth of 10 µm, significantly influenced the length of the incubation stage in their experiments. It
is important to further verify such claim for more-practical (higher) test speeds and different
droplet sizes. This is especially important because the difference in surface roughness may be one
of the factors that make the comparison of results produced by different research groups very
challenging. This was clear in the work of Elliot et al. [5], as they tried to perform comparisons
for water erosion test results, for the same materials, produced using different erosion rigs.
However, they neglected the fact that the starting surface conditions for samples may have a
significant role in the great variation in the results that they discussed. Furthermore, ASTM
standard G73-10 [25] indicates that for water droplet erosion testing, the surface roughness of
samples should be reported. Unfortunately, in many research papers [6, 20, 24, 38, 51, 52] on the
water erosion resistance of different materials, there is even no mentioning of the starting surface
conditions of the samples.
The impact speed of this erosion rig can be set between 100 m/s and 500 m/s; however, in this
chapter two speeds were chosen the experiments were 300 m/s and 350 m/s. The first reason for
42
choosing these speeds is that they were not investigated previously (in the literature) for testing
the effect of surface roughness. The second reason, it is expected that if the severity of the test
increases, represented in the impact speed, the effect of surface roughness on the erosion damage
would decrease. Therefore, it was essential to choose speeds that allow to study surface roughness
when it has a significant effect on the erosion behavior, especially, at the initial stages of erosion.
In this work, two sets of flow parameters were chosen to produce droplet diameters of 460 μm
and 603 μm. These water droplet sizes are within the range of sizes found in the droplet size
spectrum of different WDE applications, 50-1500 μm [6, 15, 19].
To summarize, the one of the objectives of the current work is to provide experimental results
produced using actual water droplets to simulate the real case of WDE of 12% Cr stainless steel,
with special focus on the effect of the initial surface roughness on the WDE behavior. Moreover,
for the sake of comparison and to provide a broader prospect on the effect of surface roughness
on the WDE behavior of other material, additional experiments were carried out to investigate the
effect of surface roughness on annealed Ti6Al4V.
4.1. Experimental results for the effect of initial surface roughness
Three test parameters were varied in the experiments involving the 12% Cr stainless steel: (a)
initial surface roughness, (b) test speed and (c) water droplet diameter. In this investigation, eight
WDE tests were conducted by varying each parameter using two levels. An additional test was
carried out to confirm the repeatability of the experiments.
According to the ASTM G73-10 standard [25], the cumulative material loss can be described as
mass loss or volume loss. If the aim is the comparison between different materials, the volume loss
is considered a more appropriate method of representation. However, if the comparison is done for
43
the effect of test parameters on the erosion behavior of one material, any material loss expression
would be sufficient. Therefore, mass loss was chosen to represent the material loss in this work.
Exposure can be represented as time, impact cycles, volume of impinging water droplets, number
of effective droplets impacting the surface, and cumulative kinetic energy of impact. In this work,
the average number of droplets impacting the sample over a defined period of time is considered
as exposure. Therefore, the observed damage would be quantified and correlated to the actual
number of water droplets causing erosion. Such representation would help for comparative
purposes between different test results performed on different WDE rigs, and helps toward further
standardization of the WDE experiments. The number of droplets can be calculated by multiplying
the average number of droplets impacting the sample per rotation by the number of rotations in a
test interval:
Number of droplets (𝑁𝑑𝑟𝑜𝑝.) = 𝑁𝑑𝑟𝑜𝑝./𝑟𝑜𝑡𝑎𝑡𝑖𝑜𝑛 ∗ 𝑅𝑃𝑀 ∗ 𝑡𝑖𝑚𝑒 (4.1)
Furthermore, a term to describe the duration of the incubation period can be represented as shown
in the following equation [25]:
Incubation specific impact (𝑁0)= Ninc * Ap
Ae (4.2)
Where 𝑁𝑖𝑛𝑐 is the number of impacts during incubation, 𝐴𝑝 is the projected area of an impacting
liquid body, and 𝐴𝑒 is the area exposed to erosion. The projected area of the impacting liquid body
is considered as the projected area of one water droplet,𝜋
4𝐷𝑑𝑟𝑜𝑝
2 . However, the total surface area
exposed to erosion is considered as the average impacted flat area measured using optical
macrographs at the end of the incubation stage. During incubation, the impacted area is clearly
noticeable on the surface of the sample by a color difference that distinguishes it from the un-
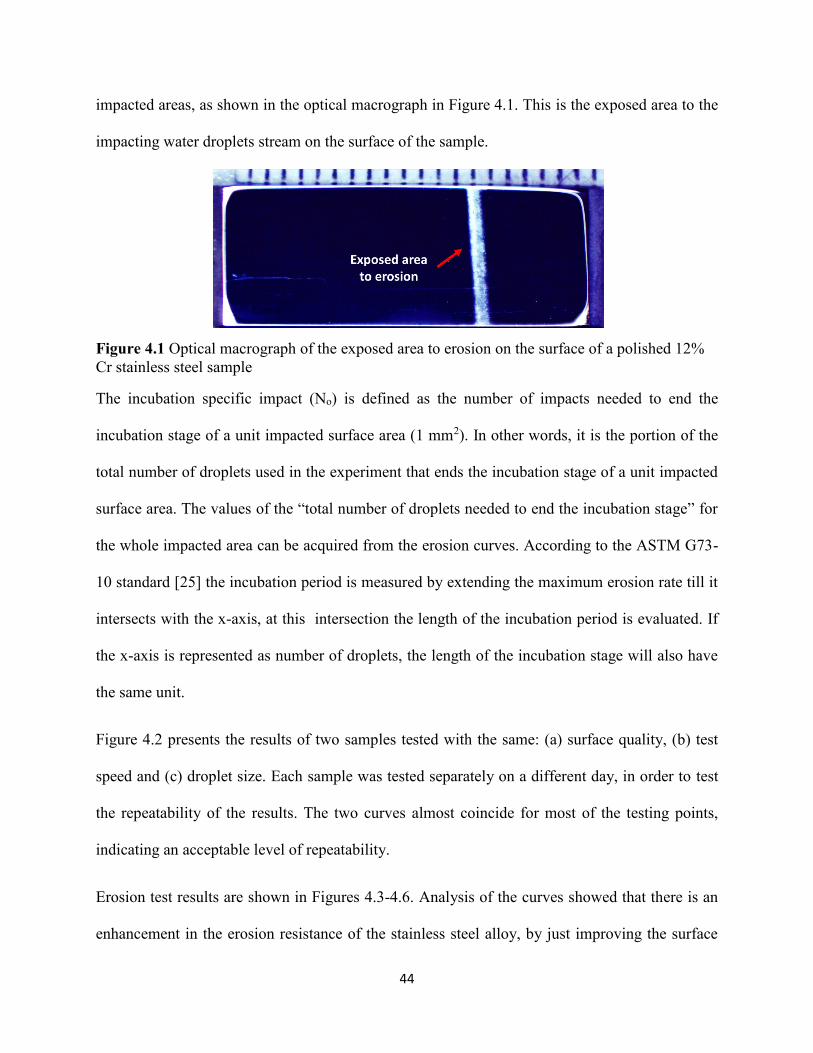
44
impacted areas, as shown in the optical macrograph in Figure 4.1. This is the exposed area to the
impacting water droplets stream on the surface of the sample.
Figure 4.1 Optical macrograph of the exposed area to erosion on the surface of a polished 12%
Cr stainless steel sample
The incubation specific impact (No) is defined as the number of impacts needed to end the
incubation stage of a unit impacted surface area (1 mm2). In other words, it is the portion of the
total number of droplets used in the experiment that ends the incubation stage of a unit impacted
surface area. The values of the “total number of droplets needed to end the incubation stage” for
the whole impacted area can be acquired from the erosion curves. According to the ASTM G73-
10 standard [25] the incubation period is measured by extending the maximum erosion rate till it
intersects with the x-axis, at this intersection the length of the incubation period is evaluated. If
the x-axis is represented as number of droplets, the length of the incubation stage will also have
the same unit.
Figure 4.2 presents the results of two samples tested with the same: (a) surface quality, (b) test
speed and (c) droplet size. Each sample was tested separately on a different day, in order to test
the repeatability of the results. The two curves almost coincide for most of the testing points,
indicating an acceptable level of repeatability.
Erosion test results are shown in Figures 4.3-4.6. Analysis of the curves showed that there is an
enhancement in the erosion resistance of the stainless steel alloy, by just improving the surface
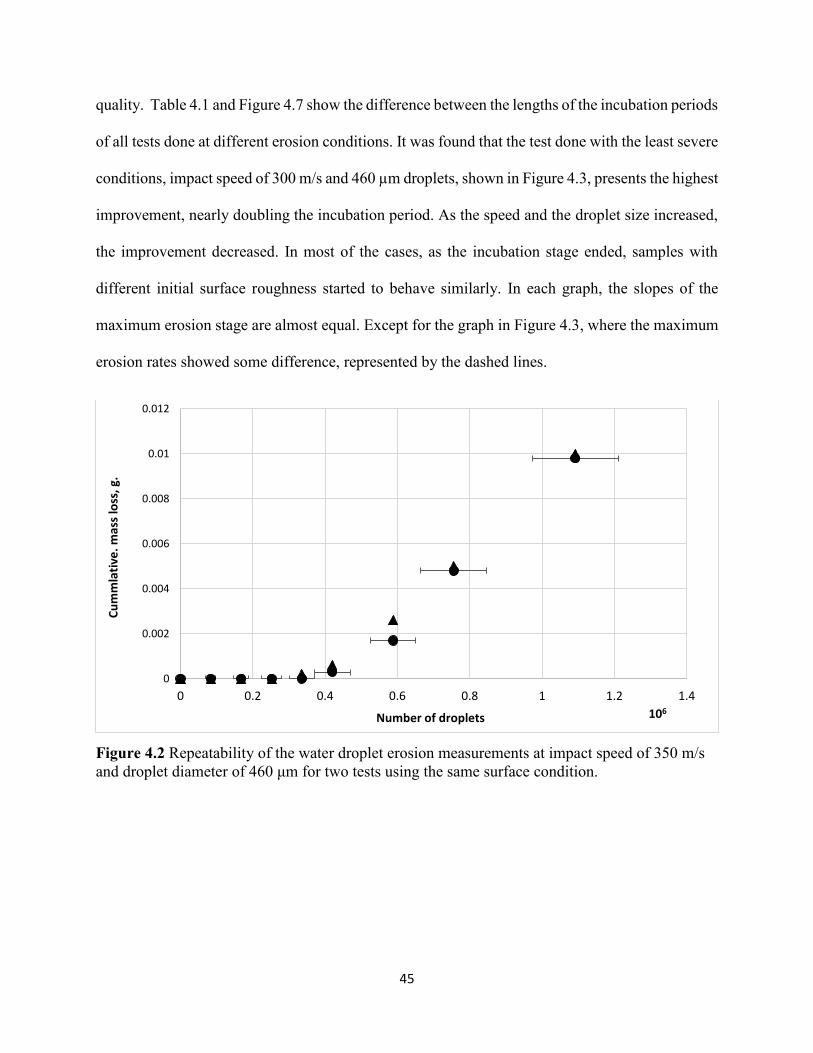
45
quality. Table 4.1 and Figure 4.7 show the difference between the lengths of the incubation periods
of all tests done at different erosion conditions. It was found that the test done with the least severe
conditions, impact speed of 300 m/s and 460 µm droplets, shown in Figure 4.3, presents the highest
improvement, nearly doubling the incubation period. As the speed and the droplet size increased,
the improvement decreased. In most of the cases, as the incubation stage ended, samples with
different initial surface roughness started to behave similarly. In each graph, the slopes of the
maximum erosion stage are almost equal. Except for the graph in Figure 4.3, where the maximum
erosion rates showed some difference, represented by the dashed lines.
Figure 4.2 Repeatability of the water droplet erosion measurements at impact speed of 350 m/s
and droplet diameter of 460 μm for two tests using the same surface condition.
0
0.002
0.004
0.006
0.008
0.01
0.012
0 0.2 0.4 0.6 0.8 1 1.2 1.4
106Number of droplets
Cu
mm
lati
ve.
mas
s lo
ss, g
.
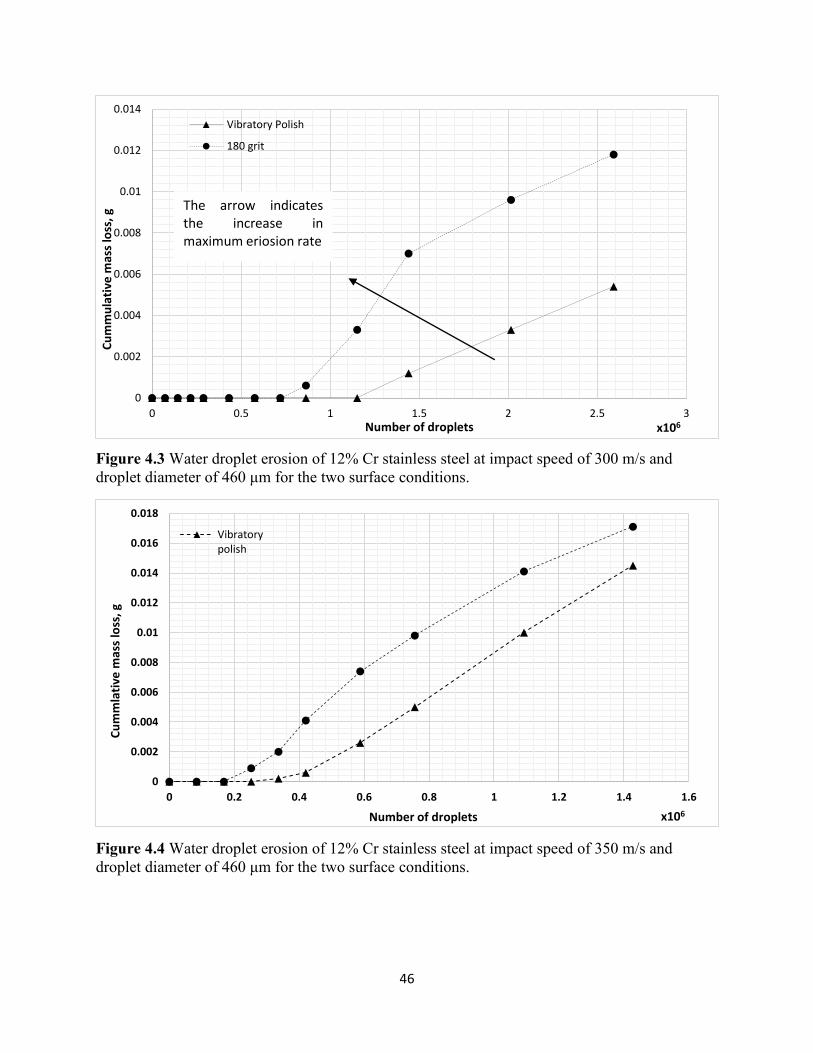
46
Figure 4.3 Water droplet erosion of 12% Cr stainless steel at impact speed of 300 m/s and
droplet diameter of 460 μm for the two surface conditions.
Figure 4.4 Water droplet erosion of 12% Cr stainless steel at impact speed of 350 m/s and
droplet diameter of 460 μm for the two surface conditions.
0
0.002
0.004
0.006
0.008
0.01
0.012
0.014
0 0.5 1 1.5 2 2.5 3
Cu
mm
ula
tive
mas
s lo
ss,
g
Number of droplets x106
Vibratory Polish
180 grit
The arrow indicatesthe increase inmaximum eriosion rate
0
0.002
0.004
0.006
0.008
0.01
0.012
0.014
0.016
0.018
0 0.2 0.4 0.6 0.8 1 1.2 1.4 1.6
Cu
mm
lati
ve m
ass
loss
, g
Number of droplets x106
Vibratorypolish
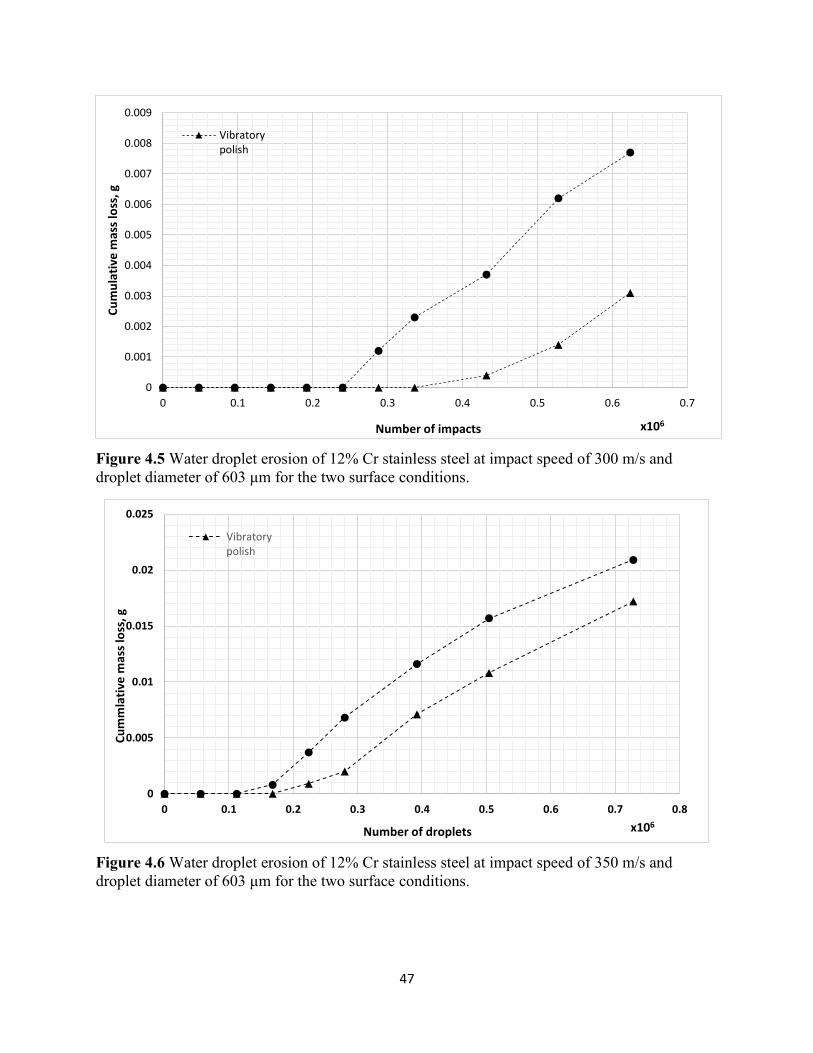
47
Figure 4.5 Water droplet erosion of 12% Cr stainless steel at impact speed of 300 m/s and
droplet diameter of 603 μm for the two surface conditions.
Figure 4.6 Water droplet erosion of 12% Cr stainless steel at impact speed of 350 m/s and
droplet diameter of 603 μm for the two surface conditions.
0
0.001
0.002
0.003
0.004
0.005
0.006
0.007
0.008
0.009
0 0.1 0.2 0.3 0.4 0.5 0.6 0.7
Cu
mu
lati
ve m
ass
loss
, g
Number of impacts x106
Vibratorypolish
0
0.005
0.01
0.015
0.02
0.025
0 0.1 0.2 0.3 0.4 0.5 0.6 0.7 0.8
Cu
mm
lati
ve m
ass
loss
, g
Number of droplets x106
Vibratorypolish
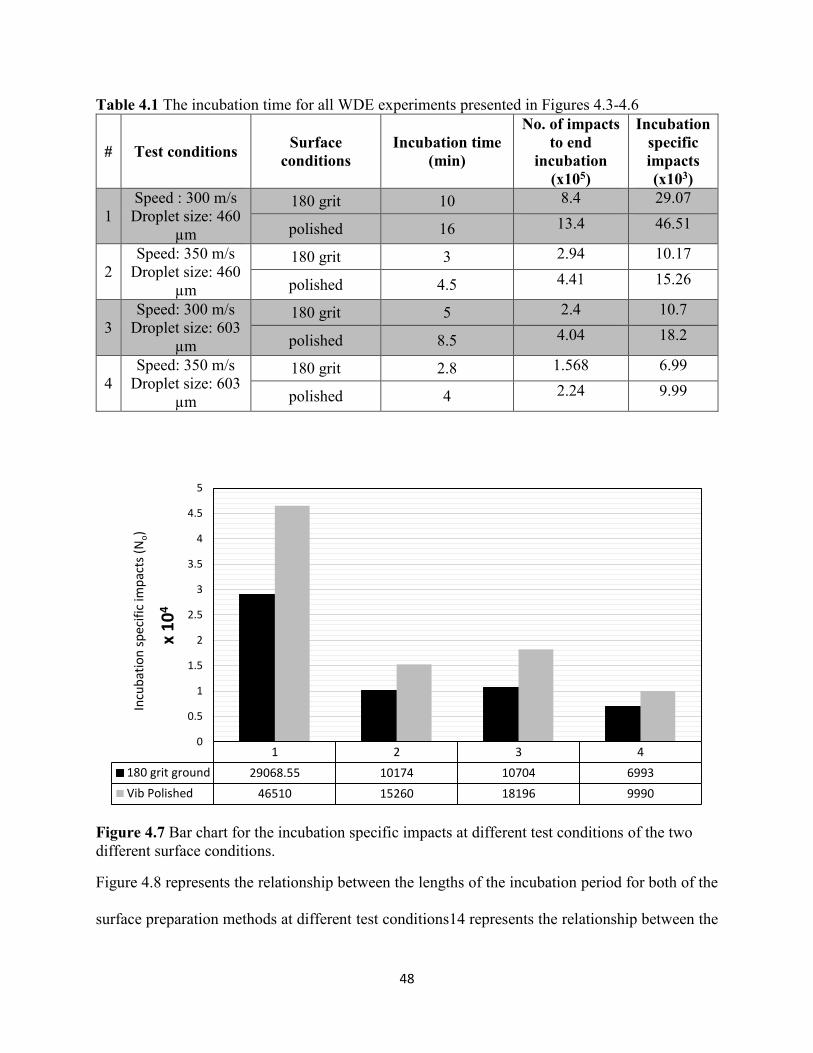
48
Table 4.1 The incubation time for all WDE experiments presented in Figures 4.3-4.6
# Test conditions Surface
conditions
Incubation time
(min)
No. of impacts
to end
incubation
(x105)
Incubation
specific
impacts
(x103)
1
Speed : 300 m/s
Droplet size: 460
µm
180 grit 10 8.4 29.07
polished 16 13.4 46.51
2
Speed: 350 m/s
Droplet size: 460
µm
180 grit 3 2.94 10.17
polished 4.5 4.41 15.26
3
Speed: 300 m/s
Droplet size: 603
µm
180 grit 5 2.4 10.7
polished 8.5 4.04 18.2
4
Speed: 350 m/s
Droplet size: 603
µm
180 grit 2.8 1.568 6.99
polished 4 2.24 9.99
Figure 4.7 Bar chart for the incubation specific impacts at different test conditions of the two
different surface conditions.
Figure 4.8 represents the relationship between the lengths of the incubation period for both of the
surface preparation methods at different test conditions14 represents the relationship between the
1 2 3 4
180 grit ground 29068.55 10174 10704 6993
Vib Polished 46510 15260 18196 9990
0
0.5
1
1.5
2
2.5
3
3.5
4
4.5
5
x 1
04
Incu
bat
ion
sp
ecif
ic im
pac
ts (
No)
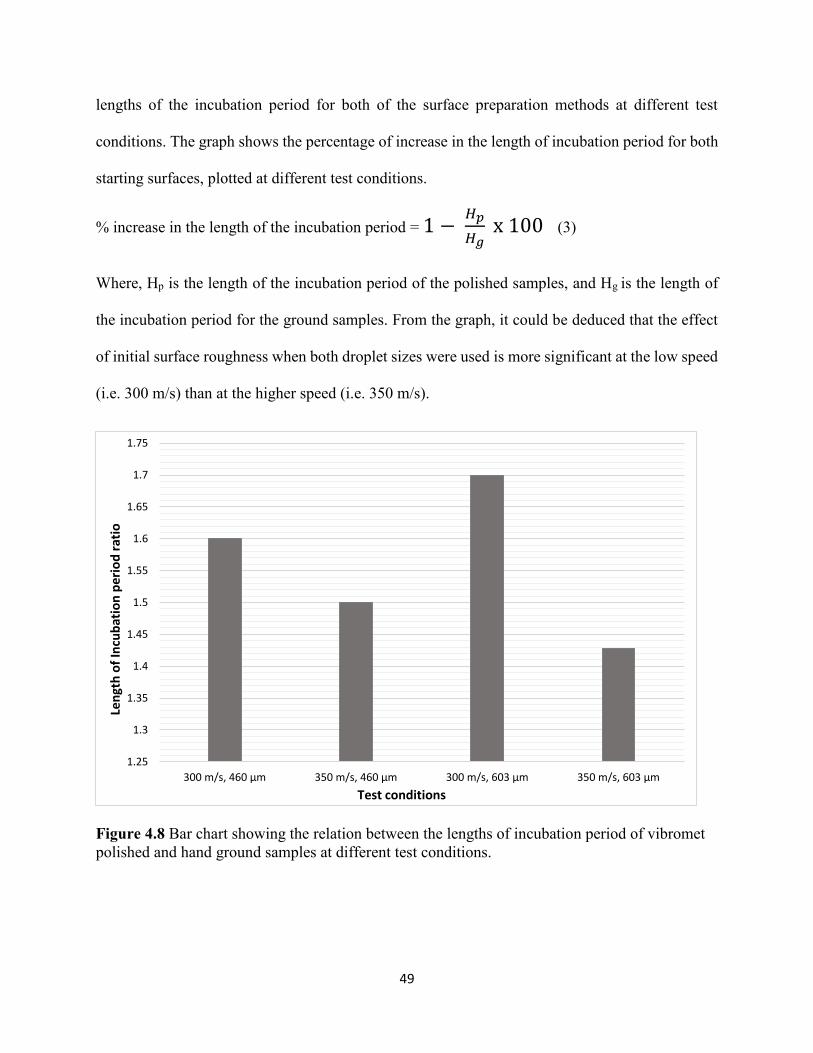
49
lengths of the incubation period for both of the surface preparation methods at different test
conditions. The graph shows the percentage of increase in the length of incubation period for both
starting surfaces, plotted at different test conditions.
% increase in the length of the incubation period = 1 − 𝐻𝑝
𝐻𝑔 x 100 (3)
Where, Hp is the length of the incubation period of the polished samples, and Hg is the length of
the incubation period for the ground samples. From the graph, it could be deduced that the effect
of initial surface roughness when both droplet sizes were used is more significant at the low speed
(i.e. 300 m/s) than at the higher speed (i.e. 350 m/s).
Figure 4.8 Bar chart showing the relation between the lengths of incubation period of vibromet
polished and hand ground samples at different test conditions.
1.25
1.3
1.35
1.4
1.45
1.5
1.55
1.6
1.65
1.7
1.75
300 m/s, 460 μm 350 m/s, 460 μm 300 m/s, 603 μm 350 m/s, 603 μm
Test conditions
Len
gth
of
Incu
bat
ion
per
iod
rat
io
50
4.2. Discussion
In order to understand the relation between the current results and the existing theories discussing
the effect of surface conditions on WDE, one should first discuss the reasons for observing such
differences in WDE behavior by changing the surface roughness. To achieve this, two aspects
should be addressed. The first is to understand the behavior of the water droplet after impact, as it
is the dominant source of the applied load on the surface. The second is to investigate the difference
in the impacted surface response caused by altering the surface roughness.
As discussed earlier in section 2.2., several researchers [3, 4, 10, 11, 26, 32, 33, 35] explained the
initial behavior of a water droplet after impact. The first step is when the water droplet induces
stresses on the surface through the impact pressure, known as the hammer pressure. Afterwards,
the water droplet deforms over the surface producing a lateral outflow, which slides on the solid
surface at a very high speed.
Haag [22] generally described the surface response of a ductile material during the incubation
period. He assumed that damage progresses in the following sequence: (a) roughening of the
surface; (b) formation of micro-cracks and their propagation; (c) the detachment of material and
the formation of pits. However, what happens if the surface is rough before the erosion process
starts? This will be discussed the in the remaining part of this section.
Hammitt et al. [27] described the factors that determine the level of influence of a liquid droplet
impact on a solid surface, he claimed that they are: (a) material and liquid properties; (b)
geometrical aspects (angle of impact, surface roughness, shape and size of droplets); (c) speed of
impact. Hence, in this work all possible combinations between the selected water droplet
conditions and surface conditions are tested. Accordingly, for a given test condition, the response
51
of the two different surface conditions to water droplet impacts would mainly depend on two
aspects: (a) material’s mechanical properties; and (b) geometry of surfaces.
Although, the same material was used, one can assume that due to the difference in the surface
preparation methods, different levels of residual stresses are obtained [58, 59]. This implies that
these different levels of residual stresses may cause a difference in the erosion behavior. However,
it was recently reported that compressive residual stresses induced by burnishing of Ti6Al4V did
not improve or deteriorate the water droplet erosion resistance of Ti6Al4V [15]. In this manner,
the effect of the residual stresses due to different surface preparation methods was assumed
insignificant in this study. Hence, the surface response, would be captured by its geometry, in this
case the surface roughness.
A possible physical explanation for such observation is that the change in the surface roughness
causes the change in the water droplet loading conditions. In other words, if the surface roughness
is changed, the degree at which the surface is being influenced by the lateral outflow, for instance,
would change too. From a tribological prospect, if the surface was (theoretically) perfectly flat,
with no irregularities, the lateral outflow of the water droplets will smoothly slide on it. However,
as the amount of irregularities is more abundant, in the case of rougher surfaces, they will tend to
entrap the lateral outflow of the water droplet, hence, more damage occurs.
This explanation is in accordance with Bowden and Brunton’s theory [33], that the actual damage
mechanism for a surface with pre-existing miniscule steps is the shear stresses induced by the
lateral outflow. In addition, it also fits with Heyamann’s [4, 11] description of erosion as a fatigue-
like phenomenon. Since, the surface irregularities would be very important in initiating fatigue
cracks, as they may act as raisers for the lateral outflow induced shear stresses. In addition, these
irregularities may also act as raisers for stresses induced due to the impact itself [11]. Therefore, it
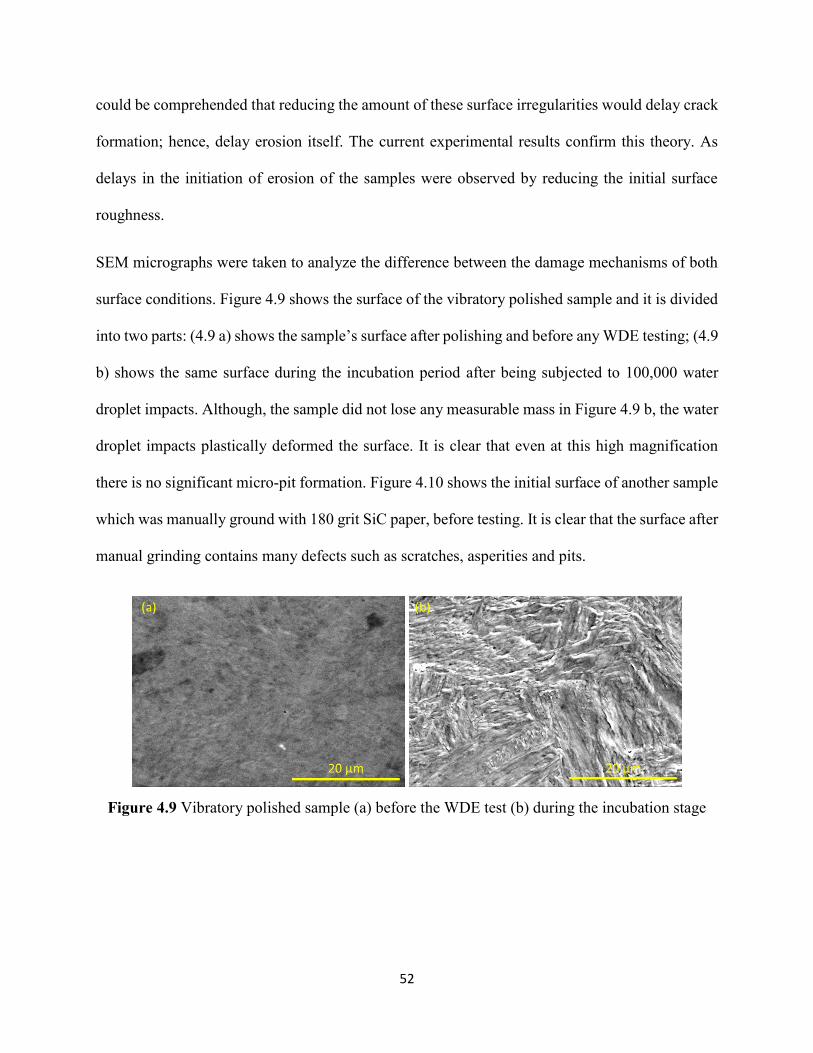
52
could be comprehended that reducing the amount of these surface irregularities would delay crack
formation; hence, delay erosion itself. The current experimental results confirm this theory. As
delays in the initiation of erosion of the samples were observed by reducing the initial surface
roughness.
SEM micrographs were taken to analyze the difference between the damage mechanisms of both
surface conditions. Figure 4.9 shows the surface of the vibratory polished sample and it is divided
into two parts: (4.9 a) shows the sample’s surface after polishing and before any WDE testing; (4.9
b) shows the same surface during the incubation period after being subjected to 100,000 water
droplet impacts. Although, the sample did not lose any measurable mass in Figure 4.9 b, the water
droplet impacts plastically deformed the surface. It is clear that even at this high magnification
there is no significant micro-pit formation. Figure 4.10 shows the initial surface of another sample
which was manually ground with 180 grit SiC paper, before testing. It is clear that the surface after
manual grinding contains many defects such as scratches, asperities and pits.
Figure 4.9 Vibratory polished sample (a) before the WDE test (b) during the incubation stage
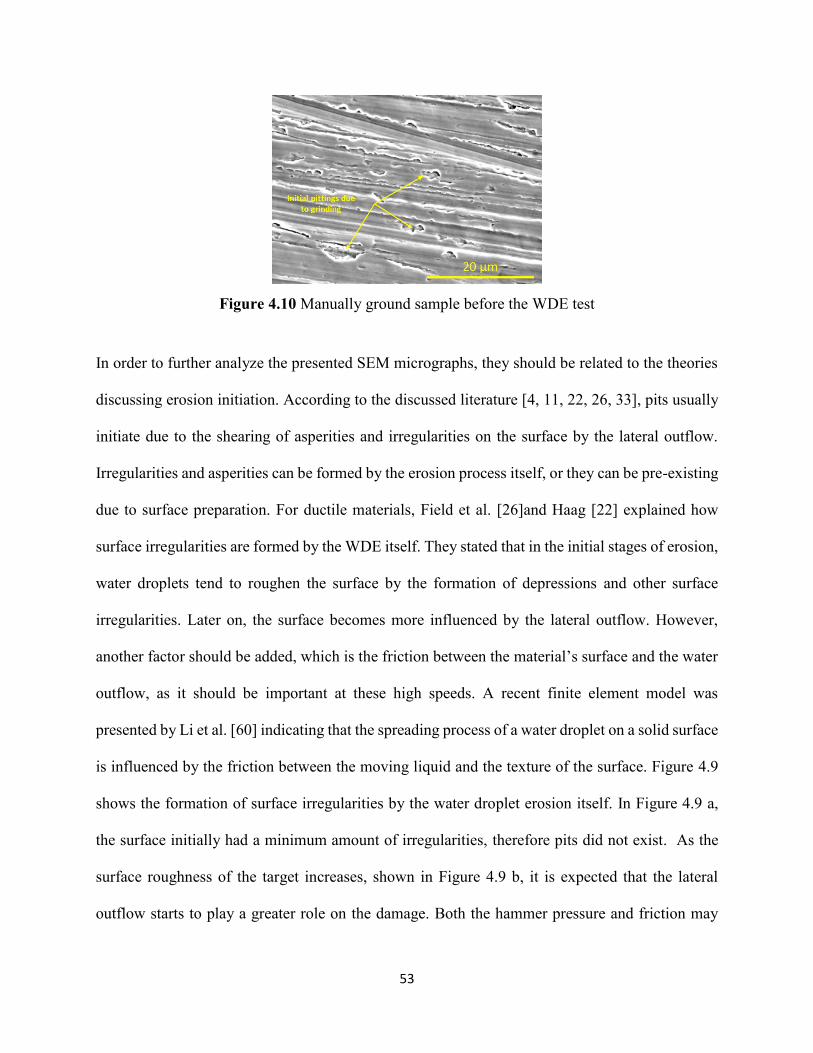
53
Figure 4.10 Manually ground sample before the WDE test
In order to further analyze the presented SEM micrographs, they should be related to the theories
discussing erosion initiation. According to the discussed literature [4, 11, 22, 26, 33], pits usually
initiate due to the shearing of asperities and irregularities on the surface by the lateral outflow.
Irregularities and asperities can be formed by the erosion process itself, or they can be pre-existing
due to surface preparation. For ductile materials, Field et al. [26]and Haag [22] explained how
surface irregularities are formed by the WDE itself. They stated that in the initial stages of erosion,
water droplets tend to roughen the surface by the formation of depressions and other surface
irregularities. Later on, the surface becomes more influenced by the lateral outflow. However,
another factor should be added, which is the friction between the material’s surface and the water
outflow, as it should be important at these high speeds. A recent finite element model was
presented by Li et al. [60] indicating that the spreading process of a water droplet on a solid surface
is influenced by the friction between the moving liquid and the texture of the surface. Figure 4.9
shows the formation of surface irregularities by the water droplet erosion itself. In Figure 4.9 a,
the surface initially had a minimum amount of irregularities, therefore pits did not exist. As the
surface roughness of the target increases, shown in Figure 4.9 b, it is expected that the lateral
outflow starts to play a greater role on the damage. Both the hammer pressure and friction may
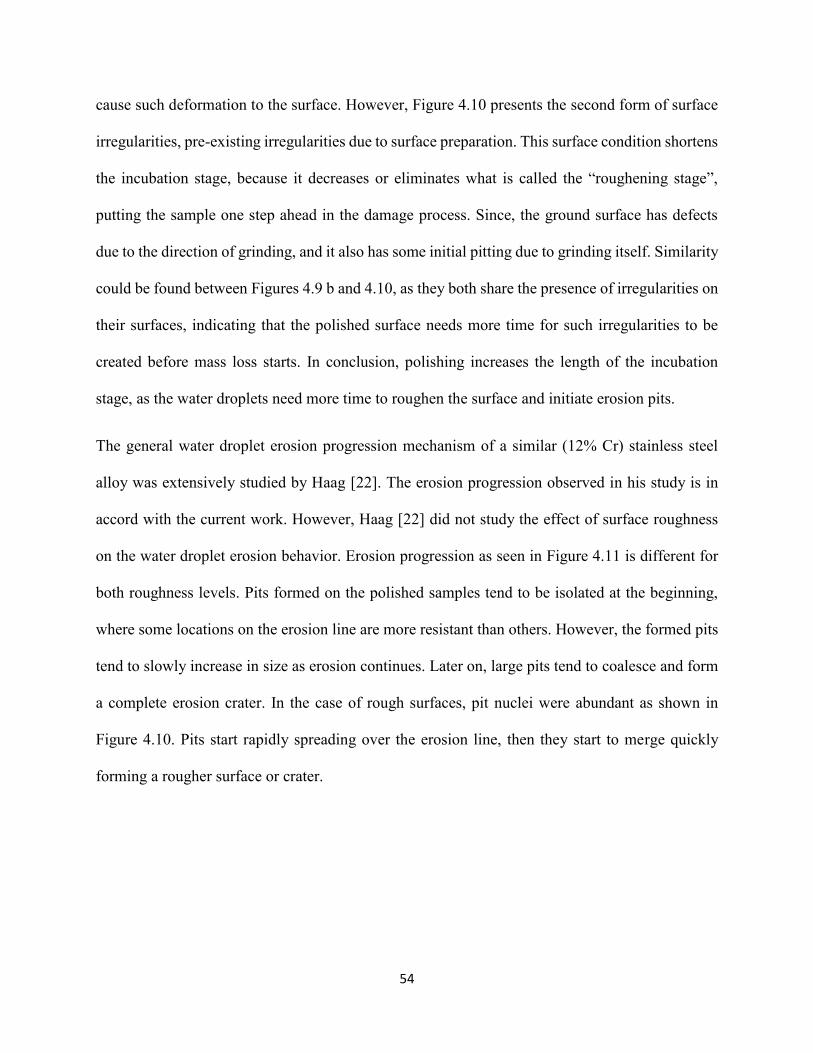
54
cause such deformation to the surface. However, Figure 4.10 presents the second form of surface
irregularities, pre-existing irregularities due to surface preparation. This surface condition shortens
the incubation stage, because it decreases or eliminates what is called the “roughening stage”,
putting the sample one step ahead in the damage process. Since, the ground surface has defects
due to the direction of grinding, and it also has some initial pitting due to grinding itself. Similarity
could be found between Figures 4.9 b and 4.10, as they both share the presence of irregularities on
their surfaces, indicating that the polished surface needs more time for such irregularities to be
created before mass loss starts. In conclusion, polishing increases the length of the incubation
stage, as the water droplets need more time to roughen the surface and initiate erosion pits.
The general water droplet erosion progression mechanism of a similar (12% Cr) stainless steel
alloy was extensively studied by Haag [22]. The erosion progression observed in his study is in
accord with the current work. However, Haag [22] did not study the effect of surface roughness
on the water droplet erosion behavior. Erosion progression as seen in Figure 4.11 is different for
both roughness levels. Pits formed on the polished samples tend to be isolated at the beginning,
where some locations on the erosion line are more resistant than others. However, the formed pits
tend to slowly increase in size as erosion continues. Later on, large pits tend to coalesce and form
a complete erosion crater. In the case of rough surfaces, pit nuclei were abundant as shown in
Figure 4.10. Pits start rapidly spreading over the erosion line, then they start to merge quickly
forming a rougher surface or crater.
55
Figure 4.11 Optical macrographs for erosion progression for a polished sample (top) and a rough
sample (bottom), tested at 300 m/s using 460 µm droplets
This difference in the erosion progression mechanism of both surface conditions may be the reason
for the difference in the maximum erosion rate shown in Figure 4.3. Because as discussed for
polished samples, pit initiation on the surface is gradual and non-uniform. In other words, if a pit
on the erosion line is still in the initiation stage other pits may have reached advanced stages as
can be seen in Figure 4.11. This results in lower overall mass loss and tends to reduce the erosion
rate. However, for rougher surfaces, erosion does not progress in the same manner, where pits
initiate and merge rapidly on the surface causing a large amount of mass loss over a short period
of time, which is represented in the higher maximum erosion rate.
For more severe erosion conditions, there is a reduction in the effect of surface roughness, on both
the incubation period and the maximum erosion rate. It could be attributed to the higher level of
exerted energy, caused by the increase in the droplet size and speed. Because, as the amount of
energy exerted increases, the stresses applied on the surface also increase, which accelerates the
erosion process in general. In the case of an initially smooth surface, these high levels of stresses
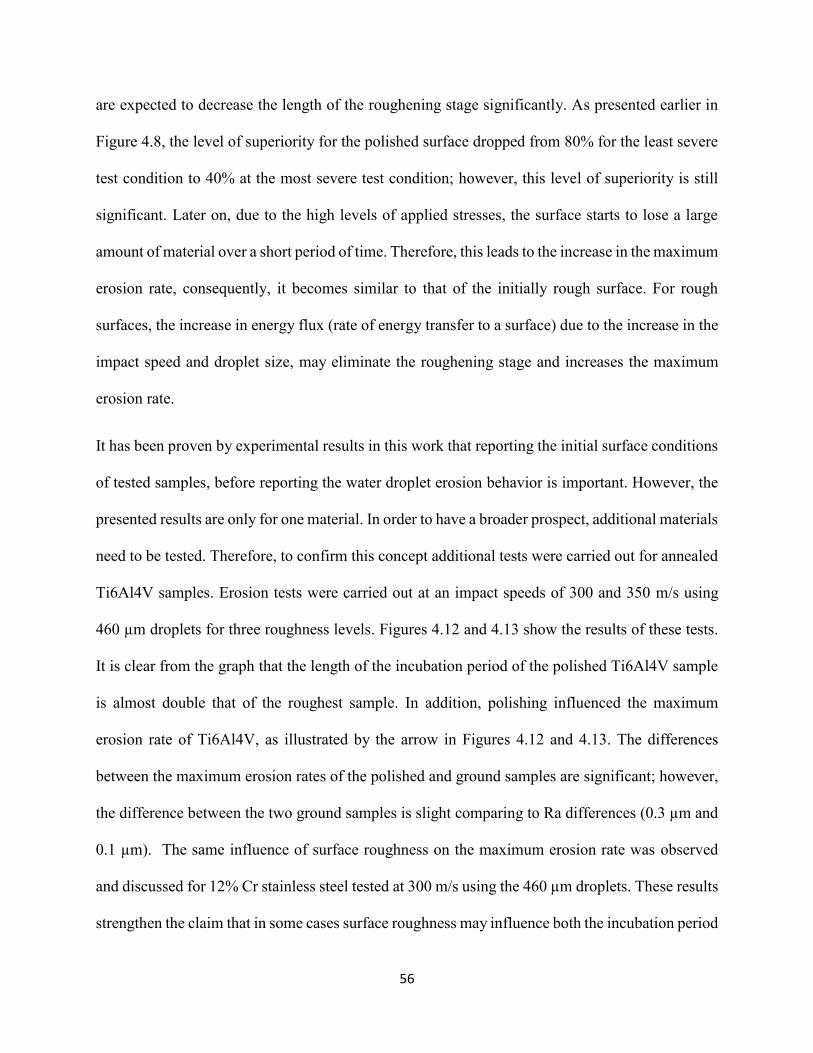
56
are expected to decrease the length of the roughening stage significantly. As presented earlier in
Figure 4.8, the level of superiority for the polished surface dropped from 80% for the least severe
test condition to 40% at the most severe test condition; however, this level of superiority is still
significant. Later on, due to the high levels of applied stresses, the surface starts to lose a large
amount of material over a short period of time. Therefore, this leads to the increase in the maximum
erosion rate, consequently, it becomes similar to that of the initially rough surface. For rough
surfaces, the increase in energy flux (rate of energy transfer to a surface) due to the increase in the
impact speed and droplet size, may eliminate the roughening stage and increases the maximum
erosion rate.
It has been proven by experimental results in this work that reporting the initial surface conditions
of tested samples, before reporting the water droplet erosion behavior is important. However, the
presented results are only for one material. In order to have a broader prospect, additional materials
need to be tested. Therefore, to confirm this concept additional tests were carried out for annealed
Ti6Al4V samples. Erosion tests were carried out at an impact speeds of 300 and 350 m/s using
460 µm droplets for three roughness levels. Figures 4.12 and 4.13 show the results of these tests.
It is clear from the graph that the length of the incubation period of the polished Ti6Al4V sample
is almost double that of the roughest sample. In addition, polishing influenced the maximum
erosion rate of Ti6Al4V, as illustrated by the arrow in Figures 4.12 and 4.13. The differences
between the maximum erosion rates of the polished and ground samples are significant; however,
the difference between the two ground samples is slight comparing to Ra differences (0.3 µm and
0.1 µm). The same influence of surface roughness on the maximum erosion rate was observed
and discussed for 12% Cr stainless steel tested at 300 m/s using the 460 µm droplets. These results
strengthen the claim that in some cases surface roughness may influence both the incubation period
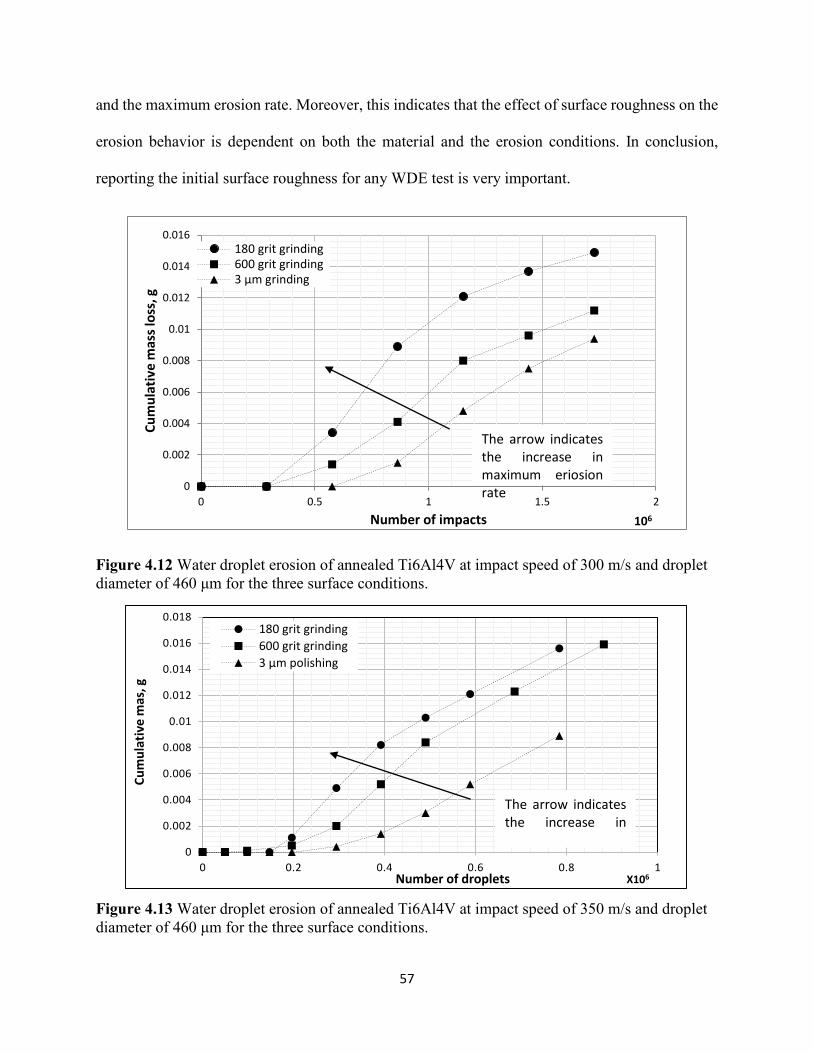
57
and the maximum erosion rate. Moreover, this indicates that the effect of surface roughness on the
erosion behavior is dependent on both the material and the erosion conditions. In conclusion,
reporting the initial surface roughness for any WDE test is very important.
Figure 4.12 Water droplet erosion of annealed Ti6Al4V at impact speed of 300 m/s and droplet
diameter of 460 μm for the three surface conditions.
Figure 4.13 Water droplet erosion of annealed Ti6Al4V at impact speed of 350 m/s and droplet
diameter of 460 μm for the three surface conditions.
0
0.002
0.004
0.006
0.008
0.01
0.012
0.014
0.016
0 0.5 1 1.5 2
Cu
mu
lati
ve m
ass
loss
, g
Number of impacts 106
180 grit grinding600 grit grinding3 µm grinding
The arrow indicatesthe increase inmaximum eriosionrate
0
0.002
0.004
0.006
0.008
0.01
0.012
0.014
0.016
0.018
0 0.2 0.4 0.6 0.8 1X10⁶
180 grit grinding
600 grit grinding
3 µm polishing
Cu
mu
lati
vem
as, g
Number of droplets
The arrow indicatesthe increase in
58
According to the ASTM G73-10 standard [25], the incubation period is the most significant test
result for coatings and surface treatments, as their useful service life may be terminated by the
initial surface damage. According to the results of the current work, reporting the surface
conditions of the coating or the treated surface and the reference material is important. In addition,
the effect of this treatment or coating on the roughness of the resulting surface should be addressed,
especially, when a surface treatment is claimed to prolong the length of incubation stage. It was
found that simple polishing could cause a considerable delay in erosion progression, and reduce
the significance of any further treatment to the surface. For example, it is noticed in this work that
polishing alone increases the incubation period of stainless steel by around 80% for the case of
300 m/s impact speed and 460 µm droplet diameter. In addition, the incubation period of Ti6Al4V
increases by almost 100% for the case of testing at 350 m/s using 460 µm droplet diameter, by
polishing only (compared to 180 grit grinding).
Several articles are presented in the literature claiming the use of treatments and coatings to combat
the WDE wear [24, 61-64]. In his work, Mann et al. [24] presented a surface treatment (high-power
diode laser) paired with a coating (Twin Arc Wire Spraying) for water droplet erosion applications.
They claimed that the erosion resistance of the treated substrate improved by their treatment,
however, they did not mention to which roughness level of the substrate’s surface the treatment
was compared. In another work by Mann et al. [61], they compared the erosion resistances of 10
surface treatments and substrate materials; however, the starting surface roughness of samples was
mentioned in three cases only, these roughness values had a wide range from 0.47 µm to 3.27 µm.
Such considerable variation in the initial surface roughness should be taken into account while
comparing the erosion resistance of the substrate to that of the proposed treatments. In general, it
is advisable to have similar starting surface roughness for water droplet erosion resistance
59
comparison purposes. In addition, the method to produce the surface roughness should also be
considered (i.e. the polishing and grinding method).
Moreover, the improvement achieved by polishing only is comparable to that reported in the
literature for certain surface treatments, as for example in the work of Mann et al. [61]. They
claimed that the incubation period of an HVOF coated 12% Cr stainless steel with WC–10Co–4C
was two times higher than the uncoated substrate, when tested at 147 m/s and a water-jet diameter
of 3.77 mm. These results are close to what was presented in this work by simple polishing of a
similar 12% Cr stainless steel alloy, when it was tested at even a higher speed of 300 m/s and
droplet size of 460 µm. However, it would be expected that if the surface roughness of the coated
sample (3.27 µm Ra) was reduced, the coating would have shown better results. This claim is
supported by what was discussed by Mahdipoor et al. [65] concerning the effect of the surface
roughness on the water droplet behavior of HVOF coatings for water droplet erosion applications.
Therefore, as a recommendation, improving the final surface quality by reducing the surface
roughness of treated or untreated material surfaces used in WDE applications, is a viable tool to
delay erosion.
4.3. Summary
This chapter provides a quantitative evaluation of the effect of the surface roughness on the
incubation period, especially, for 12% Cr stainless steel. Important points could be summarized as
following:
1- This study revealed that the surface roughness has a significant impact on the water droplet
erosion behavior.
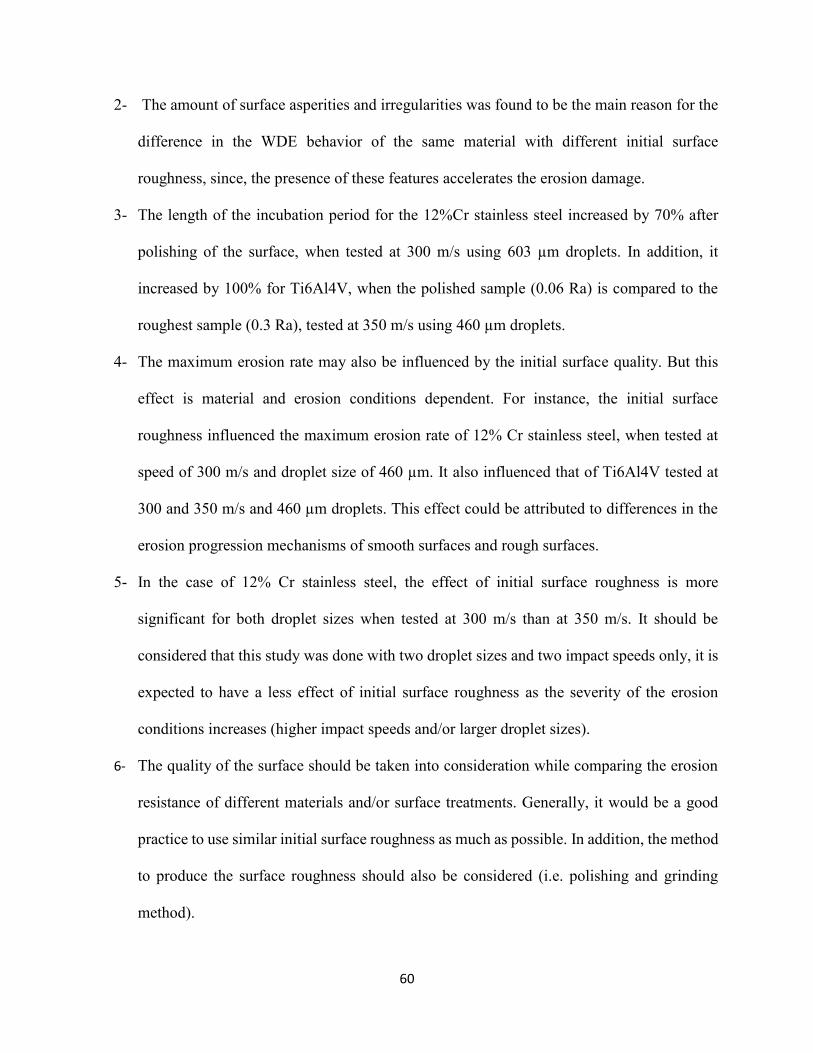
60
2- The amount of surface asperities and irregularities was found to be the main reason for the
difference in the WDE behavior of the same material with different initial surface
roughness, since, the presence of these features accelerates the erosion damage.
3- The length of the incubation period for the 12%Cr stainless steel increased by 70% after
polishing of the surface, when tested at 300 m/s using 603 µm droplets. In addition, it
increased by 100% for Ti6Al4V, when the polished sample (0.06 Ra) is compared to the
roughest sample (0.3 Ra), tested at 350 m/s using 460 µm droplets.
4- The maximum erosion rate may also be influenced by the initial surface quality. But this
effect is material and erosion conditions dependent. For instance, the initial surface
roughness influenced the maximum erosion rate of 12% Cr stainless steel, when tested at
speed of 300 m/s and droplet size of 460 µm. It also influenced that of Ti6Al4V tested at
300 and 350 m/s and 460 µm droplets. This effect could be attributed to differences in the
erosion progression mechanisms of smooth surfaces and rough surfaces.
5- In the case of 12% Cr stainless steel, the effect of initial surface roughness is more
significant for both droplet sizes when tested at 300 m/s than at 350 m/s. It should be
considered that this study was done with two droplet sizes and two impact speeds only, it is
expected to have a less effect of initial surface roughness as the severity of the erosion
conditions increases (higher impact speeds and/or larger droplet sizes).
6- The quality of the surface should be taken into consideration while comparing the erosion
resistance of different materials and/or surface treatments. Generally, it would be a good
practice to use similar initial surface roughness as much as possible. In addition, the method
to produce the surface roughness should also be considered (i.e. polishing and grinding
method).
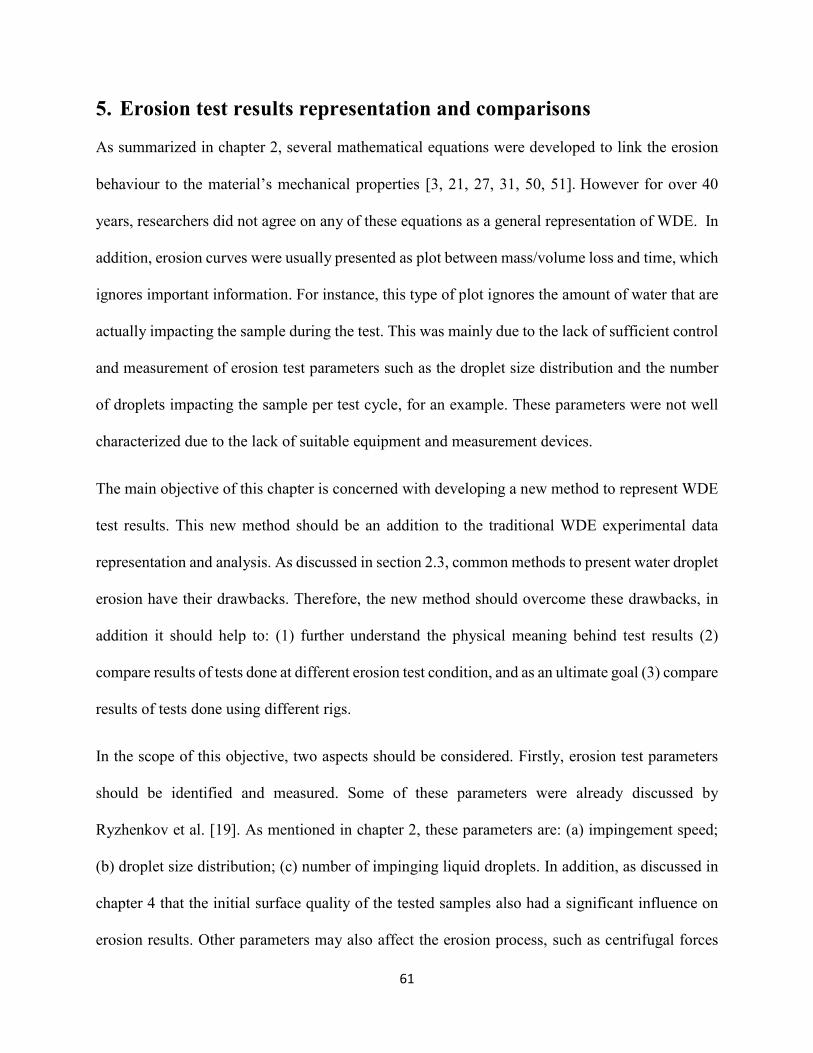
61
5. Erosion test results representation and comparisons
As summarized in chapter 2, several mathematical equations were developed to link the erosion
behaviour to the material’s mechanical properties [3, 21, 27, 31, 50, 51]. However for over 40
years, researchers did not agree on any of these equations as a general representation of WDE. In
addition, erosion curves were usually presented as plot between mass/volume loss and time, which
ignores important information. For instance, this type of plot ignores the amount of water that are
actually impacting the sample during the test. This was mainly due to the lack of sufficient control
and measurement of erosion test parameters such as the droplet size distribution and the number
of droplets impacting the sample per test cycle, for an example. These parameters were not well
characterized due to the lack of suitable equipment and measurement devices.
The main objective of this chapter is concerned with developing a new method to represent WDE
test results. This new method should be an addition to the traditional WDE experimental data
representation and analysis. As discussed in section 2.3, common methods to present water droplet
erosion have their drawbacks. Therefore, the new method should overcome these drawbacks, in
addition it should help to: (1) further understand the physical meaning behind test results (2)
compare results of tests done at different erosion test condition, and as an ultimate goal (3) compare
results of tests done using different rigs.
In the scope of this objective, two aspects should be considered. Firstly, erosion test parameters
should be identified and measured. Some of these parameters were already discussed by
Ryzhenkov et al. [19]. As mentioned in chapter 2, these parameters are: (a) impingement speed;
(b) droplet size distribution; (c) number of impinging liquid droplets. In addition, as discussed in
chapter 4 that the initial surface quality of the tested samples also had a significant influence on
erosion results. Other parameters may also affect the erosion process, such as centrifugal forces
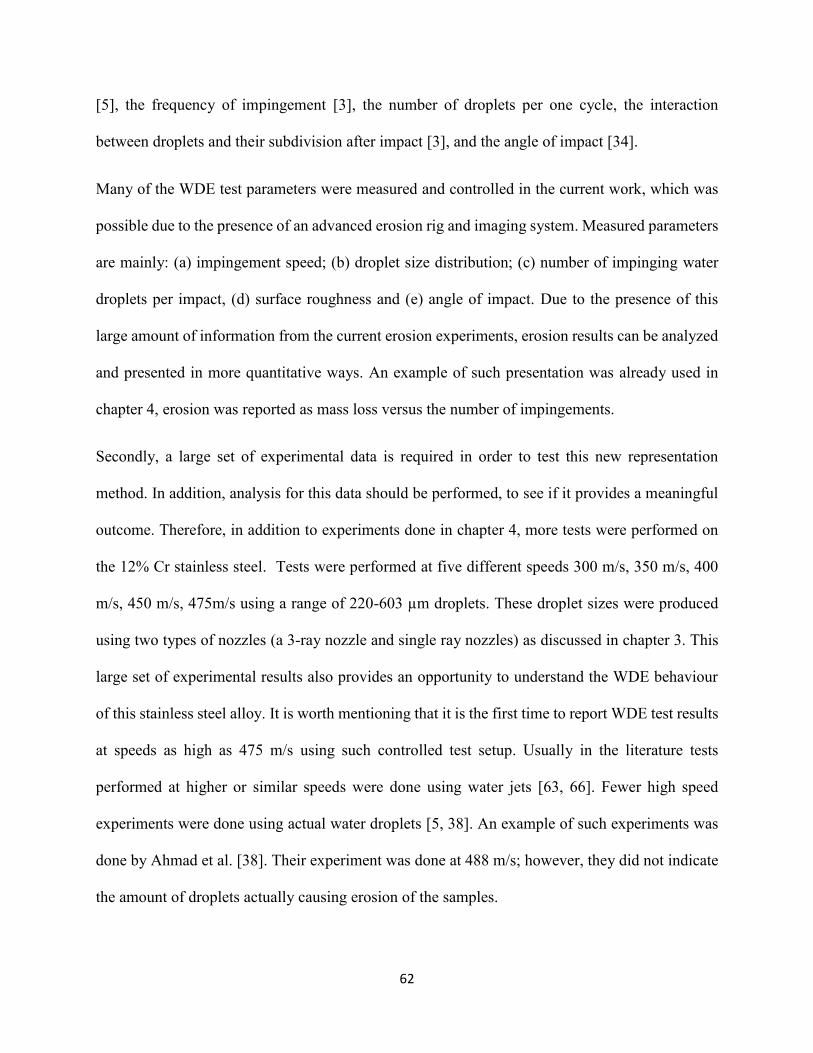
62
[5], the frequency of impingement [3], the number of droplets per one cycle, the interaction
between droplets and their subdivision after impact [3], and the angle of impact [34].
Many of the WDE test parameters were measured and controlled in the current work, which was
possible due to the presence of an advanced erosion rig and imaging system. Measured parameters
are mainly: (a) impingement speed; (b) droplet size distribution; (c) number of impinging water
droplets per impact, (d) surface roughness and (e) angle of impact. Due to the presence of this
large amount of information from the current erosion experiments, erosion results can be analyzed
and presented in more quantitative ways. An example of such presentation was already used in
chapter 4, erosion was reported as mass loss versus the number of impingements.
Secondly, a large set of experimental data is required in order to test this new representation
method. In addition, analysis for this data should be performed, to see if it provides a meaningful
outcome. Therefore, in addition to experiments done in chapter 4, more tests were performed on
the 12% Cr stainless steel. Tests were performed at five different speeds 300 m/s, 350 m/s, 400
m/s, 450 m/s, 475m/s using a range of 220-603 µm droplets. These droplet sizes were produced
using two types of nozzles (a 3-ray nozzle and single ray nozzles) as discussed in chapter 3. This
large set of experimental results also provides an opportunity to understand the WDE behaviour
of this stainless steel alloy. It is worth mentioning that it is the first time to report WDE test results
at speeds as high as 475 m/s using such controlled test setup. Usually in the literature tests
performed at higher or similar speeds were done using water jets [63, 66]. Fewer high speed
experiments were done using actual water droplets [5, 38]. An example of such experiments was
done by Ahmad et al. [38]. Their experiment was done at 488 m/s; however, they did not indicate
the amount of droplets actually causing erosion of the samples.
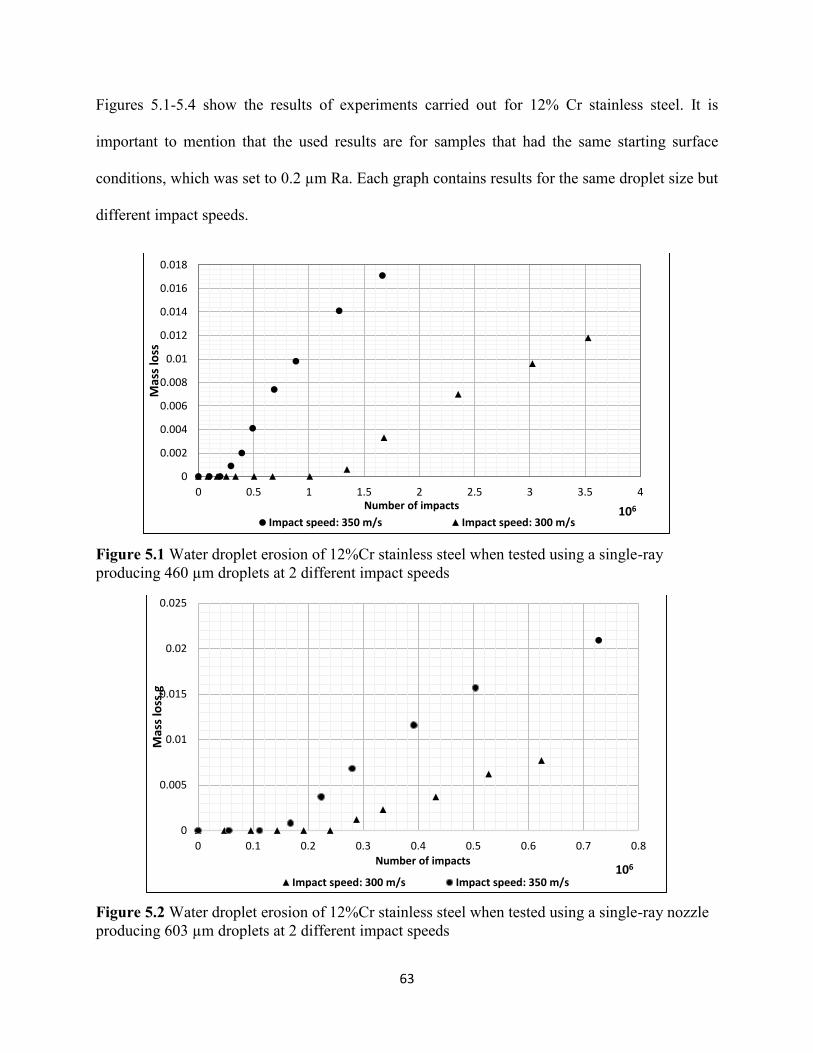
63
Figures 5.1-5.4 show the results of experiments carried out for 12% Cr stainless steel. It is
important to mention that the used results are for samples that had the same starting surface
conditions, which was set to 0.2 µm Ra. Each graph contains results for the same droplet size but
different impact speeds.
Figure 5.1 Water droplet erosion of 12%Cr stainless steel when tested using a single-ray
producing 460 µm droplets at 2 different impact speeds
Figure 5.2 Water droplet erosion of 12%Cr stainless steel when tested using a single-ray nozzle
producing 603 µm droplets at 2 different impact speeds
0
0.002
0.004
0.006
0.008
0.01
0.012
0.014
0.016
0.018
0 0.5 1 1.5 2 2.5 3 3.5 4
Mas
s lo
ss
Number of impacts 106
Impact speed: 350 m/s Impact speed: 300 m/s
0
0.005
0.01
0.015
0.02
0.025
0 0.1 0.2 0.3 0.4 0.5 0.6 0.7 0.8
Mas
s lo
ss,g
Number of impacts106
Impact speed: 300 m/s Impact speed: 350 m/s
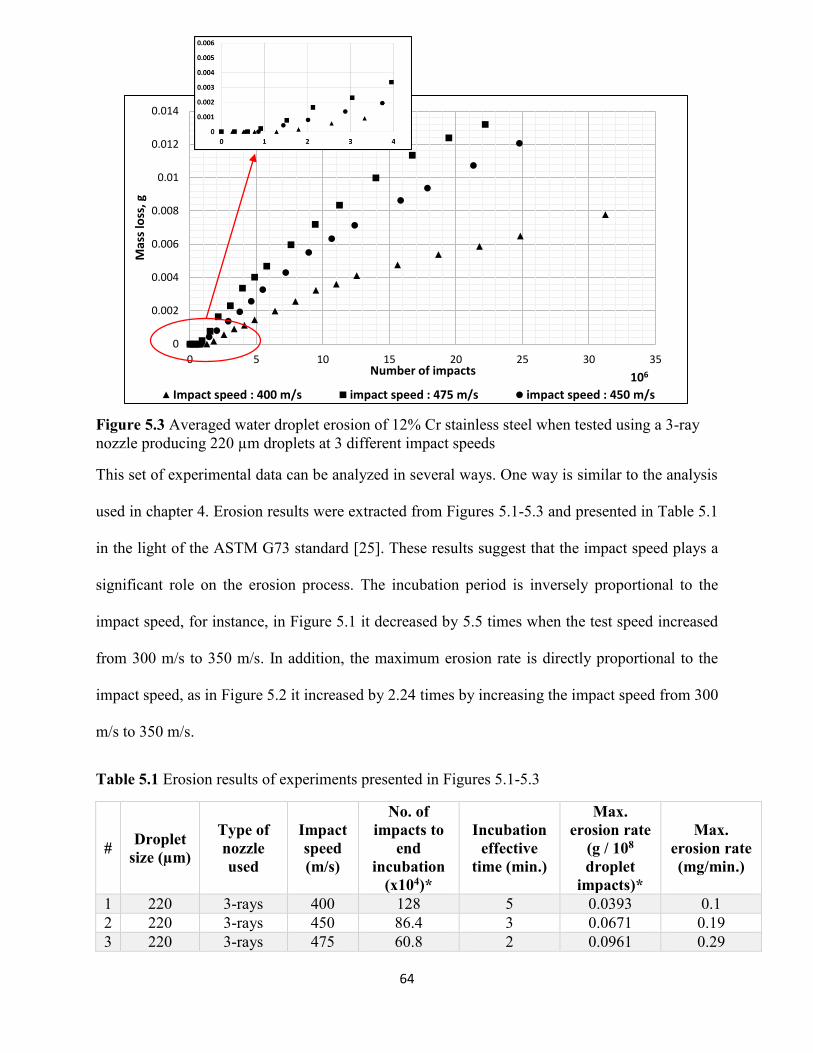
64
Figure 5.3 Averaged water droplet erosion of 12% Cr stainless steel when tested using a 3-ray
nozzle producing 220 µm droplets at 3 different impact speeds
This set of experimental data can be analyzed in several ways. One way is similar to the analysis
used in chapter 4. Erosion results were extracted from Figures 5.1-5.3 and presented in Table 5.1
in the light of the ASTM G73 standard [25]. These results suggest that the impact speed plays a
significant role on the erosion process. The incubation period is inversely proportional to the
impact speed, for instance, in Figure 5.1 it decreased by 5.5 times when the test speed increased
from 300 m/s to 350 m/s. In addition, the maximum erosion rate is directly proportional to the
impact speed, as in Figure 5.2 it increased by 2.24 times by increasing the impact speed from 300
m/s to 350 m/s.
Table 5.1 Erosion results of experiments presented in Figures 5.1-5.3
# Droplet
size (µm)
Type of
nozzle
used
Impact
speed
(m/s)
No. of
impacts to
end
incubation
(x104)*
Incubation
effective
time (min.)
Max.
erosion rate
(g / 108
droplet
impacts)*
Max.
erosion rate
(mg/min.)
1 220 3-rays 400 128 5 0.0393 0.1
2 220 3-rays 450 86.4 3 0.0671 0.19
3 220 3-rays 475 60.8 2 0.0961 0.29
0
0.002
0.004
0.006
0.008
0.01
0.012
0.014
0 5 10 15 20 25 30 35
Mas
s lo
ss, g
Number of impacts106
Impact speed : 400 m/s impact speed : 475 m/s impact speed : 450 m/s
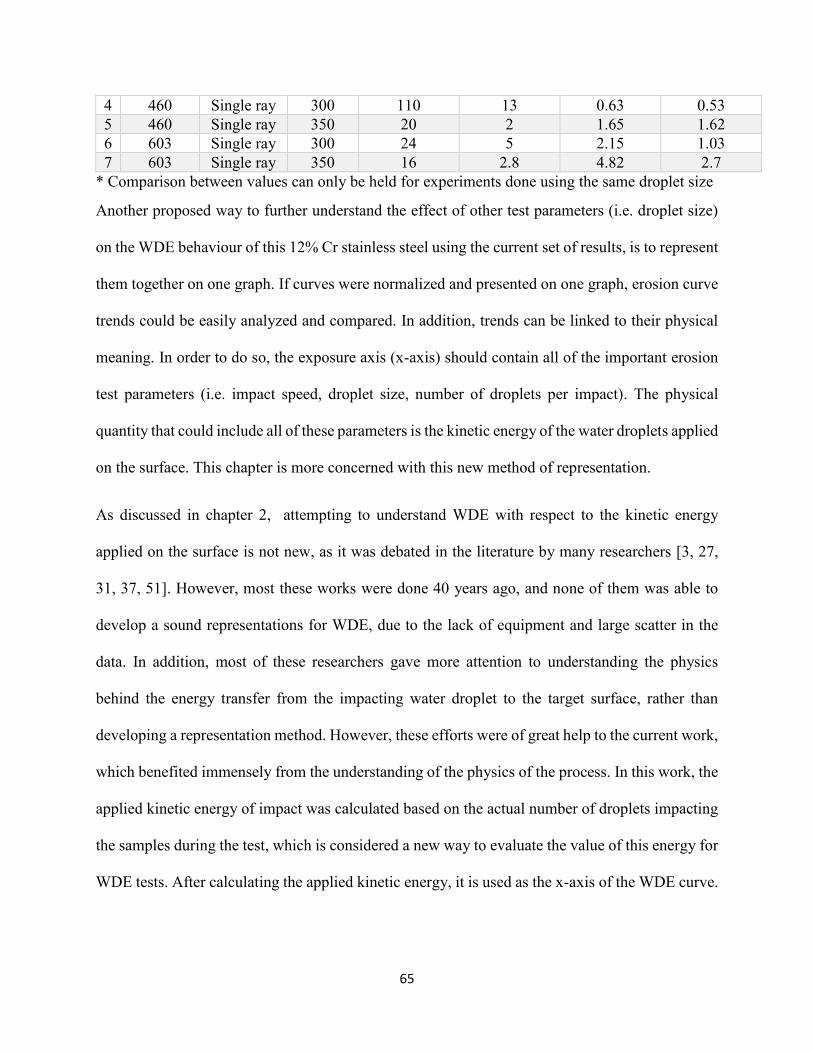
65
4 460 Single ray 300 110 13 0.63 0.53
5 460 Single ray 350 20 2 1.65 1.62
6 603 Single ray 300 24 5 2.15 1.03
7 603 Single ray 350 16 2.8 4.82 2.7
* Comparison between values can only be held for experiments done using the same droplet size
Another proposed way to further understand the effect of other test parameters (i.e. droplet size)
on the WDE behaviour of this 12% Cr stainless steel using the current set of results, is to represent
them together on one graph. If curves were normalized and presented on one graph, erosion curve
trends could be easily analyzed and compared. In addition, trends can be linked to their physical
meaning. In order to do so, the exposure axis (x-axis) should contain all of the important erosion
test parameters (i.e. impact speed, droplet size, number of droplets per impact). The physical
quantity that could include all of these parameters is the kinetic energy of the water droplets applied
on the surface. This chapter is more concerned with this new method of representation.
As discussed in chapter 2, attempting to understand WDE with respect to the kinetic energy
applied on the surface is not new, as it was debated in the literature by many researchers [3, 27,
31, 37, 51]. However, most these works were done 40 years ago, and none of them was able to
develop a sound representations for WDE, due to the lack of equipment and large scatter in the
data. In addition, most of these researchers gave more attention to understanding the physics
behind the energy transfer from the impacting water droplet to the target surface, rather than
developing a representation method. However, these efforts were of great help to the current work,
which benefited immensely from the understanding of the physics of the process. In this work, the
applied kinetic energy of impact was calculated based on the actual number of droplets impacting
the samples during the test, which is considered a new way to evaluate the value of this energy for
WDE tests. After calculating the applied kinetic energy, it is used as the x-axis of the WDE curve.
66
In the following section, a new method for estimating the applied kinetic energy to represent WDE
results are discussed in details.
5.1. Erosion representation in terms of applied kinetic energy
Basically, the dominant source of energy input to the surface is the impingement of liquid droplets.
Therefore, the total energy applied on the surface is the kinetic energy of the water droplets, which
could be calculated based on the following equation:
Ek = 1
2 . 𝑚. 𝑣2 (5.1) Where,
𝑚 = 𝑁𝑑𝑟𝑜𝑝. 𝜌𝑤𝑎𝑡𝑒𝑟 . 𝑉𝑑𝑟𝑜𝑝 ; (5.2)
𝑣 is the impingement speed; 𝑁𝑑𝑟𝑜𝑝 is the number of droplets impinging the surface; 𝑉𝑑𝑟𝑜𝑝 is the
volume of one droplet assuming it to be a sphere; ρwater is the density of water. All parameters of
the kinetic energy equation are measured in this work. Therefor the x-axis could be represented in
terms of the applied kinetic energy.
Another parameter that should be taken into account is the impacted area, since larger droplets
impact relatively larger areas and vice versa. Therefore, this area should be taken into account
when calculating the applied kinetic energy of impact. The value of such area was measured from
the optical macrographs at the end of the incubation periods as discussed in chapter 4. After
normalizing the applied kinetic energy by the impacted area, it will be referred to as the applied
energy intensity.
Volume loss is a more general method to represent the y-axis, using this term makes it possible to
compare materials with different densities.
𝑉𝑙𝑜𝑠𝑠 = 𝑚𝑙𝑜𝑠𝑠
𝜌𝑚𝑎𝑡𝑒𝑟𝑖𝑎𝑙 (5.3)
67
Volume loss was also normalized using the impacted area, hence, it shows the amount of volume
loss per unit impacted area (1 mm2). The main reason for using the same area for normalizing both
the x and y axes is to have an erosion rate that is not influenced by any error in measuring the area
used for normalization. Figure 5.4 shows the WDE test results for the 12% Cr stainless steel after
using the kinetic energy of impact as the x-axis and volume loss as the y-axis.
According to a simple logic, one may expect all curves to coincide, since they are for the same
material. In other words, for the same applied kinetic energy a certain level of erosion should
follow, independent of the erosion parameters used in each experiment. This happened in some
occasions, which means that for these particular tests conditions, the response of the material is
the same, when different test conditions (i.e. impact speed and droplet size) were used. However,
this did not happen for all the data sets. The dashed line in Figure 5.4 represents a certain amount
of applied kinetic energy, and it is clear that the material response is different for each combination
of test parameters. In order to understand these variations, it is important to understand the relation
between the erosion parameters and the applied kinetic energy. This will take us to the concept of
the efficiency of energy transfer due droplet/solid surface interaction, and how this efficiency
varies by changing the test conditions [3, 27]. This concept and the analysis of the experimental
results using this new representation method are discussed in the following section.
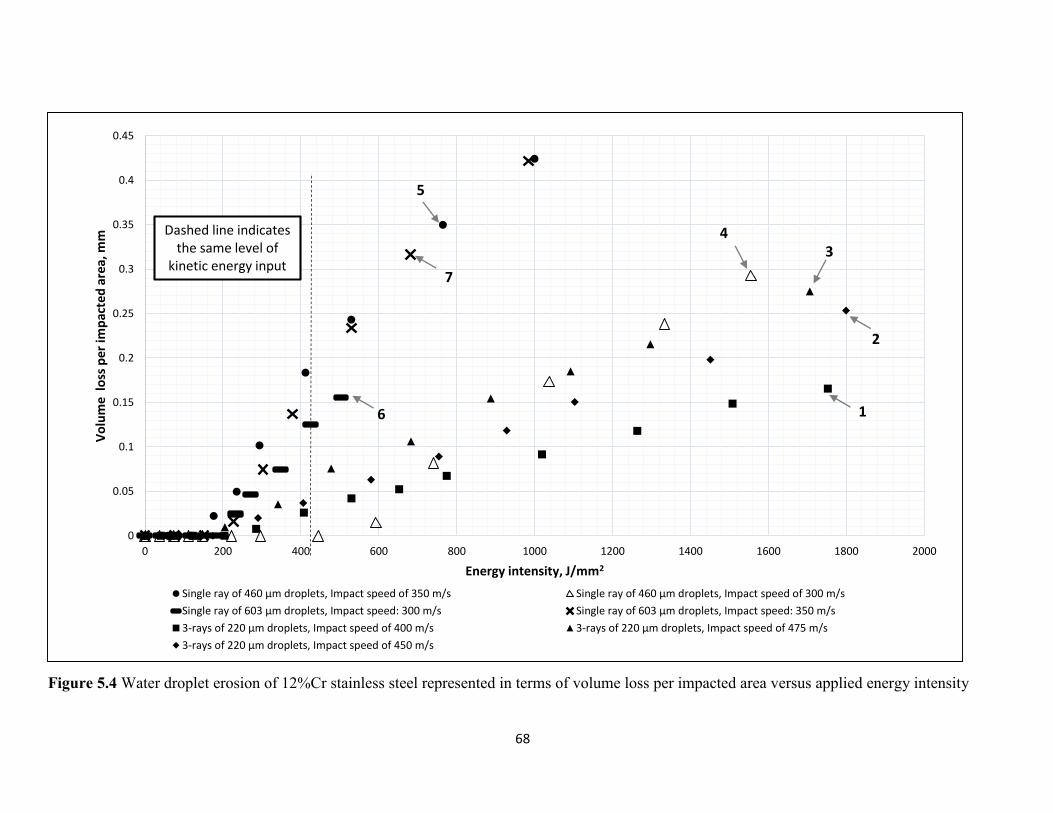
68
Figure 5.4 Water droplet erosion of 12%Cr stainless steel represented in terms of volume loss per impacted area versus applied energy intensity
0
0.05
0.1
0.15
0.2
0.25
0.3
0.35
0.4
0.45
0 200 400 600 800 1000 1200 1400 1600 1800 2000
Vo
lum
e l
oss
per
imp
acte
d a
rea,
mm
Energy intensity, J/mm2
Single ray of 460 µm droplets, Impact speed of 350 m/s Single ray of 460 µm droplets, Impact speed of 300 m/s
Single ray of 603 µm droplets, Impact speed: 300 m/s Single ray of 603 µm droplets, Impact speed: 350 m/s
3-rays of 220 µm droplets, Impact speed of 400 m/s 3-rays of 220 µm droplets, Impact speed of 475 m/s
3-rays of 220 µm droplets, Impact speed of 450 m/s
Dashed line indicatesthe same level of
kinetic energy input
5
7
1
2
34
6
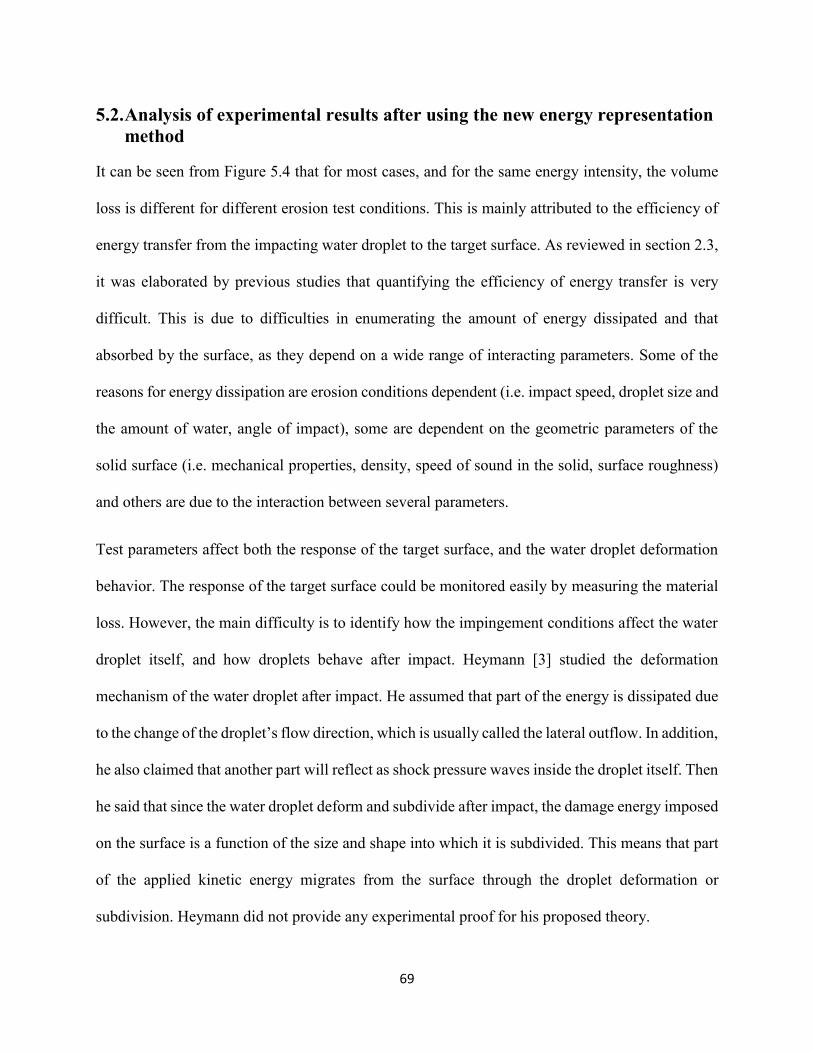
69
5.2. Analysis of experimental results after using the new energy representation
method
It can be seen from Figure 5.4 that for most cases, and for the same energy intensity, the volume
loss is different for different erosion test conditions. This is mainly attributed to the efficiency of
energy transfer from the impacting water droplet to the target surface. As reviewed in section 2.3,
it was elaborated by previous studies that quantifying the efficiency of energy transfer is very
difficult. This is due to difficulties in enumerating the amount of energy dissipated and that
absorbed by the surface, as they depend on a wide range of interacting parameters. Some of the
reasons for energy dissipation are erosion conditions dependent (i.e. impact speed, droplet size and
the amount of water, angle of impact), some are dependent on the geometric parameters of the
solid surface (i.e. mechanical properties, density, speed of sound in the solid, surface roughness)
and others are due to the interaction between several parameters.
Test parameters affect both the response of the target surface, and the water droplet deformation
behavior. The response of the target surface could be monitored easily by measuring the material
loss. However, the main difficulty is to identify how the impingement conditions affect the water
droplet itself, and how droplets behave after impact. Heymann [3] studied the deformation
mechanism of the water droplet after impact. He assumed that part of the energy is dissipated due
to the change of the droplet’s flow direction, which is usually called the lateral outflow. In addition,
he also claimed that another part will reflect as shock pressure waves inside the droplet itself. Then
he said that since the water droplet deform and subdivide after impact, the damage energy imposed
on the surface is a function of the size and shape into which it is subdivided. This means that part
of the applied kinetic energy migrates from the surface through the droplet deformation or
subdivision. Heymann did not provide any experimental proof for his proposed theory.
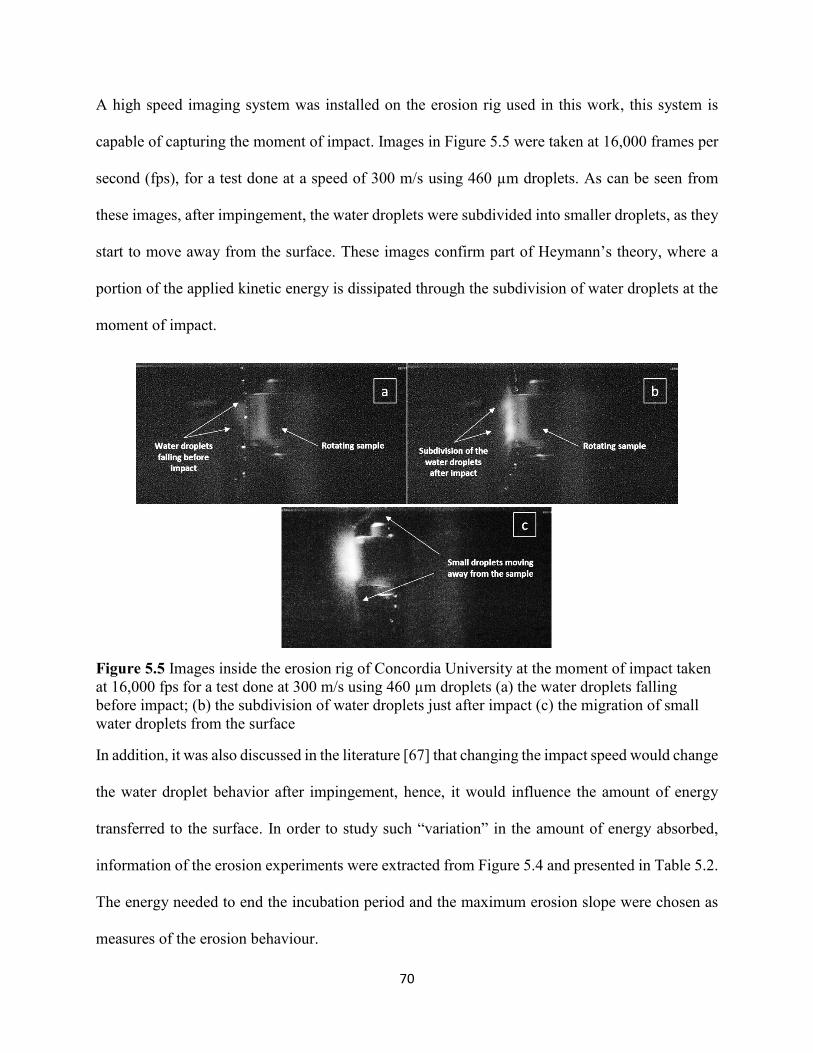
70
A high speed imaging system was installed on the erosion rig used in this work, this system is
capable of capturing the moment of impact. Images in Figure 5.5 were taken at 16,000 frames per
second (fps), for a test done at a speed of 300 m/s using 460 µm droplets. As can be seen from
these images, after impingement, the water droplets were subdivided into smaller droplets, as they
start to move away from the surface. These images confirm part of Heymann’s theory, where a
portion of the applied kinetic energy is dissipated through the subdivision of water droplets at the
moment of impact.
Figure 5.5 Images inside the erosion rig of Concordia University at the moment of impact taken
at 16,000 fps for a test done at 300 m/s using 460 µm droplets (a) the water droplets falling
before impact; (b) the subdivision of water droplets just after impact (c) the migration of small
water droplets from the surface
In addition, it was also discussed in the literature [67] that changing the impact speed would change
the water droplet behavior after impingement, hence, it would influence the amount of energy
transferred to the surface. In order to study such “variation” in the amount of energy absorbed,
information of the erosion experiments were extracted from Figure 5.4 and presented in Table 5.2.
The energy needed to end the incubation period and the maximum erosion slope were chosen as
measures of the erosion behaviour.
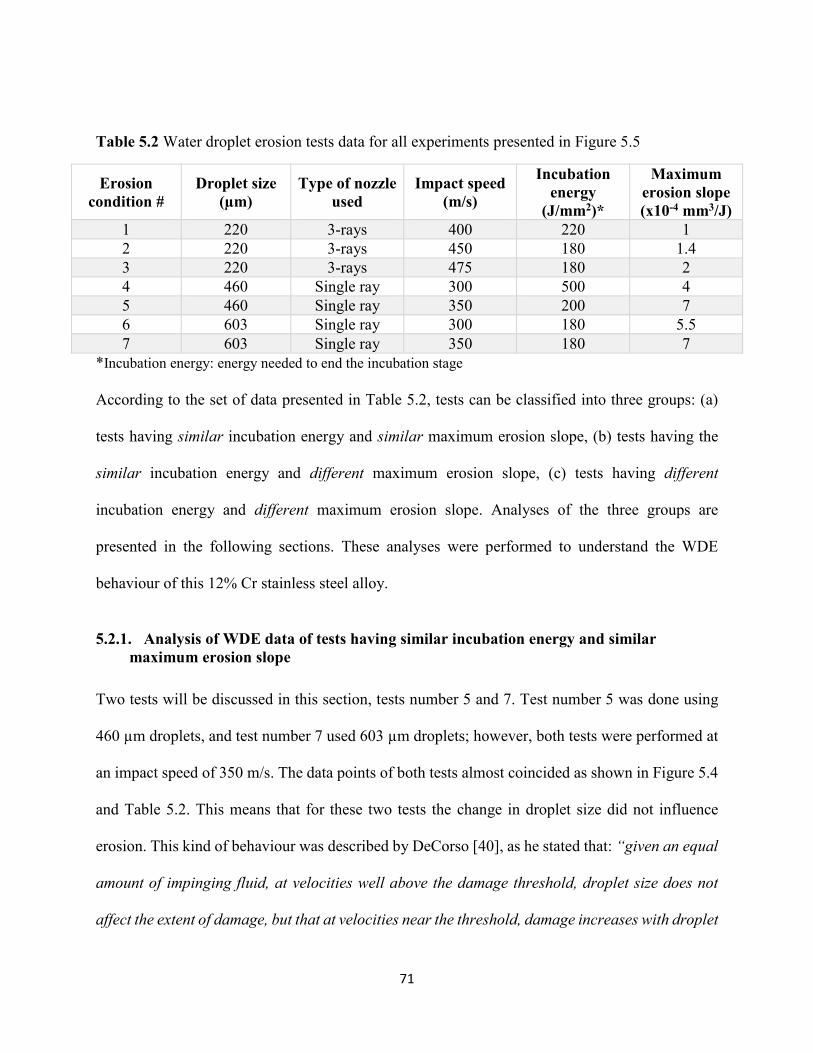
71
Table 5.2 Water droplet erosion tests data for all experiments presented in Figure 5.5
Erosion
condition #
Droplet size
(µm)
Type of nozzle
used
Impact speed
(m/s)
Incubation
energy
(J/mm2)*
Maximum
erosion slope
(x10-4 mm3/J)
1 220 3-rays 400 220 1
2 220 3-rays 450 180 1.4
3 220 3-rays 475 180 2
4 460 Single ray 300 500 4
5 460 Single ray 350 200 7
6 603 Single ray 300 180 5.5
7 603 Single ray 350 180 7
*Incubation energy: energy needed to end the incubation stage
According to the set of data presented in Table 5.2, tests can be classified into three groups: (a)
tests having similar incubation energy and similar maximum erosion slope, (b) tests having the
similar incubation energy and different maximum erosion slope, (c) tests having different
incubation energy and different maximum erosion slope. Analyses of the three groups are
presented in the following sections. These analyses were performed to understand the WDE
behaviour of this 12% Cr stainless steel alloy.
5.2.1. Analysis of WDE data of tests having similar incubation energy and similar
maximum erosion slope
Two tests will be discussed in this section, tests number 5 and 7. Test number 5 was done using
460 µm droplets, and test number 7 used 603 µm droplets; however, both tests were performed at
an impact speed of 350 m/s. The data points of both tests almost coincided as shown in Figure 5.4
and Table 5.2. This means that for these two tests the change in droplet size did not influence
erosion. This kind of behaviour was described by DeCorso [40], as he stated that: “given an equal
amount of impinging fluid, at velocities well above the damage threshold, droplet size does not
affect the extent of damage, but that at velocities near the threshold, damage increases with droplet
72
size”. In order for his claim to be related to the presented results of this work (i.e. tests number 5
and 7), samples tested with different droplet sizes should be subjected to the same volume of water.
For the erosion rig used in the current study, the impingement speed is derived from the relation
between the frequency of rotation (RPM) and radius of rotation. The amount of water impinging
the surface is also function of the RPM. Therefore, the amount of water impinging the sample per
minute differs as we change the impingement speed. For experiments done at 350 m/s, the volume
of water impacting a unit area per rotation for 460µm and 603µm droplets is 0.068 ml and 0.07
ml, respectively. These values are very close, and were calculated based on the following equation:
𝑉𝑝𝑒𝑟 𝑟𝑜𝑡𝑎𝑡𝑖𝑜𝑛 = 𝑁𝑑𝑟𝑜𝑝./𝑟𝑜𝑡𝑎𝑡𝑖𝑜𝑛 . 𝑉𝑜𝑛𝑒 𝑑𝑟𝑜𝑝
𝑖𝑚𝑝𝑎𝑐𝑡𝑒𝑑 𝑎𝑟𝑒𝑎 (5.3)
Therefore, tests done at 350 m/s and different droplet sizes (460 µm, 603 µm) are expected to have
the same volume of impinging water droplets. Accordingly, the convergence in the erosion curves
of these experiments satisfies and confirms Decorso’s statement. However, this case is special in
the current set of tests. In order to generalize this conclusion, experiments with same volume of
water and different droplet sizes should be performed. Moreover, the similarity of results for tests
5 and 7 can be explained in term of energy. It could be claimed that the energy intensity applied
on the samples in both experiments is similar.
It is worth mentioning that such conclusion was made possible due to the used new method of
representation. Since such coincidence of curves would not have occurred if the data was
represented using the traditional method of representation (i.e. material loss vs. time or number of
impacts, as in Figures 5.1-5.4).
73
5.2.2. Analysis of WDE data of tests having similar incubation energy and different
maximum erosion slope
The results of six tests will be discussed in this section, they are tests number 1-3 and 5-7. The
incubation energy of all samples in these tests is in the range of 180-220 J/mm2. However after
the end of incubation, the maximum erosion slopes showed large differences between experiments
using 460 µm and 603 µm droplet sizes on one side, and experiments using 220 µm droplets on
the other. For instance, the maximum erosion slope of the test performed at 350 m/s using 460 µm
droplets, is higher than that of the test carried out using 220 µm and 400 m/s, by around 7 times.
Although, the used impact speeds in this test are higher (i.e. 400 m/s), the used droplet size is
smaller (i.e. 220 µm). This suggests that the material responded similarly when subjected to these
combinations of droplet sizes and speeds until the end of the incubation stage. As the WDE craters
started to form on the surfaces of the samples, it seems that the droplet size started to play a larger
role on the erosion process. In order to justify this argument, the fracture surfaces resulted from
tests number 1 and 5 (220 µm and 460 µm) were studied, as shown in Figure 5.6. It is important
to mention that both samples shown in Figure 5.6 are in their terminal erosion stages. Figure 5.6
(a) shows the formation of pits in a size range of 100-300 µm on the eroded surface of stainless
steel samples, when tested using 220 µm droplets. It can be seen that the formed pits are abundant
on the surface, and that the size of these pits are close to the droplet size. It was not the case in
Figure 5.6 (b), when the sample was tested using 460 µm droplets, since the surface does not show
any special pattern in the erosion crater. These images suggest that there is a relation between three
parameters: (a) the maximum erosion slope, (b) water droplet size, and (c) any pattern that may
form on the fracture surface.
This argument can also be supported by Heymann [3], as he claimed that when the damage on the
surface is large enough exceeding the size of the droplet, the effect of impact is attenuated. He
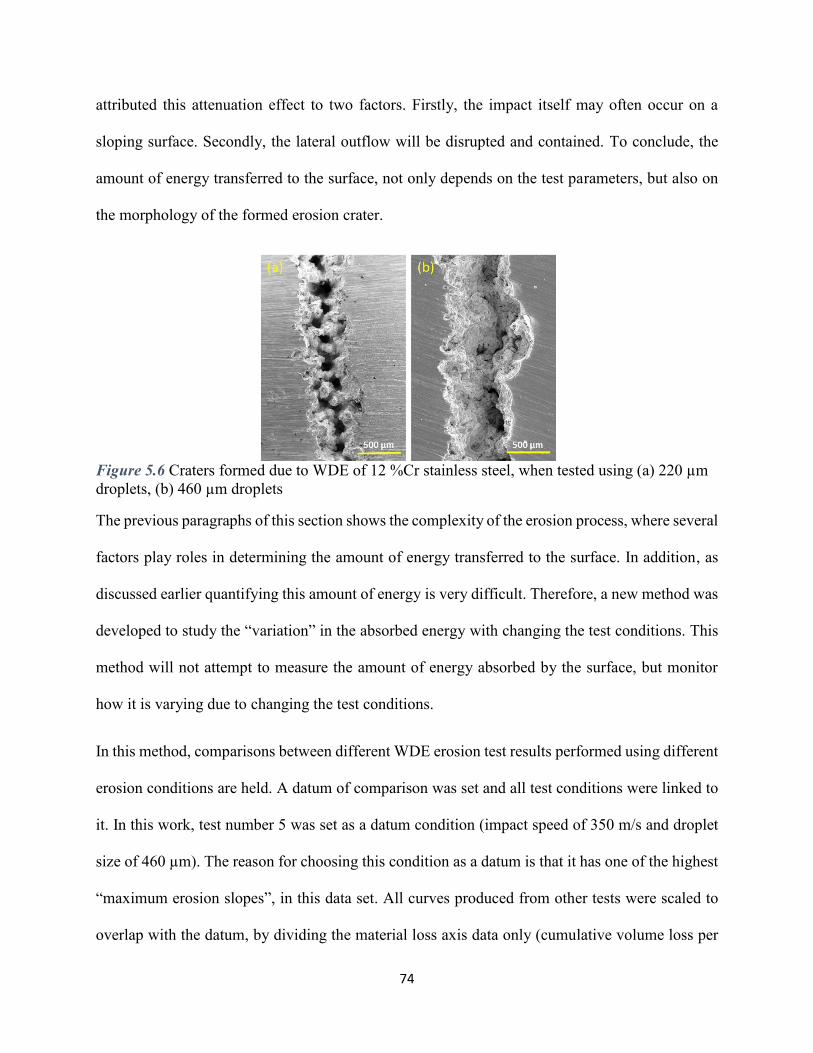
74
attributed this attenuation effect to two factors. Firstly, the impact itself may often occur on a
sloping surface. Secondly, the lateral outflow will be disrupted and contained. To conclude, the
amount of energy transferred to the surface, not only depends on the test parameters, but also on
the morphology of the formed erosion crater.
Figure 5.6 Craters formed due to WDE of 12 %Cr stainless steel, when tested using (a) 220 µm
droplets, (b) 460 µm droplets
The previous paragraphs of this section shows the complexity of the erosion process, where several
factors play roles in determining the amount of energy transferred to the surface. In addition, as
discussed earlier quantifying this amount of energy is very difficult. Therefore, a new method was
developed to study the “variation” in the absorbed energy with changing the test conditions. This
method will not attempt to measure the amount of energy absorbed by the surface, but monitor
how it is varying due to changing the test conditions.
In this method, comparisons between different WDE erosion test results performed using different
erosion conditions are held. A datum of comparison was set and all test conditions were linked to
it. In this work, test number 5 was set as a datum condition (impact speed of 350 m/s and droplet
size of 460 µm). The reason for choosing this condition as a datum is that it has one of the highest
“maximum erosion slopes”, in this data set. All curves produced from other tests were scaled to
overlap with the datum, by dividing the material loss axis data only (cumulative volume loss per
75
unit impacted area) by a variable named as (ξ). The value of (ξ) is different for each test condition.
Table 5.3 shows the values of (ξ), and the scaled WDE curves are shown in Figure 5.7. It is clear
that the WDE curves coincided with datum curve after applying (ξ).
The value (ξ) can be considered as an index for the change in the amount of material loss due to
the variation in the amount of the absorbed energy at each test condition. The novelty of this
analysis method is that by a single value (ξ), the variation in results of different erosion test
conditions can be quantified. For instance the material loss of any point on the WDE curve of test
number 1 needs to be divided by (ξ=0.19) to be similar to that of the corresponding point on the
datum curve. This means that when the same energy intensity was applied on both samples in the
form of impacting water droplets, the reference sample (i.e. datum) lost 81% more material than
the sample of test number 1. These results suggest that more energy was absorbed by the reference
sample than the sample of test number 5. Therefore, ξ expresses such variation in the absorbed
energy by quantifying the difference in the material loss between the two samples. This kind of
information is considered useful for further understanding of the WDE behaviour of this 12% Cr
stainless steel. Building a trend for how (ξ) is changing by altering the test conditions is very
important for understanding more about its physical meaning, and would help to predict WDE of
untested erosion conditions. An example of such trend is illustrated in Figure 5.8. The graph shows
the (ξ) values of tests number 1-3 plotted against the impact speed. This linear trend expresses the
increase in (ξ) values as the impact speed increases. The curve fitting equation in Figure 5.8 can
be used to predict the erosion curves of untested erosion conditions in this speed range. Further
tests are still needed to build a complete trend for (ξ), this would be the topic for future work.
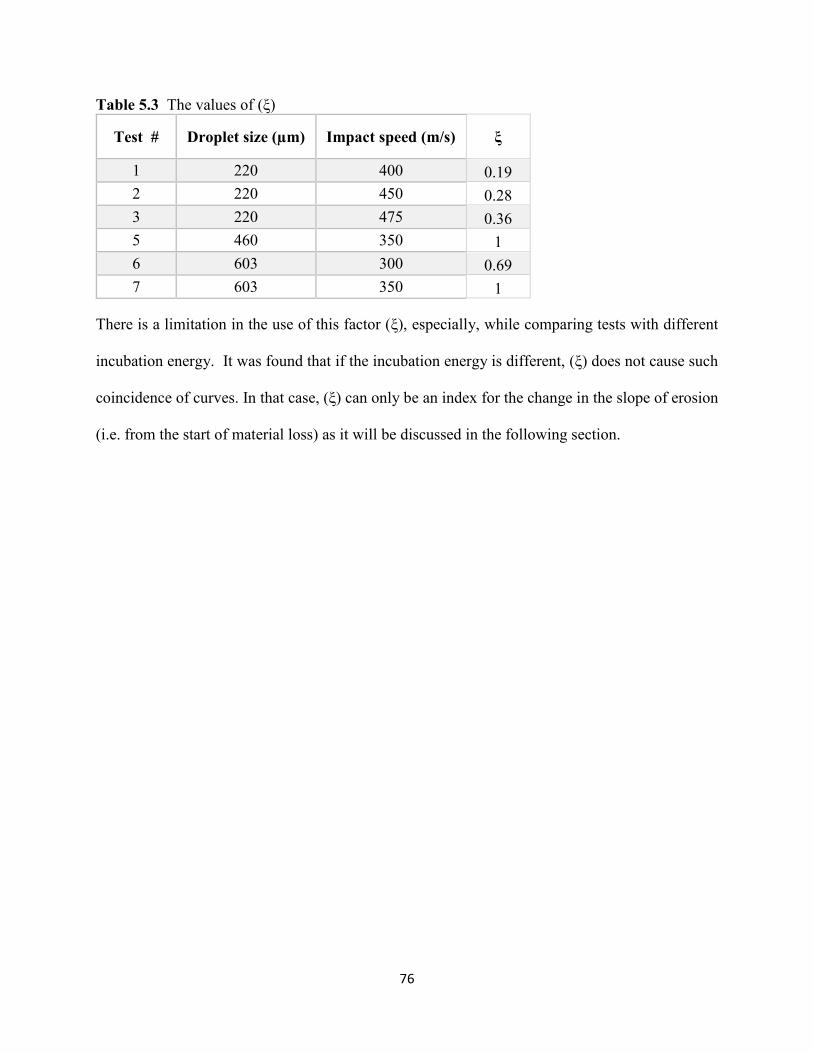
76
Table 5.3 The values of (ξ)
Test # Droplet size (µm) Impact speed (m/s) ξ
1 220 400 0.19
2 220 450 0.28
3 220 475 0.36
5 460 350 1
6 603 300 0.69
7 603 350 1
There is a limitation in the use of this factor (ξ), especially, while comparing tests with different
incubation energy. It was found that if the incubation energy is different, (ξ) does not cause such
coincidence of curves. In that case, (ξ) can only be an index for the change in the slope of erosion
(i.e. from the start of material loss) as it will be discussed in the following section.
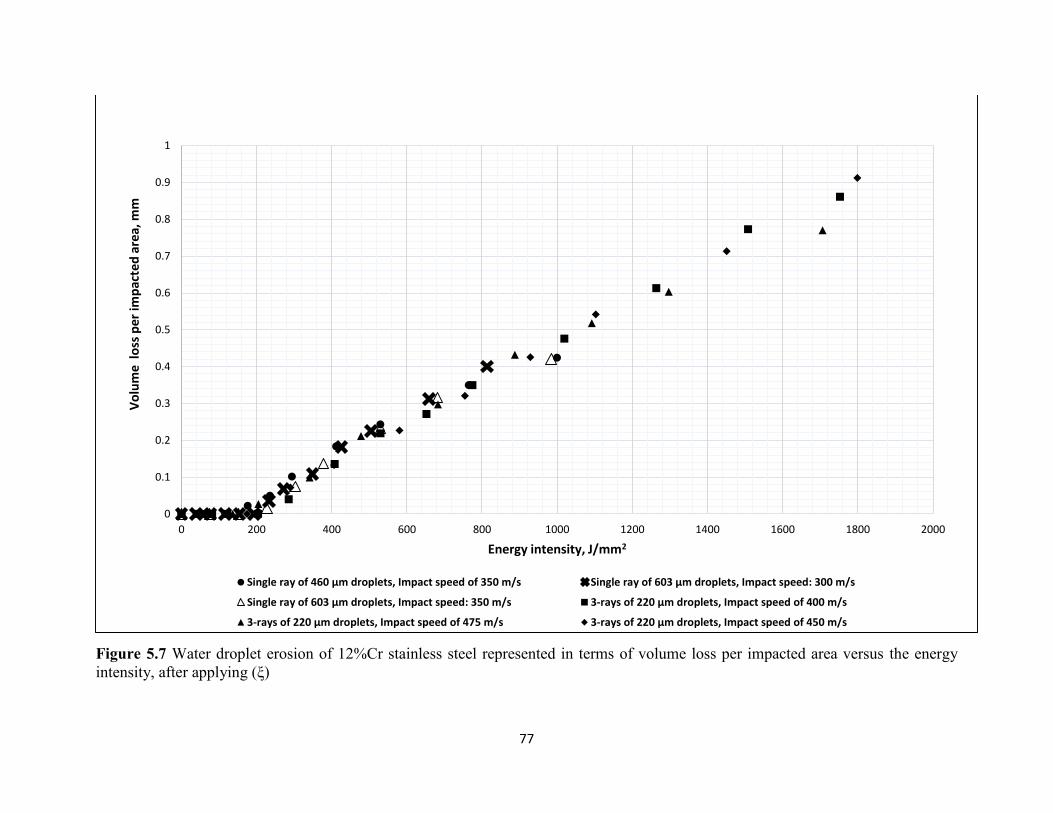
77
Figure 5.7 Water droplet erosion of 12%Cr stainless steel represented in terms of volume loss per impacted area versus the energy
intensity, after applying (ξ)
0
0.1
0.2
0.3
0.4
0.5
0.6
0.7
0.8
0.9
1
0 200 400 600 800 1000 1200 1400 1600 1800 2000
Vo
lum
e l
oss
per
imp
acte
d a
rea,
mm
Energy intensity, J/mm2
Single ray of 460 µm droplets, Impact speed of 350 m/s Single ray of 603 µm droplets, Impact speed: 300 m/s
Single ray of 603 µm droplets, Impact speed: 350 m/s 3-rays of 220 µm droplets, Impact speed of 400 m/s
3-rays of 220 µm droplets, Impact speed of 475 m/s 3-rays of 220 µm droplets, Impact speed of 450 m/s
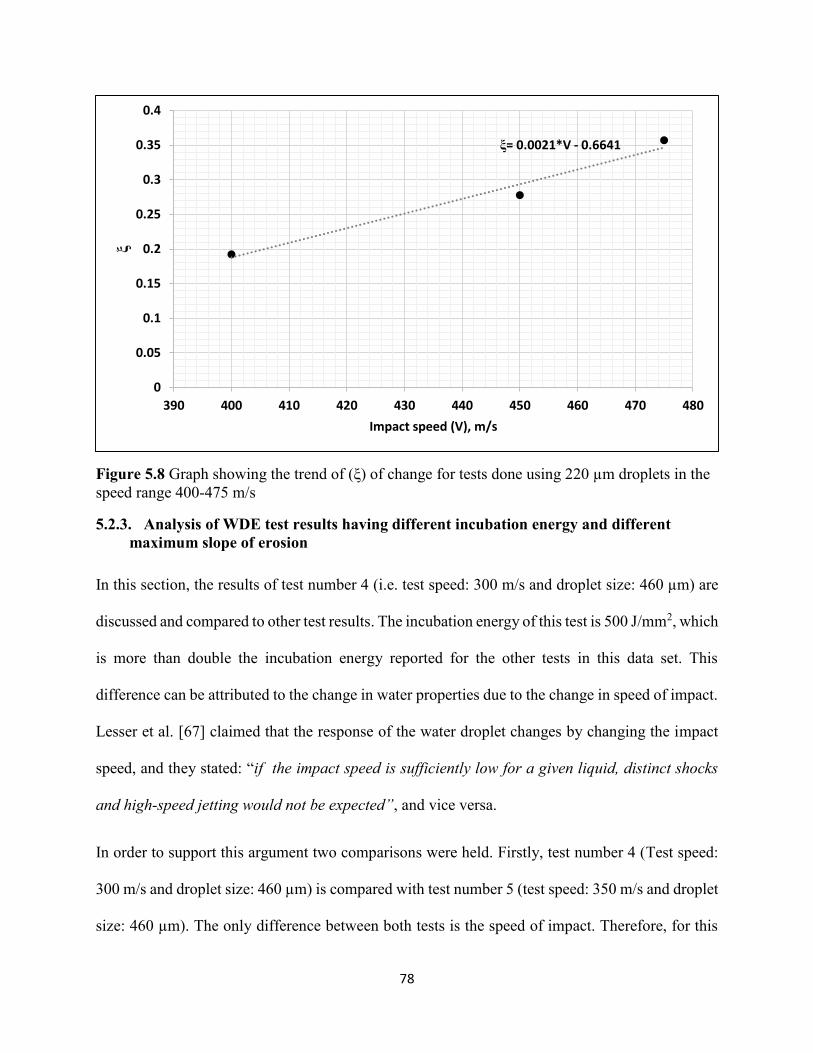
78
Figure 5.8 Graph showing the trend of (ξ) of change for tests done using 220 µm droplets in the
speed range 400-475 m/s
5.2.3. Analysis of WDE test results having different incubation energy and different
maximum slope of erosion
In this section, the results of test number 4 (i.e. test speed: 300 m/s and droplet size: 460 µm) are
discussed and compared to other test results. The incubation energy of this test is 500 J/mm2, which
is more than double the incubation energy reported for the other tests in this data set. This
difference can be attributed to the change in water properties due to the change in speed of impact.
Lesser et al. [67] claimed that the response of the water droplet changes by changing the impact
speed, and they stated: “if the impact speed is sufficiently low for a given liquid, distinct shocks
and high-speed jetting would not be expected”, and vice versa.
In order to support this argument two comparisons were held. Firstly, test number 4 (Test speed:
300 m/s and droplet size: 460 µm) is compared with test number 5 (test speed: 350 m/s and droplet
size: 460 µm). The only difference between both tests is the speed of impact. Therefore, for this
ξ= 0.0021*V - 0.6641
0
0.05
0.1
0.15
0.2
0.25
0.3
0.35
0.4
390 400 410 420 430 440 450 460 470 480
ξ
Impact speed (V), m/s
79
droplet size (i.e. 460 µm), the variation in the incubation energy between both tests is mainly
caused by the speed difference. This is not the case, when tests number 6 and 7 (i.e. test speeds of:
300 m/s and 350 m/s, respectively, and droplet size of 603 µm) are compared. In this case, the
speed of impact does not influence the incubation energy, as they both have similar incubation
energies. These two comparisons suggests that each droplet size has a certain speed, above which,
there is a large increase in the amount of energy transferred to the target’s surface. In the case of
460 µm droplets this speed is in the range 300 m/s, while for 603 µm droplets, such speed was not
identified in this data set, but it is expected to be lower than 300 m/s.
As discussed in section 5.2.3, in the case of tests with different incubation energy, (ξ) can be used
as an index for the change in the erosion slope only. Figure 5.9 shows an example of such case.
The WDE of test number 4 is compared with the datum curve (i.e. test number 5). The value of (ξ)
was evaluated to be 0.64. In other words, in order to have an erosion slope similar to that of the
datum curve, the material loss of test number 5 must increase by 1.55 times. Such information is
important due to the importance of the erosion slope as a test result, as it can be considered as an
indication of the erosion rate. Although, the sample of test 4 needed more incubation energy than
samples of tests number 1-3, its maximum erosion slope was much higher as erosion started.
Accordingly, these results further prove that the amount of energy absorbed by the surface changes
as the morphology of the erosion carter changes and its effect on the interaction with water
droplets.
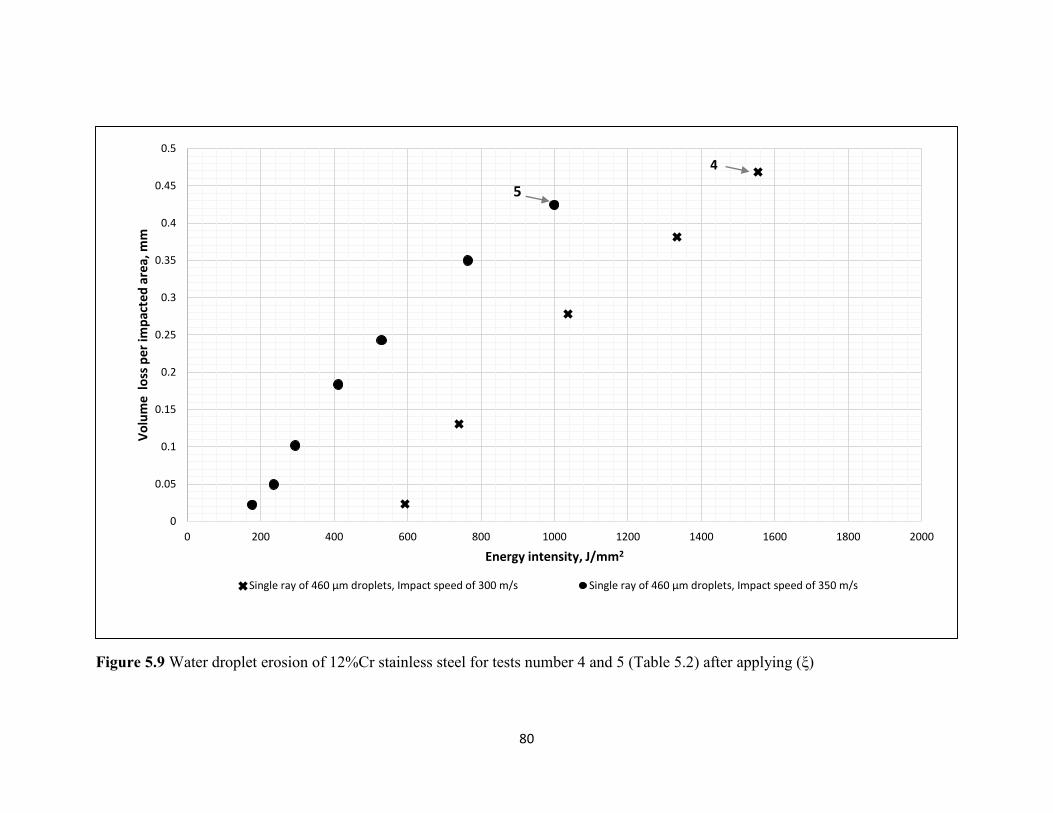
80
Figure 5.9 Water droplet erosion of 12%Cr stainless steel for tests number 4 and 5 (Table 5.2) after applying (ξ)
0
0.05
0.1
0.15
0.2
0.25
0.3
0.35
0.4
0.45
0.5
0 200 400 600 800 1000 1200 1400 1600 1800 2000
Vo
lum
e l
oss
per
imp
acte
d a
rea,
mm
Energy intensity, J/mm2
Single ray of 460 µm droplets, Impact speed of 300 m/s Single ray of 460 µm droplets, Impact speed of 350 m/s
5
4
81
5.3. Summary
In this chapter a new method to represent WDE was developed and successfully used to analyze
test results. This method opens the door for studying WDE from another perspective through
further parametric investigations. Important points of this chapter could be summarized as
following:
1- WDE was successfully represented in terms of kinetic energy, due to the availability of all
necessary information about the WDE experiments.
2- In order to represent WDE in terms of the applied kinetic energy, several parameters
should be quantified and controlled: (a) droplet size, (b) impact speed, and (c) number of
droplets per impact, (d) number of impacts , and (d) impacted area. It is important to keep
other parameters constant for comparison purposes, otherwise comparison would become
very difficult. These parameters are: (a) surface roughness, (b) impact angle.
3- Sub-division of water droplets into smaller ones upon impact was observed experimentally,
which proves the claim of Heymann [3]. This may have contributed to the energy
dissipation and the fact that not the entire impact energy is transferred to the solid material.
4- The difference in the droplet sizes used in tests number 5 and 7 (i.e. 460 µm and 603 µm,
respectively) did not have an effect of the erosion results. Both tests were performed at the
same speed (350 m/s). These results suggest that for the same volume of impacting water
droplets per unit area ( i.e. around 0.7 ml), and impact speed of 350 m/s, there was no effect
for the droplet size on erosion behaviour of the 12% Cr stainless steel. This also proposes
that the absorbed energy intensity of tests done using 460 µm and 603 µm droplet size and
performed at 350 m/s are the same. These claims are in accordance with DeCorso’s [40]
work.
82
5- The “maximum erosion slopes” of tests done high impact speeds (i.e.400-475 m/s) using
the smallest droplet size (i.e. 220 µm) were lower than that of tests performed at lower
impact speeds (i.e.300-350 m/s) using larger droplet sizes (i.e. 460 and 603 µm). It was
concluded that the maximum erosion slope is highly influenced by the relation between the
droplet size and any specific pattern formed in the morphology of the erosion crater, as
shown by experimental results and SEM micrographs.
6- A new method was proposed to study the “variation” in the amount of energy absorbed by
the solid surface due to the water droplet impact. The value (ξ) can be considered as an
index for the change in the amount of material loss due to the variation in the amount of
the absorbed energy at each test condition. The novelty of this method is that by a single
value (ξ), the variation in results of different erosion test conditions can be quantified.
Building trends for how (ξ) is changing by altering the test conditions is very important for
understanding its physical meaning. However, further test results are still needed to build
such trend, this would be the topic for future work.
7- It was found that if the incubation energy is different, (ξ) does not cause such coincidence
of curves. In such case (ξ) can only be an index for the change in the slope of erosion (i.e.
from the start of material loss)
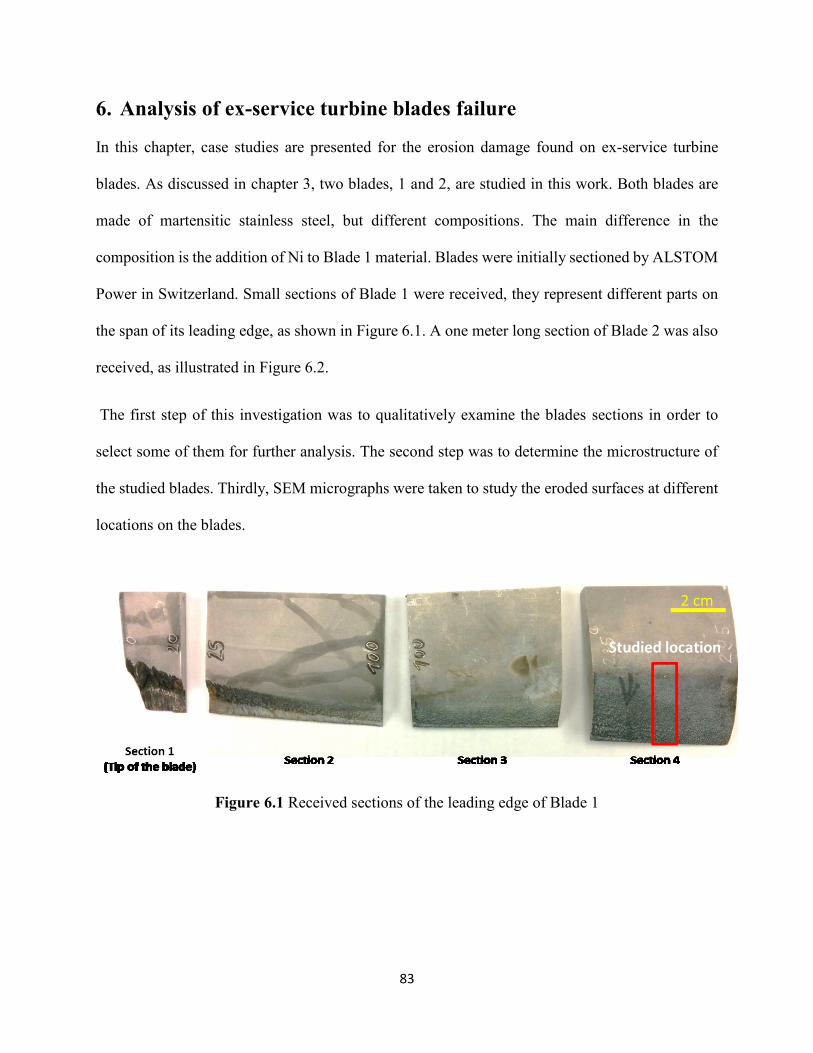
83
6. Analysis of ex-service turbine blades failure
In this chapter, case studies are presented for the erosion damage found on ex-service turbine
blades. As discussed in chapter 3, two blades, 1 and 2, are studied in this work. Both blades are
made of martensitic stainless steel, but different compositions. The main difference in the
composition is the addition of Ni to Blade 1 material. Blades were initially sectioned by ALSTOM
Power in Switzerland. Small sections of Blade 1 were received, they represent different parts on
the span of its leading edge, as shown in Figure 6.1. A one meter long section of Blade 2 was also
received, as illustrated in Figure 6.2.
The first step of this investigation was to qualitatively examine the blades sections in order to
select some of them for further analysis. The second step was to determine the microstructure of
the studied blades. Thirdly, SEM micrographs were taken to study the eroded surfaces at different
locations on the blades.
Figure 6.1 Received sections of the leading edge of Blade 1
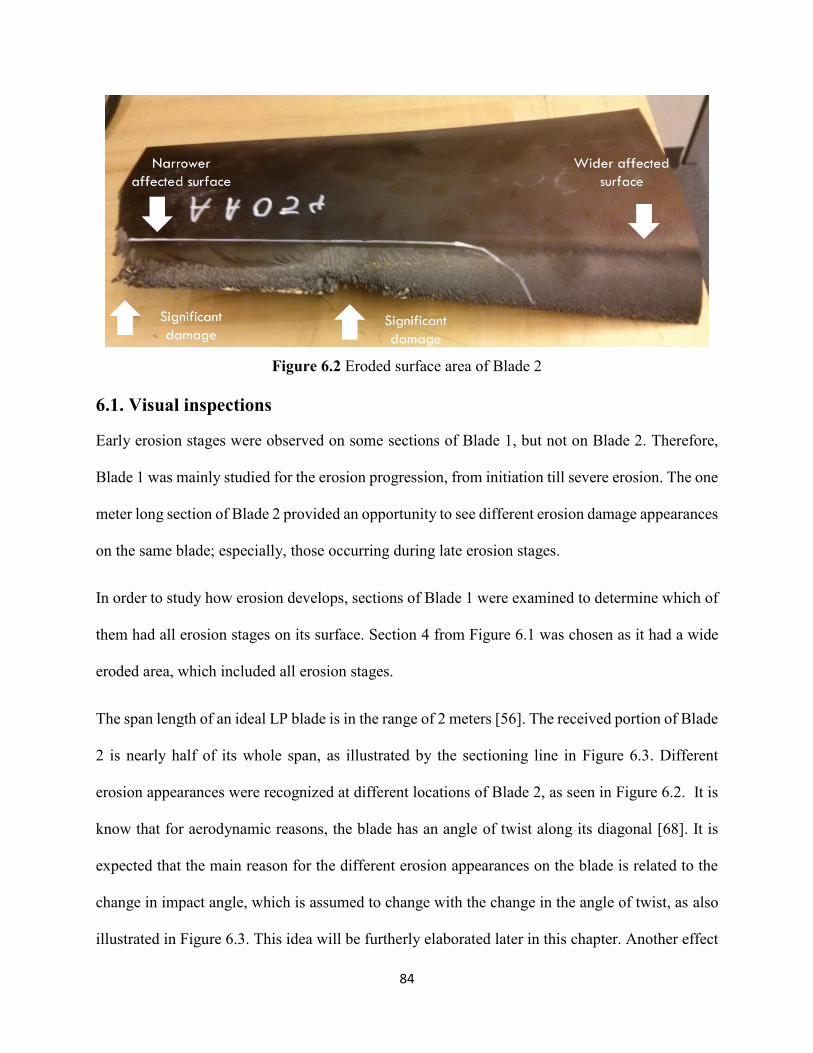
84
Figure 6.2 Eroded surface area of Blade 2
6.1. Visual inspections
Early erosion stages were observed on some sections of Blade 1, but not on Blade 2. Therefore,
Blade 1 was mainly studied for the erosion progression, from initiation till severe erosion. The one
meter long section of Blade 2 provided an opportunity to see different erosion damage appearances
on the same blade; especially, those occurring during late erosion stages.
In order to study how erosion develops, sections of Blade 1 were examined to determine which of
them had all erosion stages on its surface. Section 4 from Figure 6.1 was chosen as it had a wide
eroded area, which included all erosion stages.
The span length of an ideal LP blade is in the range of 2 meters [56]. The received portion of Blade
2 is nearly half of its whole span, as illustrated by the sectioning line in Figure 6.3. Different
erosion appearances were recognized at different locations of Blade 2, as seen in Figure 6.2. It is
know that for aerodynamic reasons, the blade has an angle of twist along its diagonal [68]. It is
expected that the main reason for the different erosion appearances on the blade is related to the
change in impact angle, which is assumed to change with the change in the angle of twist, as also
illustrated in Figure 6.3. This idea will be furtherly elaborated later in this chapter. Another effect
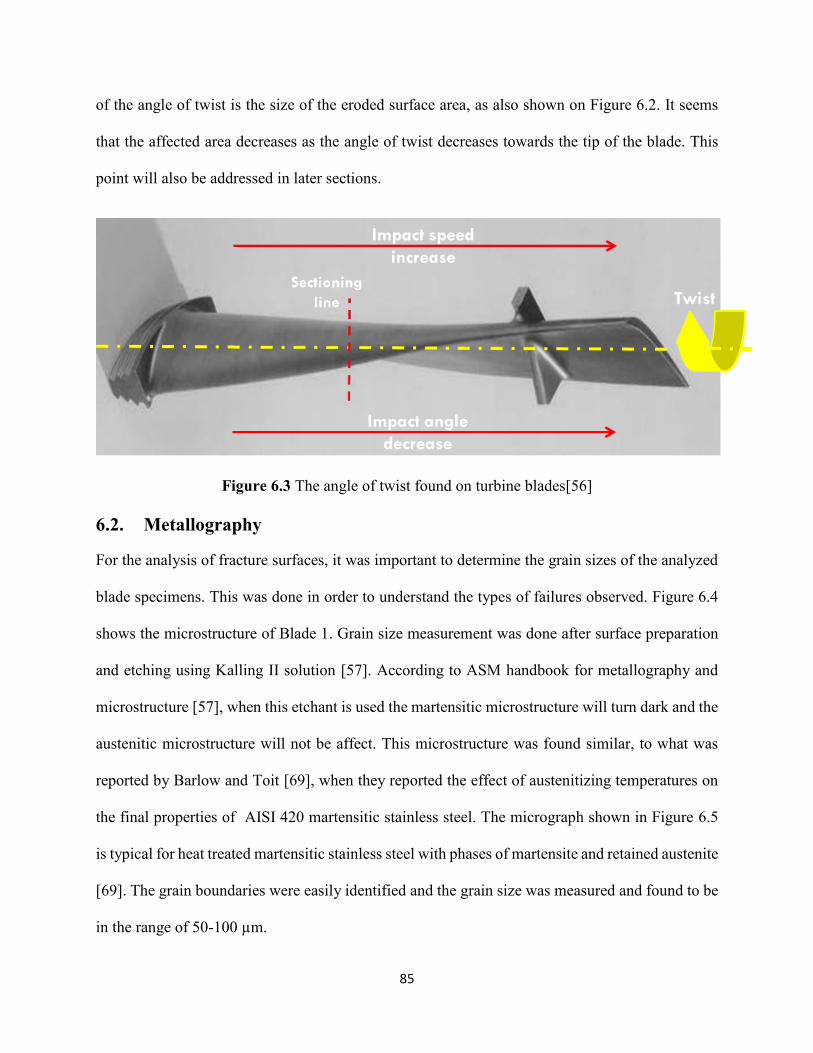
85
of the angle of twist is the size of the eroded surface area, as also shown on Figure 6.2. It seems
that the affected area decreases as the angle of twist decreases towards the tip of the blade. This
point will also be addressed in later sections.
Figure 6.3 The angle of twist found on turbine blades[56]
6.2. Metallography
For the analysis of fracture surfaces, it was important to determine the grain sizes of the analyzed
blade specimens. This was done in order to understand the types of failures observed. Figure 6.4
shows the microstructure of Blade 1. Grain size measurement was done after surface preparation
and etching using Kalling II solution [57]. According to ASM handbook for metallography and
microstructure [57], when this etchant is used the martensitic microstructure will turn dark and the
austenitic microstructure will not be affect. This microstructure was found similar, to what was
reported by Barlow and Toit [69], when they reported the effect of austenitizing temperatures on
the final properties of AISI 420 martensitic stainless steel. The micrograph shown in Figure 6.5
is typical for heat treated martensitic stainless steel with phases of martensite and retained austenite
[69]. The grain boundaries were easily identified and the grain size was measured and found to be
in the range of 50-100 µm.
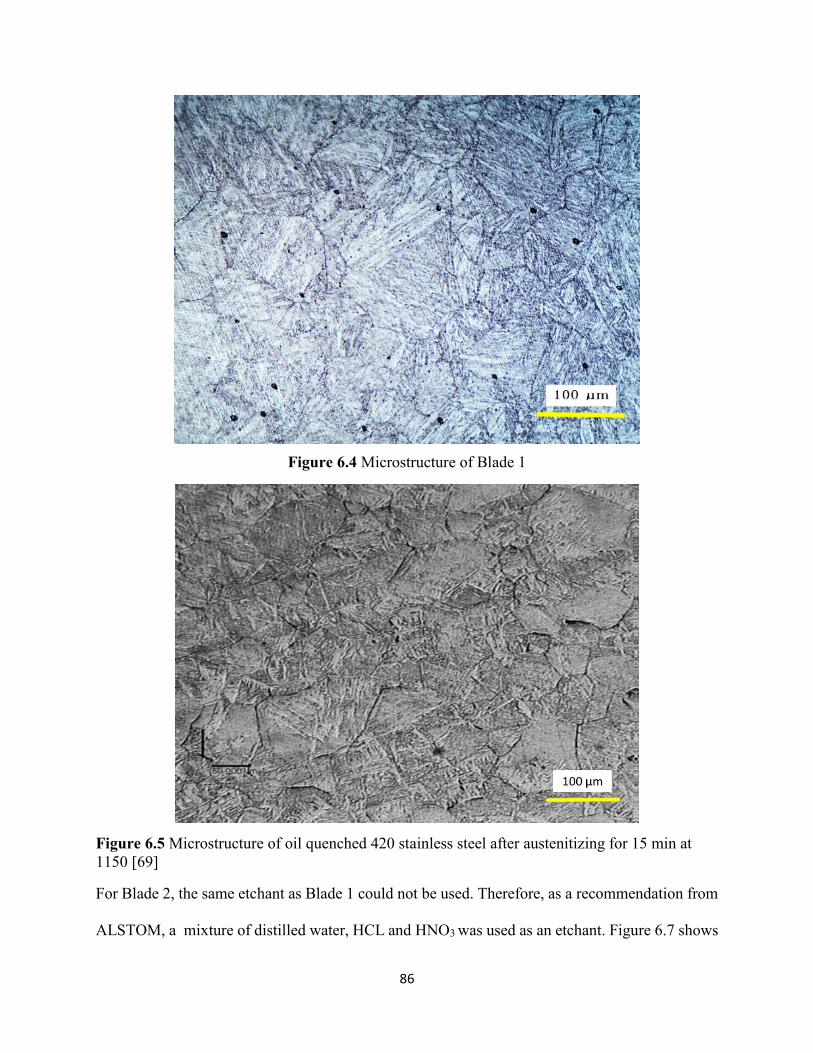
86
Figure 6.4 Microstructure of Blade 1
Figure 6.5 Microstructure of oil quenched 420 stainless steel after austenitizing for 15 min at
1150 [69]
For Blade 2, the same etchant as Blade 1 could not be used. Therefore, as a recommendation from
ALSTOM, a mixture of distilled water, HCL and HNO3 was used as an etchant. Figure 6.7 shows
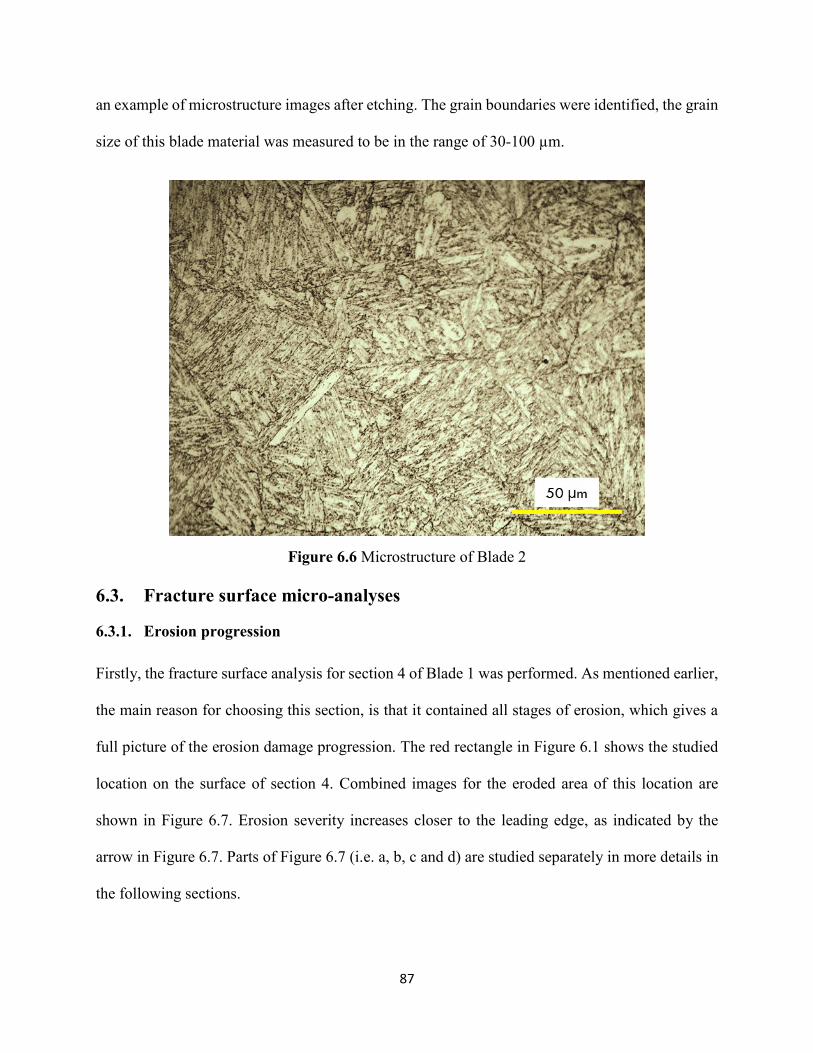
87
an example of microstructure images after etching. The grain boundaries were identified, the grain
size of this blade material was measured to be in the range of 30-100 µm.
Figure 6.6 Microstructure of Blade 2
6.3. Fracture surface micro-analyses
6.3.1. Erosion progression
Firstly, the fracture surface analysis for section 4 of Blade 1 was performed. As mentioned earlier,
the main reason for choosing this section, is that it contained all stages of erosion, which gives a
full picture of the erosion damage progression. The red rectangle in Figure 6.1 shows the studied
location on the surface of section 4. Combined images for the eroded area of this location are
shown in Figure 6.7. Erosion severity increases closer to the leading edge, as indicated by the
arrow in Figure 6.7. Parts of Figure 6.7 (i.e. a, b, c and d) are studied separately in more details in
the following sections.
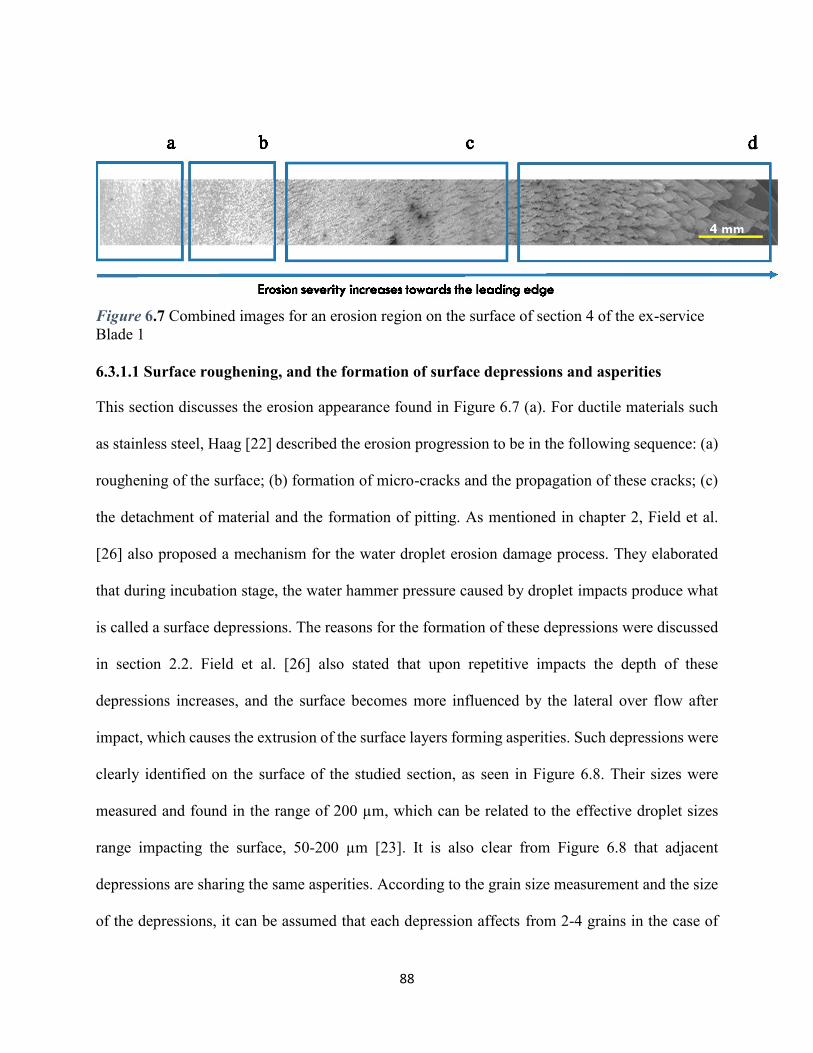
88
Figure 6.7 Combined images for an erosion region on the surface of section 4 of the ex-service
Blade 1
6.3.1.1 Surface roughening, and the formation of surface depressions and asperities
This section discusses the erosion appearance found in Figure 6.7 (a). For ductile materials such
as stainless steel, Haag [22] described the erosion progression to be in the following sequence: (a)
roughening of the surface; (b) formation of micro-cracks and the propagation of these cracks; (c)
the detachment of material and the formation of pitting. As mentioned in chapter 2, Field et al.
[26] also proposed a mechanism for the water droplet erosion damage process. They elaborated
that during incubation stage, the water hammer pressure caused by droplet impacts produce what
is called a surface depressions. The reasons for the formation of these depressions were discussed
in section 2.2. Field et al. [26] also stated that upon repetitive impacts the depth of these
depressions increases, and the surface becomes more influenced by the lateral over flow after
impact, which causes the extrusion of the surface layers forming asperities. Such depressions were
clearly identified on the surface of the studied section, as seen in Figure 6.8. Their sizes were
measured and found in the range of 200 µm, which can be related to the effective droplet sizes
range impacting the surface, 50-200 µm [23]. It is also clear from Figure 6.8 that adjacent
depressions are sharing the same asperities. According to the grain size measurement and the size
of the depressions, it can be assumed that each depression affects from 2-4 grains in the case of
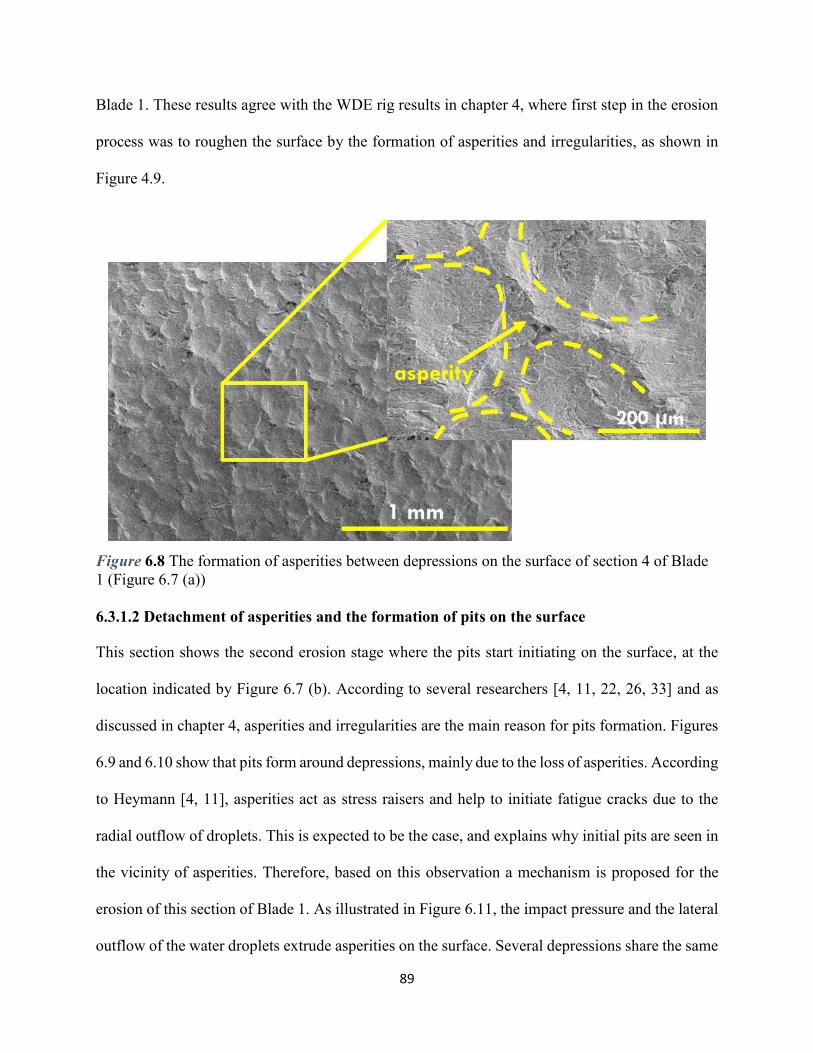
89
Blade 1. These results agree with the WDE rig results in chapter 4, where first step in the erosion
process was to roughen the surface by the formation of asperities and irregularities, as shown in
Figure 4.9.
Figure 6.8 The formation of asperities between depressions on the surface of section 4 of Blade
1 (Figure 6.7 (a))
6.3.1.2 Detachment of asperities and the formation of pits on the surface
This section shows the second erosion stage where the pits start initiating on the surface, at the
location indicated by Figure 6.7 (b). According to several researchers [4, 11, 22, 26, 33] and as
discussed in chapter 4, asperities and irregularities are the main reason for pits formation. Figures
6.9 and 6.10 show that pits form around depressions, mainly due to the loss of asperities. According
to Heymann [4, 11], asperities act as stress raisers and help to initiate fatigue cracks due to the
radial outflow of droplets. This is expected to be the case, and explains why initial pits are seen in
the vicinity of asperities. Therefore, based on this observation a mechanism is proposed for the
erosion of this section of Blade 1. As illustrated in Figure 6.11, the impact pressure and the lateral
outflow of the water droplets extrude asperities on the surface. Several depressions share the same
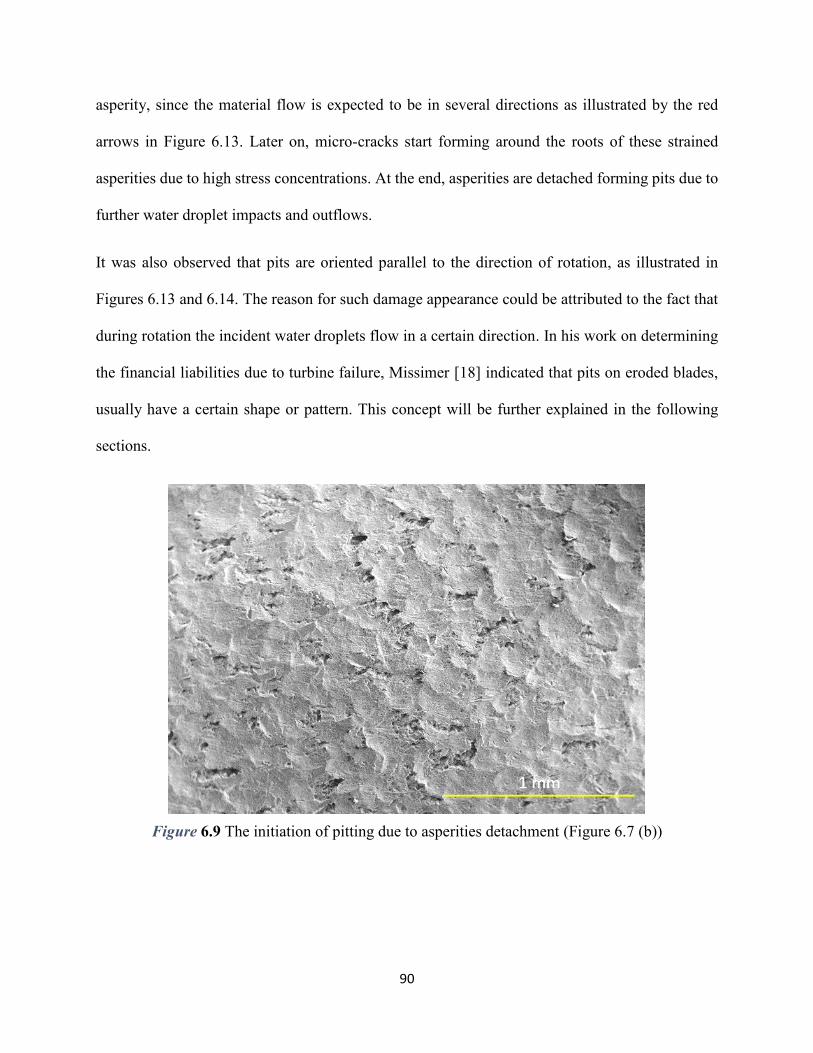
90
asperity, since the material flow is expected to be in several directions as illustrated by the red
arrows in Figure 6.13. Later on, micro-cracks start forming around the roots of these strained
asperities due to high stress concentrations. At the end, asperities are detached forming pits due to
further water droplet impacts and outflows.
It was also observed that pits are oriented parallel to the direction of rotation, as illustrated in
Figures 6.13 and 6.14. The reason for such damage appearance could be attributed to the fact that
during rotation the incident water droplets flow in a certain direction. In his work on determining
the financial liabilities due to turbine failure, Missimer [18] indicated that pits on eroded blades,
usually have a certain shape or pattern. This concept will be further explained in the following
sections.
Figure 6.9 The initiation of pitting due to asperities detachment (Figure 6.7 (b))
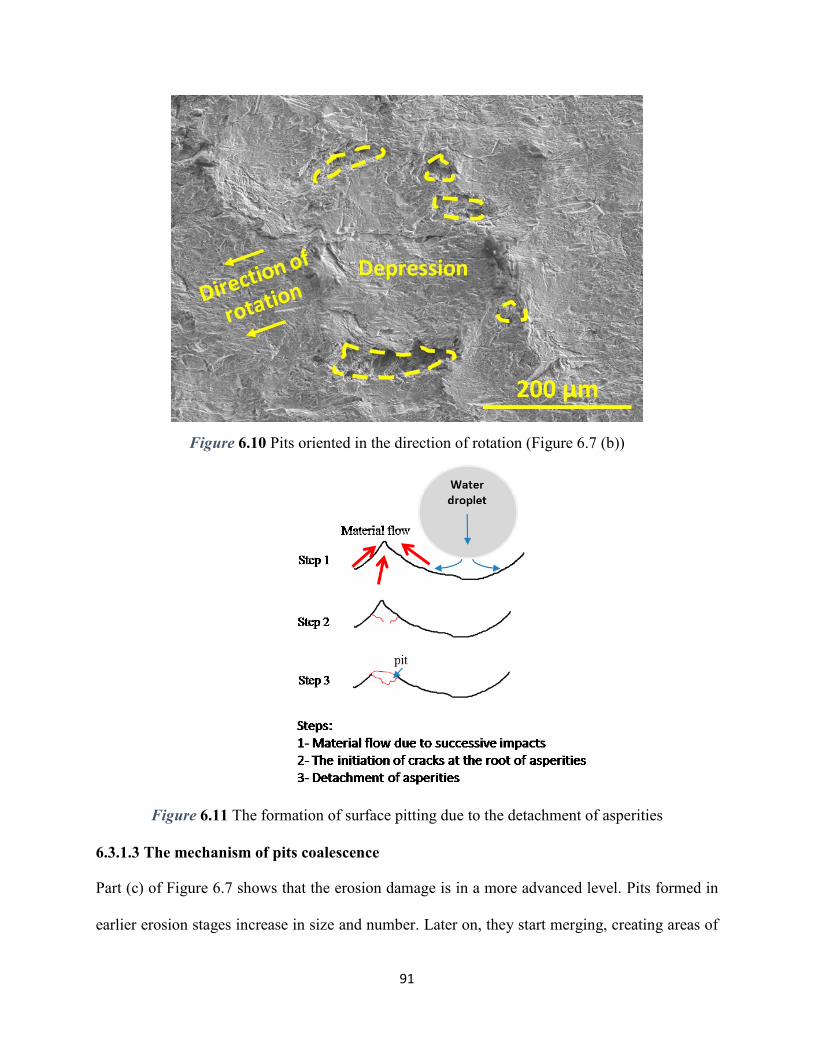
91
Figure 6.10 Pits oriented in the direction of rotation (Figure 6.7 (b))
Figure 6.11 The formation of surface pitting due to the detachment of asperities
6.3.1.3 The mechanism of pits coalescence
Part (c) of Figure 6.7 shows that the erosion damage is in a more advanced level. Pits formed in
earlier erosion stages increase in size and number. Later on, they start merging, creating areas of
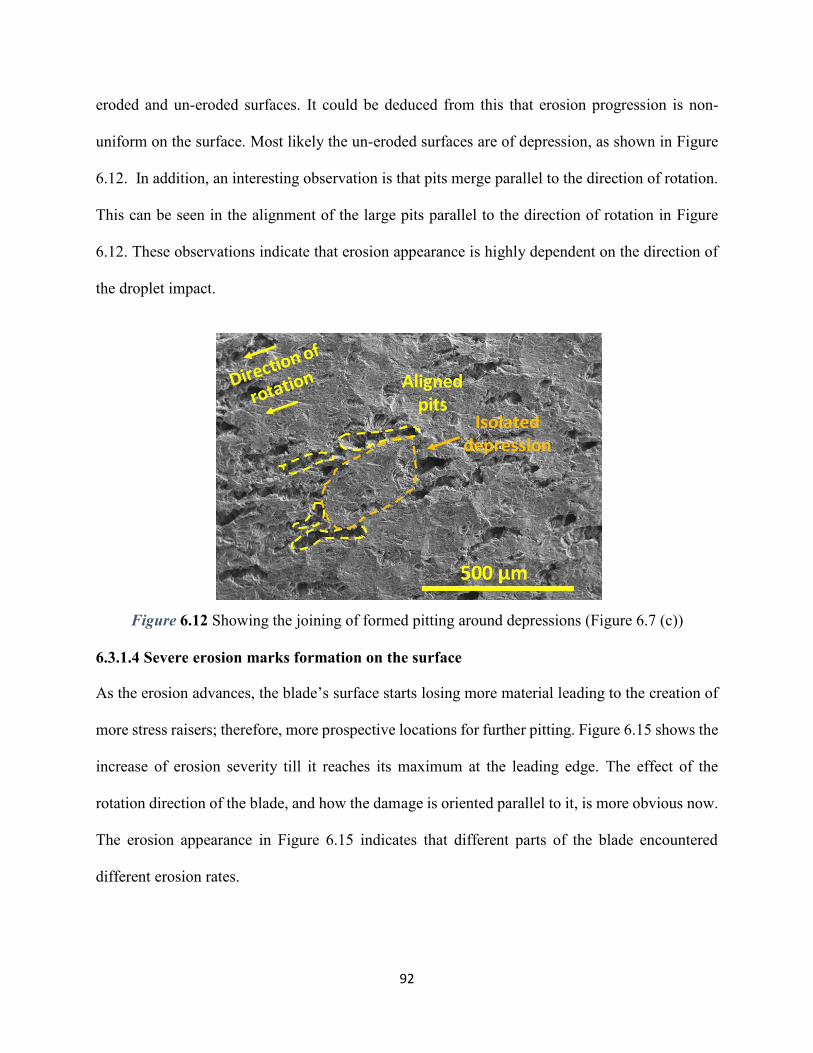
92
eroded and un-eroded surfaces. It could be deduced from this that erosion progression is non-
uniform on the surface. Most likely the un-eroded surfaces are of depression, as shown in Figure
6.12. In addition, an interesting observation is that pits merge parallel to the direction of rotation.
This can be seen in the alignment of the large pits parallel to the direction of rotation in Figure
6.12. These observations indicate that erosion appearance is highly dependent on the direction of
the droplet impact.
Figure 6.12 Showing the joining of formed pitting around depressions (Figure 6.7 (c))
6.3.1.4 Severe erosion marks formation on the surface
As the erosion advances, the blade’s surface starts losing more material leading to the creation of
more stress raisers; therefore, more prospective locations for further pitting. Figure 6.15 shows the
increase of erosion severity till it reaches its maximum at the leading edge. The effect of the
rotation direction of the blade, and how the damage is oriented parallel to it, is more obvious now.
The erosion appearance in Figure 6.15 indicates that different parts of the blade encountered
different erosion rates.
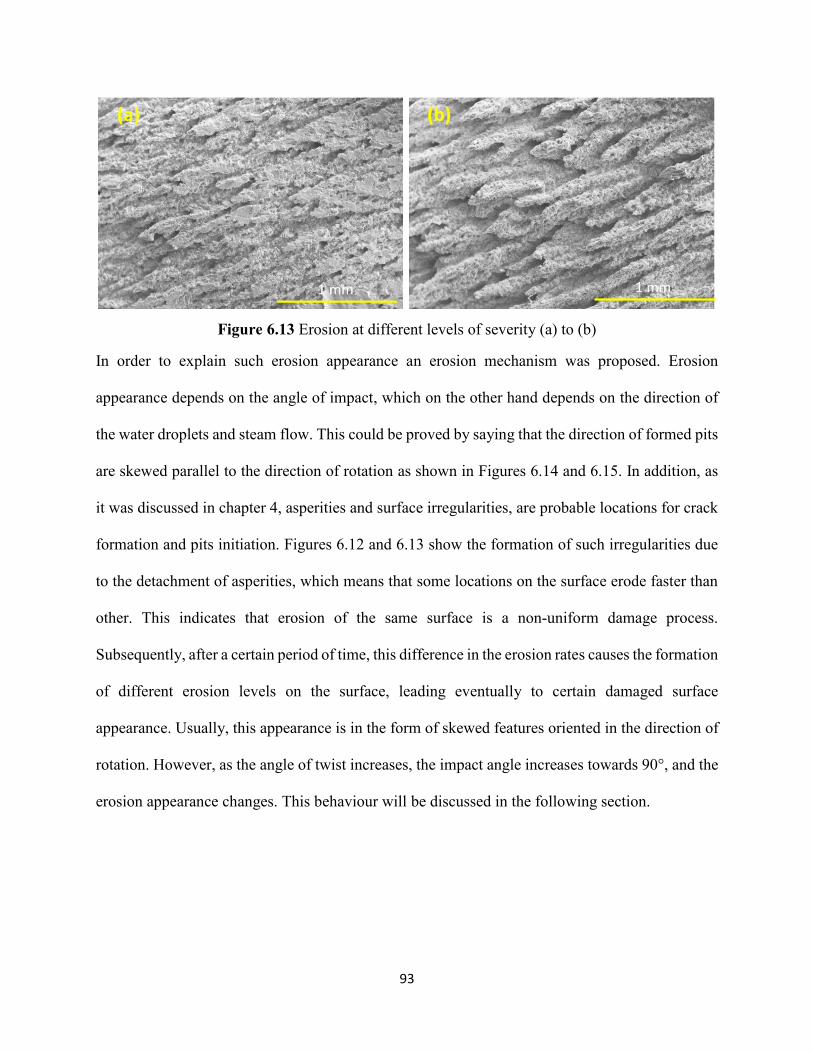
93
Figure 6.13 Erosion at different levels of severity (a) to (b)
In order to explain such erosion appearance an erosion mechanism was proposed. Erosion
appearance depends on the angle of impact, which on the other hand depends on the direction of
the water droplets and steam flow. This could be proved by saying that the direction of formed pits
are skewed parallel to the direction of rotation as shown in Figures 6.14 and 6.15. In addition, as
it was discussed in chapter 4, asperities and surface irregularities, are probable locations for crack
formation and pits initiation. Figures 6.12 and 6.13 show the formation of such irregularities due
to the detachment of asperities, which means that some locations on the surface erode faster than
other. This indicates that erosion of the same surface is a non-uniform damage process.
Subsequently, after a certain period of time, this difference in the erosion rates causes the formation
of different erosion levels on the surface, leading eventually to certain damaged surface
appearance. Usually, this appearance is in the form of skewed features oriented in the direction of
rotation. However, as the angle of twist increases, the impact angle increases towards 90°, and the
erosion appearance changes. This behaviour will be discussed in the following section.
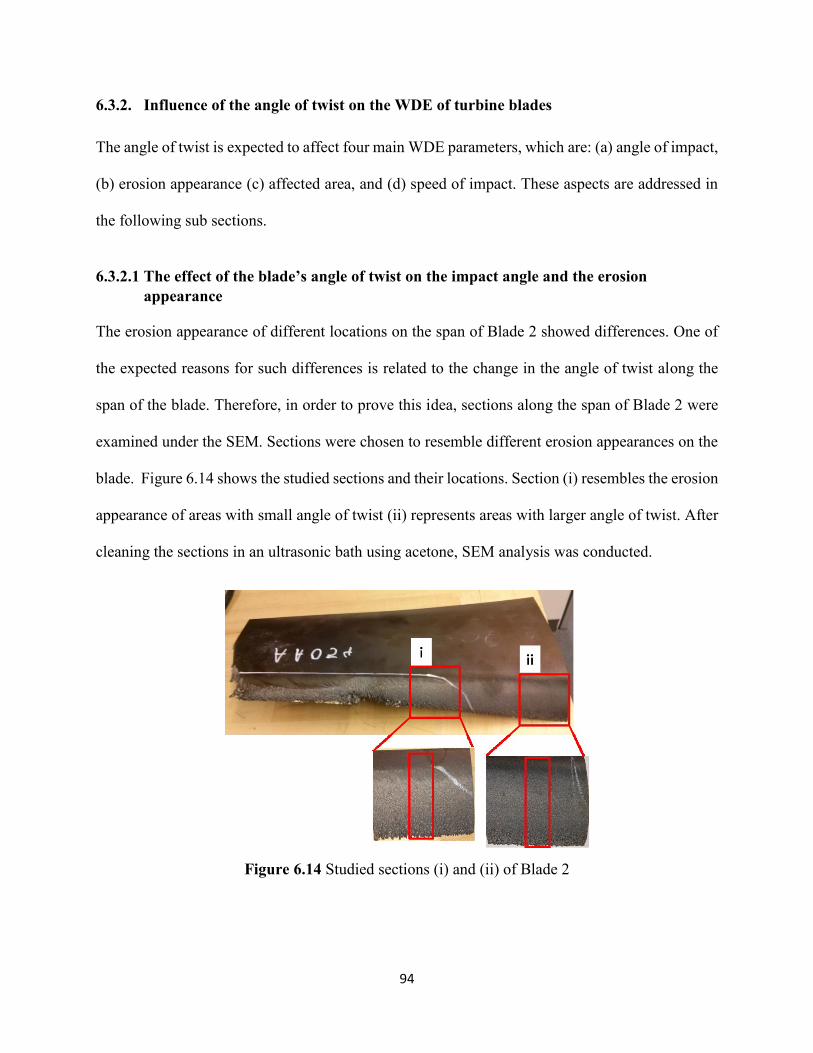
94
6.3.2. Influence of the angle of twist on the WDE of turbine blades
The angle of twist is expected to affect four main WDE parameters, which are: (a) angle of impact,
(b) erosion appearance (c) affected area, and (d) speed of impact. These aspects are addressed in
the following sub sections.
6.3.2.1 The effect of the blade’s angle of twist on the impact angle and the erosion
appearance
The erosion appearance of different locations on the span of Blade 2 showed differences. One of
the expected reasons for such differences is related to the change in the angle of twist along the
span of the blade. Therefore, in order to prove this idea, sections along the span of Blade 2 were
examined under the SEM. Sections were chosen to resemble different erosion appearances on the
blade. Figure 6.14 shows the studied sections and their locations. Section (i) resembles the erosion
appearance of areas with small angle of twist (ii) represents areas with larger angle of twist. After
cleaning the sections in an ultrasonic bath using acetone, SEM analysis was conducted.
Figure 6.14 Studied sections (i) and (ii) of Blade 2
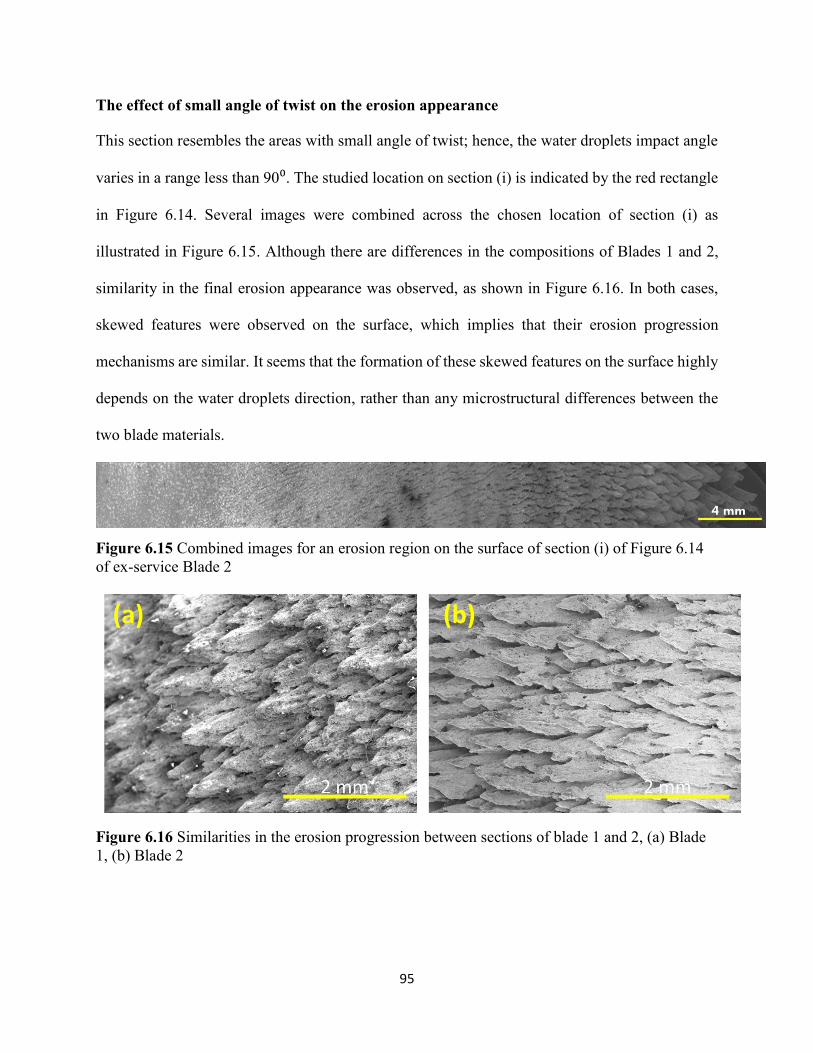
95
The effect of small angle of twist on the erosion appearance
This section resembles the areas with small angle of twist; hence, the water droplets impact angle
varies in a range less than 90⁰. The studied location on section (i) is indicated by the red rectangle
in Figure 6.14. Several images were combined across the chosen location of section (i) as
illustrated in Figure 6.15. Although there are differences in the compositions of Blades 1 and 2,
similarity in the final erosion appearance was observed, as shown in Figure 6.16. In both cases,
skewed features were observed on the surface, which implies that their erosion progression
mechanisms are similar. It seems that the formation of these skewed features on the surface highly
depends on the water droplets direction, rather than any microstructural differences between the
two blade materials.
Figure 6.15 Combined images for an erosion region on the surface of section (i) of Figure 6.14
of ex-service Blade 2
Figure 6.16 Similarities in the erosion progression between sections of blade 1 and 2, (a) Blade
1, (b) Blade 2
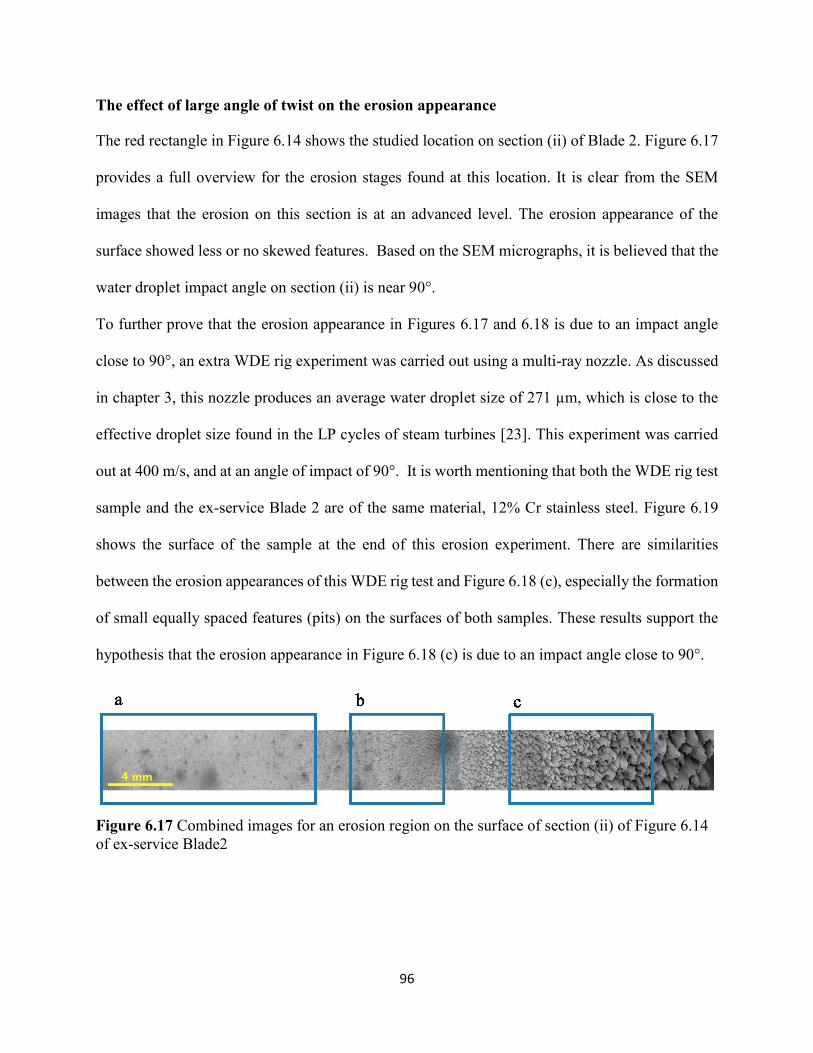
96
The effect of large angle of twist on the erosion appearance
The red rectangle in Figure 6.14 shows the studied location on section (ii) of Blade 2. Figure 6.17
provides a full overview for the erosion stages found at this location. It is clear from the SEM
images that the erosion on this section is at an advanced level. The erosion appearance of the
surface showed less or no skewed features. Based on the SEM micrographs, it is believed that the
water droplet impact angle on section (ii) is near 90°.
To further prove that the erosion appearance in Figures 6.17 and 6.18 is due to an impact angle
close to 90°, an extra WDE rig experiment was carried out using a multi-ray nozzle. As discussed
in chapter 3, this nozzle produces an average water droplet size of 271 µm, which is close to the
effective droplet size found in the LP cycles of steam turbines [23]. This experiment was carried
out at 400 m/s, and at an angle of impact of 90°. It is worth mentioning that both the WDE rig test
sample and the ex-service Blade 2 are of the same material, 12% Cr stainless steel. Figure 6.19
shows the surface of the sample at the end of this erosion experiment. There are similarities
between the erosion appearances of this WDE rig test and Figure 6.18 (c), especially the formation
of small equally spaced features (pits) on the surfaces of both samples. These results support the
hypothesis that the erosion appearance in Figure 6.18 (c) is due to an impact angle close to 90°.
Figure 6.17 Combined images for an erosion region on the surface of section (ii) of Figure 6.14
of ex-service Blade2
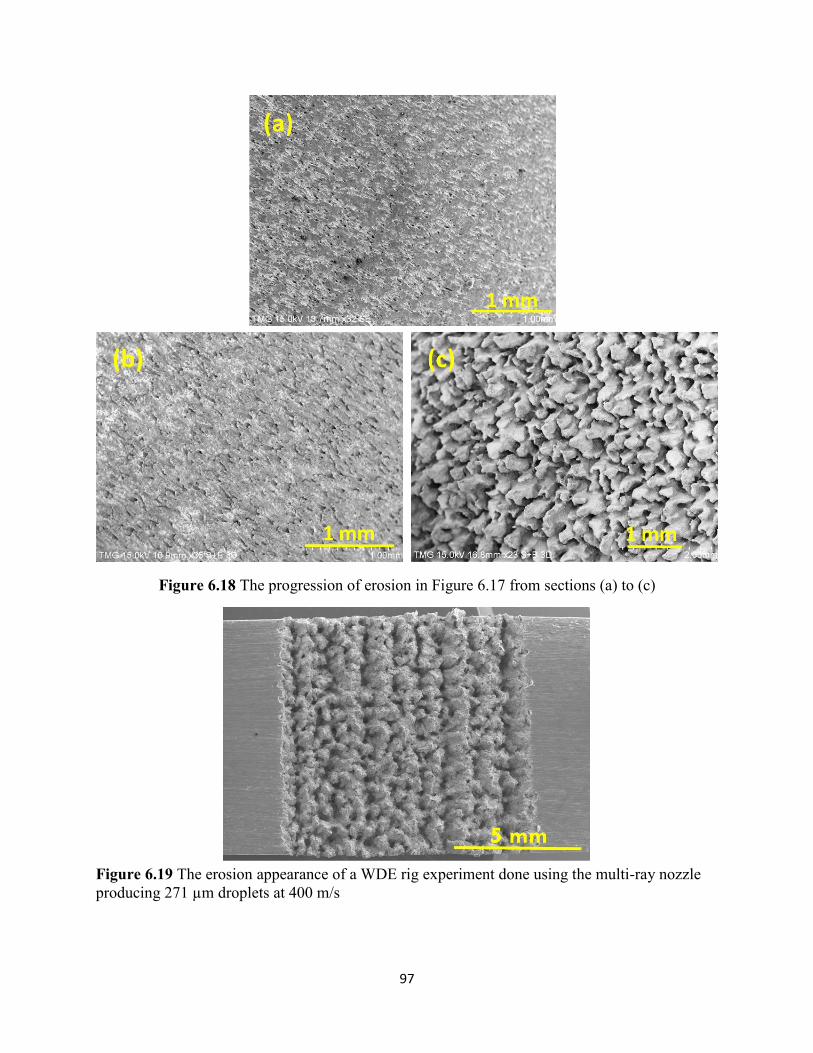
97
Figure 6.18 The progression of erosion in Figure 6.17 from sections (a) to (c)
Figure 6.19 The erosion appearance of a WDE rig experiment done using the multi-ray nozzle
producing 271 µm droplets at 400 m/s
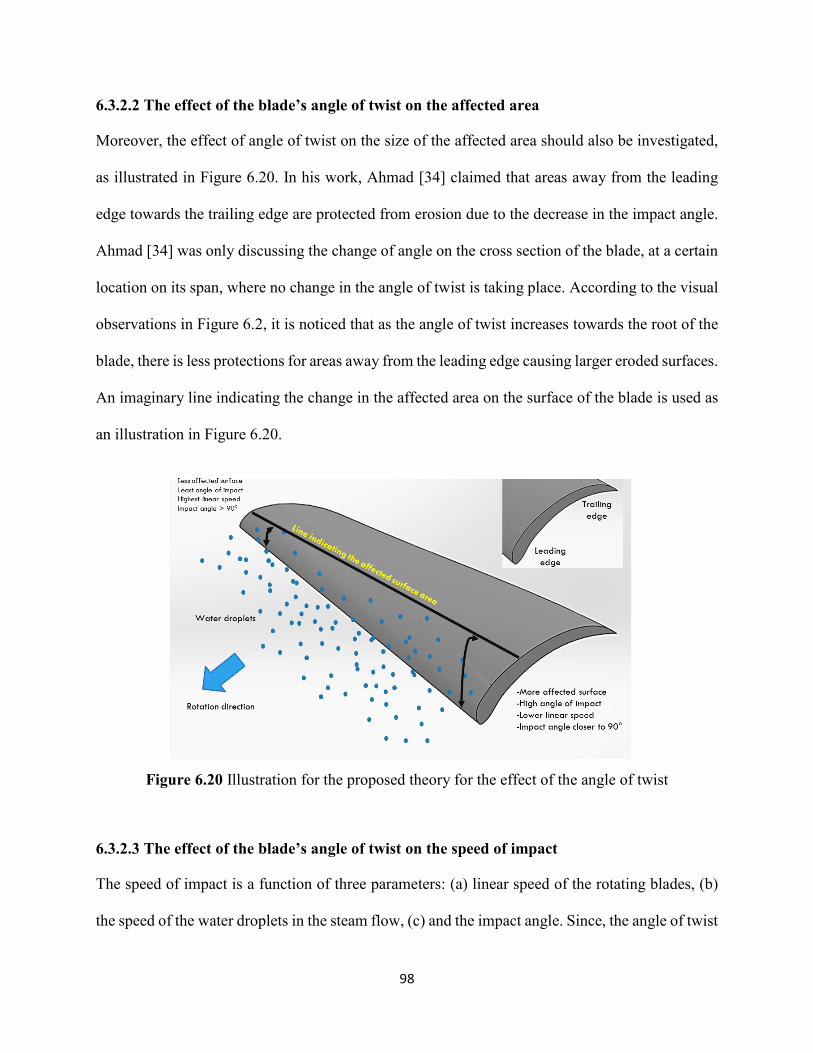
98
6.3.2.2 The effect of the blade’s angle of twist on the affected area
Moreover, the effect of angle of twist on the size of the affected area should also be investigated,
as illustrated in Figure 6.20. In his work, Ahmad [34] claimed that areas away from the leading
edge towards the trailing edge are protected from erosion due to the decrease in the impact angle.
Ahmad [34] was only discussing the change of angle on the cross section of the blade, at a certain
location on its span, where no change in the angle of twist is taking place. According to the visual
observations in Figure 6.2, it is noticed that as the angle of twist increases towards the root of the
blade, there is less protections for areas away from the leading edge causing larger eroded surfaces.
An imaginary line indicating the change in the affected area on the surface of the blade is used as
an illustration in Figure 6.20.
Figure 6.20 Illustration for the proposed theory for the effect of the angle of twist
6.3.2.3 The effect of the blade’s angle of twist on the speed of impact
The speed of impact is a function of three parameters: (a) linear speed of the rotating blades, (b)
the speed of the water droplets in the steam flow, (c) and the impact angle. Since, the angle of twist
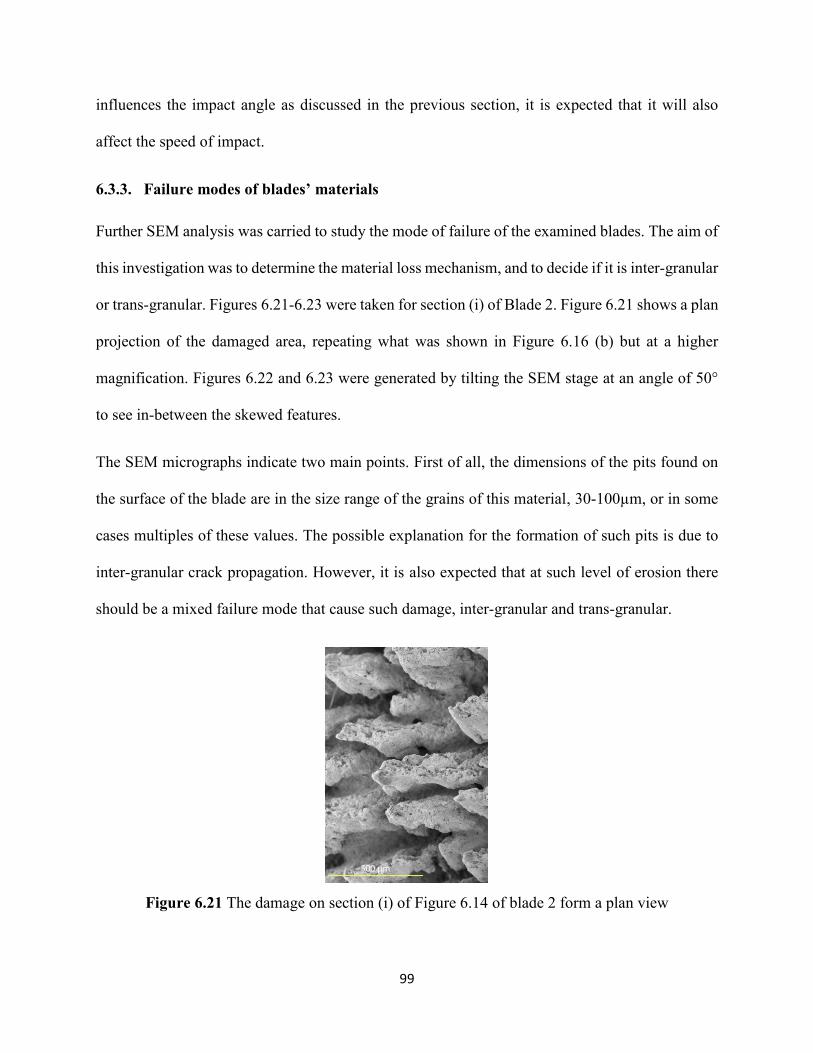
99
influences the impact angle as discussed in the previous section, it is expected that it will also
affect the speed of impact.
6.3.3. Failure modes of blades’ materials
Further SEM analysis was carried to study the mode of failure of the examined blades. The aim of
this investigation was to determine the material loss mechanism, and to decide if it is inter-granular
or trans-granular. Figures 6.21-6.23 were taken for section (i) of Blade 2. Figure 6.21 shows a plan
projection of the damaged area, repeating what was shown in Figure 6.16 (b) but at a higher
magnification. Figures 6.22 and 6.23 were generated by tilting the SEM stage at an angle of 50°
to see in-between the skewed features.
The SEM micrographs indicate two main points. First of all, the dimensions of the pits found on
the surface of the blade are in the size range of the grains of this material, 30-100µm, or in some
cases multiples of these values. The possible explanation for the formation of such pits is due to
inter-granular crack propagation. However, it is also expected that at such level of erosion there
should be a mixed failure mode that cause such damage, inter-granular and trans-granular.
Figure 6.21 The damage on section (i) of Figure 6.14 of blade 2 form a plan view
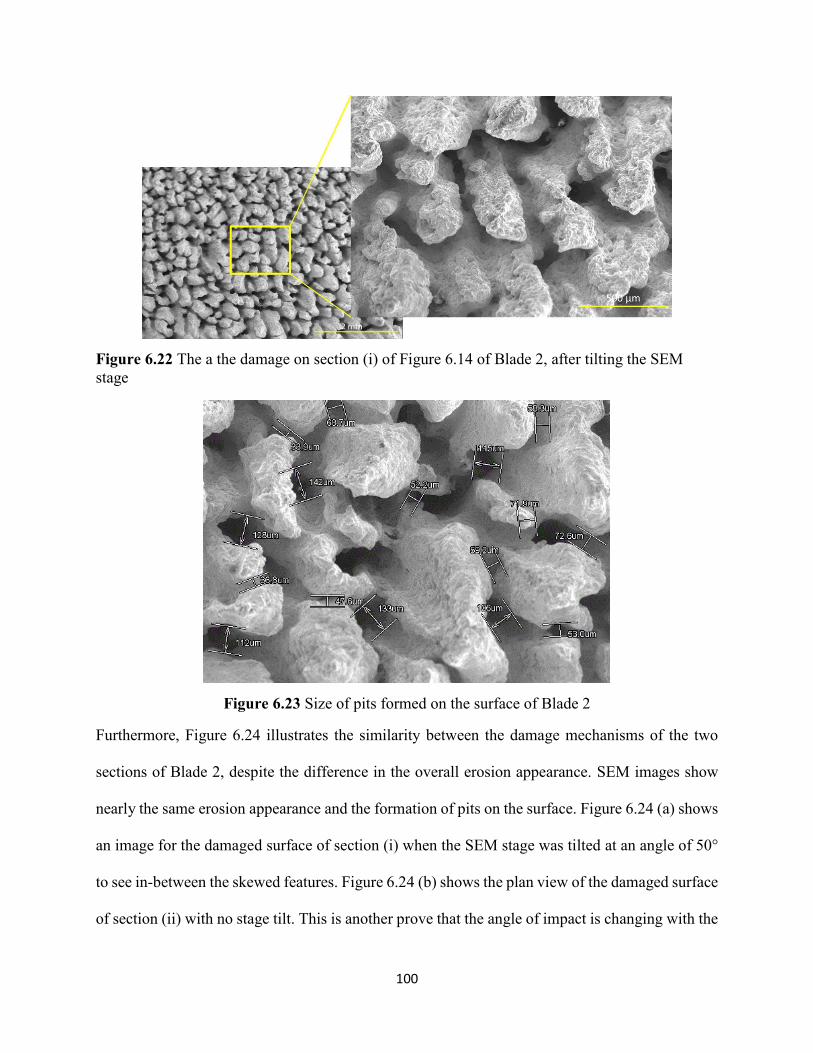
100
Figure 6.22 The a the damage on section (i) of Figure 6.14 of Blade 2, after tilting the SEM
stage
Figure 6.23 Size of pits formed on the surface of Blade 2
Furthermore, Figure 6.24 illustrates the similarity between the damage mechanisms of the two
sections of Blade 2, despite the difference in the overall erosion appearance. SEM images show
nearly the same erosion appearance and the formation of pits on the surface. Figure 6.24 (a) shows
an image for the damaged surface of section (i) when the SEM stage was tilted at an angle of 50°
to see in-between the skewed features. Figure 6.24 (b) shows the plan view of the damaged surface
of section (ii) with no stage tilt. This is another prove that the angle of impact is changing with the
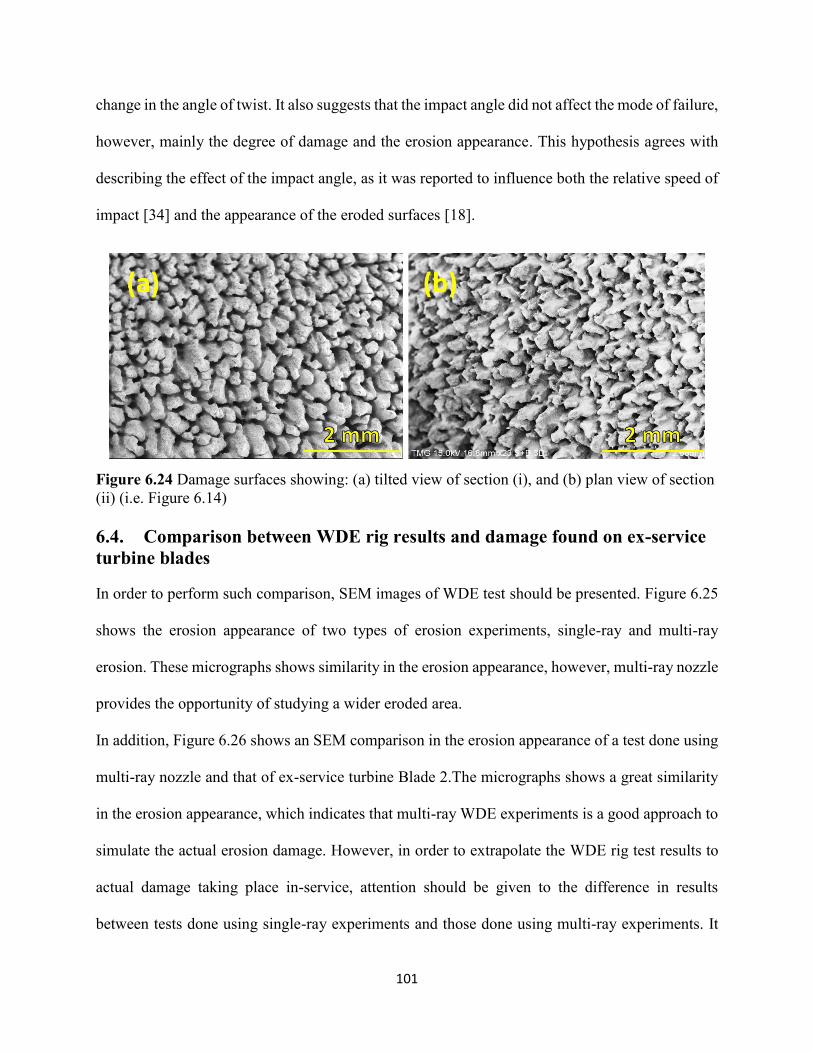
101
change in the angle of twist. It also suggests that the impact angle did not affect the mode of failure,
however, mainly the degree of damage and the erosion appearance. This hypothesis agrees with
describing the effect of the impact angle, as it was reported to influence both the relative speed of
impact [34] and the appearance of the eroded surfaces [18].
Figure 6.24 Damage surfaces showing: (a) tilted view of section (i), and (b) plan view of section
(ii) (i.e. Figure 6.14)
6.4. Comparison between WDE rig results and damage found on ex-service
turbine blades
In order to perform such comparison, SEM images of WDE test should be presented. Figure 6.25
shows the erosion appearance of two types of erosion experiments, single-ray and multi-ray
erosion. These micrographs shows similarity in the erosion appearance, however, multi-ray nozzle
provides the opportunity of studying a wider eroded area.
In addition, Figure 6.26 shows an SEM comparison in the erosion appearance of a test done using
multi-ray nozzle and that of ex-service turbine Blade 2.The micrographs shows a great similarity
in the erosion appearance, which indicates that multi-ray WDE experiments is a good approach to
simulate the actual erosion damage. However, in order to extrapolate the WDE rig test results to
actual damage taking place in-service, attention should be given to the difference in results
between tests done using single-ray experiments and those done using multi-ray experiments. It
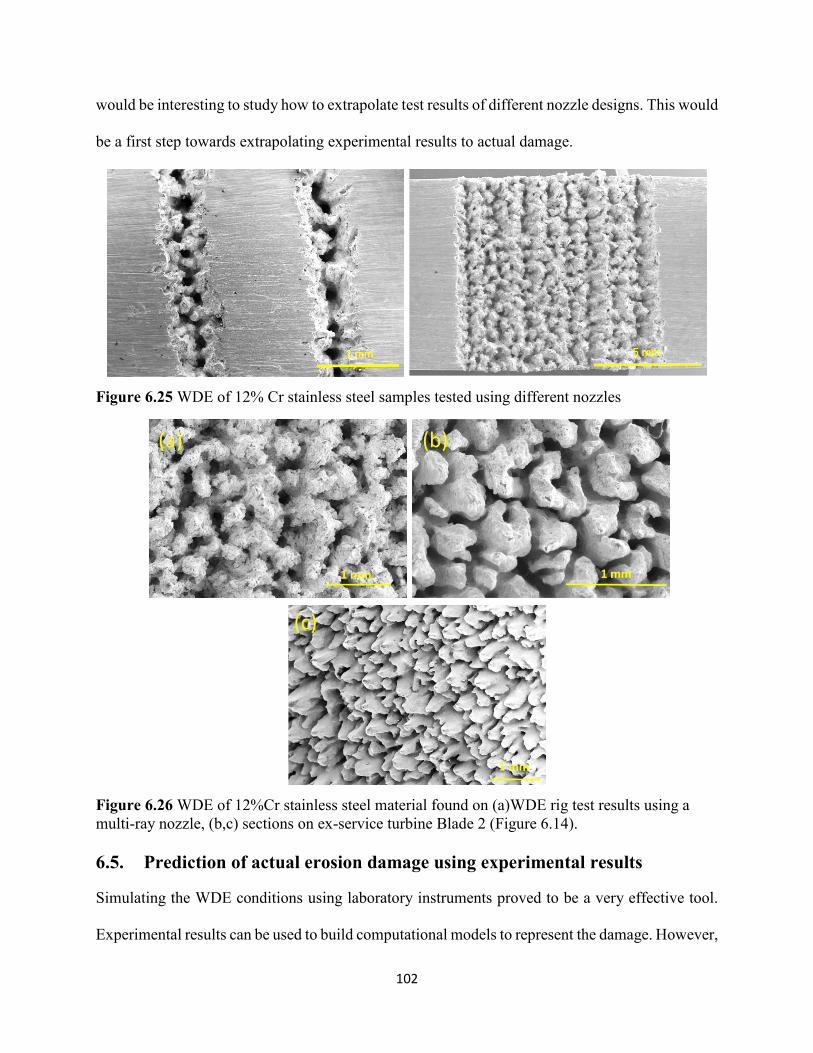
102
would be interesting to study how to extrapolate test results of different nozzle designs. This would
be a first step towards extrapolating experimental results to actual damage.
Figure 6.25 WDE of 12% Cr stainless steel samples tested using different nozzles
Figure 6.26 WDE of 12%Cr stainless steel material found on (a)WDE rig test results using a
multi-ray nozzle, (b,c) sections on ex-service turbine Blade 2 (Figure 6.14).
6.5. Prediction of actual erosion damage using experimental results
Simulating the WDE conditions using laboratory instruments proved to be a very effective tool.
Experimental results can be used to build computational models to represent the damage. However,
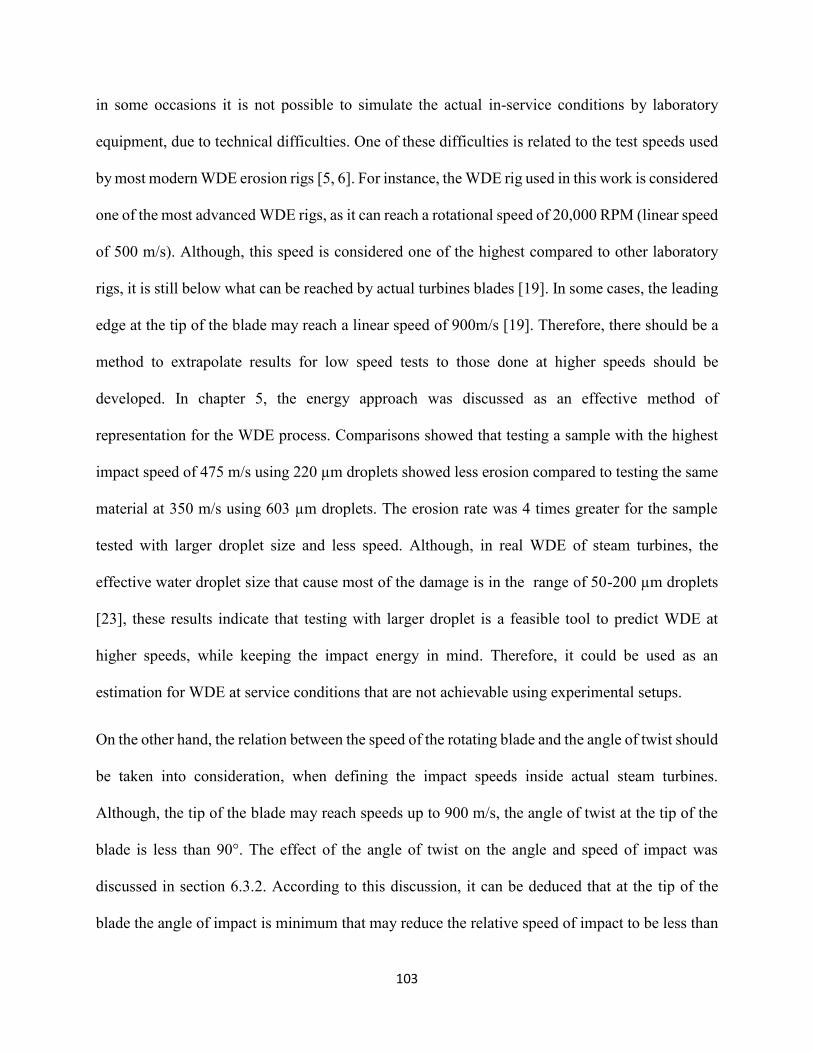
103
in some occasions it is not possible to simulate the actual in-service conditions by laboratory
equipment, due to technical difficulties. One of these difficulties is related to the test speeds used
by most modern WDE erosion rigs [5, 6]. For instance, the WDE rig used in this work is considered
one of the most advanced WDE rigs, as it can reach a rotational speed of 20,000 RPM (linear speed
of 500 m/s). Although, this speed is considered one of the highest compared to other laboratory
rigs, it is still below what can be reached by actual turbines blades [19]. In some cases, the leading
edge at the tip of the blade may reach a linear speed of 900m/s [19]. Therefore, there should be a
method to extrapolate results for low speed tests to those done at higher speeds should be
developed. In chapter 5, the energy approach was discussed as an effective method of
representation for the WDE process. Comparisons showed that testing a sample with the highest
impact speed of 475 m/s using 220 µm droplets showed less erosion compared to testing the same
material at 350 m/s using 603 µm droplets. The erosion rate was 4 times greater for the sample
tested with larger droplet size and less speed. Although, in real WDE of steam turbines, the
effective water droplet size that cause most of the damage is in the range of 50-200 µm droplets
[23], these results indicate that testing with larger droplet is a feasible tool to predict WDE at
higher speeds, while keeping the impact energy in mind. Therefore, it could be used as an
estimation for WDE at service conditions that are not achievable using experimental setups.
On the other hand, the relation between the speed of the rotating blade and the angle of twist should
be taken into consideration, when defining the impact speeds inside actual steam turbines.
Although, the tip of the blade may reach speeds up to 900 m/s, the angle of twist at the tip of the
blade is less than 90°. The effect of the angle of twist on the angle and speed of impact was
discussed in section 6.3.2. According to this discussion, it can be deduced that at the tip of the
blade the angle of impact is minimum that may reduce the relative speed of impact to be less than
104
the linear speed of the rotating blade. However, usually the blade shows more damage appearance
at the tip’s leading edge than that of locations away from it towards the root of the blade. This
could be explained by saying that the relative speed of impact at the blade’s tip is still high enough
to cause this severe erosion marks, however, this impact speed is still relatively lower than the
linear speed of the blade. Therefore, when choosing speed for erosion experiments that simulate
erosion in steam blades, this point should be taken into consideration.
6.6. Summary
Several conclusions could be drawn from this investigation, which helps in further understanding
the water droplet erosion damage on real turbine blades. In addition, the findings of this work are
important for modeling purposes, since they highlight some parameters that were not investigated
before. Important points could be summarized as following:
1. Erosion progression on the surface of ex-service steam turbine blades, from initiation till severe
stages was studied with the aid of SEM micrographs.
2. This work confirmed that the formation of asperities and depressions are considered the main
reasons for initial pits formation. This supports the findings discussed in chapter 4.
3. The angle of twist is an important parameter that influences the WDE of turbine blades. It has
an effect on: (a) erosion appearance, (b) impact angle, (c) impact speed, (d) affected area.
4. WDE rig experiments showed great similarities with real erosion wear appearance, especially
experiments done using multi-ray nozzles. These experiments showed the nearest simulation
to the actual ex-service blade in terms of damage appearance. However, in order to extrapolate
the WDE results to actual damage of in-service blades, attention should be given to the
differences between tests done using single-ray and those done using multi-ray nozzles.
105
7. Conclusions, contributions and suggestions for future work
7.1. Conclusions
Several conclusions could be drawn from this work. In this section the most important points are
highlighted and summarized as follows:
1- Initial surface roughness has a significant impact on the erosion behavior, especially, the
incubation period. However, in some cases it also affects the maximum erosion rate. In
addition, surface roughness is expected to have less effect as the severity of the erosion
conditions increases (higher impact speeds and larger droplet sizes).
2- The amount of surface asperities and irregularities was found to be the main reason for the
difference in the WDE behavior of the same material with different initial surface
roughness, since, the presence of these features accelerates the erosion damage.
3- The initial quality of the surface should be taken into consideration while comparing the
erosion resistance of samples. Generally, it would be a good practice for testing to use
similar initial surface roughness as much as possible. Moreover, the improvement in the
erosion resistance of polished samples could be compared to surface treatments and
coatings. Therefore, as a recommendation improving the final surface quality by reducing
the surface roughness of materials surfaces used in WDE applications, is a valuable tool to
delay erosion.
4- A new representation method for water droplet erosion was successfully developed using
a kinetic energy approach. WDE curves are reported as volume loss per unit impacted area
versus the applied energy intensity.
5- It was concluded that in order to represent WDE in terms of the applied energy intensity,
several parameters should be measured: (a) droplet size, (b) impact speed, (c) number of
106
droplets per impact, and (d) number of impacts (e) impacted area. In addition, some other
factors should be kept constant: (a) initial surface roughness, and (b) impact angle.
6- Results of the current work confirm several theories discussing energy dissipation due to
water droplet and solid surface interactions. In addition, it was found that the energy
dissipation mechanism changes as erosion progresses. This depends on the impact speed,
and the relation between the surface morphology and the droplet size.
7- The results of tests done at different erosion conditions was successfully compared using a
new term that was developed in this work (ξ). The value of (ξ) could be considered as an
index for the variation of material loss due to the change in the amount of absorbed energy
intensity by the solid surface due to changing the erosion test conditions. More
experimental results are needed to further understand the physical meaning of (ξ).
8- The WDE of steel blades were studied and analyzed from initiation till severe stages. In
addition the observed damage was related to the theories found in the literature.
9- It was concluded through the SEM investigations that the angle of twist influences three
main parameters in the erosion process, they are: (a) erosion appearance, (b) affected area,
(c) speed of impact.
10- According to the findings of this work, lab instruments can be used to simulate actual in-
service WDE of turbine blades. In addition, the test done using the multi-ray nozzle showed
great similarity in erosion appearance with that of the analyzed blades.
7.2. Contributions
This work contributes to the understanding of WDE phenomenon. A new way of WDE
representation was developed using a kinetic energy approach. This representation method is a
strong tool for results comparison purposes and for prediction of untested erosion conditions. In
107
addition, this work is one of the few that discussed the WDE of steam turbine blades, in attempt
to correlate experimental rig results to actual damage. It was found that multi-ray nozzle
experiments are valuable tools to simulate actual in-service blades. Moreover, the current work
confirmed the feasibility of predicting WDE at unattainable conditions using controlled
experiments (i.e. instead of using small droplets and high speed, experiments could be done using
large droplets and lower speeds). Furthermore, it was confirmed in this work that some parameters
which were not given enough attention in the literature, have significant effects on the WDE
process. Firstly, it was concluded that the initial surface roughness has a significant effect on the
WDE behavior, especially, the length of the incubation period. Secondly, the twist angle of the
turbine blade around its own axis was found to be one of the important parameters that determine
the erosion appearance on the surface of the turbine blades.
7.3. Suggestions for future work
This work should be considered as one step towards further understanding of the WDE problem.
Several points could be potential research points for future work, they could be suggested as
follows:
1- Investigating the differences in results produced by several test rigs.
2- Studying the effect of surface roughness at higher speeds and different droplet sizes, to
have a full overview on its effect.
3- Studying the effect of several polishing techniques on the erosion behaviour.
4- Studying the effect of initial surface roughness on various surface treatments and substrate
materials.
5- Improving the energy representation of WDE by adding more experimental results at a
wider speed range using different droplet sizes, and for different materials.

108
6- Building trends for the change in (ξ) by changing test conditions to further understand its
physical meaning.
7- Developing of a criteria for extrapolating laboratory erosion results to actual in-service
blades.
109
References
1. Honegger, E., Tests on erosion caused by jets. Brown Boveri Review, 1927. 14(4): p. 95-104.
2. Cook, S.S., Water-hammer erosion in turbines. Proceedings of the University of Durham
Philosophical Society, 1929. 8: p. 88-100.
3. Heymann, F.J., A survey of clues to the relationship betweenerosion rate and impact parameters.
Proceedings of the second Meersburg conference on rain erosion and allied phenomena held on
the Bondensee, Fedreal German Republic, 16th-18th August 1967, 1967: p. 683-760.
4. Heymann, F.J., Erosion by liquids. Machine design, December10, 1970: p. 118-124.
5. Elliott, D.E., J.B. Marriott, and A. Smith, Comparison of erosion resistance of standard steam
turbine blade and shield materials on four test rigs. Characterization and Determination of Erosion
Resistance (ASTM International), 1970. STP 474 p. 127-61.
6. Ahmad, M., M. Casey, M. Sürken, Experimental assessment of droplet impact erosion resistance
of steam turbine blade materials. Wear, 2009. 267(9–10): p. 1605-1618.
7. Alturki, F.A., A. AbouelKasem, S. M. Ahmed, Characteristics of cavitation erosion using image
processing techniques. Journal of Tribology, ASME, 2013. 135.
8. Brown, E.G., J.F. Quilliam, Solid-particle erosion of utility steam turbines: 1985 workshop. EPRI
report CS-3178, 1983.
9. Hammitt, F.G., F. J. Heymann, Liquid erosion failures. Failure Analysis and Prevention, Metals
Handbook, 1975. 10: p. 160-167.
10. Heymann, F.J., Liquid impingement erosion. ASM Handbook: Friction, Lubrication, and Wear
Technology (ASM International), 1992. 18: p. 221 - 231.
11. Heymann, F.J., On the time dependence of the rate of erosion due to impingement or cavitation.
STP 408 Erosion by Cavitation or Impingement (ASTM International), Jan. 1967: p. 70-110.
12. Yasugahira, N., K. Namura, R. Kaneko, T. Satoh, Erosion resistance of titanium alloys for steam
turbine blades. Hitachi, 1988.
13. Hattoria, s., Gang Linb, Effect of droplet diameter on liquid impingement erosion. AIP Conference
Proceedings, 2012. 1428.
14. Ferng, Y.M. and B.H. Lin, Predicting the wall thinning engendered by erosion–corrosion using
CFD methodology. Nuclear Engineering and Design, 2010. 240(10): p. 2836-2841.
15. Ma, D., A. Mostafa , D. Kevorkov, P. Jedrzejowski, M. Pugh, M. Medraj, Comparison of liquid
impingement erosion performance of LPB treated and non-treated Ti64. Unpublished manuscript,
2014.
16. Meher-Homji, C.B., T. R. Mee III, Gas turbine power augmentation by fogging of inlet air.
Proceedings of the 28th Turbomachinery symposium, Texas A&M University, 1999: p. 93-114.
17. Dewey, R.P., N.F. Rieger, Survey of steam turbine blade failures. EPRI report CS-3891, 1985.
18. Missimer, J.R., Turbine blade failures, Who pays? Proceedings of the Failure Analysis Program
and Related Papers presented at the International Conference and Exposition on Fatigue, Corrosion
Cracking, Fracture Mechanics and Failure Analysis, ASM, 2004.
19. Ryzhenkov, V.A., A.I. Lebedeva, and A.F. Mednikov, Erosion wear of the blades of wet-steam
turbine stages: Present state of the problem and methods for solving it. Thermal Engineering, 2011.
58(9): p. 713-718.
20. Oka, Y.I., S. Mihara, and H. Miyata, Effective parameters for erosion caused by water droplet
impingement and applications to surface treatment technology. Wear, 2007. 263(1–6): p. 386-394.
21. Lee, B.E., K.J. Riu, S.H. Shin, S.B. Kwon, Development of a water droplet erosion model for large
steam turbine blades. KSME International Journal, 2003. 17(1): p. 114-121.
22. Haag, M., Untersuchungen zur schädigungsentwicklung an dampfturbinenwerkstoffen infolge von
wassertropfenerosion. Masters thesis, Technische Universität Kaiserslautern, 2009.
110
23. Förster, S., Untersuchungen des strömungsmechanischen Einflusses verschiedener Erosionsstufen
an Dampfturbinen- Niederdruck- Beschaufelungen. Masterarbeit, Hochschule für Technik und
Wirtschaft Berlin, 2010.
24. Mann, B.S., V. Arya, and B.K. Pant, Cavitation erosion behavior of HPDL-treated TWAS-coated
Ti6Al4V alloy and its similarity with water droplet erosion. Journal of Materials Engineering and
Performance, 2012. 21(6): p. 849-853.
25. ASTM Standard G73 2010, Standard test method for liquid impingement erosion using rotating
apparatus, ASTM International, West Conshohocken, PA, 2010, DOI 10.1520/G0073-10,
www.astm.org.
26. Field, J.E., M.B. Lesser, and J.P. Dear, Studies of two-dimensional liquid-wedge impact and their
relevance to liquid-drop impact problems. Proceedings of the Royal Society of London. Series A,
Mathematical and Physical Sciences, 1985. 401(1821): p. 225-249.
27. Hammitt, F.G., Y. C. Huang,C. L. Kling,T.M. Mitchell Jr,L. Solomon, , A statistically verified
model for correlating volume loss due to cavitation or liquid impingement. Characterization and
Determination of Erosion Resistance (ASTM International), 1970. STP 474: p. 288-322.
28. Thomas, G.P. and J.H. Brunton, Drop impingement erosion of metals. Proceedings of the Royal
Society of London. Series A, Mathematical and Physical Sciences, 1970. 314(1519): p. 549-565.
29. Heymann, On the shock wave velocity and impact pressure in high-speed liquid-solid impact.
Transactions of the ASME, 1969. 90: p. 400-402.
30. Springer, G.S., Liquid droplet erosion. John Wiley & Sons, New York, 1976.
31. Thiruvengadam, A.a.S.L.R., Experimental and analytical investigations on multiple liquid impact
erosion. Hydronautics Inc., National Aeronautics and Space Administration, 1969. NASA CR-
1288.
32. Engel, O.G., Waterdrop collisions with solid surfaces. J. Res. Nat. Bur. Standards, 1955. 54(5): p.
281-298.
33. Bowden, F.P. and J.H. Brunton, The deformation of solids by liquid impact at supersonic speeds.
Proceedings of the Royal Society of London, Series A (Mathematical and Physical Sciences), 1961.
263: p. 433-450.
34. Ahmad, M., Experimental assessment of droplet impact erosion of low-pressure steam turbine
blades PhD thesis, Von der Fakultät Energie, Verfahrens und Biotechnik der Universität Stuttgart
,Shaker Verlag , Achen, Germany, 2009.
35. Jenkins, D.C., J.D. Brooker, The impingement of water drops on a surface moving at a high speed.
Aerodynamic capture of particles, (ed. by E.G. Richardson), Pergamon Press, 1960: p. 97-103.
36. Mahdipoor, M.S., H.S. Kirols, D. Kevorkov, P. Jedrzejowski, M. Medraj, Influence of impact speed
on water droplet erosion of TiAl compared to Ti6Al4V. Not published yet, 2015.
37. Hancox, N.L. and J.H. Brunton, The erosion of solids by the repeated impact of liquid drops.
Philosophical Transactions of the Royal Society of London. Series A, Mathematical and Physical
Sciences, 1966. 260(1110): p. 121-139.
38. Ahmad, M., M. Schatz, and M.V. Casey, Experimental investigation of droplet size influence on
low pressure steam turbine blade erosion. Wear, 2013. 303(1–2): p. 83-86.
39. Heymann, F.J., Toward quantitative prediction of liquid impact erosion. ASTM Special Technical
Publication, 1970: p. 212-248.
40. DeCorso, S.M., Erosion tests of steam turbine blade materials. American Society for Testing and
Materials - Proceedings, 1964. 64: p. 782-796.
41. Adler, W.F., Particulate impact damage predictions. Wear, 1995. 186–187, Part 1(0): p. 35-44.
42. Wheeler, W.H., Mechanism of cavitation erosion. Cavitation in hydrodynamics, National physical
laboratory symposium, Teddington, England, Philosophical library, New York, 1957.
43. Karunamurthy, B., M. Hadfield, C. Vieillard, G. Morales, Cavitation erosion in silicon nitride:
Experimental investigations on the mechanism of material degradation. Tribology International,
2010. 43(12): p. 2251-2257.
111
44. Litzow, U., S. Johannes, Cavitation erosion of advanced ceramics in water International Journal
of Materials Research, 2006. 97(10): p. 1372-1377.
45. Dulias, U., K.H. Zum Gahr, Investigation of Al2O3- and SSiC-ceramic under lubricated,
reciprocating sliding contact and cavitation erosion. Materialwissenschaft und Werkstofftechnik,
2005. 36(3-4): p. 140-147.
46. Tomlinson, W.J. and M.G. Talks, Cavitation erosion of grey cast irons containing 0.2 and 1.0%
phosphorous in corrosive waters. Tribology International, 1989. 22(3): p. 195-204.
47. Espitia, L.A. and A. Toro, Cavitation resistance, microstructure and surface topography of
materials used for hydraulic components. Tribology International, 2010. 43(11): p. 2037-2045.
48. Tobin, E.F., T.M. Young, D. Raps, O. Rohr, Comparison of liquid impingement results from
whirling arm and water-jet rain erosion test facilities. Wear, 2011. 271(9–10): p. 2625-2631.
49. Schmitt, G.F., Liquid and solid impact erosion. Technical report AFML-TR-79-4122, 1979.
50. Busch, H., G. Hoff, G. Langbein, G. Taylor, D.C. Jenkins, M.A. Taunton, A. A. Fyall, R.F.
Jones,T.W. Harper, Rain erosion properties of materials [and discussion]. Philosophical
Transactions of the Royal Society of London. Series A, Mathematical and Physical Sciences, 1966.
260(1110): p. 168-181.
51. Hoff, G., Langbein, G. and Rieger, H., Material destruction due to liquid impact. American Society
for Testing and Materials. Committee G-2 on Erosion by Cavitation or Impingement, 1966. ASTM
STP 408: p. 42-69.
52. Thirwvengadam, A., S.L. Rudy, and M. Gunasekaran, Experimental and analytical investigations
on liquid impact erosion. ASTM Special Technical Publication, 1970: p. 249-287.
53. Kamkar, N., F. Bridier,P. Bocher,P. Jedrzejowski,, Water droplet erosion mechanisms in rolled Ti-
6Al-4V. Wear, 2013. 301(1-2): p. 442-8.
54. Papageorgiou, D.T., On the breakup of viscous liquid threads. Physics of Fluids, 1995. 7(7): p.
1529-1544.
55. Wood, N.B. and V.M. Morton, Inlet angle distribution of last stage moving blades for large steam
turbines. International Journal of Heat and Fluid Flow, 1984. 5(2): p. 101-111.
56. Uihlein, A., C. M. Maggi, I. Keisker, Water droplet erosion at steam turbines: testing method &
validation. Electrical Power Research Institute (EPRI),Technology innovation: Proceeding:
International conference on solid partical and liquid droplet erosion, Milan 2012, Technical report,
2012.
57. Vander-Voort, G.F., G.M. Lucas,E.P. Manilova, Metallography and microstructures of stainless
steels and maraging steels. Metallography and Microstructures, Vol 9, ASM Handbook, ASM
International, 2004: p. 670-700.
58. Callister, W.D., D.G. Rethwisch, Materials science and engineering: An introduction, 8th edition.
59. Al-Shahrani, S., T.J. Marrow, Effect of surface finish on fatigue of stainless steels. 12th
International Conference on Fracture , ICF-12 ,Ottawa, ON, Canada, 2009.
60. Li, X., L. Mao, and X. Ma, Dynamic behavior of water droplet impact on microtextured surfaces:
The effect of geometrical parameters on anisotropic wetting and the maximum spreading diameter.
Langmuir, 2012. 29(4): p. 1129-1138.
61. Mann, B.S. and V. Arya, HVOF coating and surface treatment for enhancing droplet erosion
resistance of steam turbine blades. Wear, 2003. 254(7–8): p. 652-667.
62. Oka, Y.I., H. Miyata, Erosion behaviour of ceramic bulk and coating materials caused by water
droplet impingement. Wear, 2009. 267(11): p. 1804-10.
63. Shipway, P.H., K. Gupta, The potential of WC-Co hardmetals and HVOF sprayed coatings to
combat water-droplet erosion. Wear, 2011. 271(9-10): p. 1418-25.
64. Oka, Y.I., H. Hayashi, Evaluation of erosion resistance for metal-ceramic composites and cermets
using a water-jet testing apparatus. Wear, 2011. 271(9-10): p. 1397-403.
65. Mahdipoor, M.S., F. Tarasi, C. Moreau, A.Dolatabadi,M.Medraj, HVOF sprayed coatings of nano-
agglomerated tungsten-carbide/cobalt powders for water droplet erosion application. Wear, 2015.
http://dx.doi.org/10.1016/j.wear.2015.02.034.
112
66. Kong, M.C., D. Axinte, and W. Voice, Aspects of material removal mechanism in plain waterjet
milling on gamma titanium aluminide. Journal of Materials Processing Technology, 2010. 210(3):
p. 573-584.
67. Lesser, M.B., J.E. Field, The impact of compressible liquids. Annual Review of Fluid Mechanics,
1983. 15(1): p. 97-122.
68. Wood, N.B., V.M. Morton, Inlet angle distribution of last stage moving blades for large steam
turbines. International Journal of Heat and Fluid Flow, 1984. 5(2): p. 101-111.
69. Barlow, L.D. and M. Du Toit, Effect of austenitizing heat treatment on the microstructure and
hardness of martensitic stainless steel AISI 420. Journal of Materials Engineering and Performance,
2012. 21(7): p. 1327-1336.
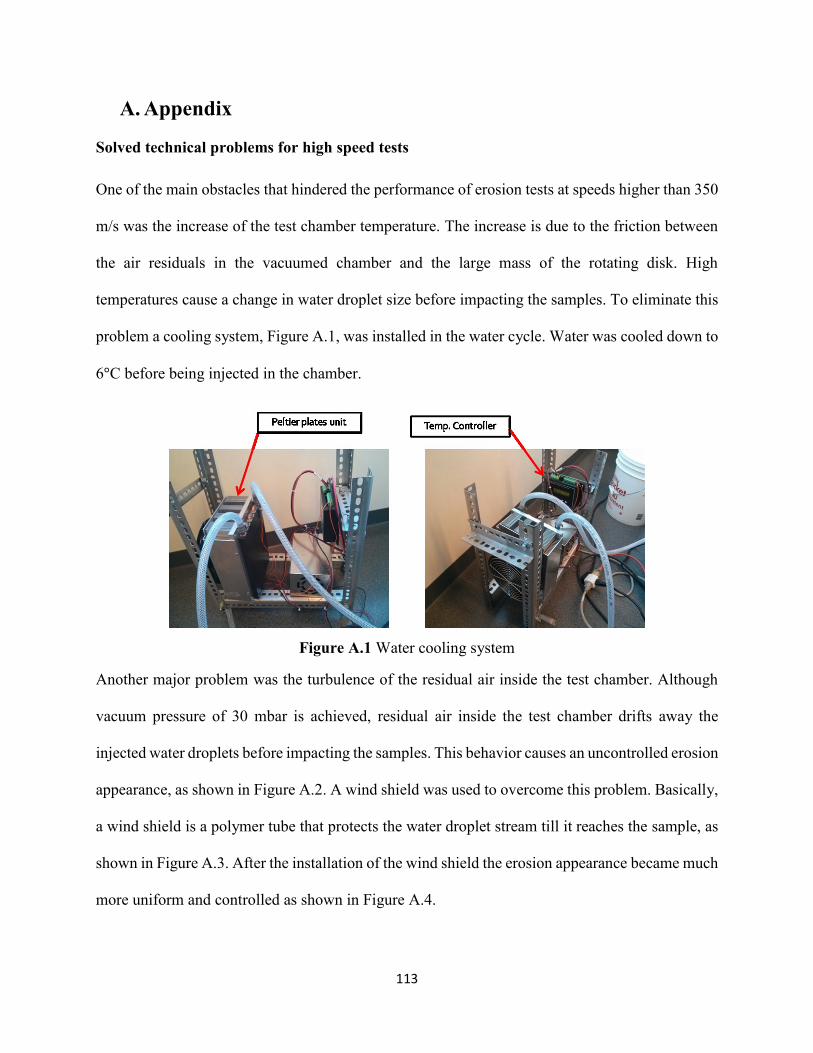
113
A. Appendix
Solved technical problems for high speed tests
One of the main obstacles that hindered the performance of erosion tests at speeds higher than 350
m/s was the increase of the test chamber temperature. The increase is due to the friction between
the air residuals in the vacuumed chamber and the large mass of the rotating disk. High
temperatures cause a change in water droplet size before impacting the samples. To eliminate this
problem a cooling system, Figure A.1, was installed in the water cycle. Water was cooled down to
6°C before being injected in the chamber.
Figure A.1 Water cooling system
Another major problem was the turbulence of the residual air inside the test chamber. Although
vacuum pressure of 30 mbar is achieved, residual air inside the test chamber drifts away the
injected water droplets before impacting the samples. This behavior causes an uncontrolled erosion
appearance, as shown in Figure A.2. A wind shield was used to overcome this problem. Basically,
a wind shield is a polymer tube that protects the water droplet stream till it reaches the sample, as
shown in Figure A.3. After the installation of the wind shield the erosion appearance became much
more uniform and controlled as shown in Figure A.4.
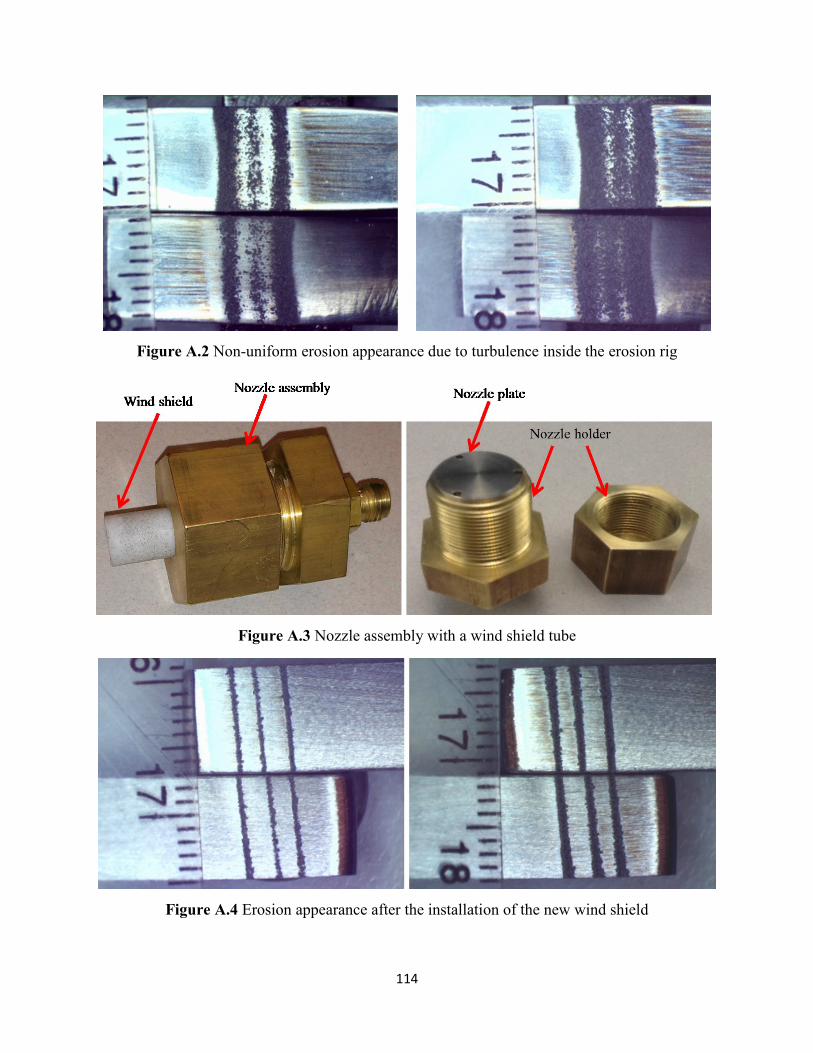
114
Figure A.2 Non-uniform erosion appearance due to turbulence inside the erosion rig
Figure A.3 Nozzle assembly with a wind shield tube
Figure A.4 Erosion appearance after the installation of the new wind shield
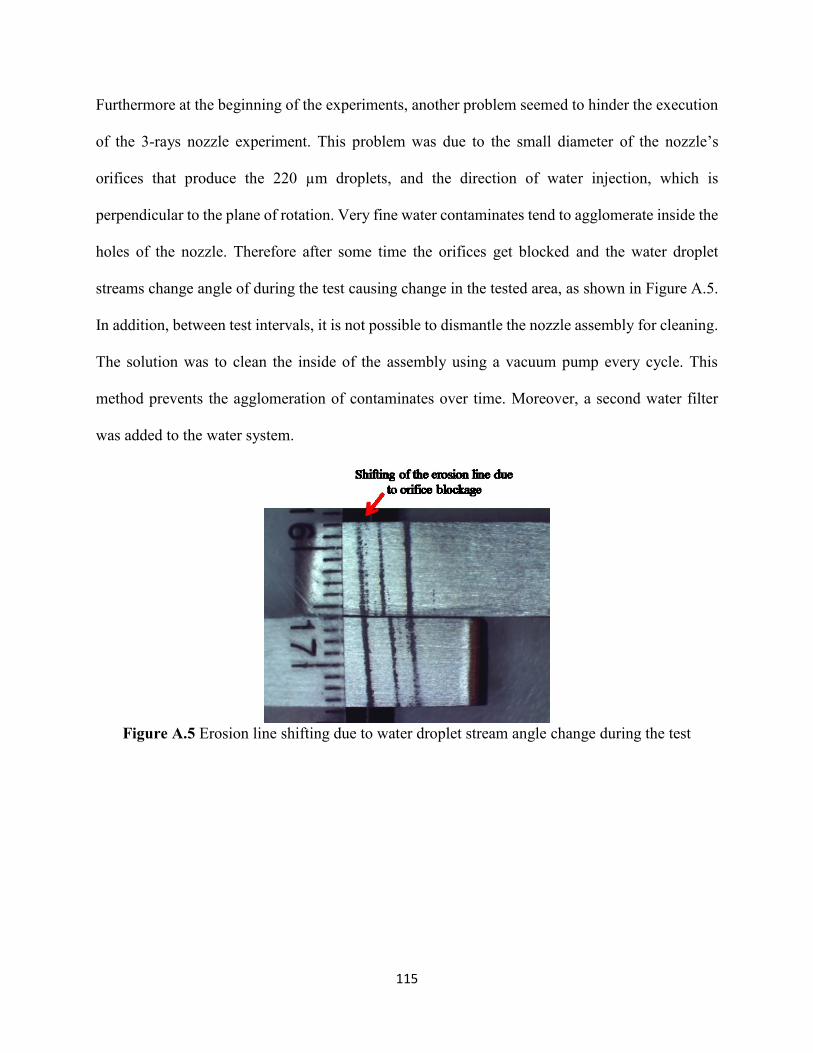
115
Furthermore at the beginning of the experiments, another problem seemed to hinder the execution
of the 3-rays nozzle experiment. This problem was due to the small diameter of the nozzle’s
orifices that produce the 220 µm droplets, and the direction of water injection, which is
perpendicular to the plane of rotation. Very fine water contaminates tend to agglomerate inside the
holes of the nozzle. Therefore after some time the orifices get blocked and the water droplet
streams change angle of during the test causing change in the tested area, as shown in Figure A.5.
In addition, between test intervals, it is not possible to dismantle the nozzle assembly for cleaning.
The solution was to clean the inside of the assembly using a vacuum pump every cycle. This
method prevents the agglomeration of contaminates over time. Moreover, a second water filter
was added to the water system.
Figure A.5 Erosion line shifting due to water droplet stream angle change during the test