Embed Size (px)
Citation preview

Research ArticleWater Dynamics on Germinating Diaspores: PhysiologicalPerspectives from Biophysical Measurements
J. P. Ribeiro-Oliveira ,1 M. A. Ranal ,2 and M. A. Boselli 3
1Instituto de Ciências Agrárias, Universidade Federal de Uberlândia, Avenida João Naves de Ávila, 2121, 38400-902 Uberlândia,Minas Gerais, Brazil2Instituto de Biologia, Universidade Federal de Uberlândia, Avenida João Naves de Ávila, 2121, 38400-902 Uberlândia,Minas Gerais, Brazil3Instituto de Física, Universidade Federal de Uberlândia, Avenida João Naves de Ávila, 2121, 38400-902 Uberlândia,Minas Gerais, Brazil
Correspondence should be addressed to J. P. Ribeiro-Oliveira; [email protected]
Received 10 April 2020; Accepted 20 October 2020; Published 6 December 2020
Copyright © 2020 J. P. Ribeiro-Oliveira et al. Exclusive Licensee Nanjing Agricultural University. Distributed under a CreativeCommons Attribution License (CC BY 4.0).
We demonstrated that classical biophysical measurements of water dynamics on germinating diaspores (seeds and other dispersalunits) can improve the understanding of the germination process in a simpler, safer, and newer way. This was done using diasporesof cultivated species as a biological model. To calculate the water dynamics measurements (weighted mass, initial diffusioncoefficient, velocity, and acceleration), we used the mass of diaspores recorded over germination time. Weighted mass ofgerminating diaspores has a similar pattern, independent of the physiological quality, species, or genetic improvement degree.However, the initial diffusion coefficient (related to imbibition per se), velocity, and acceleration (related to the wholegermination metabolism) are influenced by species characters, highlighting the degree of genetic improvement and physiologicalquality. Changes in the inflection of velocity curves demonstrated each phase of germination sensu stricto. There is no patternrelated to the number of these phases, which could range between three and six. Regression models can demonstrate initialvelocity and velocity increments for each phase, giving an idea of the management of germinative metabolism. Our findsdemonstrated that germination is a polyphasic process with a species-specific pattern but still set by the degree of geneticimprovement and (or) physiological quality of diaspores. Among the biophysical measurements, velocity has the greatestpotential to define the germination metabolism.
1. Introduction
The water flux from soil to diaspore (seeds and other dis-persal units) is the main regulating factor for the end ofanabiosis and, hence, for embryo growth and development.Thus, this relation plays a central role in diaspore waterrelations studies [1]. For a long time, water relations inthe germination process were algebraically evaluated bymeans of the Lockhart model [2, 3], which describes thegrowth of single cells [4]. However, since germination isgenerally considered a binomial phenomenon (it eitheroccurs or not), it is unfeasible to use the Lockhart modelwithout modifications [3]. From this, several models wereproposed to explain the influx and distribution of waterin germinating diaspores in relation to temperature, waterpotential, irradiance, and plant hormones [3, 5–8]. These
models are very important to predict diaspore germinationbehavior in field conditions, mainly under stress, but theircomplexity hinders their wider use by most diaspore scien-tists. This has led us to the following question. How can webetter explore water dynamics on germinating diaspores inan easier and safer way?
Studies focusing on the kinetics of water on germinatingdiaspores seem to be a good answer. This biophysicalapproach has been previously proposed [9–13]. However,this approach only considers three phases of physiologicalactivity associated with three steps of the water dynamicson germinating diaspores ([14] sense). This theory led scien-tists to a static idea that water dynamics on germinating dia-spores is a quite defined process with three stages (phases). Inpractice, these stages can be observed by a curve that demon-strates the cumulative mass associated with tissue hydration
AAASPlant PhenomicsVolume 2020, Article ID 5196176, 16 pageshttps://doi.org/10.34133/2020/5196176
in diaspores, inferring how the germination process occursover time (see [15–17]). Thus, in classical literature [15,16, 18–20], these phases are used by researchers as chrono-logical markers of germination sensu stricto. This techniqueis very important for studies focusing on physiological,molecular, and morphophysiological aspects (e.g., [3, 21–29]), but it is poorly discussed. For instance, we saw thateven when using just diaspore mass variation, it is possibleto propose other models than the classical, as in the studyof germination-dormancy balance in Sisymbrium officinale(L.) Scop. seeds [30].
The well-founded relation of germination and water con-tent is based on physical and metabolic changes triggered bythe water influx and managed by the embryo for its develop-ment [15, 16, 18–20]. The water influx from the environmentto the germinating diaspore determines the embryo develop-ment potential since it is associated with maintaining cellularturgor and, hence, cell wall properties [3, 31], essential togrowth and differentiation. Furthermore, it is also wellknown that water influx is conducted by alterations in theproportion of anabolism and catabolism in diaspore cells,which provokes fluctuations in the osmotic potential [17,24]. These fluctuations alter diaspore mass over time. Takingthis into account, we hypothesized that by measuring waterdynamics on germinating diaspores accurately by means ofclassical biophysical measurements calculated from individ-ual mass fluctuations, we will improve the understanding ofgermination sensu stricto. In any case, although diasporemass is a continuous character, its fluctuations are associatedwith water potential, metabolic activity, and, therefore, thephysiological process per se.
It is worth noting that in addition to the cell structurebeing progressively modified by water distribution in germi-nating diaspores [32, 33], the hormonal metabolism and oxi-dative metabolism are also triggered [34, 35]. This is the basisfor deeper physiological changes promoted on germinatingdiaspores. Thus, an exact analysis of water intake and itsmovement during germination is necessary to understandall processes of life activation from anabiosis [33, 35, 36] toembryo protrusion. Nevertheless, the techniques used to per-form this analysis, such as nuclear magnetic resonance [35,36] and micromagnetic resonance imaging [32], are veryexpensive and require great technical support. On the otherhand, mass evaluation can be a simple alternative to observewater distribution in germinating diaspores and has beenclassically used by diaspore scientists to support theirhypotheses about water relations (e.g., [10, 12]). In this con-text, there are no doubts that inferences about the germina-tion process from water dynamics on germinating diasporesare possible with little infrastructure. This would be usefulfor diaspore scientists acquiring information on the germina-tive metabolism from the start. As a consequence, they wouldnot need to evaluate the process through destructive tests,such as the tetrazolium test, or infer germination only whenit ends (embryo protrusion). In this consensus, we demon-strate how water dynamics on germinating diaspores can beused as a physiological and metabolic trait when studied bymeans of biophysical measurements associated with theincrement of weighted mass.
Because of the aforementioned, we are proposing a newanalytical approach for diaspore scientists to perform robustinferences on diaspore germination even with little infra-structure, without replacing classical and (or) contemporane-ous measurements used to infer germination and (or)metabolism. When you perform a scenario transposition, itis possible to remember that in the early days, germinationstudies were based on cumulative curves [37], which allowedlittle accuracy and assessed the germination process indi-rectly. For this reason, several researchers have resorted tomathematical expressions to calculate uniformity, time, andvelocity of germination accurately based on embryo protru-sion [37]. Based on this assumption, this study (i) proposesthe use of classical biophysical measurements of waterdynamics on germinating diaspores to study germinationsensu stricto, (ii) points out the best measurement to gaugethe germination process, (iii) demonstrates algebraically thepolymodal character of the germination process, and (iv)explains how these measurements can be used in practiceby scientists.
2. Material and Methods
2.1. Biological Model and Classification of Diaspore Samples.We used diaspores of a species with great social-economicalrelevance around the world. We studied caryopses ofP44446H transgenic maize hybrid (Zea mays L. hybrid type),Caiano cultivar maize (Zea mays L. creole type), and BRS254cultivar wheat (Triticum aestivum L.); seeds of NA5909RRcultivar transgenic soybean (Glycine max L.); BRS-Horizontecultivar common bean (Phaseolus vulgaris L.); and cypsela ofHelio 360 hybrid sunflower (Helianthus annuus L.). Thesediaspores did not possess any obstacles to germination. Theinitial moisture content of the diaspores was standardized to11%, independently of physiological quality or species. Thisstandardization was performed based on the lowest moisturecontent observed in the different samples.
Private companies and research institutions provided thediaspore samples without any chemical treatment. All dia-spores, independent of the sample or species, were producedin the 2013/14 crop season in Brazil. The cultivation and har-vesting procedures followed those defined by the protocol ofeach donor company. The diaspores of each species weresupplied by the same company. The physiological quality ofthe samples was evaluated in pretesting, quantifying germi-nability, viability, and time to the first germination. Fromthis, we studied three samples (with low, medium, and highquality) of each species or cultivar, as is the case of maize.The sample processing and designations low, medium, andhigh follow the ones proposed by Ribeiro-Oliveira and Ranal[14, 38], who defined them based on viability and germina-tion measurements. Samples composed by diaspores withviability (V) and germinability (G) higher than 90% wereconsidered high quality, whereas V ≤ 60% and G ≤ 50% wereconsidered low quality. The diaspores with medium qualityhad intermediate values for both characters. Thus, we had amathematical boundary for classifying physiological qualityand, therefore, providing a robust study model. This alsoallowed us to comply with the International Seed Testing
2 Plant Phenomics

Association (ISTA) methods for seed testing validation[39], and it also gave us an important base to discussthe diaspore sample from a biological system point ofview. It is important to note that ISTA, based on ISO[40], determines that any method of diaspore testing canonly be validated when using samples with different phys-iological standards.
2.2. Water Dynamics on Germinating Diaspores. Diasporeswere sowed in germination boxes (plastic boxes) over papersoaked with distilled water (volume in mL equivalent to sixtimes the mass of the paper in g) and then placed on a labo-ratory bench at 25:3 + 1:5°C under white fluorescent light(11:29 ± 2:84μmolm−2 s−1 Photosynthetic Photon FluxDensity (PPFD)). The environmental temperature andhumidity were regulated by sensors coupled to an air condi-tioner (Inverter LG–split inverter model, 31 000 BTUs for41m2). When sowing, we used tweezers to place the diasporein a specific position, which was maintained until the lastassessment. By using the germination paper as a spatialreference, diaspores from monocots were put with the scu-tellum facing up, whereas those from eudicots were putwith the hilum at an angle of 90°. These positions guaran-teed that 50% of the diaspore surface was maintained inwater, independently of intra- and (or) interspecific mor-phologies (flatter or rounder). The initial water volume(lost by either experimental manipulation or possible evap-oration) was maintained by adding 1mL (defined in pre-testing) of distilled water in the germination box aftereach mass recording. The diaspore did not suffer anoxiaor hypoxia, since the water volume was not sufficient for sub-mersion. These diaspores (n = 50) were individually weighedon a digital scale (at 0.0001g precision) every hour untiltwo hours after embryo protrusion (i.e., germination sensustricto + immediate postgermination). These two hours wereminimum-development-time for diaspore-seedling (immedi-ate postgermination) transition of our biological models,including diaspores with “two-step germination” ([41] sense),such as caryopses of maize and wheat. Before mass recording,we removed any water excess (or water film) from the dia-spores with a light touch of a paper towel. The germinationboxes were opened just for the mass recording of the diasporeindividual, assuring the germination boxes a system similar toa humidity chamber (high vapor pressure). The water dynam-ics on germinating diaspores was measured by means of thisrecording of mass over time.
2.3. Physiological Measurements. We maintained the dia-spores used in the water dynamics assessment for 48 hoursin the same experimental conditions to analyze them in rela-tion to germinability (G; percentage of germination) and via-bility (V). The viability was calculated using the proportionof viable diaspores (evaluated by means of 2,3,5-triphenyl-2H-tetrazolium chloride solution (TTC)) in relation to thetotal of diaspores analyzed [42]. These data were transformedinto percentages. Germinability and viability data were ana-lyzed according to statistical methods proposed by [43] forgermination and emergence studies in small samples. Thus,the Student t-test (α = 0:05) was used considering the pro-
portion of germinated or viable diaspores. This method isbased on the statistics for proportions [44]. In this sense, adata set of binomial character can be analyzed by means ofthe Student t-test when it has approximate to normal distri-bution, which occurs when n1p̂1 > 5, n1q̂1 > 5, n2p̂2 > 5, andn2q̂2 > 5, where p̂1 = X1/n1, q̂1 = 1 − p̂1, p̂2 = X2/n2, and q̂2 =1 − p̂2; p̂1 and p̂2 are the proportions of germinated diasporesin sample 1 and sample 2, respectively; q̂1 and q̂2 are theproportions of nongerminated diaspores in sample 1 andsample 2, respectively; X1 and X2 are the numbers of ger-minated diaspores in sample 1 and sample 2, respectively;n1 and n2 are the sample sizes (total diaspores sowed) insample 1 and sample 2, respectively. As our data set dem-onstrated approximate to normal distribution, we com-pared the samples using the mathematical expression forthe Student t-test for proportions.
t = p̂1 − p̂2ffiffiffiffiffiffiffiffiffiffiffiffiffiffiffiffiffiffiffiffiffiffiffiffiffiffiffiffiffiffiffiffiffiffiffiffiffiffiffiffiffip̂1q̂1/n1ð Þ + p̂2q̂2/n2ð Þp , ð1Þ
where p̂1 and p̂2 are the proportions of germinated dia-spores in sample 1 and sample 2, respectively; q̂1 and q̂2are the proportions of nongerminated diaspores in sample1 and sample 2, respectively; and n1 and n2 are the samplesizes (total diaspores sowed) in sample 1 and sample 2,respectively.
2.4. Modeling Water Dynamics on Germinating Diaspores.The central point of these measurements and the base ofthe quantitative treatment is m, the water mass over time.The tabulated values of the normalized mass mðtÞ wereobtained from total mass MðtÞ divided by initial (dry) dia-spore mass (M0). First, we submitted the data set to the boot-strap method with 1 000 resamplings, since values generatedabove this number are similar according to the convergencetest. This was an assumption to calculate weighted masscurves and then means and curves of velocity and accelera-tion. The bootstrap is a technique of successive resamplingfrom original data [45], which ensures that analytical modelsare reproducible and reliable. The technique is useful inapplications for which analytical confidence intervals areunobtainable or when robust nonparametric confidenceintervals are required [46]. In addition, the bootstrap easilyestimates the normal distribution of an estimator, reducesimpacts of the outlier and numerical anomalies, and calculatesthe estimates of standard error and population parametersof confidence intervals [47]. To calculate these confidenceintervals, we used the Algorithm AS 214 for Fortran[48], which is recommended to perform the Monte Carloconfidence intervals.
The first step in the numerical calculation is the inter-polation of mðtÞ by cubic splines [48]. The tabulatedmass measurements in time are interpolated by theexpression
m = Amj + Bmj+1 + Cmj″+DmJ+1″ , ð2Þ
3Plant Phenomics

where the coefficients are
A =t j+1 − t
t j+1 − t j,
B =t − t j
t j+1 − t j,
C = 16 A3 − A� �
t j+1 − t j� �2,
D = 16 B3 − B� �
t j+1 − t j� �2
:
ð3Þ
Here, m″ is the second derivative of m. The cubicspline interpolation keeps the function and its secondderivative continuous. This provides a smooth functionof the mass increment as a function of time and permitsa numerical differentiation of the function to calculate thevelocity, defined as the variation of mass over time,which can be written as
v = dmdt
=m′, ð4Þ
and acceleration, defined as the variation of velocity overtime, which can be written as
a = d2m
dt2=m″: ð5Þ
The interpolation scheme also provides a simple wayto integrate the data and calculate the average values vmand am for velocity and acceleration, respectively. Thetime average am of a parameter aðtÞ is defined by theexpression
am = 1τ
ðτ0a tð Þdt, ð6Þ
where τ is the last time tabulated for each species.The weighted mass of the water dynamics on germinat-
ing diaspores was obtained from mass data collected overtime and weighted by initial mass (dry mass). We proposedthe initial diffusion coefficient, velocity, and acceleration tostudy water dynamics on germinating diaspores. Raw dataof mass were used to calculate the coefficient of initial diffu-sion, which is a function of the water diffusion ratio by the dia-spore radius (D/ρ2; n = 50). This ratio was used focusing on apractical sense, since we used cultivated diaspores that, in gen-eral, have similar dimensions (see details in supplementarymaterial, Table 1S) for each species. We parameterized D/ρ2since errors from approximations from diaspore shapes arepartially compensated (see more in [49]). We used thediffusion coefficient per unit area as an initial diffusioncoefficient because it makes the parameter comparable forspecies with different diaspore sizes.
The diffusion ratio coefficient, the square of the diasporeradius D/ρ2, and the saturation mass M∞ were fitted for a
series solution of the Fick differential equation for a sphericalmodel of the diaspore through the expression [50].
M tð ÞM∞
= 1 − 6π2 〠
∞
n=1
1n2
exp −Dn2π2 tρ2
� �, ð7Þ
where MðtÞ is the total mass of the diaspore at a time t, D isthe diffusion coefficient, t is the time, n is a constant (weassumed the constant is equal to 1), and a is the radius ofthe diaspore. The values of D/ρ2 and M∞ were obtained bya nonlinear fitting, using the Levenberg-Marquardt method[49]. The points used for fitting these parameters correspondto those of the first hours of the experiment, limiting them tothe imbibition period called “Phase I” in the results. In equa-tion (7), the total mass is used instead of the normalized one.This is just to account correctly for the boundary conditionsimposed to use equation (7) as a solution of the Fick differen-tial equation. We highlight that, firstly, the statistical com-parison of biophysical results was based on the bootstrapand the Monte Carlo confidence intervals (see more detailsat the beginning of this subsection). Secondly, here, pro-nounced inflections of the velocity curves were used to dem-onstrate a new germination phase, detected by means of analgorithm that plots linear regressions for each phase(Figure 1). Two criteria were used to detect boundaries ofthe phases: the first was the velocity peak as a boundary ofthe first germination phase (imbibition per se, where Fick’slaw might be used), and the second was the differencesbetween peaks and valleys greater than 1.2 times the averageof the peak valley differences, since they represent abruptchanges in curve oscillations. The linear regression modelfor each physiological phase possesses as notation v̂ = β0 +βt, where β0 and β are parameters with statistical significance(P < 0:05) by hypothesis testing based on confidence inter-vals at 0.05 significance (α = 0:05) (v̂: estimative for velocityfor each germination phase; β0 and β: initial velocity andincrement or decrement of velocity for each phase in relationto time (t), respectively). To indicate the goodness of fit of theregression model, we used the chi-squared test (χ2) at 0.01significance (α = 0:01). The model works with normalizedvalues of the derivatives in the attempt to find the maininflections of the curves of weighted mass versus time. Thenormalization is done by the absolute value of the derivatives.This strategy is used to smooth the natural fluctuationsoccurring in the measured data and avoid considering abruptchanges arising from experimental errors as a new phase. Thefigure layout was adjusted according to the resources of Gnu-plot (http://www.gnuplot.info/). The Fortran script codeused for modeling water dynamics in germinating diaspores(biophysical measurements and germination phase bound-aries) is available as supplementary material. From that, theresearcher can use or modify the code according to theirneeds. Finally, we used mean measurements (mean velocityand mean acceleration) and the initial diffusion coefficientof water dynamics to group our biological models by meansof Minkowski generalizations ofWard’s method in hierarchi-cal clustering [51], one of the most robust and modern
4 Plant Phenomics

methods for clustering. From that, clusters were defined bycutting branches off the dendrogram at 10% of the Min-kowski distance.
3. Results
Wheat caryopses and sunflower cypselas (14% ≤G ≤ 100%;30% ≤V ≤ 100%) had higher differences in physiologicalquality, and common bean seeds had lower differences(28% ≤G ≤ 96%; 58% ≤V ≤ 90%) (Table 1). Regardless ofintra- and interspecific heterogeneity, the weighted mass
pattern remained the same (Figures 2 and 3; supple-mentary material, Figures 1S–6S), proving the robustnessof the measurement to calculate the other biophysicalmeasurements.
In general, the pattern of weighted mass curves seemsto be universal; i.e., it is not a species-specific pattern orassociated with the physiological quality and degree ofgenetic improvement (Figures 2 and 3; supplementarymaterial, Figures 1S–6S). On the other hand, velocity andacceleration curves are peculiar to species and may beinfluenced by the physiological quality and (or) degree of
Water dynamics on germinating diaspores
Weighted diasporemass
Initial diffusioncoefficient –
Fick’s secondlaw
Velocity andaccelerationcalculation
Find Nconsecutivepeaks and valleys
Evaluate
≥
Discard
Germinationphase found
No
Yes 2.22.01.81.61.41.21.0
2.22.01.81.61.41.21.0
2.22.01.81.61.41.21.0
0 5 10 15 20 25 30
0 5 10 15 20 25 30
0 5 10 15 20 25 30
Wei
ghte
d m
ass
Wei
ghte
d m
ass
Wei
ghte
d m
ass
0.2
0.2
0.1
S1
S2
S3
0.1
0.0
–0.1
0.2
0.2
0.1
0.1
0.0
–0.1
0.2
0.2
0.1
0.1
0.0
–0.1
Time (h)
pi
pi
vi
vi
pi
vi
N
Ni
1.2
Figure 1: Flowchart of the algorithm used to define different diaspore-seedling phases.
5Plant Phenomics

genetic improvement (Figures 2 and 3; supplementarymaterial, Figures 1S–6S). This is emphasized in maizecaryopses from the creole type and hybrid type (extremesof the degree of genetic improvement), whose curves onlyhave some differences due to a variety of peculiarities anddifferent physiological qualities (Figure 3; supplementarymaterial, Figures 5S–6S).
As expected, the highest velocity of water influx in dia-spores occurs during the first one or two hours from thefirst contact with water, a period classically associated withimbibition per se (this phase (Phase I) is the fastest;Figures 2 and 3; supplementary material, Figures 5S–6S).In general, Phase I is concluded when a sharp decrease inwater influx velocity occurs. As water enters the system,the velocity is progressively reduced and, as a consequence,acceleration takes negative values (Figures 2 and 3; supple-mentary material, Figures 5S–6S). Negative acceleration inthis initial phase is explained by the decrease in thedriving force of the diffusion effect. However, during thegermination process, velocity and acceleration float. Ingeneral, velocity fluctuates between 0 and 0.05mg H2Oh-1
for the common bean seeds, maize (creole and hybrid)caryopses, and wheat caryopses. The fluctuation of thesunflower cypselas has larger values (Figures 2 and 3;supplementary material, Figures 5S–6S).
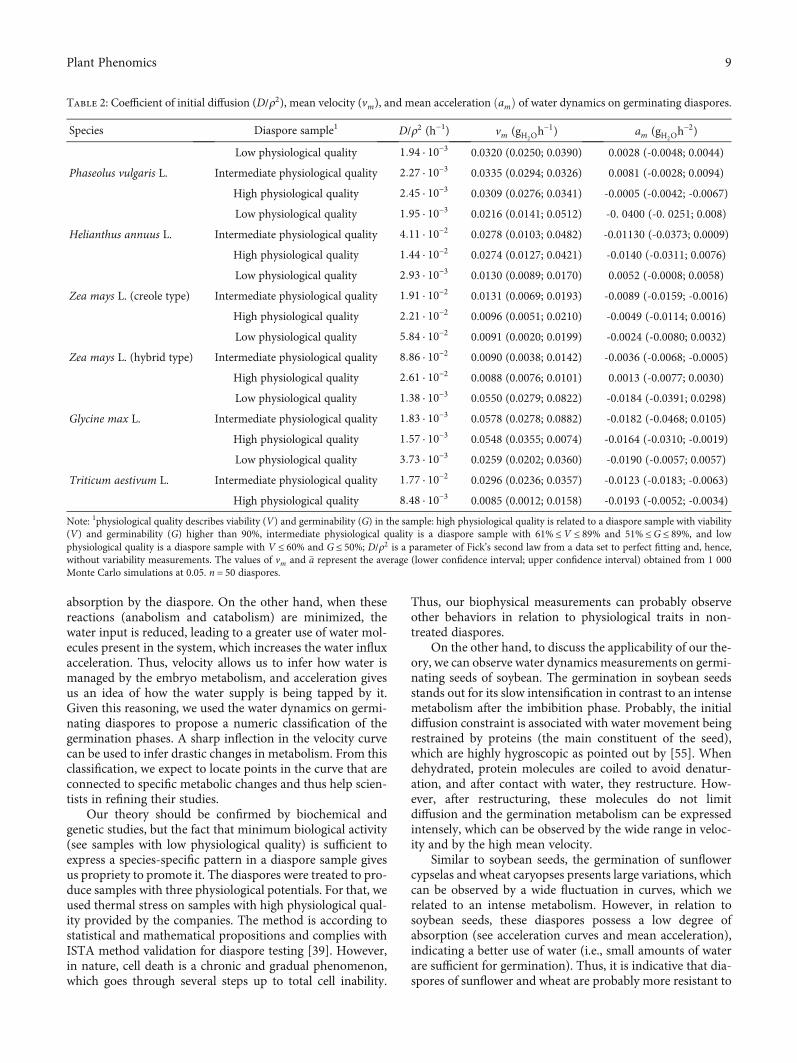
The initial diffusion coefficient is an interesting physicalmeasurement to quantify the first phase, since the typeof reserve material does not seem to be a major factor todetermine this coefficient (see D/ρ2 of maize caryopsesfrom the creole type and hybrid type, Table 2). This was
confirmed in the clustering analysis of measurements,where the initial diffusion coefficient was related tomean veloc-ity (supplementary material, Table 2S, Figure 7S), a typicalmetabolism measurement. Among the diaspores studied,maize caryopses from the hybrid type have lower resistanceto initial diffusion (2:61 · 10−2 h−1 ≤D/ρ2 ≤ 8:86 · 10−2 h−1);i.e., they have a quick diffusion process. On xthe otherhand, soybean seeds possess the highest resistance to initialdiffusion (1:38 · 10−3 h−1 ≤D/ρ2 ≤ 1:83 · 10−3 h−1) (Table 2).This could be related to slow metabolic intensification.
Mean velocity and mean acceleration of water absorp-tion of germinating diaspores can reflect both aspects ofspecies and physiological quality (supplementary material,Tables 3S–4S, Figure 7S). In clustering analysis, sampleswith low-quality diaspores grouped species and cultivarsaccording to their genetic improvement degree (supple-mentary material, Figure 6S). In this case, the commonbean and creole-type maize formed a group with a lowerimprovement degree; sunflower and wheat formed a groupwith an intermediated improvement degree; and soybeanand hybrid-type maize formed two isolated groups with ahigh improvement degree. Apart from that, samples withhigh-quality diaspores grouped species and cultivarsaccording to the botanical sense of monocots and eudicots,where maize (both the hybrid type and the creole type) andwheat formed one group, whereas the soybean and commonbean, with true seeds, formed another and sunflower a third(supplementary material, Figure 7S). These results confirmthe trend of the curves in the algebraic sense. Among thediaspores studied, soybean seeds possess, in general, higher
Table 1: Germinability (G) and viability (V) of the diaspores with different physiological qualities, used in the analyses of water dynamics.
Species Diaspore sample1 G (%)∗ V (%)∗
Phaseolus vulgaris L.
Low physiological quality 28 c 58 c
Intermediate physiological quality 60 b 64 b
High physiological quality 96 a 90 a
Helianthus annuus L.
Low physiological quality 14 c 30 c
Intermediate physiological quality 50 b 53 b
High physiological quality 100 a 100 a
Zea mays L. (creole type)
Low physiological quality 40 c 54 c
Intermediate physiological quality 68 b 70 b
High physiological quality 100 a 100 a
Zea mays L. (hybrid type)
Low physiological quality 40 c 50 c
Intermediate physiological quality 70 b 82 b
High physiological quality 100 a 100 a
Glycine max L.
Low physiological quality 20 c 48 c
Intermediate physiological quality 44 b 62 b
High physiological quality 92 a 92 a
Triticum aestivum L.
Low physiological quality 14 c 32 c
Intermediate physiological quality 42 b 44 b
High physiological quality 100 a 100 a
Note: 1physiological quality describes viability (V) and germinability (G) in the sample: high physiological quality is related to a diaspore sample with viability(V) and germinability (G) higher than 90%, intermediate physiological quality is a diaspore sample with 61% ≤V ≤ 89% and 51% ≤G ≤ 89%, and lowphysiological quality is a diaspore sample with V ≤ 60% and G ≤ 50%; ∗for each species, values followed by the same letter (column) do not differ by theStudent t-test (α = 0:05) for proportions. n = 50 diaspores.
6 Plant Phenomics

values of mean velocity, and maize caryopses from the creoletype or hybrid type have smaller values (Table 2). Thecommon bean seeds have higher mean acceleration ofwater influx, and sunflower cypselas and wheat caryopseshave lower acceleration, demonstrated by negative values(Table 2).
A species-specific pattern for the velocity curve isexpressed even when few diaspores in the sample havegerminability and viability (see confidence intervals forlow-physiological quality samples in Figures 1S–6S).Notwithstanding, it is not possible to propose a generalmodel based on the number of phases of germination sensustricto (Figures 2 and 3). The regression models used toclassify different physiological phases have great fitness tothe data observed in each phase (see the χ2 value inTable 3). β0 ranged from -9.35964 to 2.54529, whereas the
β range was from -0.32109 to 0.36665. What attracts ourattention here is the fact that although these high rangevalues contemplate all biological models, the limits wereinputted by the sunflower cypsela pattern. In any case,germination sensu stricto has from three to six distinctphases associated with sample physiological quality(Figures 2 and 3). The first phase (Phase I) duration is themost stable trait in the curves, mainly when observingsamples with intermediate and high physiological qualities(Figure 2; Table 3). In this case, diaspores of sunflower andwheat have the fastest first germinatiosn phase (1.6 hours),whereas caryopses from hybrid-type maize are slower(2.5 hours). For most species, the last phase is concluded ina sharp peak that occurs with embryo protrusion, demon-strating a completely different metabolic process from thismoment on.
1.01.21.41.61.82.02.22.4
–0.20–0.15–0.10–0.050.00
0.050.100.150.20
–0.20–0.15–0.10–0.050.00
0.050.100.150.20
–0.20–0.15–0.10–0.050.00
0.050.100.150.20
0 5 10 15 20 25 30
0 5 10 15 20 25 30
0 5 10 15Time (h) Time (h) Time (h)
20 25 30
Wei
ghte
d m
ass
S1
I II III IV V
1.01.21.41.61.82.02.22.4
Wei
ghte
d m
ass
S2
I II III IV V
1.21.0
1.41.61.82.02.22.4
Wei
ghte
d m
ass
S3
I II III IV V VI
0 5 10 15 20 10 15 2025
0 5 10 15 20 25
0 5 10 15 20 25
S1 S1
I II III IV V
S2 S2
I II III IV IVV VVI VI
S3 S3
I II III IV V
0 5
0 5
0 5
I II
I II III
IVIII
II III IVI
10 15 20
10 15 20
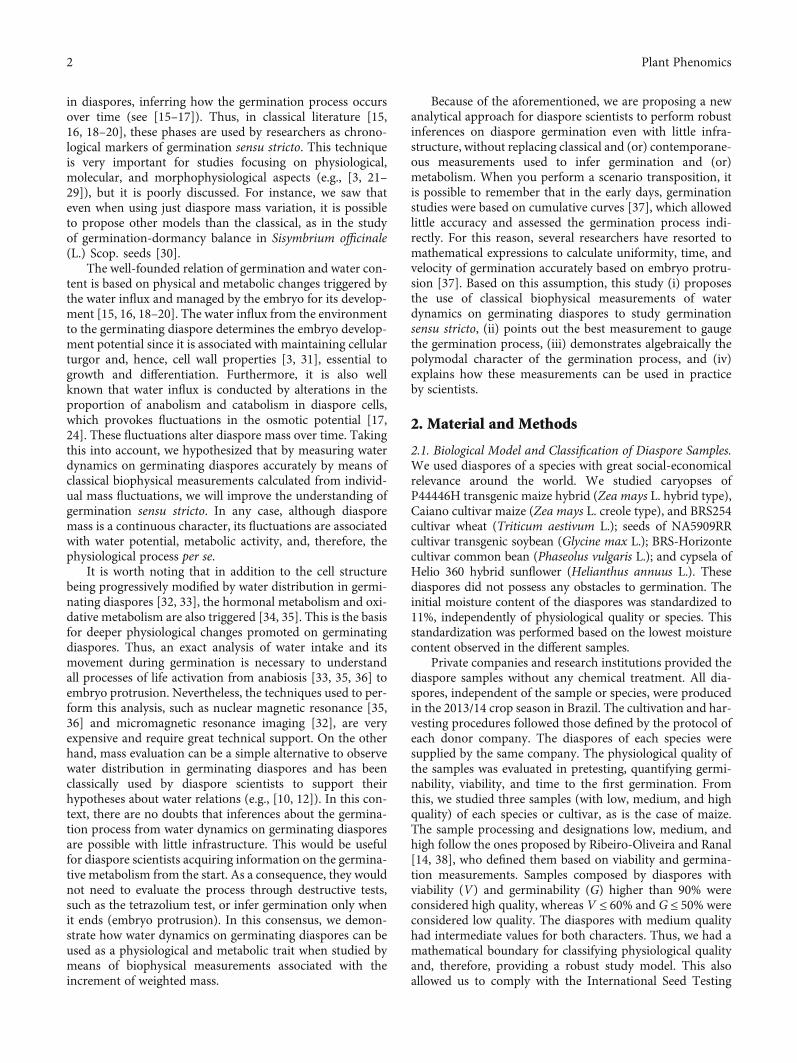
Figure 2: Germination phases (see the vertical black line) determined by the velocity of water dynamics on germinating diaspores of differentphysiological qualities of the common bean (column 1), sunflower (column 2), and soybean (column 3). S1: sample of low physiologicalquality; S2: sample of medium physiological quality; S3: sample of high physiological quality. Physiological quality describes viability (V)and germinability (G) in the sample: high physiological quality is related to a diaspore sample with viability (V) and germinability (G)higher than 90%, intermediate physiological quality is a diaspore sample with 61% ≤ V ≤ 89% and 51% ≤G ≤ 89%, and low physiologicalquality is a diaspore sample with V ≤ 60% and G ≤ 50%; curves of weighted mass are represented by yellow lines (see the main axis), whilecurves of velocity are represented by blue lines (see the secondary axis). Red linear lines represent linear regression (v̂ = β0 + βt, where β0and β are parameters with statistical significance (P < 0:05) by hypothesis testing based on confidence intervals at 0.05 significance(α = 0:05)) (v̂: estimative for velocity for each germination phase; β0 and β: initial velocity and increment or decrement of velocity foreach phase in relation to time (t) that marks each phase). The solid line shows the mean value; the colored area delimits the lower andupper confidence intervals from 1 000 Monte Carlo simulations at 0.05. The embryo protrusion in at least one diaspore occurred twohours before the last recording. n = 50 diaspores.
7Plant Phenomics

4. Discussion
Diaspore germination and postgermination are two of themost interesting biological models for studies on plant devel-opment patterns, such as those related to plant stress [52].Therefore, improvements to the tools for experimental anal-ysis of water dynamics on germinating diaspores must beencouraged [1]. Taking this into account, our findings sup-port the idea that the view of germination sensu stricto andpostgermination as a biological process with three standard-ized phases is too generic. One similar consideration wasmade by [30], who split the second phase of germination.However, this approach was only empirical. Thus, we pro-pose a new approach using modeling from classical biophys-ical measurements to promote robust physiological insights,which can prove to be a paradigm shift that can help plantphysiologists concerned with plant growth and development.
When using the initial diffusion coefficient, you can esti-mate how fast the diffusion process of early diaspore germi-
nation of different species is, which can be done in acomparative and quantitative way. Therefore, from labora-tory assessments, you can have an idea about the capacityof species and/or varieties in sensing environmental clues tomake decisions regarding early plant development, as wellas how much resilience might be expected from diasporesof a species or variety in hydric scarcity. In addition, by usingvelocity and acceleration (mean and curves), you have ametabolism framework in optimum conditions and, fromthat, an idea of the ability of the diaspore to control itsmetabolism. We are considering metabolism inferencesbased on well-established knowledge of pharmacology,which describes metabolic activity in relation to velocityand acceleration calculations. In a practical view, we knowthat velocity is associated with the transfer of energy andacceleration with the degree of absorption of this energy[53, 54]. In this context, intense metabolism is related to ana-bolic and catabolic reactions leading to a reduction in theosmotic potential, acting as a driving force for faster water
1.01.21.41.61.82.02.22.4
0 2 4 6 8 10 12
Wei
ghte
d m
ass
S1
I II III IV
1.01.21.41.61.82.02.22.4
Wei
ghte
d m
ass
S2
I II III
1.01.21.41.61.82.02.22.4
Wei
ghte
d m
ass
Time (h)
S3
I II III
0 5 10 15 20 25
S1
I II III IV V
S2
I II III
Time (h)
S3
I II III IV V VI
0 5 10 15 20 25 30 35
0 2 4 6 8 10 12 0 5 10 15 20 25 0 5 10 15 20 25 30 35
0 2 4 6 8 10 12 0 5 10 15 20 25 0 5 10 15 20 25 30 35
−0.20−0.15−0.10−0.05 0.00 0.05 0.10 0.15 0.20
S1
I II III IV V
−0.20−0.15−0.10−0.05 0.00 0.05 0.10 0.15 0.20
S2
I II III IV V VI
−0.20−0.15−0.10−0.05 0.00 0.05 0.10 0.15 0.20
Time (h)
S3
I II III IV
Figure 3: Germination phases (see the vertical black line) determined by the velocity of water dynamics on germinating diaspores of differentphysiological qualities of wheat (column 1) and maize with low genetic improvement degree (creole type; column 2) and with high geneticimprovement degree (hybrid type; column 3). S1: sample of low physiological quality; S2: sample of medium physiological quality; S3:sample of high physiological quality. Physiological quality describes viability (V) and germinability (G) in the sample: high physiologicalquality is related to a diaspore sample with viability (V) and germinability (G) higher than 90%, intermediate physiological quality is adiaspore sample with 61% ≤ V ≤ 89% and 51% ≤G ≤ 89%, and low physiological quality is a diaspore sample with V ≤ 60% and G ≤ 50%;curves of weighted mass are represented by yellow lines (see the main axis), while curves of velocity are represented by blue lines (see thesecondary axis). Red linear lines represent linear regression (v̂ = β0 + βt, where β0 and β are parameters with statistical significance(P < 0:05) by hypothesis testing based on confidence intervals at 0.05 significance (α = 0:05)) (v̂: estimative for velocity for eachgermination phase; β0 and β: initial velocity and increment or decrement of velocity for each phase in relation to time (t) that marks eachphase). The solid line shows the mean value; the colored area delimits the lower and upper confidence intervals from 1 000 Monte Carlosimulations at 0.05. The embryo protrusion in at least one diaspore occurred two hours before the last recording. n = 50 diaspores.
8 Plant Phenomics
absorption by the diaspore. On the other hand, when thesereactions (anabolism and catabolism) are minimized, thewater input is reduced, leading to a greater use of water mol-ecules present in the system, which increases the water influxacceleration. Thus, velocity allows us to infer how water ismanaged by the embryo metabolism, and acceleration givesus an idea of how the water supply is being tapped by it.Given this reasoning, we used the water dynamics on germi-nating diaspores to propose a numeric classification of thegermination phases. A sharp inflection in the velocity curvecan be used to infer drastic changes in metabolism. From thisclassification, we expect to locate points in the curve that areconnected to specific metabolic changes and thus help scien-tists in refining their studies.
Our theory should be confirmed by biochemical andgenetic studies, but the fact that minimum biological activity(see samples with low physiological quality) is sufficient toexpress a species-specific pattern in a diaspore sample givesus propriety to promote it. The diaspores were treated to pro-duce samples with three physiological potentials. For that, weused thermal stress on samples with high physiological qual-ity provided by the companies. The method is according tostatistical and mathematical propositions and complies withISTA method validation for diaspore testing [39]. However,in nature, cell death is a chronic and gradual phenomenon,which goes through several steps up to total cell inability.
Thus, our biophysical measurements can probably observeother behaviors in relation to physiological traits in non-treated diaspores.
On the other hand, to discuss the applicability of our the-ory, we can observe water dynamics measurements on germi-nating seeds of soybean. The germination in soybean seedsstands out for its slow intensification in contrast to an intensemetabolism after the imbibition phase. Probably, the initialdiffusion constraint is associated with water movement beingrestrained by proteins (the main constituent of the seed),which are highly hygroscopic as pointed out by [55]. Whendehydrated, protein molecules are coiled to avoid denatur-ation, and after contact with water, they restructure. How-ever, after restructuring, these molecules do not limitdiffusion and the germination metabolism can be expressedintensely, which can be observed by the wide range in veloc-ity and by the high mean velocity.
Similar to soybean seeds, the germination of sunflowercypselas and wheat caryopses presents large variations, whichcan be observed by a wide fluctuation in curves, which werelated to an intense metabolism. However, in relation tosoybean seeds, these diaspores possess a low degree ofabsorption (see acceleration curves and mean acceleration),indicating a better use of water (i.e., small amounts of waterare sufficient for germination). Thus, it is indicative that dia-spores of sunflower and wheat are probably more resistant to
Table 2: Coefficient of initial diffusion (D/ρ2), mean velocity (vm), and mean acceleration ðamÞ of water dynamics on germinating diaspores.
Species Diaspore sample1 D/ρ2 (h−1) vm (gH2Oh−1) am (gH2Oh
−2)
Phaseolus vulgaris L.
Low physiological quality 1:94 · 10−3 0.0320 (0.0250; 0.0390) 0.0028 (-0.0048; 0.0044)
Intermediate physiological quality 2:27 · 10−3 0.0335 (0.0294; 0.0326) 0.0081 (-0.0028; 0.0094)
High physiological quality 2:45 · 10−3 0.0309 (0.0276; 0.0341) -0.0005 (-0.0042; -0.0067)
Helianthus annuus L.
Low physiological quality 1:95 · 10−3 0.0216 (0.0141; 0.0512) -0. 0400 (-0. 0251; 0.008)
Intermediate physiological quality 4:11 · 10−2 0.0278 (0.0103; 0.0482) -0.01130 (-0.0373; 0.0009)
High physiological quality 1:44 · 10−2 0.0274 (0.0127; 0.0421) -0.0140 (-0.0311; 0.0076)
Zea mays L. (creole type)
Low physiological quality 2:93 · 10−3 0.0130 (0.0089; 0.0170) 0.0052 (-0.0008; 0.0058)
Intermediate physiological quality 1:91 · 10−2 0.0131 (0.0069; 0.0193) -0.0089 (-0.0159; -0.0016)
High physiological quality 2:21 · 10−2 0.0096 (0.0051; 0.0210) -0.0049 (-0.0114; 0.0016)
Zea mays L. (hybrid type)
Low physiological quality 5:84 · 10−2 0.0091 (0.0020; 0.0199) -0.0024 (-0.0080; 0.0032)
Intermediate physiological quality 8:86 · 10−2 0.0090 (0.0038; 0.0142) -0.0036 (-0.0068; -0.0005)
High physiological quality 2:61 · 10−2 0.0088 (0.0076; 0.0101) 0.0013 (-0.0077; 0.0030)
Glycine max L.
Low physiological quality 1:38 · 10−3 0.0550 (0.0279; 0.0822) -0.0184 (-0.0391; 0.0298)
Intermediate physiological quality 1:83 · 10−3 0.0578 (0.0278; 0.0882) -0.0182 (-0.0468; 0.0105)
High physiological quality 1:57 · 10−3 0.0548 (0.0355; 0.0074) -0.0164 (-0.0310; -0.0019)
Triticum aestivum L.
Low physiological quality 3:73 · 10−3 0.0259 (0.0202; 0.0360) -0.0190 (-0.0057; 0.0057)
Intermediate physiological quality 1:77 · 10−2 0.0296 (0.0236; 0.0357) -0.0123 (-0.0183; -0.0063)
High physiological quality 8:48 · 10−3 0.0085 (0.0012; 0.0158) -0.0193 (-0.0052; -0.0034)
Note: 1physiological quality describes viability (V) and germinability (G) in the sample: high physiological quality is related to a diaspore sample with viability(V) and germinability (G) higher than 90%, intermediate physiological quality is a diaspore sample with 61% ≤V ≤ 89% and 51% ≤G ≤ 89%, and lowphysiological quality is a diaspore sample with V ≤ 60% and G ≤ 50%; D/ρ2 is a parameter of Fick’s second law from a data set to perfect fitting and, hence,without variability measurements. The values of vm and �a represent the average (lower confidence interval; upper confidence interval) obtained from 1 000Monte Carlo simulations at 0.05. n = 50 diaspores.
9Plant Phenomics

Table 3: Velocity models in germination phases of diaspore samples with different physiological qualities.
Species Diaspore sample1 Model2,3Diaspore germination phases4
I II III IV V VI
Phaseolus vulgaris L.
Low physiological quality
β0 0.13634 0.1145 0.03871 0.06153 -0.02462 —
β 0.0745 0.01391 0.00077 0.00193 0.00122 —
Chi-square4 0.0008 0.0139 0.0036 0.0029 0.0002 —
Intermediate physiological quality
β0 0.17814 0.07729 0.06946 0.08119 -0.07285 —
β 0.08859 0.00449 0.00296 0.00262 0.00297 —
Chi-square4 0.0012 0.0182 0.0033 0.0048 0.0001 —
High physiological quality
β0 0.16433 0.05636 0.11524 0.04371 0.0233 -0.05316
β 0.08863 0.0016 0.00723 0.00114 0.00023 0.00225
Chi-square4 0.0006 0.0006 0.0012 0.0007 0.0019 0.0001
Helianthus annuus L.
Low physiological quality
β0 0.15334 0.05068 0.17678 0.68799 0.30398 —
β -0.02813 -0.00446 -0.01088 -0.03667 -0.01173 —
Chi-square4 0.0036 0.0070 0.0106 0.0033 0.0519 —
Intermediate physiological quality
β0 0.21076 0.27709 0.10099 0.07791 -0.0604 0.02861
β -0.08535 -0.07786 -0.01614 -0.00692 0.00706 -0.00062
Chi-square4 0.0009 0.0005 0.0024 0.0044 0.0199 0.0545
High physiological quality
β0 0.46502 0.03492 -0.07394 2.54529 -9.35964 —
β -0.32109 -0.00112 0.00521 -0.10833 0.36665 —
Chi-square4 0.0123 0.029 0.0195 0.0117 0.0008 —
Glycine max (L.) Merr.
Low physiological quality
β0 0.30418 0.14099 -0.07804 0.63270 — —
β -0.11837 -0.01164 -0.00329 -0.02940 — —
Chi-square4 0.0043 0.0096 0.0555 0.0081 — —
Intermediate physiological quality
β0 0.20924 0.10542 0.15552 0.13122 0.01778 0.21099
β -0.06673 -0.0067 -0.01108 -0.00725 0.001 -0.01024
Chi-square4 0.0036 0.004 0.0022 0.0028 0.004 0.0002
High physiological quality
β0 0.34092 0.13254 -0.23459 -0.01565 — —
β -0.18993 -0.00915 0.01814 0.00131 — —
Chi-square4 0.0040 0.0275 0.0631 0.0007 — —
Triticum aestivum L.
Low physiological quality
β0 0.09713 0.04222 0.03629 -1.1405 — —
β -0.03737 -0.00341 -0.00204 0.09322 — —
Chi-square4 0.0004 0.0154 0.0111 0.0004 — —
Intermediate physiological quality
β0 0.21021 0.02604 -0.06925 — — —
β -0.14305 -0.00013 0.00772 — — —
Chi-square4 0.0036 0.0097 0.0104 — — —
High physiological quality
β0 0.18523 0.07666 -2.33769 — — —
β -0.11731 -0.00968 0.17603 — — —
Chi-square4 0.0035 0.1802 0.0005 — — —
10 Plant Phenomics

water stress than soybean seeds. By the way, wheat caryopsesexpose a need for more studies based on time intervalsrecorded for each species. Even though different physiologi-cal phases were detected for these caryopses, they have fewerphases than other species and Phase I was very similar amongthe different physiological qualities. This occurred becausewe probably lost information related to critical momentsfor the physiological processes. When recording diasporemass, it was necessary to standardize the method and, there-fore, these results give us an opportunity for proposing thatthe analysis time intervals must be defined according to timeto the first embryo protrusion, which is a conservative aspectof the species [37]. In this view, a shorter time for the firstprotrusion is an indication that a shorter recording intervalmust be used. For agricultural species, such as wheat, thistime reduction is possible because only 7 diaspores are suffi-cient to make inferences about the water dynamics on ger-minating diaspores [14]. For other species, it will benecessary to define protocols that are adjustable to theirpeculiarities.
We also demonstrated the existence of more than threegermination phases, detected algebraically by changes invelocity and acceleration of water absorption. The changesin metabolism (velocity and acceleration) were defined usingelementary differential calculus techniques, which allow us to
study the behavior of functions with the help of derivatives[49, 56]. These techniques allow establishing maximum andminimum points, as well as inflection points [49, 56]. Thus,the germination process can be more complex in the bio-physical sense than has been previously described (see[31]and their references). In this sense, our main contributionis determining a boundary numerically for each phaseregarding germination sensu stricto. In addition, we alsodetermine whether each phase is leaning to increments ordecrements in metabolism. This was done by means of linearparameters (β0 and β). The parameters β0 and β representthe initial velocity and the mean variation of velocity in rela-tion to the time of each phase, respectively. Thus, theseparameters give us clues about how metabolism occurs ineach physiological step of germination sensu stricto. Thisis proved by analyzing oleaginous and starchy diaspores.Oleaginous diaspores possess more negative parameters ingeneral (high energy expenditure during catabolism ofreserves), whereas starchy diaspores possess parameters nearzero (low energy variation during catabolism of reserves).Apart from that, even though the β parameter in the firstphase is high and negative for starchy diaspores, its fluctua-tion values are lower than for oleaginous diaspores. In anycase, we are opening precedents for studies focusing on therelation between velocity parameters and metabolism.
Table 3: Continued.
Species Diaspore sample1 Model2,3Diaspore germination phases4
I II III IV V VI
Zea mays L. (creole type)
Low physiological quality
β0 0.13831 0.06939 0.02139 0.03967 -0.00485 —
β -0.11627 -0.01285 -0.00111 -0.00175 0.00048 —
Chi-square4 0.0008 0.0027 0.0018 0.0009 0.0005 —
Intermediate physiological quality
β0 0.12466 0.0225 0.0219 — — —
β -0.06137 -0.00137 -0.00082 — — —
Chi-square4 0.0011 0.0018 0.0142 — — —
High physiological quality
β0 0.11252 0.11184 0.07529 0.00825 0.10183 -0.01969
β -0.04366 -0.02683 -0.00972 -0.00003 -0.00522 0.00113
Chi-square4 0.0005 0.0004 0.0033 0.003 0.0011 0.0006
Zea mays L. (hybrid type)
Low physiological quality
β0 0.12472 0.0307 0.05606 0.08576 0.02919 —
β -0.04612 -0.00345 -0.00485 -0.00461 -0.00081 —
Chi-square4 0.0044 0.0015 0.0022 0.0026 0.0047 —
Intermediate physiological quality
β0 0.11714 0.01001 -0.02467 -0.01629 0.42651 -0.00371
β -0.05818 0.00047 0.00261 0.00113 -0.01628 0.00016
Chi-square4 0.0012 0.0016 0.003 0.0018 0.0011 0.0006
High physiological quality
β0 0.11763 0.12961 0.04905 0.01612 — —
β -0.07313 -0.02234 -0.00419 -0.00041 — —
Chi-square4 0.0022 0.0056 0.0015 0.0046 — —
Note: 1physiological quality describes viability (V) and germinability (G) in the sample: high physiological quality is related to a diaspore sample with viability(V) and germinability (G) higher than 90%, intermediate physiological quality is a diaspore sample with 61% ≤V ≤ 89% and 51% ≤G ≤ 89%, and lowphysiological quality is a diaspore sample with V ≤ 60% and G ≤ 50%; 2v̂ = β0 + βt, where β0 and β are parameters with statistical significance (P < 0:05) byhypothesis testing based on confidence intervals at 0.05 significance (α = 0:05) (v̂: estimative for velocity for each germination phase; β0 and β: initialvelocity and increment or decrement of velocity for each phase in relation to time (t)); 3chi-squared value (χ2) was lower than the theoretical value at 0.01probability (P < 0:01) indicating that model regression has a goodness of fit at 0.01 significance (α = 0:01) to describe each germination phase; 4germinationphases were determined from an algorithm, which detects great inflections from velocity and acceleration curves. n = 50 diaspores.
11Plant Phenomics

We highlight two other important considerations. (i)Diaspore scientists well know that two-phase germination(three-phase germination by incorrectly considering postger-mination as part of the process) (e.g., [17]) is the mostobserved pattern, but it is not a universal pattern. An adden-dum is that here immediate postgermination data (2 hoursafter embryo protrusion) were spurious but necessary. Thesedata were modeled together with the last records of germina-tion sensu stricto, in the last phase, in order to contemplate alltypes of germination processes (including two-step germina-tion). This strategy proved to be coherent taking into accountthat a sharp negative value in the velocity curve is congruentwith the new cycle of the plant life, which, in general, leads tonegative β values. For molecular biologists, which have beenusing two-step germination in their studies, the recommen-dation is to use β as a numerical determination of the begin-ning of the last germination phase and β0 as a numericalmarker to find the optimum moment for their fine analysis.Independently, we used diaspores that have been mentionedas a case of two-phase germination (e.g., [10, 57, 58]) to studyour hypotheses. Our surprise was that when using the mea-surements here proposed, two-phase germination was notverified. This occurred because classical Phase I and PhaseII were split. In our view, Phase I is a strictly physical phaseand, therefore, it must be exclusively studied by Fick’s law,which might only be related to diffusion per se. Our observa-tion is based on the physical common sense that diffusion is aphenomenon negatively associated with water absorptionvelocity and positively associated with water absorptionacceleration. Taking this into account, the second phase(Phase II) is a predominantly biophysical phase, since itdescribes the velocity related to metabolism intensification(normally called metabolism resumption and related tocell activity intensification and early synthesis de novo oforganelles, enzymes, and genes; see [17]). After this phase,the metabolism is associated with anabolism and catabo-lism of the reserves and the water dynamics on germinat-ing diaspores is maintained by inflections in energy input.Therefore, these subsequent phases are predominantly bio-chemical. (ii) Velocity of water dynamics on germinating dia-spores has been associated with reserve tissue and (or)diaspore size [11, 13, 17, 18, 20]. However, we proposed tostudy the germination process by means of classical biophys-ical measurements obtained from weighted mass, whichproved to have no relation to species, physiological quality,or degree of genetic improvement. Consequently, the bio-physical measurements here proposed suffer no (or mini-mum) interference from reserve tissue and (or) diasporesize. We recommend that the morphoanatomical charactersbe analyzed in future researches using the classical biophysi-cal measurements of diaspore germination. For that, we aremaking available our modeling for water dynamics in germi-nating diaspores. We highlight that, from a physiologicalpoint of view, this is very useful because diaspore germina-tion is influenced by genetic and edaphic environmentaltraits, mainly those related to mother plants during diasporedevelopment [17]. Therefore, our modeling should be used asa previous step for analysis of diaspore properties (e.g., phys-iology, anatomy and/or morphology, and molecular biology).
It is important to note that our algorithm is not based onimage data, but in a near future, it can be useful for this typeof analysis. Thus, we are modeling raw data from theobserved one (also called “real data”) and, hence, our esti-mates are related to physiological phenomena per se, notfrom machine learning or other similar methods used toexplore expected data (i.e., “synthetic data”) from a computa-tional model. Therefore, we are not using ground truth datato measure algorithm performance from a ground truth cor-respondence measure (GCM; [59]) for example. We areusing robust statistical tools for a sample having an approx-imated or unknown data distribution, such as defined byclassical authors [44, 45, 60]. To perform a previous treat-ment, we used a weighted measurement of mass and weused bootstrap to reduce numerical anomalies in our dataset. We calculated confidence intervals for comparisons,and to certify our regression fitting, we used the chi-squared test, which has lower values, such as pointed outin Table 1. Based on this statistical sense, we performedour inferences. In addition to this data treatment, we usedthe cubic spline since it is the simplest way to transforma set of records into a numerical function. The use of thespline takes into account two factors: (a) it is extremelysimple to treat these types of functions numerically; (b)no ad hoc assumption or previous information is requiredfor data interpolation; the splines will only follow the data.These factors are appropriate to our objective of identifyingthe different phases. Also, this approach avoids Runge’sphenomenon in a numerical interpolation [61]. Finally,the splines were treated in the model by a filter that elimi-nated all the small oscillations, and only the significantchanges were kept for the determination of phase transitions.All this was performed automatically, without human inter-ference. The algorithm was capable of correctly identifyinga new germination phase by not taking into account smalloscillations observed regarding natural fluctuations fromthe analysis process in the biological system (the standarddeviation of the mean values). Thus, there was no misinter-pretation of the data, overfitting, or Runge’s phenomenonproblems present in this model. Any alternative numericalsolution, besides the splines, would require some theorydescribing the water influx into the biological material toinfer possible functions as a solution to interpolation. Thisis not our focus in this manuscript. Our goal is to offer asimple way to study the water dynamics and provide pos-sibilities to improve physiological statements from seed-seedling transition processes. Possible theories come afterthis work.
Imbibition is the first and shortest germination phase. Asimbibition is a physical process [50, 62–64], Fick’s second law(diffusion equation) may describe it, and we demonstratedthis by fitting the diffusion behavior to the initial time ofthe germination process. In physics, the coefficient of diffu-sion, or diffusivity of mass, is a value that represents the easeof solute movement in a solvent [50, 64]. Our results showthis coefficient as a character attributed to the physiologicalquality, species, and variety. In addition, we also showed thatthe initial diffusion coefficient is not influenced by reserve tis-sue, which was evident when analyzing creole-type and
12 Plant Phenomics

hybrid-type maize (same type of dispersal unit, same phylog-eny, and same reserve material but a different coefficient ofinitial diffusion). It is important to report that other authorsused Fick’s law to explore biophysics in germination (fromimbibition to embryo protrusion), such as [11–13]. In thesecases, a visual analysis of data observed in relation to themodel allows us to consider that Fick’s second law in facthas a great fitting of data only in the imbibition phase, aspointed out here. In addition, there are several reports in foodengineering demonstrating that Fick’s second law is appliedonly to imbibition (e.g., [65–68]), not to predominantly bio-chemical processes.
The first point presented here is that the initial diffusioncoefficient, which is a physical measurement of the diffusionprocess (imbibition per se) of diaspore germination, velocity,and acceleration in water dynamics on germinating diasporesreflect a species pattern. The second point is that the numberof germination phases might be determined by the degree ofgenetic improvement, and the duration of each one might bedetermined by the physiological quality. The third point thatstands out for us is that germination, expressed by means ofwater dynamics on germinating diaspores, does not have aunique mathematical model for all species. Thus, generaliza-tions must be avoided. The fourth and last consideration isthat velocity (transfer of energy) is theoretically the mostinteresting measurement to study diaspore germination bymeans of water dynamics, because it offers great potentialfor inferences about metabolism, which includes its regres-sion coefficients for each germination phase. Acceleration(degree of absorption of energy) also infers metabolism, butin biological science, there are more examples of velocitymeasuring metabolism than acceleration. Thus, there isgreater understanding and use of velocity than acceleration.Further studies on acceleration can clarify if it offers moreadvantages for understanding the germination process. Inthe end, we create a new way of determining the germinationphases, characterizing not three but more phases, taking thespecies into consideration.
Data Availability
The data is freely available upon request.
Conflicts of Interest
The authors declare that there is no conflict of interestregarding the publication of this article.
Authors’ Contributions
JPR-O designed and performed the experiments, analyzedthe data, and wrote the paper. MAR assisted in all aspectsof the study providing advice on how to analyze the dataand to perform the experiments. MAB assisted in providingadvice on how to analyze the biophysical data. All authorsrevised the final version of the manuscript.
Acknowledgments
We are grateful to the Coordenação de Aperfeiçoamento dePessoal de Nível Superior (CAPES) for financial supportand the scholarship of the first author; to the Programa dePós-Graduacão em Agronomia (UFU) for the support cur-rently given to the first author as a Postdoctoral Researcher(PNPD–Postdoctoral fellowship CAPES); to the EmpresaBrasileira de Pesquisa Agropecuária (EMBRAPA), DuPontPioneer®, and Qualiteste Análises Agronômicas for provid-ing the diaspore samples; and to Mr. Roger Hutchings forthe English review of the manuscript. This work was sup-ported by the Coordenação de Aperfeiçoamento de Pessoalde Nível Superior (Financial code: 001) and by the Fundaçãode Amparo à Pesquisa do Estado de Minas Gerais(FAPEMIG).
Supplementary Materials
Fortran script code. Table 1S: dimensions (mean ± standarderror) of the studied diaspores (n = 50). These diaspores wereused as a basis for composing the samples with differentphysiological qualities. Table 2S: proximity matrix for gener-alizations of Ward’s linkage (agglomeration schedule) inhierarchical clustering of water dynamics measurements ongerminating diaspores of different species and/or lineages.Table 3S: the Minkowski distance for generalizations ofWard’s linkage (agglomeration schedule) in hierarchicalclustering of species and/or lineages from water dynamicsmeasurements of germinating diaspores with low physio-logical quality. Table 4S: the Minkowski distance for gen-eralizations of Ward’s linkage (agglomeration schedule) inhierarchical clustering of species and/or lineages from waterdynamics measurements of germinating diaspores with highphysiological quality. Figure 1S: inferences from the nonsi-mulated and simulated (the solid line shows the mean value,the colored area delimits the lower and upper confidenceintervals from 1 000 Monte Carlo simulations at 0.05) datasets of weighted mass, velocity, and acceleration curves ofwater dynamics on germinating seeds with different physio-logical qualities that belong to the common bean. Figure 2S:inferences from the nonsimulated and simulated (the solidline shows the mean value, the colored area delimits thelower and upper confidence intervals from 1 000 MonteCarlo simulations at 0.05) data sets of weighted mass, veloc-ity, and acceleration curves of water dynamics on germinat-ing cypselas with different physiological qualities thatbelong to sunflower. Figure 3S: inferences from the nonsimu-lated and simulated (the solid line shows the mean value, thecolored area delimits the lower and upper confidence inter-vals from 1 000 Monte Carlo simulations at 0.05) data setsof weighted mass, velocity, and acceleration curves of waterdynamics on germinating seeds with different physiologicalqualities that belong to soybean. Figure 4S: inferences fromthe nonsimulated and simulated (the solid line shows themean value, the colored area delimits the lower and upperconfidence intervals from 1 000 Monte Carlo simulations at0.05) data sets of weighted mass, velocity, and accelerationcurves of water dynamics on germinating caryopses with
13Plant Phenomics
different physiological qualities that belong to wheat. Figure5S: inferences from the nonsimulated and simulated (thesolid line shows the mean value, the colored area delimitsthe lower and upper confidence intervals from 1 000 MonteCarlo simulations at 0.05) data sets of weighted mass, veloc-ity, and acceleration curves of water dynamics on germinat-ing caryopses with different physiological qualities thatbelong to maize caryopses of low genetic improvementdegree (creole type). Figure 6S: inferences from the nonsimu-lated and simulated (the solid line shows the mean value, thecolored area delimits the lower and upper confidence inter-vals from 1 000 Monte Carlo simulations at 0.05) data setsof weighted mass, velocity, and acceleration curves of waterdynamics on germinating caryopses with different physiolog-ical qualities that belong to maize caryopses of high geneticimprovement degree (hybrid type). Figure 7S: dendrogramusing Ward’s linkage from water dynamics measurementson germinating diaspores of or with (A) different speciesand/or lineages, (B) low physiological quality, and (C) highphysiological quality. (Supplementary Materials)
References
[1] S. Penfield, “Revealing the water uptake pathways of seeds withhigh resolution magnetic resonance imaging,” New Phytolo-gist, vol. 216, no. 4, pp. 965-966, 2017.
[2] D. Cosgrove, “Biophysical control of plant cell growth,”Annual Review of Plant Physiology, vol. 37, pp. 377–405, 1986.
[3] K. J. Bradford, “A water relations analysis of seed germinationrates,” Plant Physiology, vol. 94, no. 2, pp. 840–849, 1990.
[4] J. A. Lockhart, “An analysis of irreversible plant cell elonga-tion,” Journal of Theoretical Biology, vol. 8, no. 2, pp. 264–275, 1965.
[5] R. J. Gummerson, “The effect of constant temperatures andosmotic potentials on the germination of sugar beet,” Journalof Experimental Botany, vol. 37, no. 6, pp. 729–741, 1986.
[6] K. J. Bradford, Seed Development and Germination, Routledge,1995, https://www.taylorfrancis.com/books/9781351417327.
[7] W. E. Finch-Savage, H. R. Rowse, and K. C. Dent, “Develop-ment of combined imbibition and hydrothermal thresholdmodels to simulate maize (Zea mays) and chickpea (Cicer arie-tinum) seed germination in variable environments,” The NewPhytologist, vol. 165, no. 3, pp. 825–838, 2005.
[8] V. Alvarado and K. J. Bradford, “A hydrothermal timemodel explains the cardinal temperatures for seed germina-tion,” Plant, Cell & Environment, vol. 25, no. 8, pp. 1061–1069, 2002.
[9] A. C. Leopold, “Volumetric components of seed imbibition,”Plant Physiology, vol. 73, no. 3, pp. 677–680, 1983.
[10] M. B. McDonald, C. W. Vertucci, and E. E. Roos, “Soybeanseed imbibition: water absorption by seed parts,” Crop Science,vol. 28, no. 6, pp. 993–997, 1988.
[11] C. W. Vertucci, “Seed Moisture,” in CSSA Special PublicationNo. 14., P. C. Stanwood and M. B. McDonald, Eds., pp. 93–115, Crop Science Society of America Inc., Madison, 1 edition,1989, https://dl.sciencesocieties.org/publications/books/abstracts/cssaspecialpubl/seedmoisture/93.
[12] C. W. Vertucci and A. C. Leopold, “Dynamics of imbibition bysoybean embryos,” Plant Physiology, vol. 72, no. 1, pp. 190–193, 1983.
[13] C. J. Meyer, E. Steudle, and C. A. Peterson, “Patterns andkinetics of water uptake by soybean seeds,” Journal of Experi-mental Botany, vol. 58, no. 3, pp. 717–732, 2006.
[14] J. P. Ribeiro-Oliveira and M. A. Ranal, “Sample size and waterdynamics on germinating diaspores: the first step for physio-logical and molecular studies on the germination process,”Plant Biosyst., vol. 152, no. 4, pp. 840–847, 2018.
[15] H. Nonogaki, G. W. Bassel, and J. D. Bewley, “Germination—-still a mystery,” Plant Science, vol. 179, no. 6, pp. 574–581,2010.
[16] L. Rajjou, M. Duval, K. Gallardo et al., “Seed germination andvigor,” Annual Review of Plant Biology, vol. 63, no. 1, pp. 507–533, 2012.
[17] J. D. Bewley, K. J. Bradford, H. W. M. Hilhorst, andH. Nonogaki, Seeds, Springer, New York, NY, 2013.
[18] J. D. Bewley and M. Black, Physiology and Biochemistry ofSeeds in Relation to Germination, Springer, Berlin, Heidelberg,1978.
[19] J. D. Bewley and M. Black, Physiology and Biochemistry ofSeeds in Relation to Germination: Viability, Dormancy, andEnvironmental Control, Springer, Berlin, Heidelberg, 1982.
[20] J. D. Bewley and M. Black, Seeds: Physiology of Developmentand Germination, Springer US, Boston, MA, 1994.
[21] W. M. Blacklow, “Influence of temperature on germinationand elongation of the radicle and shoot of corn (Zea maysL.),” Crop Science, vol. 12, pp. 647–650, 1972.
[22] A. S. De Paula, C. M. L. Delgado, M. T. S. Paulilo, andM. Santos, “Breaking physical dormancy ofCassia leptophyl-laandSenna macranthera(Fabaceae: Caesalpinioideae) seeds:water absorption and alternating temperatures,” Seed ScienceResearch, vol. 22, no. 4, pp. 259–267, 2012.
[23] G. H. Egley and R. N. Paul Jr., “Morphological observations onthe early imbibition of water by Sida spinosa (Malvaceae)seed,” American Journal of Botany, vol. 68, no. 8, pp. 1056–1065, 1981.
[24] M. J. Holdsworth, W. E. Finch-Savage, P. Grappin, and D. Job,“Post-genomics dissection of seed dormancy and germina-tion,” Trends in Plant Science, vol. 13, no. 1, pp. 7–13, 2008.
[25] R. Iglesias-Fernández, M. C. Rodríguez-Gacio, C. Barrero-Sici-lia, P. Carbonero, and A. Matilla, “Three endo-β-mannanasegenes expressed in the micropylar endosperm and in the radi-cle influence germination of Arabidopsis thaliana seeds,”Planta, vol. 233, no. 1, pp. 25–36, 2011.
[26] B. Kamkar, M. Jami Al-Alahmadi, A. Mahdavi-Damghani,and F. J. Villalobos, “Quantification of the cardinal tempera-tures and thermal time requirement of opium poppy (Papaversomniferum L.) seeds to germinate using non-linear regressionmodels,” Industrial Crops and Products, vol. 35, no. 1, pp. 192–198, 2012.
[27] W. Pereira, J. Faria, O. Tonetti, and E. Silva, “Loss of desicca-tion tolerance in Copaifera langsdorffii Desf. seeds during ger-mination,” Brazilian Journal of Biology, vol. 74, no. 2, pp. 501–508, 2014.
[28] S. E. E. Queiroz, E. A. A. da Silva, A. C. Davide et al., “Mecha-nism and control of Genipa americana seed germination,”Physiologia Plantarum, vol. 144, no. 3, pp. 263–276, 2012.
[29] L. B. Windauer, J. Martinez, D. Rapoport, D. Wassner, andR. Benech-Arnold, “Germination responses to temperatureand water potential in Jatropha curcas seeds: a hydrotimemodel explains the difference between dormancy expres-sion and dormancy induction at different incubation
14 Plant Phenomics

temperatures,” Annals of Botany, vol. 109, no. 1, pp. 265–273, 2012.
[30] P. E. Toorop, “Nitrate controls testa rupture and water contentduring release of physiological dormancy in seeds ofSisym-brium officinale(L.) Scop,” Seed Science Research, vol. 25,no. 2, pp. 138–146, 2015.
[31] T. Steinbrecher and G. Leubner-Metzger, “The biomechanicsof seed germination,” Journal of Experimental Botany,vol. 68, pp. 765–783, 2016.
[32] K. Kikuchi, M. Koizumi, N. Ishida, and H. Kano, “Wateruptake by dry beans observed by micro-magnetic resonanceimaging,” Annals of Botany, vol. 98, no. 3, pp. 545–553,2006.
[33] E. Munz, H. Rolletschek, S. Oeltze-Jafra et al., “A functionalimaging study of germinating oilseed rape seed,” The New Phy-tologist, vol. 216, no. 4, pp. 1181–1190, 2017.
[34] Ł. Wojtyla, K. Lechowska, S. Kubala, and M. Garnczarska,“Different modes of hydrogen peroxide action during seed ger-mination,” Frontiers in Plant Science, vol. 7, 2016.
[35] Ł. Wojtyla, M. Garnczarska, T. Zalewski, W. Bednarski,L. Ratajczak, and S. Jurga, “A comparative study of water dis-tribution, free radical production and activation of antioxida-tive metabolism in germinating pea seeds,” Journal of PlantPhysiology, vol. 163, no. 12, pp. 1207–1220, 2006.
[36] B. Manz, K. Müller, B. Kucera, F. Volke, and G. Leubner-Metz-ger, “Water uptake and distribution in germinating tobaccoseeds investigated in vivo by nuclear magnetic resonanceimaging,” Plant Physiology, vol. 138, no. 3, pp. 1538–1551,2005.
[37] M. A. Ranal and D. G. de Santana, “How and why to measurethe germination process?,” Revista Brasileira de Botânica,vol. 29, no. 1, pp. 1–11, 2006.
[38] J. P. Ribeiro-Oliveira and M. A. Ranal, “Sample size in studieson the germination process,” Botany, vol. 94, no. 2, pp. 103–115, 2016.
[39] ISTA, ISTA Method Validation for Seed Testing, Bassers-dorf, 2007https://www.seedtest.org/upload/cms/user/ISTAMethodValidationforSeedTesting-V1.01.pdf.
[40] ISO, ISO 5725-2. Accuracy (trueness and precision) of measure-ment methods and results – part 2: basic method for the deter-mination of repeatability and reproducibility of a standardmeasurement method, no. 1, 1994ISO, Geneva, 1994, https://www.iso.org/standard/11834.html.
[41] K. Weitbrecht, K. Müller, and G. Leubner-Metzger, “First offthe mark: early seed germination,” Journal of ExperimentalBotany, vol. 62, no. 10, pp. 3289–3309, 2011.
[42] Brasil, Regras para Análise de Sementes, MAPA/ACS: Minis-tério da Agricultura, Pecuária e Abastecimento, Brasília, DF,Brasil, 3 edition, 2009.
[43] M. P. Carvalho, D. G. Santana, and M. A. Ranal, “Emergênciade plântulas de Anacardium humile A. St.-Hil. (Anacardia-ceae) avaliada por meio de amostras pequenas,” Revista Brasi-leira de Botânica, vol. 28, no. 3, pp. 627–633, 2005.
[44] W. G. Cochran, Sampling Techniques, John Wiley & Sons, 3rdedition, 1977.
[45] B. Efron, “Bootstrap methods: another look at the jackknife,”The Annals of Statistics, vol. 7, no. 1, pp. 1–26, 1979.
[46] S. T. Buckland, “AlgorithmAS 214: calculation of Monte Carloconfidence intervals,” Applied Statistics, vol. 34, no. 3, p. 296,1985.
[47] IBM, SPSS Bootstrapping, IBM, 2015, http://www-03.ibm.com/software/products/en/spss-bootstrappin.
[48] W. H. Press, S. A. Teukolsky, W. T. Vetterling, and B. P. Flan-nery, Numerial Recips in Fortran, Cambridge University Press,Cambridge, 1992.
[49] M. W. Hirsch, S. Smale, and R. L. Devaney, DifferentialEquations, Dynamical Systems, and an Introduction to Chaos,Academic Press, 2013.
[50] J. Crank, The Mathematics of Diffusion, Oxford Science Publi-cations, 1975.
[51] A. Lee and B. Willcox, “Minkowski generalizations of Ward’smethod in hierarchical clustering,” Journal of Classification,vol. 31, no. 2, pp. 194–218, 2014.
[52] I. Kranner, F. V. Minibayeva, R. P. Beckett, and C. E. Seal,“What is stress? Concepts, definitions and applications in seedscience,” The New Phytologist, vol. 188, no. 3, pp. 655–673,2010.
[53] R. C. Heading, J. Nimmo, L. F. Prescott, and P. Tothill, “Thedependence of paracetamol absorption on the rate of gastricemptying,” British Journal of Pharmacology, vol. 47, no. 2,pp. 415–421, 1973.
[54] J. Urquhart, “The odds of the three nons when an aptly pre-scribed medicine isn’t working: non-compliance, non-absorp-tion, non-response,” British Journal of Clinical Pharmacology,vol. 54, no. 2, pp. 212–220, 2002.
[55] D. Nelson and M. Cox, Lehninger Principles of Biochemistry,W.H. Freeman, 2008.
[56] M. Kline, Calculus: An Intuitive and Physical Approach, Cou-rier Corporation, 1998.
[57] A. J. Sanhewe and R. H. Ellis, “Seed development and matura-tion inPhaseolus vulgarisII. Post-harvest longevity in air-drystorage,” Journal of Experimental Botany, vol. 47, no. 7,pp. 959–965, 1996.
[58] L. Sánchez-Linares, M. Gavilanes-Ruíz, D. Díaz-Pontoneset al., “Early carbon mobilization and radicle protrusion inmaize germination,” Journal of Experimental Botany, vol. 63,no. 12, pp. 4513–4526, 2012.
[59] A. Ericsson and J. Karlsson, “Measures for benchmarking ofautomatic correspondence algorithms,” Journal of Mathemat-ical Imaging and Vision, vol. 28, no. 3, pp. 225–241, 2007.
[60] D. C. Montgomery and G. C. Runger, Applied Statistics andProbability for Engineers, Wiley, Danvers, MA, USA, 6 edition,2014.
[61] C. Führer and A. Schroll, Numerical Analysis - An Introduc-tion, Lund University, Lund, 3 edition, 2001.
[62] B. E. Livingston, “Plant water relations,” The Quarterly Reviewof Biology, vol. II, pp. 494–515, 1927.
[63] J. W. Graham and J. G. Richardson, “Theory and applicationof imbibition phenomena in recovery of oil,” Journal of Petro-leum Technology, vol. 11, pp. 65–69, 2013.
[64] J. Philibert, “One and a half century of diffusion - Fick, Ein-stein and beyond,” Diffusion-Fundamentals, vol. 2, pp. 1–19,2005.
[65] M. Bello, M. P. Tolaba, R. J. Aguerre, and C. Suarez, “Modelingwater uptake in a cereal grain during soaking,” Journal of FoodEngineering, vol. 97, no. 1, pp. 95–100, 2010.
[66] M. Díaz-Ramírez, G. Calderón-Domínguez, J. J. Chanona-Pérez et al., “Modelling sorption kinetic of sponge cake crumbadded with milk syrup,” International Journal of Food Scienceand Technology, vol. 48, no. 8, pp. 1649–1660, 2013.
15Plant Phenomics

[67] A. Briffaz, P. Bohuon, J.-M. Méot, M. Dornier, and C. Mestres,“Modelling of water transport and swelling associated withstarch gelatinization during rice cooking,” Journal of FoodEngineering, vol. 121, pp. 143–151, 2014.
[68] V. Mathieu, A.-F. Monnet, S. Jourdren, M. Panouillé,C. Chappard, and I. Souchon, “Kinetics of bread crumb hydra-tion as related to porous microstructure,” Food & Function,vol. 7, no. 8, pp. 3577–3589, 2016.
16 Plant Phenomics