Embed Size (px)
Citation preview
Water for Monterey CountyRegional Project
Capital and O&M Cost Description
1
Lyndel Melton, P.E.RMC Water and Environment
Capital and O&M Cost Description Agenda
• Regional Project Description• Basis for Cost Estimates• Capital and O&M Costs• Comparison of Costs
2
Regional ProjectUpdated Phase 1 Description
3
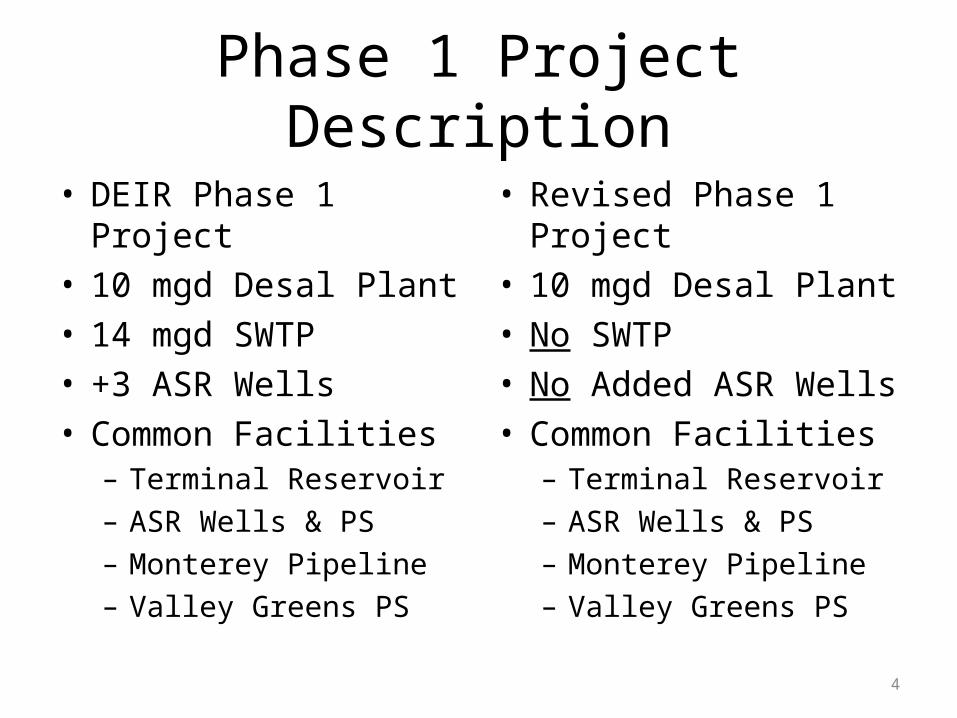
Phase 1 Project Description
• DEIR Phase 1 Project• 10 mgd Desal Plant• 14 mgd SWTP• +3 ASR Wells• Common Facilities– Terminal Reservoir– ASR Wells & PS– Monterey Pipeline– Valley Greens PS
• Revised Phase 1 Project• 10 mgd Desal Plant• No SWTP• No Added ASR Wells• Common Facilities– Terminal Reservoir– ASR Wells & PS– Monterey Pipeline– Valley Greens PS
4
5
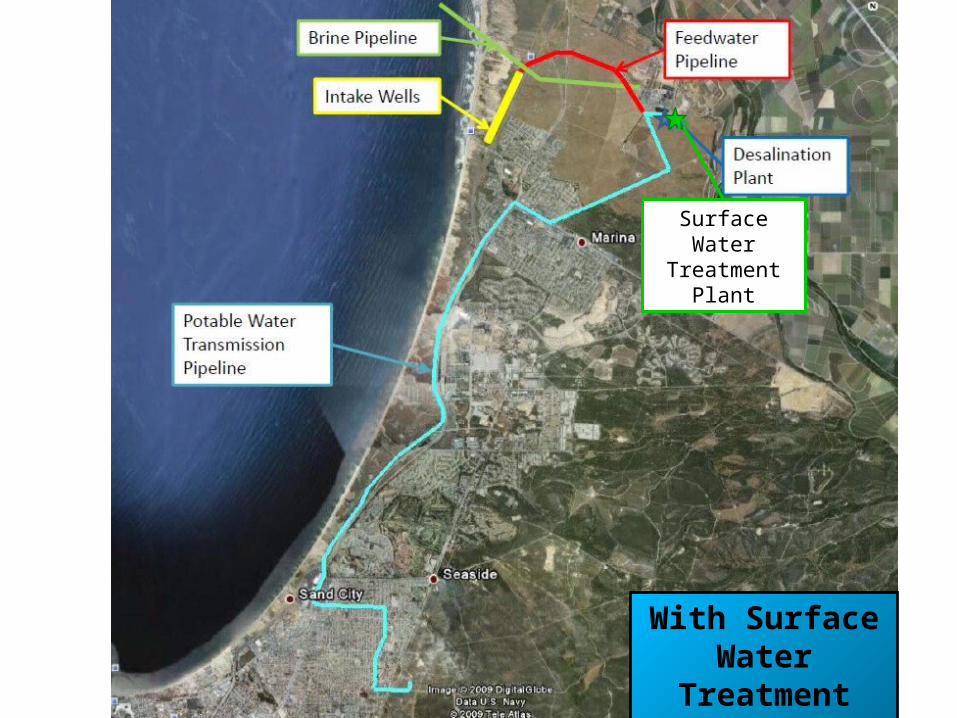
Surface Water Treatment Plant
With Surface Water Treatment
Plant
6
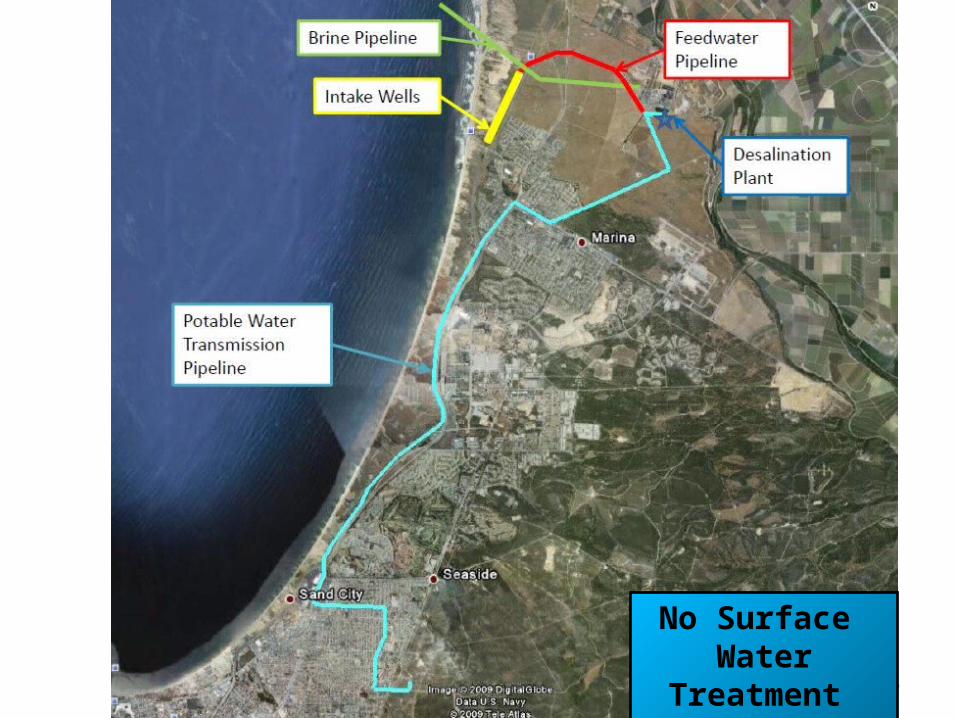
No Surface Water Treatment
Plant
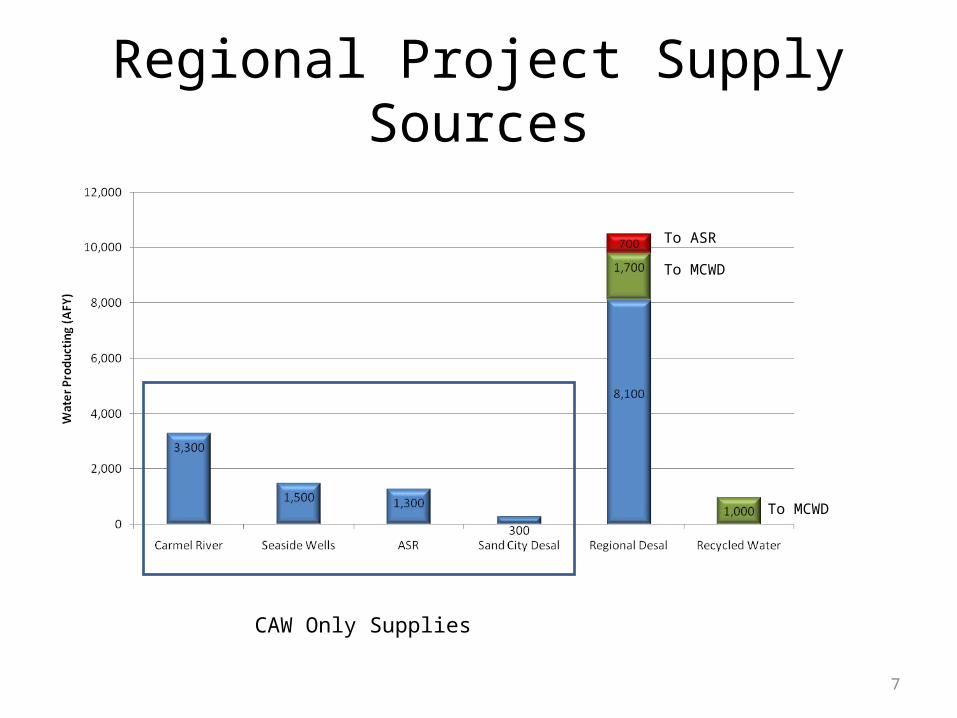
Regional Project Supply Sources
7
To ASR
To MCWD
To MCWD
CAW Only Supplies
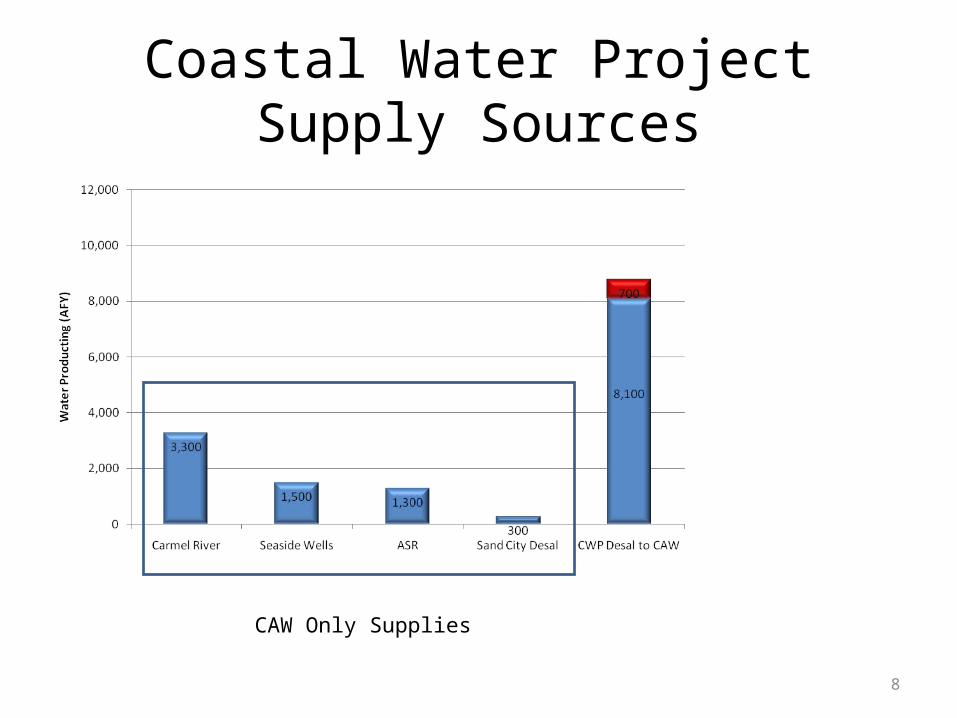
Coastal Water Project Supply Sources
8
CAW Only Supplies
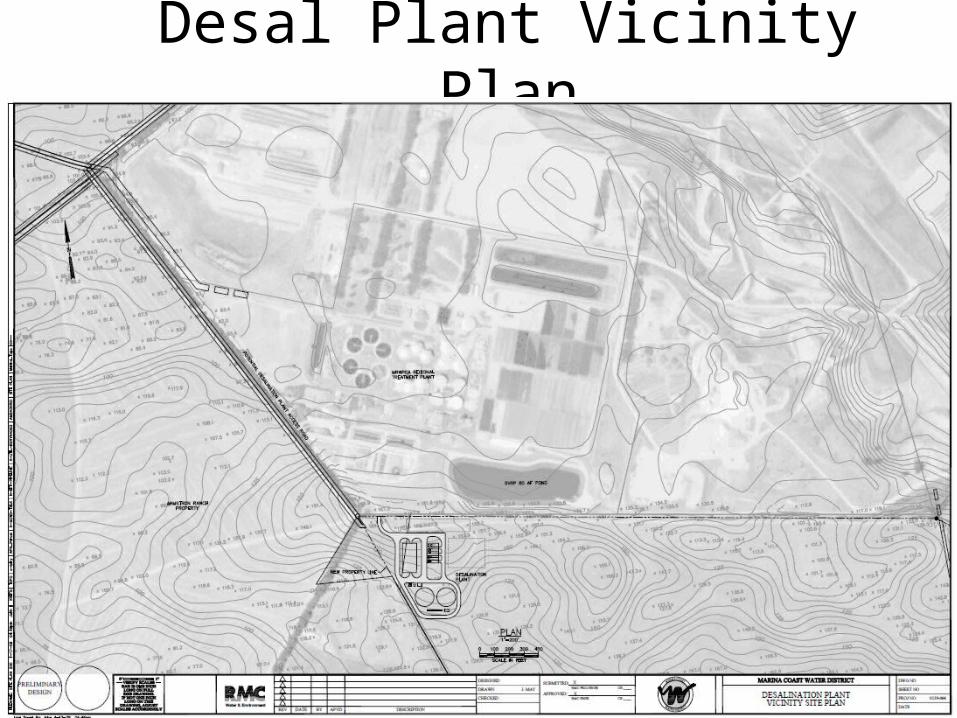
Desal Plant Vicinity Plan
9
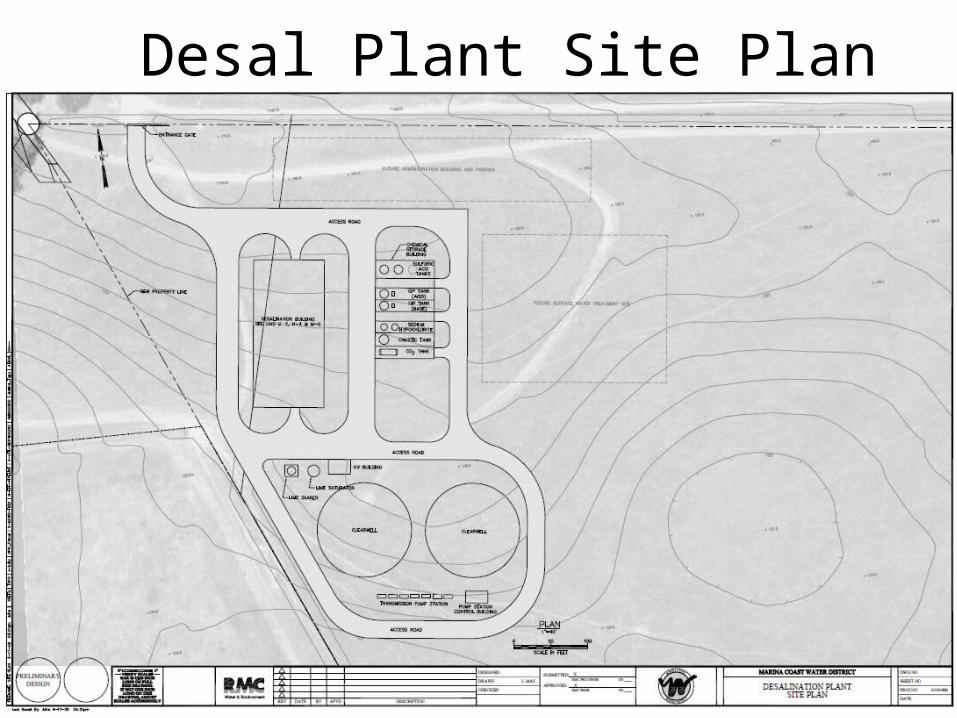
Desal Plant Site Plan
10
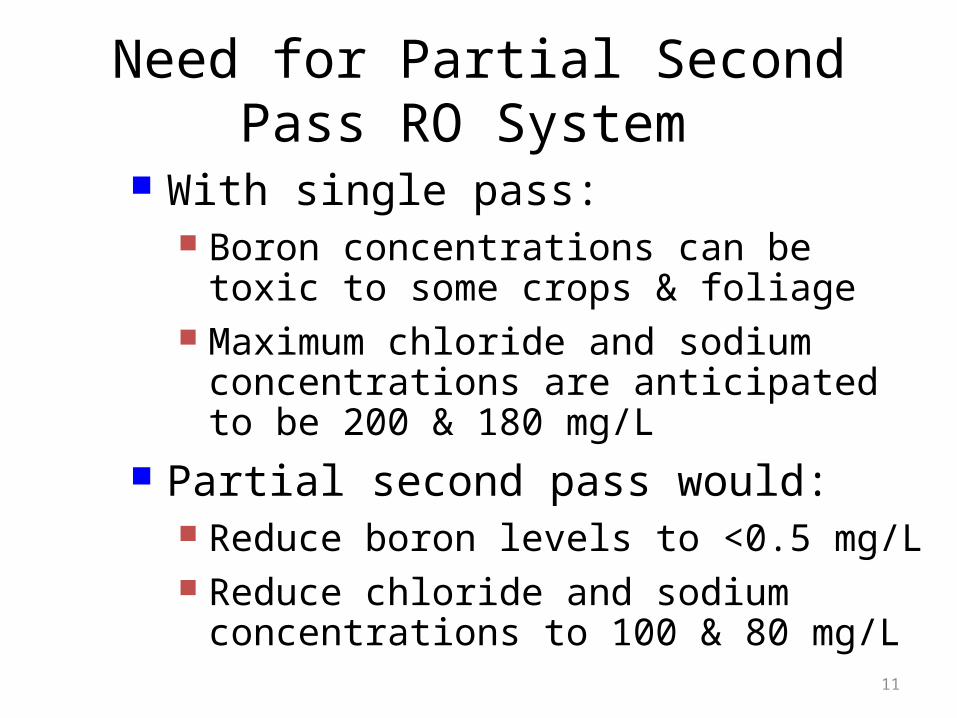
Need for Partial Second Pass RO System
11
With single pass: Boron concentrations can be toxic to some
crops & foliage Maximum chloride and sodium concentrations
are anticipated to be 200 & 180 mg/L Partial second pass would:
Reduce boron levels to <0.5 mg/L Reduce chloride and sodium concentrations to
100 & 80 mg/L
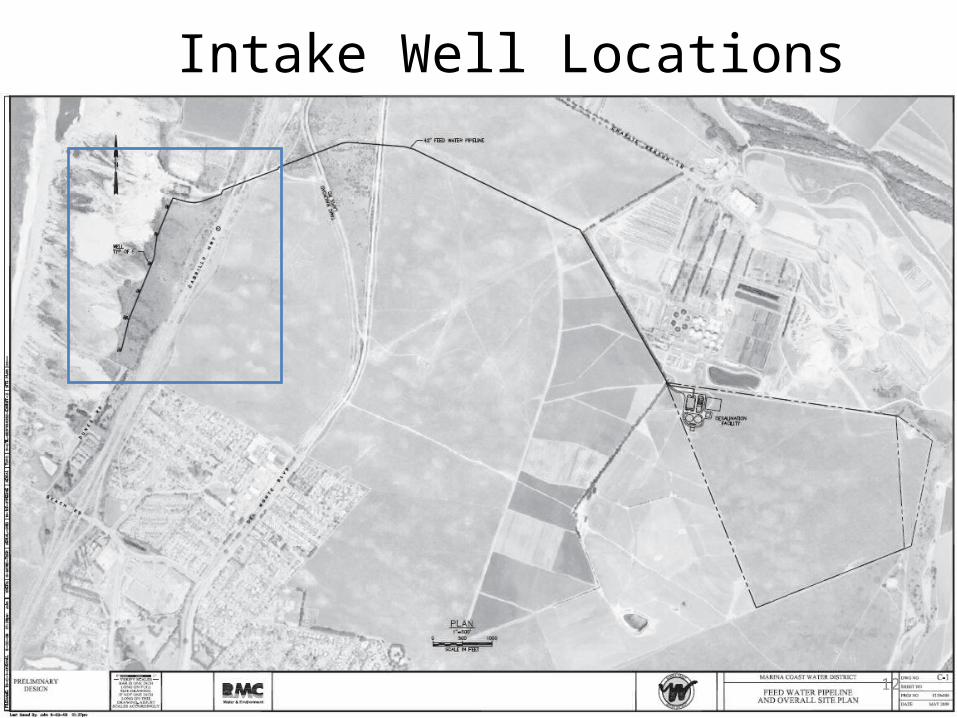
Intake Well Locations
12
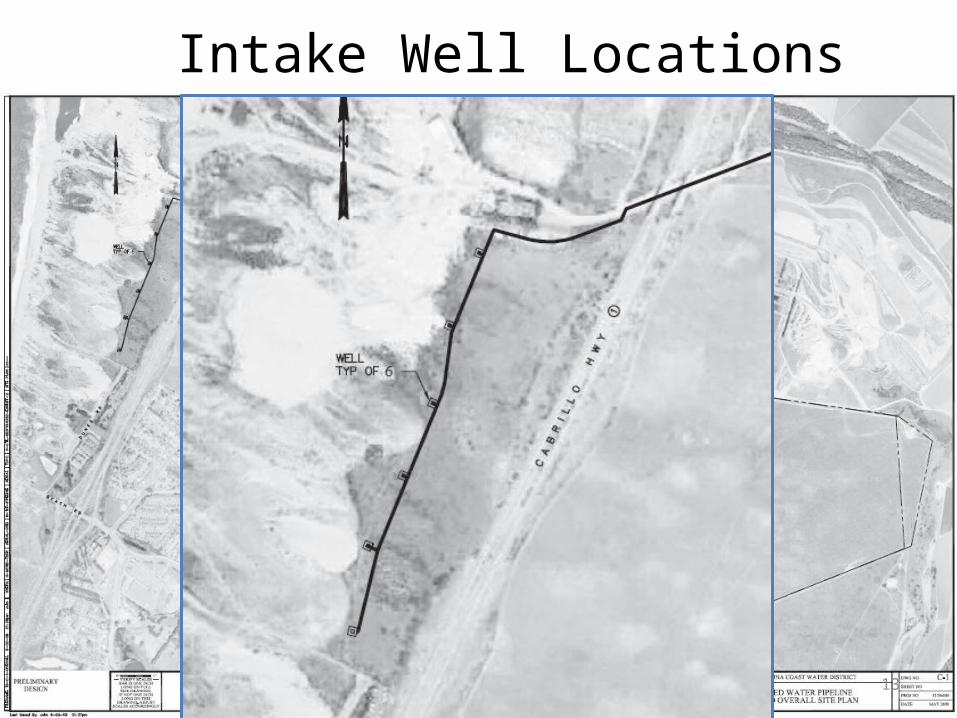
Intake Well Locations
13
Regional ProjectBasis for Cost Estimates
14
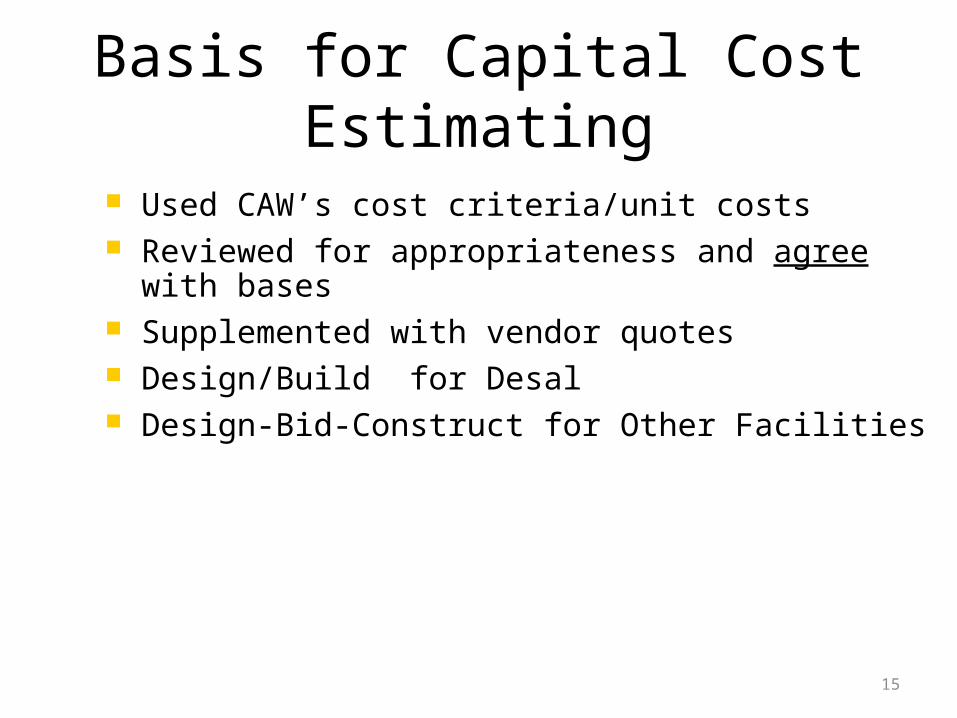
Basis for Capital Cost Estimating
15
Used CAW’s cost criteria/unit costs Reviewed for appropriateness and agree with bases Supplemented with vendor quotes Design/Build for Desal Design-Bid-Construct for Other Facilities
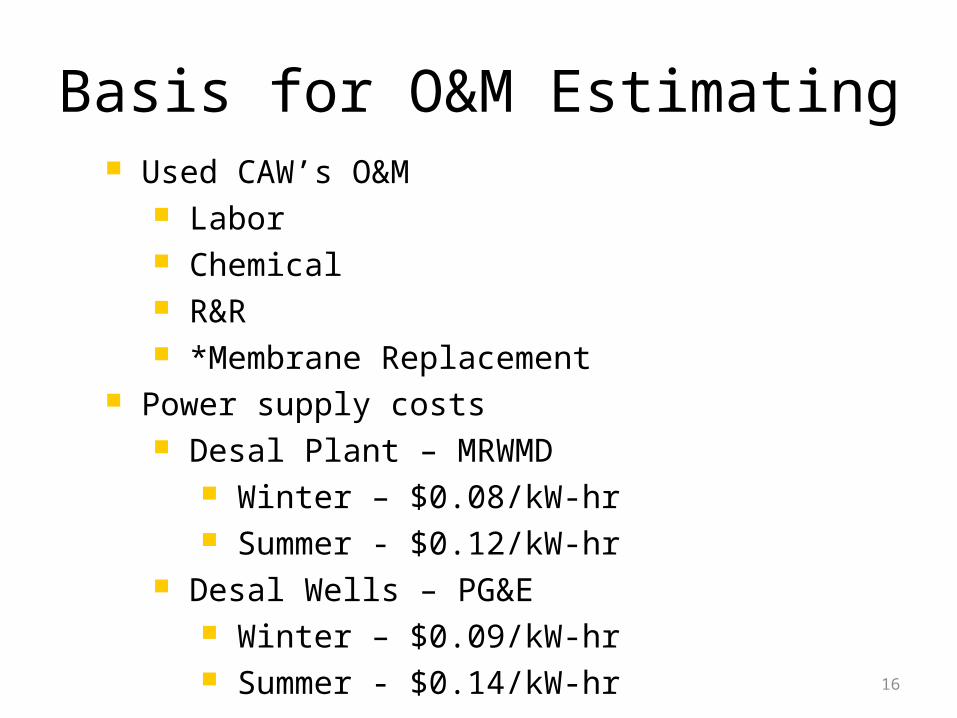
Basis for O&M Estimating
16
Used CAW’s O&M Labor Chemical R&R *Membrane Replacement
Power supply costs Desal Plant – MRWMD
Winter – $0.08/kW-hr Summer - $0.12/kW-hr
Desal Wells – PG&E Winter – $0.09/kW-hr Summer - $0.14/kW-hr
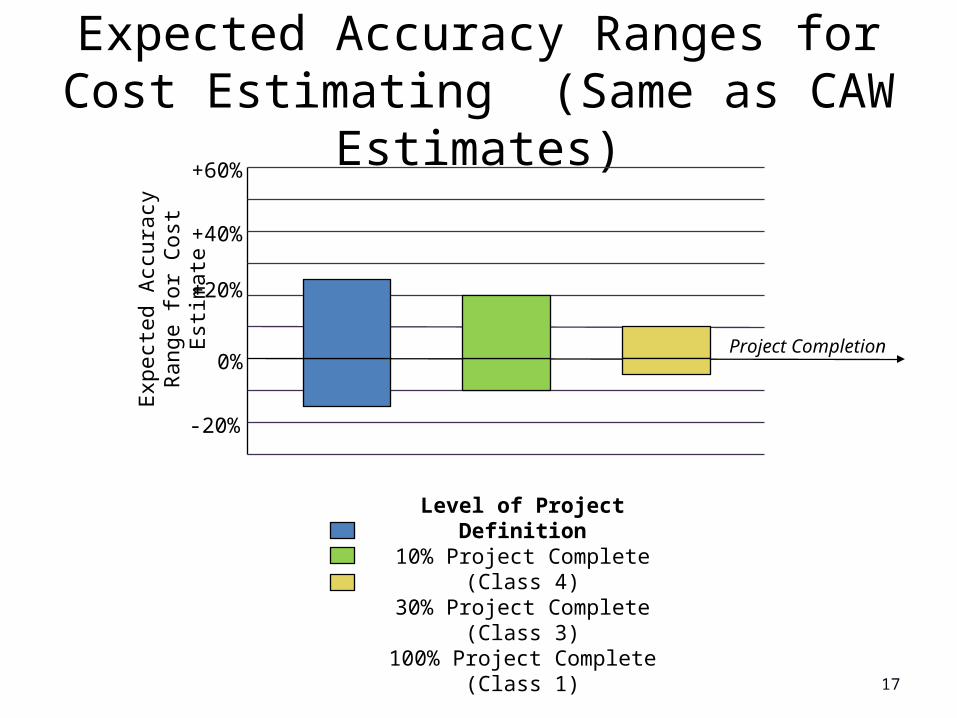
Expected Accuracy Ranges for Cost Estimating (Same as CAW Estimates)
17
0%
+60%
+40%
+20%
-20%
Expect
ed A
ccura
cy
Range f
or
Cost
Est
imate
Level of Project Definition10% Project Complete (Class 4)30% Project Complete (Class 3)100% Project Complete (Class
1)
Project Completion
Regional ProjectCapital and O&M Cost Estimates
18
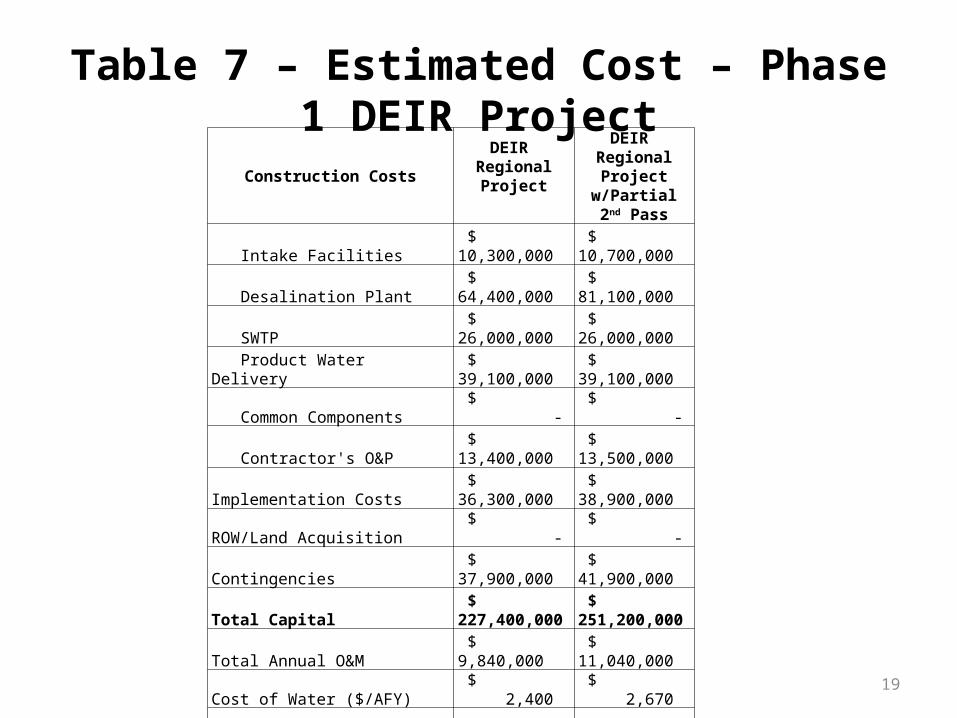
Table 7 – Estimated Cost – Phase 1 DEIR Project
19
Construction Costs
DEIR Regional Project
DEIR Regional Project
w/Partial 2nd Pass
Intake Facilities $ 10,300,000 $ 10,700,000
Desalination Plant $ 64,400,000 $ 81,100,000
SWTP $ 26,000,000 $ 26,000,000
Product Water Delivery $ 39,100,000 $ 39,100,000
Common Components $ - $ -
Contractor's O&P $ 13,400,000 $ 13,500,000
Implementation Costs $ 36,300,000 $ 38,900,000
ROW/Land Acquisition $ - $ -
Contingencies $ 37,900,000 $ 41,900,000
Total Capital $ 227,400,000 $ 251,200,000
Total Annual O&M $ 9,840,000 $ 11,040,000
Cost of Water ($/AFY) $ 2,400 $ 2,670
Annual Production (AFY) 10,500 10,500
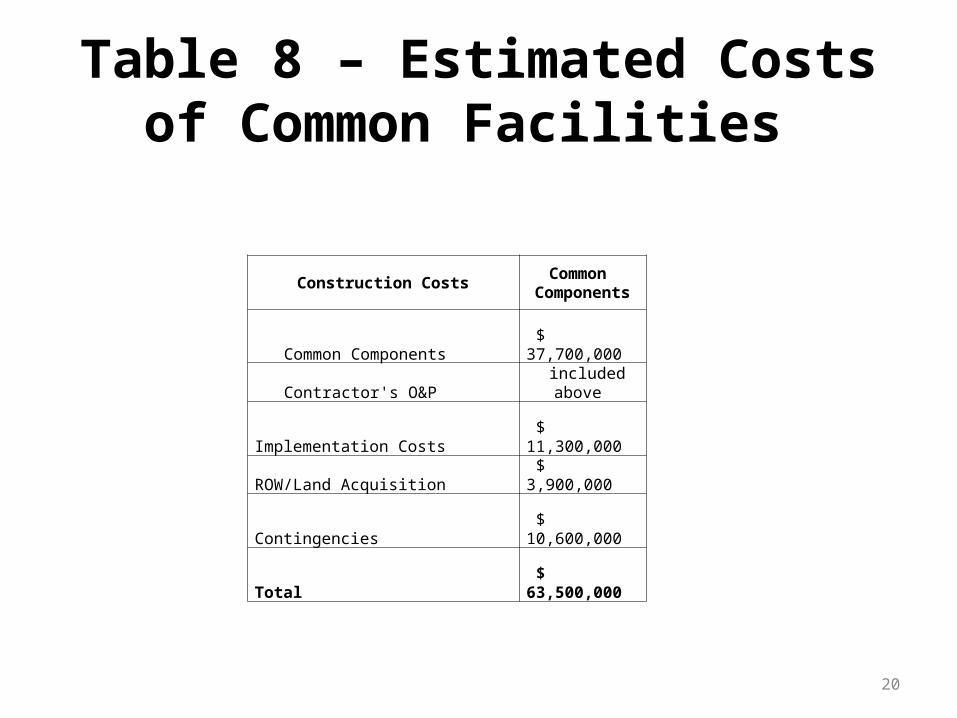
Table 8 – Estimated Costs of Common Facilities
20
Construction CostsCommon
Components
Common Components $ 37,700,000
Contractor's O&P included above
Implementation Costs $ 11,300,000
ROW/Land Acquisition $ 3,900,000
Contingencies $ 10,600,000
Total $ 63,500,000
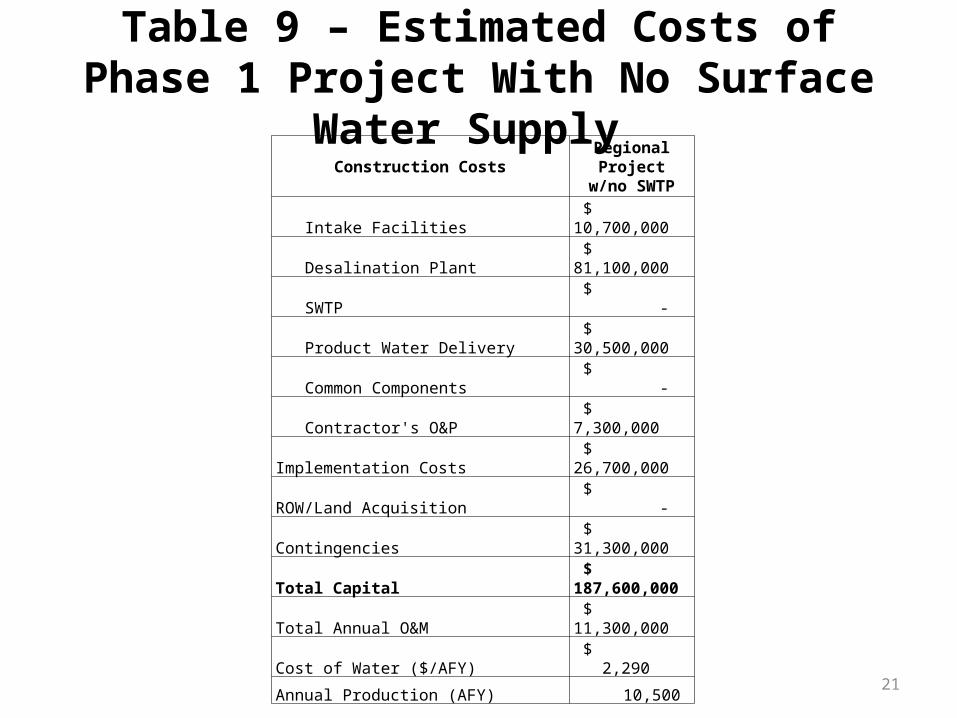
Table 9 – Estimated Costs of Phase 1 Project With No Surface Water Supply
21
Construction CostsRegional Project
w/no SWTP
Intake Facilities $ 10,700,000
Desalination Plant $ 81,100,000
SWTP $ -
Product Water Delivery $ 30,500,000
Common Components $ -
Contractor's O&P $ 7,300,000
Implementation Costs $ 26,700,000
ROW/Land Acquisition $ -
Contingencies $ 31,300,000
Total Capital $ 187,600,000
Total Annual O&M $ 11,300,000
Cost of Water ($/AFY) $ 2,290
Annual Production (AFY) 10,500
Alternative Project Cost Comparisons
22
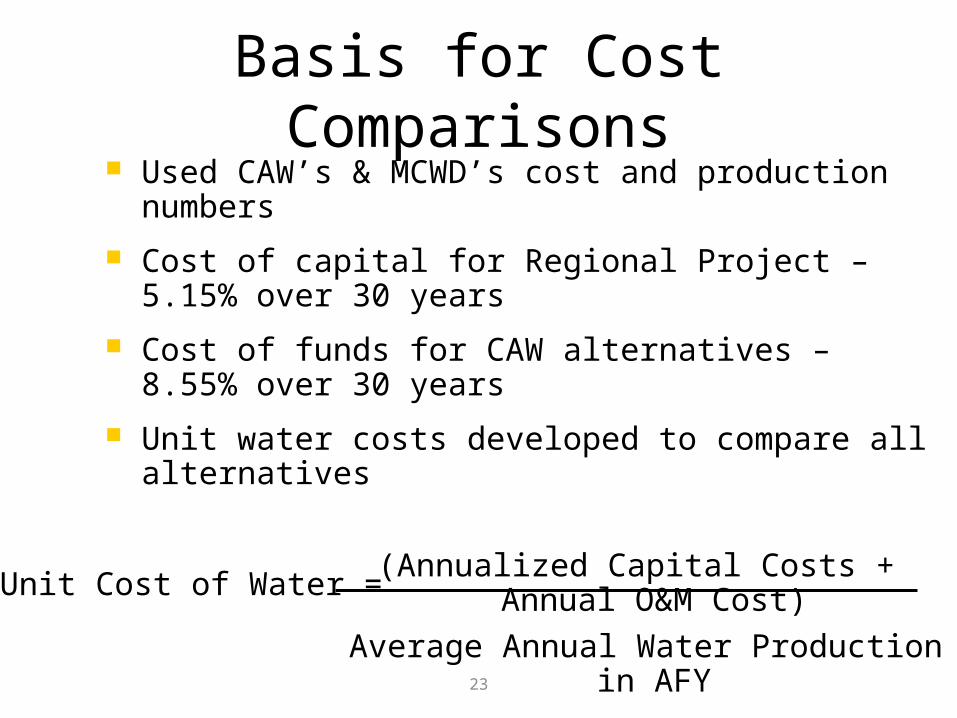
Basis for Cost Comparisons
23
Used CAW’s & MCWD’s cost and production numbers Cost of capital for Regional Project – 5.15% over 30 years Cost of funds for CAW alternatives – 8.55% over 30 years Unit water costs developed to compare all alternatives
(Annualized Capital Costs + Annual O&M Cost) Average Annual Water Production in AFY
Unit Cost of Water =
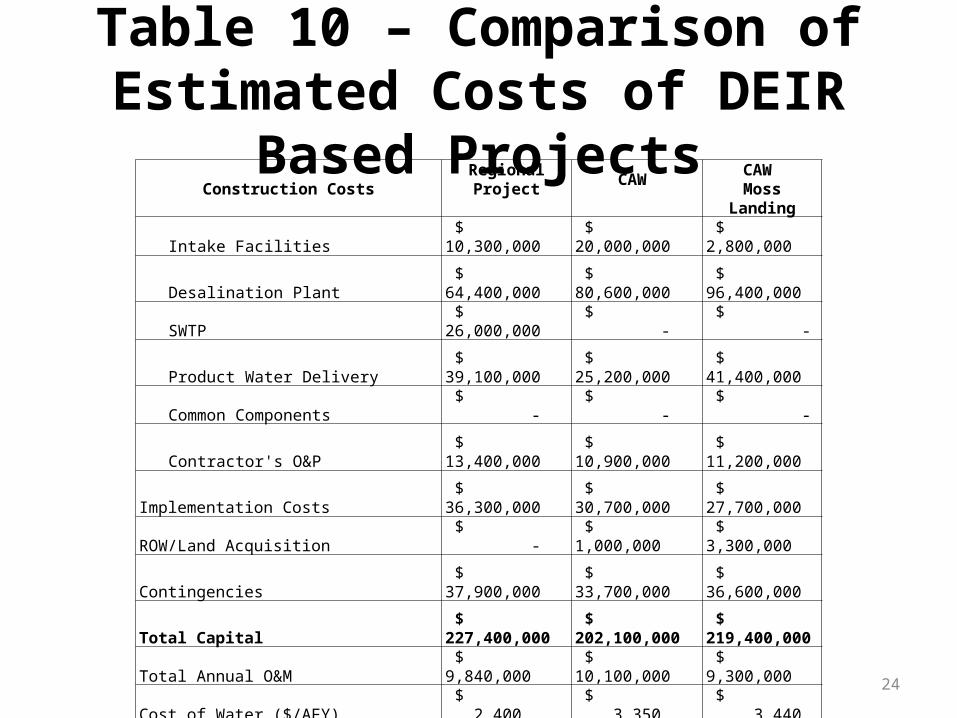
Table 10 – Comparison of Estimated Costs of DEIR Based Projects
24
Construction CostsRegional Project CAW CAW
Moss Landing
Intake Facilities $ 10,300,000 $ 20,000,000 $ 2,800,000
Desalination Plant $ 64,400,000 $ 80,600,000 $ 96,400,000
SWTP $ 26,000,000 $ - $ -
Product Water Delivery $ 39,100,000 $ 25,200,000 $ 41,400,000
Common Components $ - $ - $ -
Contractor's O&P $ 13,400,000 $ 10,900,000 $ 11,200,000
Implementation Costs $ 36,300,000 $ 30,700,000 $ 27,700,000
ROW/Land Acquisition $ - $ 1,000,000 $ 3,300,000
Contingencies $ 37,900,000 $ 33,700,000 $ 36,600,000
Total Capital $ 227,400,000 $ 202,100,000 $ 219,400,000
Total Annual O&M $ 9,840,000 $ 10,100,000 $ 9,300,000
Cost of Water ($/AFY) $ 2,400 $ 3,350 $ 3,440
Annual Production (AFY) 10,500 8,800 8,800
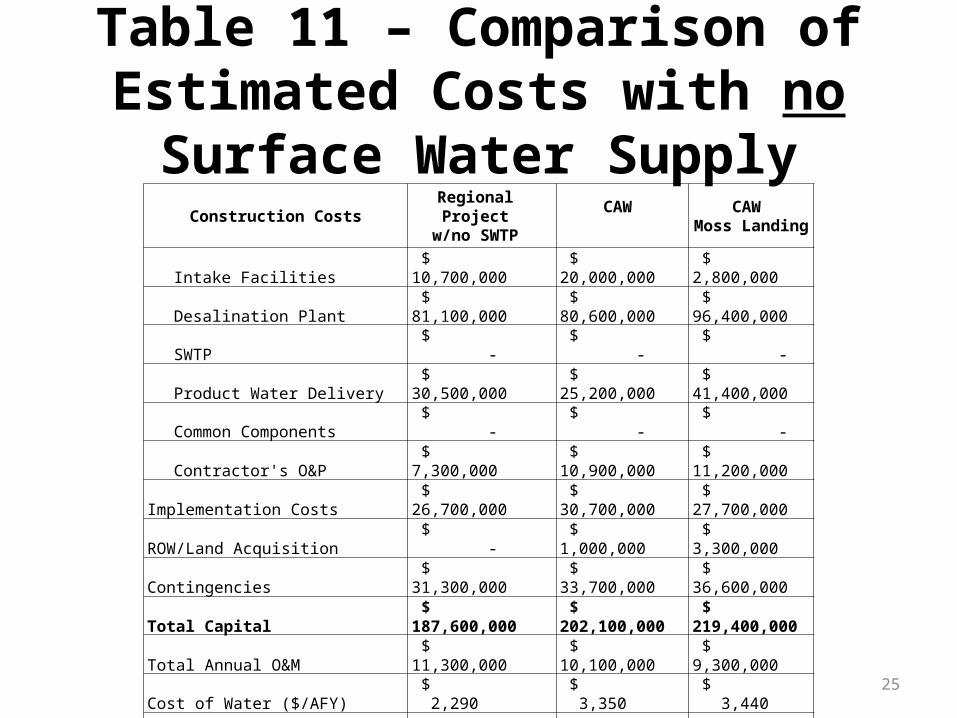
Table 11 – Comparison of Estimated Costs with no Surface Water Supply
25
Construction CostsRegional Project
w/no SWTPCAW CAW
Moss Landing
Intake Facilities $ 10,700,000 $ 20,000,000 $ 2,800,000
Desalination Plant $ 81,100,000 $ 80,600,000 $ 96,400,000
SWTP $ - $ - $ -
Product Water Delivery $ 30,500,000 $ 25,200,000 $ 41,400,000
Common Components $ - $ - $ -
Contractor's O&P $ 7,300,000 $ 10,900,000 $ 11,200,000
Implementation Costs $ 26,700,000 $ 30,700,000 $ 27,700,000
ROW/Land Acquisition $ - $ 1,000,000 $ 3,300,000
Contingencies $ 31,300,000 $ 33,700,000 $ 36,600,000
Total Capital $ 187,600,000 $ 202,100,000 $ 219,400,000
Total Annual O&M $ 11,300,000 $ 10,100,000 $ 9,300,000
Cost of Water ($/AFY) $ 2,290 $ 3,350 $ 3,440
Annual Production (AFY) 10,500 8,800 8,800
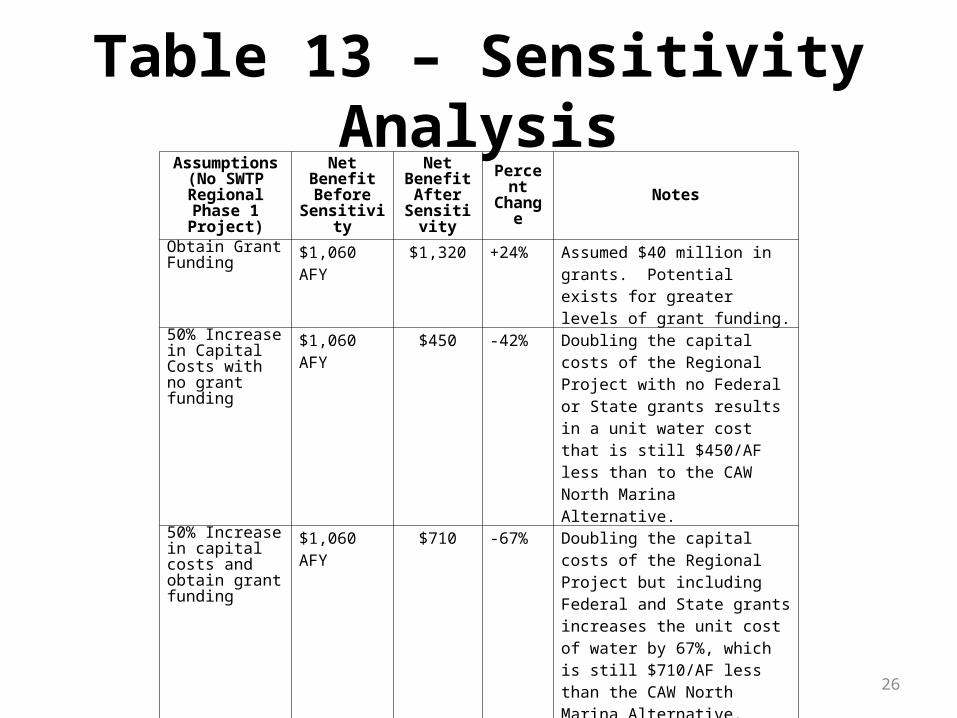
Table 13 – Sensitivity Analysis
26
Assumptions(No SWTP
Regional Phase 1 Project)
Net Benefit Before
Sensitivity
Net Benefit After
Sensitivity
Percent Change Notes
Obtain Grant Funding
$1,060 AFY $1,320 +24% Assumed $40 million in grants. Potential exists for greater levels of grant funding.
50% Increase in Capital Costs with no grant funding
$1,060 AFY $450 -42% Doubling the capital costs of the Regional Project with no Federal or State grants results in a unit water cost that is still $450/AF less than to the CAW North Marina Alternative.
50% Increase in capital costs and obtain grant funding
$1,060 AFY $710 -67% Doubling the capital costs of the Regional Project but including Federal and State grants increases the unit cost of water by 67%, which is still $710/AF less than the CAW North Marina Alternative.
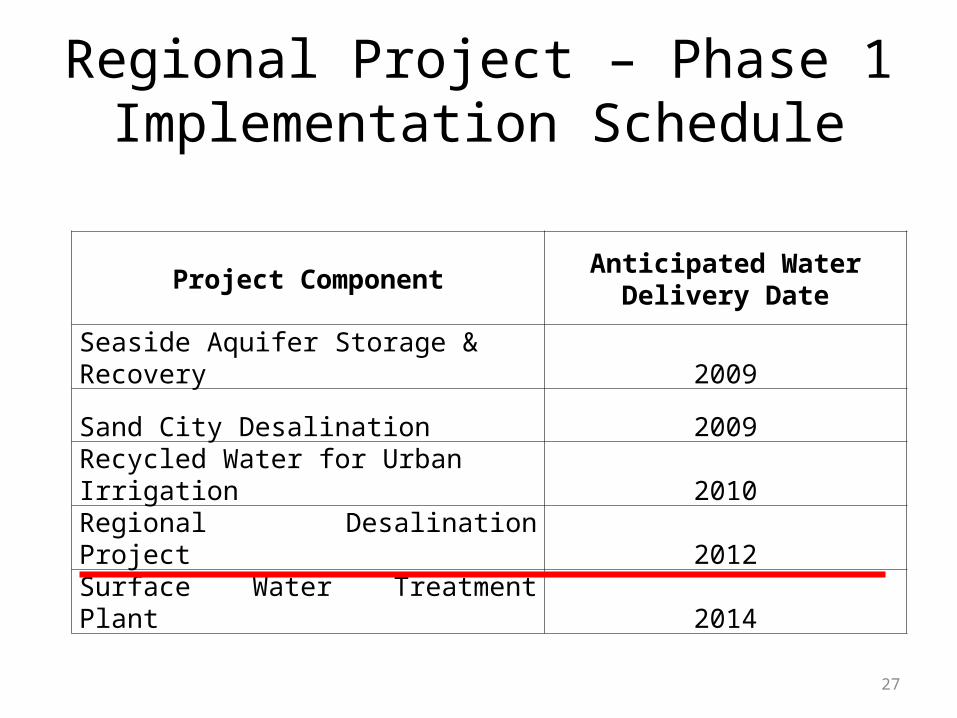
Regional Project – Phase 1 Implementation Schedule
27
Project Component Anticipated Water Delivery Date
Seaside Aquifer Storage & Recovery 2009
Sand City Desalination 2009
Recycled Water for Urban Irrigation 2010
Regional Desalination Project 2012
Surface Water Treatment Plant 2014