Embed Size (px)
Citation preview

1
Phillia Restiani, Stockholm International Water Institute
Aparna Khandelwal, Sustainability Outlook
2016
WATER GOVERNANCE MAPPING REPORT: TEXTILE INDUSTRY WATER USE IN INDIAFocus on the Faridabad-Ballabgarh Textile Cluster in the State of Haryana

2
Executive SummaryExecutive SummaryExecutive SummaryExecutive Summary
Textile industry is one of the oldest as well most important industries in Indian economy. It accounts for around
2% of GDP, 8% of excise and customs revenue collections, 14% of the industrial production and 12% of the total
manufacturing export earnings. The sector is the second-largest employment generating industry in both rural
and urban areas with nearly 35 million workers. Since textile industry is highly water intensive and India had
been identified as a highly water-scarce region, the long term viability of the Indian textile industry hinges
heavily on sustainable water management.
To a large extent, the mismanagement of water resources has exacerbated the problems of water scarcity and
variability, leading to critical situations of water quantity and quality in many parts of the country. Water
governance is the key to ensure that beyond the technical engineering solutions, there exists enabling systems
of coordinated regulations, institutions and incentives to balance various needs for water. With the focus on
textile water use in India, especially in the Faridabad-Ballabgarh cluster in the state of Haryana, this report aims
to: a) assess physical and regulatory water risks; b) investigate water governance landscape; and c) inform
priority areas for capacity building in sustainable water management.
The Faridabad-Ballabgarh cluster was chosen as the focus of the report due to its high concentration of wet
processing units within the STWI Projects in the National Capital Region and enormous environmental
challenges with a high level of pollution from industrial sources and declining groundwater table due to
overexploitation. At the same time, the Zero Liquid Discharge (ZLD) policy by the Central Pollution Control
Board (CPCB), which regulates pollution and water abstraction by industries including the textile wet
processing units, has driven some actions to adopt efficient water use and management in the cluster.
This report discusses two main background contexts: 1) the landscape of the textile industry at the national as
well as state level: its economic significance, outlook to its sustainability, and specific water management
challenges, especially water use intensity and effluent characteristics; and 2) the overall challenges of water
resources management in India.
The report finds four major physical water risks of the textile industry, both at the national and state level:
a) Increasing gap between the supply and demand of freshwater that are required to underpin the growth
and ambition of the textile industry.
At the national level, most basins have a severe scarcity gap (20-80%) and most districts are prone to multi-
year drought. At the state level, the stage of groundwater development is 127% in 2013-2014, which
implies that the annual groundwater consumption is much higher than the annual groundwater recharge.
b) Declining groundwater table due to overexploitation of the resources.
In Haryana state, 55 groundwater blocks were notified as over exploited, 11 blocks as critical and 5 blocks
as semi critical. At the national level, most regions have groundwater development beyond 41% and a few
regions have exploitation rate above 100%.
c) Degrading water quality both for surface water and groundwater.
Over 70% of the water consumed by the rural population in India does not meet the WHO standards
contributing to almost 80% of rural illnesses and 20% deaths among children age up to 5 years old. Only
31% of the total sewage water generated in 23 major cities is treated and the rest is disposed of into 18
major rivers in the country. Haryana state has three river stretches falling under priority 1, the highest risk
of water pollution as indicated by a high level of Biological Oxygen Demand. The groundwater quality is
also a grave problem with salinity, high fluoride, and arsenic as the major concerns.
d) Suboptimal performance of existing individual Effluent Treatment Plants (ETPs) or Common Effluent
Treatment Plants (CETPs).
The CPCB study in 2005 showed unsatisfactory performance for many CETPs due to poor operation and
maintenance, as well as high Total Dissolved Solid (TDS) in raw water. In Haryana, the suboptimal
3
performance of the ETPs are attributed to the under capacity of the installed ETP, lower operation of ETP
than prescribed, and the lack of skilled labours.
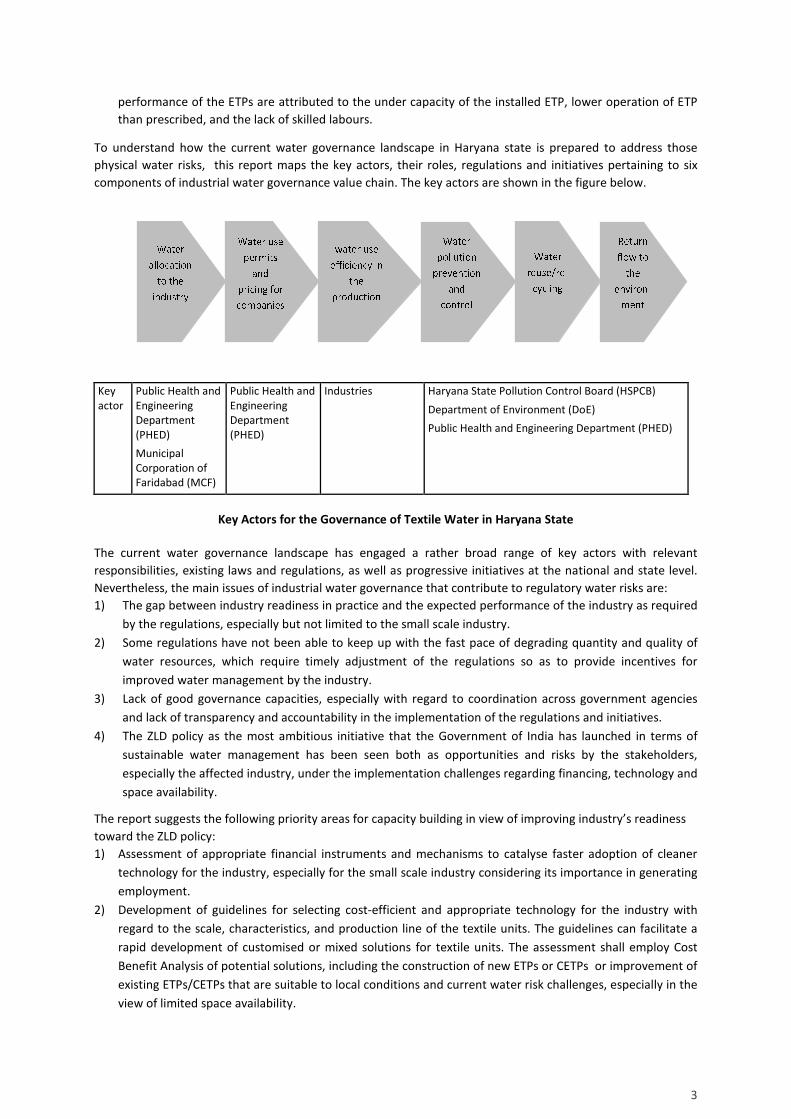
To understand how the current water governance landscape in Haryana state is prepared to address those
physical water risks, this report maps the key actors, their roles, regulations and initiatives pertaining to six
components of industrial water governance value chain. The key actors are shown in the figure below.
Key
actor
Public Health and
Engineering
Department
(PHED)
Municipal
Corporation of
Faridabad (MCF)
Public Health and
Engineering
Department
(PHED)
Industries Haryana State Pollution Control Board (HSPCB)
Department of Environment (DoE)
Public Health and Engineering Department (PHED)
Key Actors for the Governance of Textile Water in Haryana State
The current water governance landscape has engaged a rather broad range of key actors with relevant
responsibilities, existing laws and regulations, as well as progressive initiatives at the national and state level.
Nevertheless, the main issues of industrial water governance that contribute to regulatory water risks are:
1) The gap between industry readiness in practice and the expected performance of the industry as required
by the regulations, especially but not limited to the small scale industry.
2) Some regulations have not been able to keep up with the fast pace of degrading quantity and quality of
water resources, which require timely adjustment of the regulations so as to provide incentives for
improved water management by the industry.
3) Lack of good governance capacities, especially with regard to coordination across government agencies
and lack of transparency and accountability in the implementation of the regulations and initiatives.
4) The ZLD policy as the most ambitious initiative that the Government of India has launched in terms of
sustainable water management has been seen both as opportunities and risks by the stakeholders,
especially the affected industry, under the implementation challenges regarding financing, technology and
space availability.
The report suggests the following priority areas for capacity building in view of improving industry’s readiness
toward the ZLD policy:
1) Assessment of appropriate financial instruments and mechanisms to catalyse faster adoption of cleaner
technology for the industry, especially for the small scale industry considering its importance in generating
employment.
2) Development of guidelines for selecting cost-efficient and appropriate technology for the industry with
regard to the scale, characteristics, and production line of the textile units. The guidelines can facilitate a
rapid development of customised or mixed solutions for textile units. The assessment shall employ Cost
Benefit Analysis of potential solutions, including the construction of new ETPs or CETPs or improvement of
existing ETPs/CETPs that are suitable to local conditions and current water risk challenges, especially in the
view of limited space availability.

4
3) Improving the skills in operating cleaner production processes and effluent treatment plants, through
capacity building activities across the industry. STWI Projects has undertaken such workshops but this
needs to be replicated on a wider scale across the industry.
4) Improving communication and harmonisation of regulations across government agencies in order to
expedite: a) learning of best practices from other states (e.g. Tirupur) or countries; b) enhance the efficacy
of regulations.
5) Enhancing good water governance through better transparency and accountability of decision making
processes as well as the implementation of various initiatives related to the ZLD policy.
6) Financially incentivize uptake of wastewater as make-up water.
7) Need to create standards for water consumption.
8) Test technologies on pilot basis and create a standard user manual to ensure usage of clean and
efficient technologies.
9) Individual ZLD facilities are more preferable than common facilities.

5
Table of Contents
Executive Summary ................................................................................................................................................ 2
Tables ...................................................................................................................................................................... 6
Figures ..................................................................................................................................................................... 7
Abbreviations ......................................................................................................................................................... 8
Chapter 1 Introduction ........................................................................................................................................... 9
1.1. Background ........................................................................................................................................... 9
1.2. Objective ............................................................................................................................................... 9
1.3. Methodology ....................................................................................................................................... 10
1.4. Focus of the Report ............................................................................................................................. 10
Chapter 2 Textile Industry in India ....................................................................................................................... 11
2.1. India’s Textile Industry ....................................................................................................................... 11
The significance of the Textile Industry ........................................................................................................ 11
The Outlook for Sustainable Textile Industry ............................................................................................... 11
2.2. Textile Industry Water Use In India .................................................................................................... 12
Textile Industry as a Large Water User and Pollutant Source ...................................................................... 12
Textile Industry Wastewater Characteristics ................................................................................................ 13
2.3. Economic Development Outlook for Textile Industry in Haryana ..................................................... 13
Industrial Growth in Haryana ....................................................................................................................... 13
Textile Sector: A Key Engine of Growth in Haryana ..................................................................................... 15
Chapter 3 Water Resources Management in India ............................................................................................. 16
3.1. Current water resources situations .................................................................................................... 16
3.1.1. India’s Water Budget .................................................................................................................. 16
3.1.2. Freshwater Resources ................................................................................................................. 17
3.2. Key Impacts of Climate Change to India’s Water Resources ............................................................. 19
Chapter 4 Physical water risk outlook of the textile and leather industry ......................................................... 20
4.1. Physical Water Risks in India .............................................................................................................. 20
4.1.1. The Growing Water Supply Demand Gap in India ...................................................................... 20
4.1.2. India’s Declining Water Table ..................................................................................................... 21
4.1.3. Water Pollution at the National Level and Ganges Basin ........................................................... 22
4.1.4. Sub Optimal Performance of Common Effluent Treatment Plants ............................................ 23
4.2. Physical Water Risks in the State of Haryana .................................................................................... 25

6
4.2.1. Increasing Water Supply Demand Gap at the State Level .......................................................... 25
4.2.2. Increasing Water Pollution Problem of Haryana ........................................................................ 27
4.3. Perception on Physical Water Risk ..................................................................................................... 28
Chapter 5 Water Governance Landscape Pertaining to Textile Industry............................................................ 30
5.1. National Level Policy Landscape of Water Governance .................................................................... 30
5.1.1. Key Actors and Their Roles ......................................................................................................... 32
Central Pollution Control Board ....................................................................................................................... 32
National River Conservation Directorate ........................................................................................................ 32
Central Ground Water Board ........................................................................................................................... 33
Central Ground Water Authority ..................................................................................................................... 34
Central Water Commission .............................................................................................................................. 34
5.1.2. Laws and Regulations .................................................................................................................. 35
5.2. State Level Landscape of Water Governance ..................................................................................... 36
5.2.1. Key Actors and their Roles .......................................................................................................... 37
5.2.2. Initiatives..................................................................................................................................... 39
5.3. Regulatory Water Risk ........................................................................................................................ 42
5.3.1. Perceptions on Risks and Opportunities Associated with ZLD policy ......................................... 42
5.3.2. Implementation Challenges ........................................................................................................ 43
5.3.3. The Need for Increased Transparency and Enhanced Coordination .......................................... 45
Chapter 6 Capacity Building Workshop ............................................................................................................... 46
6.1. Workshop Organisation .......................................................................................................................... 46
6.2. Inputs from the Workshop...................................................................................................................... 46
Chapter 7 Conclusions and Recommendations ................................................................................................... 48
7.1. Conclusion ................................................................................................................................................. 48
7.2. Recommendations ................................................................................................................................... 49
Annex A: Workshop Notes ................................................................................................................................... 50
REFERENCES .......................................................................................................................................................... 54
Tables
Table 1 Textile Industry Effluent Characteristics ................................................................................................... 13
Table 2 Index of Industrial Production for manufacturing sector with base year 2004-2005 .............................. 15
Table 3 Growth of textile manufacturing .............................................................................................................. 15
Table 4 India’s Water Budget in BCM ................................................................................................................... 17
Table 5 Places on the Ganges Basin which do not meet the criteria set by CPCB ................................................ 23

7
Table 6 The Distribution of CETP and Its Capacity ................................................................................................ 24
Table 7 The Summary of the 78 CETPs Assessed by CPCB .................................................................................... 24
Table 8 The groundwater resource development potential of Faridabad district of Haryana ............................ 26
Table 9 Categorization of Polluted Stretches of River in Haryana according to the BOD Level ........................... 27
Table 10 Observations for river Yamuna ............................................................................................................... 28
Table 11 The Surface Water Quality Level in Haryana at Some Monitoring Stations ........................................... 28
Table 12 Some of the Contaminants and Affected Districts ................................................................................. 28
Table 13 Groundwater Withdrawal Limit for Different Categories ...................................................................... 33
Figures
Figure 1 Supply Chain Components for Textile Industry ....................................................................................... 13
Figure 2 Growth of state GDP (in %) of Haryana in comparison to India .............................................................. 14
Figure 3 Share of industrial sector in Haryana state GDP at current prices .......................................................... 14
Figure 4 Increase in Export of Readymade Garments in Haryana ........................................................................ 15
Figure 5 Freshwater availability in India (m3/capita/year) from 1951-2013 ......................................................... 16
Figure 6 Spatial Distribution of Precipitation across the Country ......................................................................... 18
Figure 7 Major River Basins in India ...................................................................................................................... 18
Figure 8 Sectoral Water Demand in India ............................................................................................................. 20
Figure 9 Magnitude of Water Stress at District Level ........................................................................................... 21
Figure 10 Level of groundwater development in India ......................................................................................... 22
Figure 11 Location of Faridabad District on the Map of Haryana State ................................................................ 25
Figure 12 Categorization of Groundwater Blocks as Over Exploited, Critical and Semi-Critical ........................... 25
Figure 13 Groundwater Level of Ballabgarh.......................................................................................................... 26
Figure 14 Water Governance Structure at National Level .................................................................................... 30
Figure 15 Water Governance Value Chain Pertaining to Textile and Leather Industry Water Use in India .......... 31
Figure 16 Governance structure for Haryana ....................................................................................................... 37
Figure 17 Water Governance Value Chain in Haryana .......................................................................................... 38
Figure 18 TUF Scheme Timeline ............................................................................................................................ 41
Figure 19 Understanding Major Implementation Challenges for ZLD in Faridabad-Ballabgarh Cluster ............... 43

8
AbbreviationsAbbreviationsAbbreviationsAbbreviations
BCM billion cubic meter
BOD Biological Oxygen Demand
CETP Common Effluent Treatment Plant
CGWA Central Ground Water Authority
CGWB Central Ground Water Board
CPCB Central Pollution Control Board
CSE Center for Science and Environment
CGWB Central Ground Water Board
CWC Central Water Commission
DO Dissolved Oxygen
ETP Effluent Treatment Plant
GDP Gross Domestic Product
GSDP Gross State Domestic Product
IIPDS
INCCA Indian Network for Climate Change AssessmentGSDP
MSE-CDP Micro and Small Enterprises – Cluster Development Programme
MoEFCC Ministry of Environment, Forest and Climate Change
MoWR Ministry of Water Resources, River Development and Ganges Rejuvination
NAPCC National Action Plan on Climate Change
NWM National Water Mission
NWP National Water Policy
PHED Public Health and Engineering Department of Haryana
SITP Scheme of Integrated Textile Park
SPCB State Pollution Control Board
TUFS Technology Upgradation Fund Scheme

9
Chapter 1Chapter 1Chapter 1Chapter 1 Introduction Introduction Introduction Introduction
1.1.1.1.1.1.1.1. BackgroundBackgroundBackgroundBackground
With over 1.2 billion people or 18% of the world’s population1, India is the second most populated
country in the world and has the potential to be the world’s second largest economy by 2050. This is
a tremendous challenge considering that India has merely 4% of the world’s renewable water
resource. Population increase and economic growth imply greater demands for natural resources
and even greater challenges to deal with increased pollutions and to mitigate environmental
degradation. The Twelfth Five Year Plan (2012-2017) aims to reverse the observed deceleration in
growth and return to nine per cent growth by the end of the period in order to realise the vision of
‘Faster, Sustainable, and More Inclusive Growth’.2
Water risks will largely influence India’s ability to realise its development vision. About 50 per cent of
annual precipitation occurs only in 15 days in a year. Currently, one third of the region lies in water-
scarce areas with water availability of less than 1000 m3/person/year. By 2030, India will face 50%
aggregate gap between water availability and water demand.3 India’s aspired growth will further
strain water availability and brings about further challenges of allocating water among different
types of users. Climate change and variability will render even more erratic distribution of
precipitation over time and region in India and impose higher water-related risks, such as floods,
droughts, and storms. The increasingly scarce resource will make water allocation a very sensitive
issue. If trade-offs are not managed well, increasing conflicts among different groups of water users
can take place.
To a large extent, the mismanagement of water resources has exacerbated the problems of water
scarcity and variability, leading to critical situations in many parts of the country. Leakage and
inefficiencies in the water supply system account for nearly 50 percent of municipal water use. Over
70 per cent of surface and groundwater resources are contaminated.4 Low awareness about water
scarcity and its social economic values as well a lack of a harmornised perspective in planning,
management and the use of water resources underlie this mismanagement.5
Textile industry is one of the oldest as well most important industries in Indian economy. It accounts
for around 2% of GDP, 8% of excise and customs revenue collections, 14% of the industrial
production and 12% of the total manufacturing export earnings. The sector employs nearly 35 million
employees and it is the second-largest employment generating industry in both rural and urban
areas, after the agriculture industry. 6 Since textile industry is highly water intensive and India had
been identified as a highly water scarce region, the long term viability of the Indian textile industry
hinges heavily on sustainable water management in India.
Water governance is the key to ensure that beyond the technical engineering solutions, there exists
supporting systems of coordinated regulations, institutions and incentives to balance various needs
for water.
1.2.1.2.1.2.1.2. ObjectiveObjectiveObjectiveObjective
This report aims to:

10
a) Assess physical and regulatory water risks pertaining to the textile industry in India.
b) Investigate water governance landscape in relation to the textile industry in India.
c) Inform priority areas for the needs of capacity building in sustainable water management in
the textile industry in India.
1.3.1.3.1.3.1.3. Methodology Methodology Methodology Methodology
The information, analysis and recommendation in this report are built on:
a) Comprehensive desk research and data review of international and local sources.
b) Interviews with a number of stakeholders, which include public actors (government agencies,
researchers, experts, and civil societies) as well as private actors (business associations,
suppliers and technology solution providers).
c) Inputs from the stakeholders gathered during the capacity building workshop held on 24 Nov
2016 in new Delhi.
1.4.1.4.1.4.1.4. Focus of the ReportFocus of the ReportFocus of the ReportFocus of the Report
Faridabad-Ballabgarh is one of the three clusters of textile wet processing units in the National
Capital Region (NCR) where STWI projects conduct its work in the first phase. Due to the autonomy
of the state government in India and how the regulation and policies vary across states, this report
needs to have a specific regional focus that is more meaningful for the water governance analysis.
The Faridabad-Ballabgarh cluster in Haryana has been chosen as the focus area due to its industrial
significance to STWI Projects and severe challenges of water issues as follows.
1. STWI has been closely associated with the textile wet processing units in this region in its
earlier phases (SWAR project), which accounted for maximum concentration (almost 60%,
i.e. 11 out of 18 units) of wet processing units in the NCR region.
2. Recent Zero Liquid Discharge (ZLD) policy currently drives action related to efficient water
use and management in the Faridabad-Ballabgarh region.
The ZLD policy, which requires the textile wet processing units amongst others to adopt
practices to ensure complete recycling of the industrial effluent and concentration of the
solute into a solid mass by means of evaporation by December 2016, is a major initiative
taken by the Central Pollution Control Board (CPCB) to regulate pollution and water
abstraction by industries.
Faridabad and Ballabgarh are major industrial towns in Haryana, having almost 1500
registered factories, such as textile manufacturers, fertilizer, electroplating works that mostly
generate hazardous waste. A decline in groundwater level and its pollution are major
problems for the region that needs immediate attention. Pollution of the shallow
groundwater has partly affected the district with high salinity (electrical conductivity
>3000μS/cm at 250C), fluoride (>1.5mg/l), iron (>1.0mg/l), nitrate (>45 mg/l) and lead (above
0.01 mg/l).7 Concentration of heavy metals in this area has been attributed to the discharge
of industrial effluents.8 Two blocks in the Faridabad district have also been notified as semi
critical highlighting the problem of groundwater decline. In response to the current
groundwater overexploitation, the Municipal Corporation of Faridabad and Ballabgarh have
been notified by Central Ground Water Authority (CGWA) to regulate the state of
groundwater development in the district9, which was estimated to be 81% while the
projected demand for domestic and industrial use by 2025 would be 27.46 mcm.10

11
Chapter 2Chapter 2Chapter 2Chapter 2 Textile Industry in IndiaTextile Industry in IndiaTextile Industry in IndiaTextile Industry in India
2.1.2.1.2.1.2.1. India’s Textile IndustryIndia’s Textile IndustryIndia’s Textile IndustryIndia’s Textile Industry
The significance of the Textile IndustryThe significance of the Textile IndustryThe significance of the Textile IndustryThe significance of the Textile Industry
Globally, India is the biggest exporter of yarn in international market and has a share of 25% in the
world yarn export market and has a share of 12% in yarn and textile fiber production in the world.
India has the highest capacity of loom and has a share of 61% in the world loomage. India has seen
the highest growth as the world’s third largest textiles and clothing exporter (after China and EU28)
with 23% growth 2013. 11 Export values of the textile and clothing industry has grown rapidly in the
past 15 years from US$ 10.33 billion in 2000 to US$ 36.08 billion in 2014, contributing to 11.2% to the
national total merchandise exports.12
A number of factors that make India outshine in textile industry are low cost skilled manpower,
availability of cheap raw material, availability of numerous varieties in cotton fiber, a big and
potential national and international market and independent textile industry (Dey and Islam 2015).
Nevertheless, its environmental and social sustainability constitute the key challenges of the
industry. With a long and complicated supply chain, the industry affects the environment adversely
at each stage of the supply chain process. In terms of resource use, freshwater, energy, and other
valuable resources are consumed during the manufacturing process. The most significant effects of
the textile industry to the environment are air and water pollution.
Most of the water used in the manufacturing is returned to nature elsewhere; the demand affects
local availability for other users. In most places where textile production takes place today, the
competition for freshwater between different sectors in society increases rapidly. A large amount of
wastewater is generated especially in the dyeing and bleaching processes resulting in polluted
effluents that often end up in water bodies. The textile sector is one of the major industrial polluters,
especially due to the many micro, small, and medium sized factory units.13
The Outlook for Sustainable Textile Industry The Outlook for Sustainable Textile Industry The Outlook for Sustainable Textile Industry The Outlook for Sustainable Textile Industry
The government aims to increase textile export growth from currently 6-10% to 15-20% by 2019 and
to increase export value of textile and clothing to around US$64 billion by 2017. This goal will be
achieved through a number of key initiatives, such as improving competitiveness by upgrading
infrastructure to increase labour productivity; Integrated Skill Development Scheme for capacity
building of the textile work force; overall development of the industry through e.g. modernisation
and technological upgrade and setting up integrated textile parks. Some incentive schemes have
been established to support those key initiatives, for instance the Technology Upgradation Fund
Scheme (TUFS). In essence, the government puts an emphasis on Skill, Scale and Speed – Make in
India – Zero defect and Zero effect.14
The policy on Zero Liquid Discharge (ZLD) for the textile industry was already started in Tamil Nadu
back in 2008. Many businesses were shut down by the order of the state’s High Court due to their
inability to meet compliance requirements. Surviving businesses set the benchmark on operating

12
with very limited amount of water. ZLD policy has now been expanded to cover nine states along the
Ganges basin and applied to five sectors – textile, pulp and paper, distilleries, tanneries, and sugar –
with varying compliance timeline. For the textile industry, the sector is expected to meet compliance
by December 2016.15 Further details on the ZLD policy are discussed in Chapter 5 on water
governance landscape.
India’s textile sector needs a long term roadmap for sustainable growth and increasing
competitiveness across each part of the textile industry value chain. The national textile policy should
provide such a roadmap and have an integrated policy that improve the competitiveness and remove
barriers across the diverse 113 textile clusters across the country. This competitiveness also entails
environmental sustainability that meets international regulations for export markets as well as
domestic regulatory requirements.
2.2.2.2.2.2.2.2. Textile IndustryTextile IndustryTextile IndustryTextile Industry Water Use In IndiaWater Use In IndiaWater Use In IndiaWater Use In India
TextTextTextTextile Industry ile Industry ile Industry ile Industry as as as as a Large Water a Large Water a Large Water a Large Water User and Pollutant SourceUser and Pollutant SourceUser and Pollutant SourceUser and Pollutant Source
The textile industry is a major contributor of water pollution and is also one of the most water
intensive industries known. This issue of water pollution and scarcity, which tags along with the
process of wet processing in the textile industry, is highlighted in a study by the Centre for Science
and Environment (CSE). The study estimated that the water consumption by the Indian textile
industry alone is about 200-250 m3/ tonne cotton cloth of water in comparison to the global best of
less than 100 m3/ tonne cotton cloth.16 As the textile industry has a fairly complex supply chain, it is
important to understand this supply chain in order to address the water management challenges and
to increase the sustainability of the production line.
In building the awareness regarding cleaner production in the textile industry, CSE has done a
collaboration with the Swedish Environmental Protection Agency (Naturvårdsverket). This
collaboration entails capacity building programme of government officers on environmental
governance and producing a film on the Swedish experience in shifting to environmental-friendly
textile production.i
The production of finished textile product from fibre involves a long, complicated process comprising
of many processes and different permutation and combination of separate processes. Textiles can be
broadly classified into three groups depending on the end use: 1) fashion and clothing; 2) industrial
and technical; and 3) furnishing and domestic. Textile production can be vertically and horizontally
designed depending on whether all parts of production are done by the one company or different
companies specialized in specific aspects of the production. This specialisation is greatly influenced
by the industrial history and geographical location of the companies.
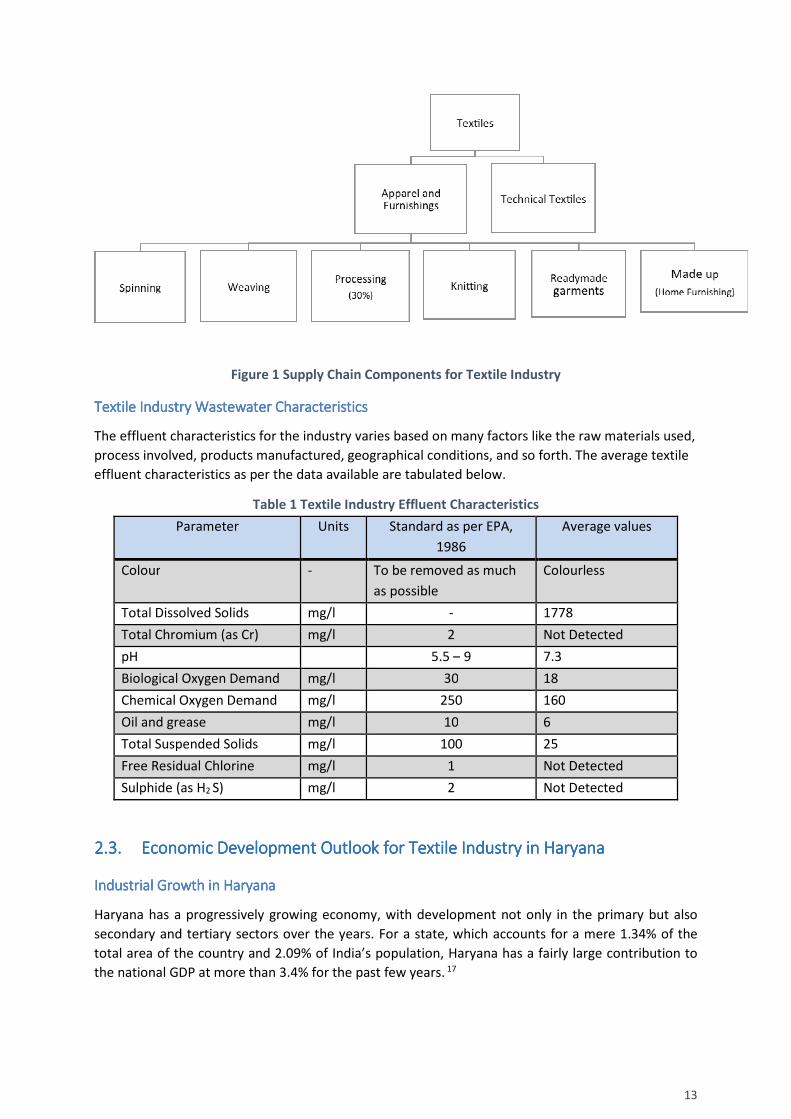
The supply chain for the industry is sketched below. The wet processing unit of the industry is the
most water intensive and has the highest pollution potential. This is the chain that requires most
intervention to improve its water management.
i The film is available at https://youtu.be/DBwhptqEoFY
13
Figure 1 Supply Chain Components for Textile Industry
Textile Industry Wastewater CharacteristicsTextile Industry Wastewater CharacteristicsTextile Industry Wastewater CharacteristicsTextile Industry Wastewater Characteristics
The effluent characteristics for the industry varies based on many factors like the raw materials used,
process involved, products manufactured, geographical conditions, and so forth. The average textile
effluent characteristics as per the data available are tabulated below.
Table 1 Textile Industry Effluent Characteristics
Parameter Units Standard as per EPA,
1986
Average values
Colour - To be removed as much
as possible
Colourless
Total Dissolved Solids mg/l - 1778
Total Chromium (as Cr) mg/l 2 Not Detected
pH 5.5 – 9 7.3
Biological Oxygen Demand mg/l 30 18
Chemical Oxygen Demand mg/l 250 160
Oil and grease mg/l 10 6
Total Suspended Solids mg/l 100 25
Free Residual Chlorine mg/l 1 Not Detected
Sulphide (as H2 S) mg/l 2 Not Detected
2.3.2.3.2.3.2.3. Economic Development Outlook for Textile InEconomic Development Outlook for Textile InEconomic Development Outlook for Textile InEconomic Development Outlook for Textile Industry in Haryanadustry in Haryanadustry in Haryanadustry in Haryana
Industrial Growth in HaryanaIndustrial Growth in HaryanaIndustrial Growth in HaryanaIndustrial Growth in Haryana
Haryana has a progressively growing economy, with development not only in the primary but also
secondary and tertiary sectors over the years. For a state, which accounts for a mere 1.34% of the
total area of the country and 2.09% of India’s population, Haryana has a fairly large contribution to
the national GDP at more than 3.4% for the past few years. 17

14
The state has a substantial presence in terms of industrial growth with more than 1670 large and
medium enterprises that have generated employment for almost 3.36 lakh (336000) people and
around 90,000 Micro and small enterprises providing employment to 8.9 lakh (890000) people.
The state has seen a fairly good economic growth over the years with an Average Annual Growth
Rate of state Gross Domestic Product (GDP) of 7.8% for the year 2014-2015. The industrial sector
contribution to state GDP has also risen over the years, underlining the high potential in Haryana for
industrial growth.
0
2
4
6
8
10
12
2005-06 2006-07 2007-08 2008-09 2009-10 2010-11 2011-12
Pe
rce
nt
Year
India Haryana
Source: Department of Economic and Statistical Analysis, Haryana, 2012
Figure 2 Growth of state GDP (in %) of Haryana in comparison to India
Source: Department of Economic and Statistical Analysis, Haryana
Note: 1 USD taken equal to 67.9 INR
Figure 3 Share of industrial sector in Haryana state GDP at current prices

15
Textile Sector: A Key Engine of GrowthTextile Sector: A Key Engine of GrowthTextile Sector: A Key Engine of GrowthTextile Sector: A Key Engine of Growth in Haryanain Haryanain Haryanain Haryana
Haryana saw a continuous growth in the manufacturing sector as shown by the Index of Industrial
Production (IIP)ii, which in general has increased steadily over the years (Table 2). Even though there
was a decline in textile manufacturing sector in Haryana in 2011 – 2013 as a result of global
slowdown of the industry, the sector picked up the pace and grew at a much faster rate in the last
couple of years.
Table 2 Index of Industrial Production for manufacturing sector with base year 2004-2005
Source: Department of Economic and Statistical Analysis, Haryana
Table 3 Growth of textile manufacturing
Source: Department of Economic and Statistical Analysis, Haryana
The textile industry saw a growth surge in the last few years. Not only did it become an important
contributor in the total growth of the manufacturing sector of the state but it also played a
significant role in the growth of the state economy as a whole. Rising production and exports of
readymade garments resulted in export revenues increased exponentially from 266.21 million USD in
2010-2011 to 492.65 million USD in 2013-2014.
0
500
1000
2008-2009 2009-2010 2010-2011 2013-2014
InmillionUSD
Year
Exportofreadymadegarments(inmillionUSD)
Source: Department of Industries and Commerce, Haryana
Note: 1 USD taken equal to 67.9 INR
Figure 4 Increase in Export of Readymade Garments in Haryana
ii The Index of Industrial Production (IIP) is a key economic development indicator for measuring and analyzing the trend of industrial
production for different sectors like manufacturing, basic goods, electricity, etc. over a period of time with reference to a chosen base year.
It is an abstract representative number to measure the level of industrial performance and the growth of industrial sector in the economy.
It shows the relative change in the volume of industrial production over time and is used by Government Departments, Research Institutes,
Industrial Associations, Academicians, etc. for policy making and research.
Industry group Index
2011-2012 2012-2013 2013-2014 2014-2015
Manufacturing 165.9 173.6 177.8 187.6
Year Annual growth of
manufacturing sector
Growth of textile
manufacturing
2011-2012 3.9% -15.0%
2012-2013 4.6% -10.7%
2013-2014 2.4% 19.5%
2014-2015 5.5% 22.1%

16
Chapter Chapter Chapter Chapter 3333 Water Resources Management in India Water Resources Management in India Water Resources Management in India Water Resources Management in India
Water management in India is intricately woven into the cultural fabric of the country with its social,
economic, political and ecological significance. Factors like caste-class differences, heterogeneity of
farmers as the major sectoral water user, rural-urban dichotomy, and extremely varied ecological
conditions, have often led to water management being a very contentious and tricky affair.18
After its independence, India has made large-scale water investments in water storage that have
contributed considerable to sustain its economy. According to the World Bank19, India has the
capacity to store 200 BCM of water, an irrigated area of 90 Mha, and an installed hydropower
capacity of about 30,000 MW. Nevertheless, rapid development, increasing population and
mismanagement of water has rendered water demand to far outweigh its supply. Per capita water
availability has shown a sharp declining trend, as shown in Figure 5, from 5177 m3/person/year in
1951 to 1820 m3/person/year in 2001, and now it stands at 1170 m3/person/year in 2010. The latest
figure from the World Development Indicator of water availability at 1130 m3/person/year in 2013 is
even lower than the government’s prediction of water availability at 1140 m3/person/year by 2050.
Source: Centre for Science and Environment (2004)20, National Institute of Hydrology (2010)21, World Bank
(2015)22.
Figure 5 Freshwater availability in India (m3/capita/year) from 1951-2013
3.1.3.1.3.1.3.1. Current wCurrent wCurrent wCurrent water resources situationater resources situationater resources situationater resources situationssss
3.1.1.3.1.1.3.1.1.3.1.1. IndiaIndiaIndiaIndia’s’s’s’s Water BudgetWater BudgetWater BudgetWater Budget
The country’s water budget provides an understanding of a portfolio of available freshwater sources
in India. There are two official estimates from the Ministry of Water Resources (MoWR) that differ in
the assumption of evpotranspiration rate: MoWR’s estimate of 40% evapotranspiration rate and the
global evapotranspiration rate of 65%. Both provide more or less similar insight. The first one puts
the annual utilizable water of 1,123 BCM, which is well above the current water use of 634 BCM
according to the Planning Commission (2010); while the second estimate23 gives the utilizable water
at 654 BCM, which is nearly the same as the current water use. These second estimates invoke a
1951 2010 2001 2013
m3/person/year
1961 1971 1981 1991

17
very alarming situation and illustrate a spectrum of water availability that relates to temporal and
spatial variation.
Table 4 India’s Water Budget in BCM
Parameter Analysis Based on Estimates of MoWR Analysis Based on MoWR’s
Estimates on Worldwide
Comparison
Annual rainfall 3,840 3,840
Evapotranspiration 3,840 – (1,869 + 432) = 1,539 (40 per
cent)
2,500 (65 per cent) worldwide
comparison
Surface runoff 1,869 (48,7 per cent) Not used in estimate
Groundwater recharge 432 (11,3 per cent) Not used in estimate
Available water 2,301 (60 per cent) 1,340 (35 per cent)
Utilizable water 1,123 (48,8 per cent of 2,301)24 654 (48.8 per cent of 1,340)
Current water use 634 634
Remarks Current water use is well below utilizable
water
Current water use is very close to
utilizable water
Source: Narasimhan (2008)23; Narasimhan and Gaur (2009)25.
3.1.2.3.1.2.3.1.2.3.1.2. Freshwater ResourcesFreshwater ResourcesFreshwater ResourcesFreshwater Resources
Freshwater resources in India comprise of river systems, groundwater and wetlands, in which each of
them has a unique role and characteristic linkages to other environmental entities.26 Rainfall and
melting glacier are the main sources of supply for India surface water and groundwater resources.
Rainwater
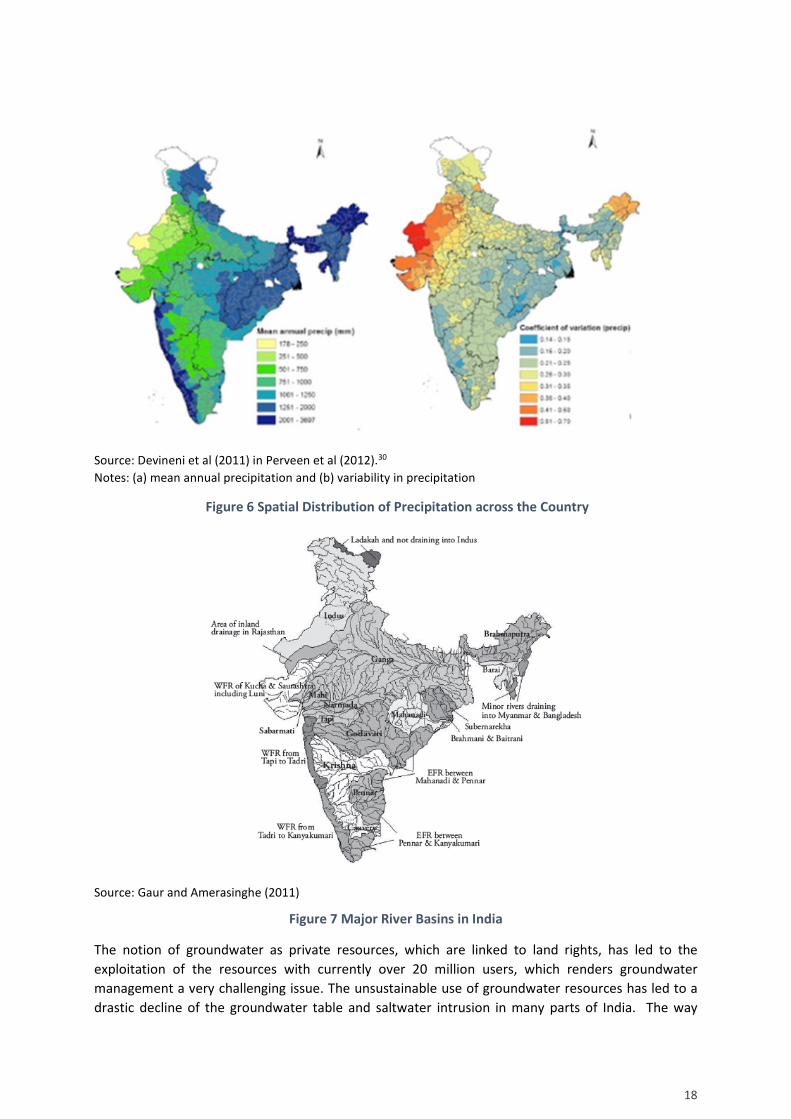
India has the highest long-term average precipitation in the world for its size with 1,160 mm, most of
which occurs during 4-5 months of monsoon season (June to October). There is a high variability of
rainfall across the country with excessive rainfall of 1250-2500 mm in the Western Ghats and the
outer slopes of Himalayas; while arid and semi-arid western and north-western parts have 250-750
mm. The past 100 years meteorological data shows a very significant variation in precipitation across
years and within the year as illustrated in Figure 6. A higher interannual variability is observed both in
areas with very low average annual precipitation, i.e. the north and north-western India, and those
with the highest average annual precipitation, e.g. some parts of Eastern India27. Rainwater
harvesting is increasingly used by the industry to anticipate water cuts during shortages.
Surface water
Surface water system in India comprises of 20 major river basins (Figure 7), with seven rivers and
their tributaries feeding into these river basins. Thirteen of them are large basins with an aggregate
catchment area of 2.6 million km2 and covering 81 per cent of the country. Fourteen of these 20
river basins are already water-stressed. 28
Groundwater
India is the largest consumer of groundwater in the world with an estimated water use of
230 billion m3/year, of which about 90% is for irrigation and the rest for industrial and domestic
purposes. As the main source of water supply for more than 60% of irrigated agriculture and 85 per
cent drinking water, groundwater is very important for rural communities. The urban and industrial
reliance on groundwater is also increasing over time.29 Most textile units rely on groundwater use,
either through own wells or water tank sellers.
18
Source: Devineni et al (2011) in Perveen et al (2012).30
Notes: (a) mean annual precipitation and (b) variability in precipitation
Figure 6 Spatial Distribution of Precipitation across the Country
Source: Gaur and Amerasinghe (2011)
Figure 7 Major River Basins in India
The notion of groundwater as private resources, which are linked to land rights, has led to the
exploitation of the resources with currently over 20 million users, which renders groundwater
management a very challenging issue. The unsustainable use of groundwater resources has led to a
drastic decline of the groundwater table and saltwater intrusion in many parts of India. The way

19
India will manage its groundwater resource will clearly have serious implications for the future
growth and development of the water resources, agriculture, and food sectors in India, as well as the
alleviation of poverty.
3.2.3.2.3.2.3.2. Key Impacts of Climate Change to India’s Water ResourcesKey Impacts of Climate Change to India’s Water ResourcesKey Impacts of Climate Change to India’s Water ResourcesKey Impacts of Climate Change to India’s Water Resources
There are numerous existing studies on the impacts of climate change on water resources in India
and how it affects human lives, such as vulnerability assessment in Ganges basin31 and the
assessment of adaptation options and socio-economic consequences of climate-induced flood risks in
Mumbai32. The National Water Mission (NWM), as one of the eight missions within the India’s
National Action Plan on Climate Change (NAPCC) that focuses on adaptation, has identified the key
effects of climate change to India’s water resources: a decline in the glaciers and the snowfields in
the Himalayas, increased drought like situations due to overall decrease in the number of rainy days,
increased flood events due to the overall increase in the rainy day intensity, effects on groundwater
quality in alluvial aquifers due to increased flood and drought events, influence on groundwater
recharge due to changes in precipitation and evapotranspiration, and increased saline intrusion of
coastal and island aquifers due to rising sea levels 33:
The Himalayas provides freshwater resources to India’s three main river basins (the Indus,
Brahmaputra and Ganges) and its water yield per unit area from the region is double that from the
peninsular systems34. The Indian Network for Climate Change Assessment (INCCA) predicts an
increase of annual temperature from 0.9+0.60C to 2.6+0.70C by 2030, resulting in increased water
yield in the Himalayan region while the glacier remains, especially for Indus basin by 5-20%, which
will be good for water supply and hydropower but aggravate flood risks.35 Predicted changes in
precipitation pattern across the country highlights the fact that climate variability will impose newer
future challenges. For example, the shifts in southwest monsoon system in India can imply
catastrophic effects in the form of floods, droughts and famines. Eventually, these hazards will
increase the vulnerability of the communities through ecosystem degradation, reductions in water
resources and food availability, and changes in livelihoods36. The main challenges for the water sector
is to build the resilience to the increasing climate variability.
Coastal aquifers in India already experience degrading water quality due to pressure from
anthropogenic activities, such as high population, intense land-based activities, overexploitation of
freshwater aquifers, and lack of sustainable water management system. Salinity ingress is taking
place in Tamil Nadu and Saurashtra, while inland salinity takes place in Rajashtan, Haryana, Punjab
and Gujarat. Predicted sea level rise will exacerbate salt water intrusion.
In view of those impacts, the NWM identifies five main goals: 1) comprehensive water data base in
public domain and assessment of impact of climate change on water resource; 2) promotion of
citizen and state action for water conservation, augmentation and preservation; 3) focused attention
to over-exploited areas; 4) increasing water use efficiency by 20%; and 5) promotion of basin level
integrated water resources management.
The NWM undertakes critical action points and timeline for each of the goal above and the latest
timeline was scheduled in 2017 for rainwater harvesting and groundwater recharge programme,
under goal (3). The critics underscored lack of attention to water sector in NAPCC compared to the
energy sector. Moreover the goals have insufficient targets and actually require a significant
paradigm shift in the institutional mechanism of how water resources are governed in India at
different levels. Considering the vast geographical and socioeconomic profile across the region, the
necessary adaptive decision making processes prove to be very challenging.

20
Chapter 4 Physical water risk outlook of the textile and leather industry Chapter 4 Physical water risk outlook of the textile and leather industry Chapter 4 Physical water risk outlook of the textile and leather industry Chapter 4 Physical water risk outlook of the textile and leather industry
4.1.4.1.4.1.4.1. Physical Water Risks in IndiaPhysical Water Risks in IndiaPhysical Water Risks in IndiaPhysical Water Risks in India
4.1.1.4.1.1.4.1.1.4.1.1. The Growing Water Supply DThe Growing Water Supply DThe Growing Water Supply DThe Growing Water Supply Demand Gap in Indiaemand Gap in Indiaemand Gap in Indiaemand Gap in India
Water is a scarce resource for a lot of regions in India. The most serious concern is the growing
population to 1.66 billion by 2050 that will increase the demand for food, energy and water. The
main official estimates in water demand are provided by the Sub-committee of the Ministry of Water
Resources (MoWR) and the National Commission on Integrated Water Resources Development
(NCIWRD). The estimates provide consistent insights regarding the trends of water demand. MoWR
estimates in Figure 8 shows that by year 2050 India needs to increase water supply by 5 times to
industries (from 12 BCM to 62 BCM) and by 16 times for energy production (from 5 BCM to 130
BCM), while its drinking water demand will double (from 56 BCM to 102 BCM) and irrigation demand
will rise by 50 percent (from 688 BCM to 1072 BCM). The proportion of water use for the industry,
energy production, and other uses altogether will be more than doubled, while agricultural water use
will be reduced by 15%. This national context is important is India’s government plays more active
role in re-allocating water across states to address scarcity issue.
Source: Government of India (2006) cited in ADB (2009)37
Figure 8 Sectoral Water Demand in India
Meanwhile, declining availability of freshwater resources at a much faster rate than predicted (Figure
5), resulting in an increasing gap between future water demand and water availability. The demand-

21
supply gap at the basin level according to 2030 Water Resources Group indicate that merely a few
basins will experience surplus, while the rest of the basins will mostly have moderate (0-20%) or
severe (20-80%) scarcity gap.3 Climate-induced water variability adds further water stress across
spatial and time scale, especially at the district level. A study by the Columbian Center for Water
produces water stress index that takes into account the variations of water demand and renewable
water supply within and across the year (Figure 9). Considering increased competition of water use
across sectors and different policy across states, this information will be most meaningful for the
industry at a district level to better anticipate and manage water risks within a year and overtime.27
Source: Devineni, Perveen, and Lall (2011)27
Figure 9 Magnitude of Water Stress at District Level
4.1.2.4.1.2.4.1.2.4.1.2. India’s Declining Water TableIndia’s Declining Water TableIndia’s Declining Water TableIndia’s Declining Water Table
In India, groundwater data collection and analysis is done by the Central Ground Water Board
(CGWB) at the national level and similar organizations at the state level. Monitoring is usually done
on the basis of blocks, local-level administrative units between the panchayat (local government)
level and the major districts into which each state is subdivided.38 Out of a total of 5842
administrative units or block (2009 data), only 73.2% is safe or sustainable, 13.7% is overexploited
and the rest are critical or semi critical. Complete saline groundwater was observed in 71 units.
The stage of groundwater developmentiii increased to 61% in 2009 from 58% in 2004 depicting
increasing pressure on the groundwater resources39. The Indus-Ganges-Brahmaputra basin, covering
the states of Punjab, Haryana, Uttar Pradesh, Bihar, West Bengal and North Eastern Valley, has a
relatively high replenishable groundwater recharge of 0.25m to more than 0.5m.39 However,
unprecedented exploitation has caused the development status to be higher than 100%, implying
much higher annual groundwater abstraction than the recharge rate. As a result, the groundwater
tables decline by 0.4m a year according to Delhi Jal Board, which is responsible for water supply.
iii Stage of groundwater development is defined as the annual gross groundwater draft divided by the net
annual groundwater availability. http://planningcommission.gov.in/aboutus/committee/wrkgrp12/wr/wg_susgm.pdf

22
Source: Groundwater Year Book, CGWB, 2013-2014
Figure 10 Level of groundwater development in India
4.1.3.4.1.3.4.1.3.4.1.3. Water PWater PWater PWater Pollution at the National Levelollution at the National Levelollution at the National Levelollution at the National Level and Gangesand Gangesand Gangesand Ganges BasinBasinBasinBasin
Water pollution is a major concern for India where over 70% of rural water consumed does not meet
the WHO standards contributing to almost 80% of rural illnesses and 20% deaths among children age
up to 5 years are. Within the urban contexts, the main sources of water pollution are untreated
industrial and domestic wastewater discharge and overuse of fertilizer. Only 31% of the total sewage
water generated in 23 major cities is treated and the rest is disposed of into 18 major rivers.40 Rising
water demand for industrial and energy due to rapid industrialisation will give rise to wastewater
discharge and its associated potential surface and ground water pollution.41
CPCB monitors the water quality in the country under the National Water Quality Monitoring
Programme through different monitoring units. This monitored data is analysed and categorized
according to priority depending on the BOD levels at the monitoring stations.
The Ganges basin is the world’s largest and most populous river basin that covers 9 states in India,
(including Haryana), Bangladesh, Nepal and Bhutan. Water quality monitoring of the Ganges Basin is
conducted by the State Pollution Control Boards of Uttarakhand, Uttar Pradesh, Bihar, West Bengal,
Haryana, Himachal Pradesh, Rajasthan, Madhya Pradesh, Jharkhand, Central Pollution Control Board,
Central Ground Water Board and the Central Water Commission.
Degraded Surface Water Quality of Ganges and its Tributaries
Total industrial water consumption in the Ganges basin is about 1123 MLD with wastewater
generation as high as 45% (501 MLD) of the total water consumed42. The Ganges basin has 110 water
quality monitoring stations of which 39 are along the main stream of Ganges and the rest are along
the tributaries and sub-tributaries. Central Water Commission (CWC) stations carry out either

23
monthly or quarterly observations for 68 parameters of surface water quality, while CPCB observes
six quality parameters (pH, conductivity, Dissolved Oxygen or DO, Biological Oxygen Demand or BOD,
total coliform and fecal coliform) at 233 locations. The monitoring results in 2009 show that organic
pollution persists to be the predominant pollutant as indicated by high BOD and conductivity values.
Table 5 Places on the Ganges Basin which do not meet the criteria set by CPCB
Parameter Desired range Observed range Places not meeting criteria
pH 6.5 – 8.5 6.5 – 8.9 Varanasi, Chapra, Rishikesh, Haridwar,
Kannauj, Indrapuri, Bithoor, Trighat and
Kanpur
DO More than 4mg/l 4.3 – 9.2 mg/l Kanpur, Varanasi, Dakshineshwar, Haridwar,
Bithoor, Kannauj etc.
BOD <3mg/l 0.2 – 16.0 mg/l Kanpur, Varanasi, Dakshineshwar, Haridwar,
Bithoor, Kannauj etc.
Conductivity 2250 μmhos/cm 68-4460 μmhos/cm Criteria not met for irrigation
Fecal
Coliform
2500 MPN/100ml 0-400000
MPN/100ml
Criteria not met for bathing- Dakshineshwar,
Howrah-Shivpur and Garden Reach, Palta,
Serampore, Uluberia and Diamond Harbour,
Varanasi, Bhagirathi with Alaknanda at
Devprayag, Mandakini Alaknanda at
Rudraprayag
Source: Ministry of Water Resources, 2014.
Deteriorated Groundwater Quality of Ganges Basin
There are 571 groundwater quality monitoring sites according to India-WRIS database in 124 districts
of the 10 states under the Ganges basin, with 47 sites in Haryana. Groundwater quality is annually
monitored by the Central Ground Water Board (CGWB) and hotspots are identified based on six
parameters: salinity (EC>3000 micro simen/cm), chloride, fluoride (>1.5 mg/l), iron (>1.0 mg/l),
arsenic (>0.05 mg/l) and nitrate (>45 mg/l).
According to the CGWB, the Ganges basin is severely affected by arsenic, fluoride, nitrate, chloride
and salinity. Haryana has higher than permissible levels of salinity, chloride, fluoride and nitrate.
Salinity hotspots in Haryana are Faridabad, Gurgaon, Jhajjar, Panipat, Rewari, Rohtak, Sonepat
districts of Haryana. Nitrate is the most common contaminant of ground water43 and can cause
serious health issues.
4.1.4.4.1.4.4.1.4.4.1.4. Sub Optimal Performance of CSub Optimal Performance of CSub Optimal Performance of CSub Optimal Performance of Common ommon ommon ommon EEEEffluent ffluent ffluent ffluent TTTTreatment reatment reatment reatment PPPPlantlantlantlants s s s
Considering the high capital and operating cost of an effluent treatment plant (ETP), low investments
access for small and medium enterprises and the increasing need to combat industrial pollution, the
Ministry of Environment, Forest and Climate Change (MoEFCC) produced a directive for state
governments to examine possible locations for common effluent treatment plant (CETP). The state
governments then identified locations for CETP. This CETP was expected to provide the most
appropriate solution to the issue at hand, yet it has not been a very successful model as expected.
Until 1990 India had just one Common Effluent Treatment Plant (CETP) in Jeedimetla, near
Hyderabad. This number rose to 150 by 2011. The distribution of these CETPs across India is shown in
Table 6. Eventhough these CETPs were built and even upgraded to the best available technology, the
CPCB study of 78 operating CETPs in 2005 (Table 7) showed unsatisfactory performance for many of

24
them. The sub-optimal performance of the CETPs could be attributed to the poor operation and
maintenance. Furthermore, high TDS content in the influent compromised the efficiency of CETPs.44
Table 6 The Distribution of CETP and Its Capacity
No. State CETPs in
2005
Combined
capacity
(in MLD)
CETPs in
2011
Combined capacity
(in MLD)
1. Andhra Pradesh 3 12.75 4 13.5
2. Delhi 11 133.20 13 211.8
3. Gujarat 16 156.30 261 374.0
4. Haryana 1 1.10 9 48.3
5. Karnataka 2 1.30 7 7.0
6. Maharashtra 11 63.25 252 186.9
7. Madhya Pradesh 1 0.90 1 0.9
8. Punjab 2 1.54 5 6.9
9. Rajasthan 8 57.70 11 117.2
10. Tamil Nadu 29 71.15 44 148.0
11. Uttar Pradesh 3 44.40 7 56.3
12. West Bengal 1 10.00 1 20.0
13. Total 88 559.77 153 1191.0
Source: Central Pollution Control Board.
Table 7 The Summary of the 78 CETPs Assessed by CPCB
State
Number
of
CETPs
assessed
by CPCB
CETPs complying pH, BOD,
COD, TSS and TDS standards
CETPs complying pH, BOD, COD and TSS
but not complying TDS standard
Number Name Number Name
Andhra Pradesh 2 0 0
Delhi 10 3 Mayapuri, GTK,
Badli
6 Wazirpur, Mangolpuri,
Jhilmil,
SMA, Nangaloi, Okhla I.A
Gujrat 15 0 2 Ankleshwar, Sachin
(0.5MLD)
Haryana 1 0 Kundli-I 0
Karnataka 2 0 1 Pai&Pai
Maharashtra 9 0 3 Thane-Belapur, Ambernath,
PatalGanges
Madhya Pradesh 1 0 0
Punjab 1 1 Phillore 0
Rajasthan 5 0 1 Jodhpur**
Tamil Nadu 29 0 2 Thiruvai Karur***, TALCO
Ambur Thuthipet
Uttar Pradesh 3 0 0
Total 78 5 (6.4%) 15 (19.2%) *TDS not determined but likely to be within limits; **CETP was under trial; TDS not determined but Cl exceeded; ***TSS not determined
Source: Central Pollution Control Board, 2005

25
4.2.4.2.4.2.4.2. PhPhPhPhysical Water Risks in ysical Water Risks in ysical Water Risks in ysical Water Risks in the State of Haryanathe State of Haryanathe State of Haryanathe State of Haryana
4.2.1.4.2.1.4.2.1.4.2.1. Increasing Water Increasing Water Increasing Water Increasing Water Supply Supply Supply Supply Demand Gap at the State LevelDemand Gap at the State LevelDemand Gap at the State LevelDemand Gap at the State Level
The state of Haryana spread over an area of 44,212 square km is majorly an agricultural state.
However, the development of secondary and tertiary sector has risen over the decades and thus
increasing the stress on its water resources. The state has an average rainfall of 615 mm, 9.31 BCM of
annual replenishable groundwater resource and net annual groundwater availability of 8.63 BCM.
The rate of groundwater abstraction is much higher than the rate at which it is replenished. The
stage of groundwater development is 127% as per the CGWB report of 2013-2014. The 55 blocks
were notified as over exploited, 11 blocks as critical and 5 blocks as semi critical, underlining the
problem of overexploitation of the groundwater resource and the increasing gap between water
supply and demand in the state.9 The projected demand for industrial and domestic water use by
2025 as per reports is 0.79 BCM.39
Figure 11 Location of Faridabad District on the Map of Haryana State
Figure 12 Categorization of Groundwater Blocks as Over Exploited, Critical and Semi-Critical

26
Faridabad and Ballabgarh are major industrial towns in Haryana, having almost 1500 registered
factories like textile manufacturers, fertilizer, electroplating works, etc., of which many generate
hazardous waste. Decline in the groundwater level and its pollution are major problems for the
region, which needs immediate attention. STWI Projects in particular has been closely associated
with the textile wet processing units in this region in its earlier phases through the SWAR project.
Almost 60% (11 out of 18) of the participating factory units within SWAR Project are wet processing
units in the NCR region. Therefore, the Faridabad- Ballabgarh cluster in Haryana been chosen as the
focus area for the purpose of the study for the industrial water governance project.
Faridabad district, with two blocks notified as semi critical has a major problem of groundwater
decline plaguing it. In response to the current overexploitation in the region, Municipal Corporation
of Faridabad and Ballabgarh have been notified by CGWA to regulate the state of groundwater
development. The annual replenishable ground water resource of Faridabad as on 2011 was
202.28 mcm. The stage of groundwater development in the district was estimated to be 81% and the
projected demand for domestic and industrial use upto 2025 was reported to be 27.46 mcm.9
Table 8 The groundwater resource development potential of Faridabad district of Haryana
Block Net annual
ground-
water
availability
(BCM)
Existing
gross
ground-
water draft
for all uses
(BCM)
Existing gross
ground-
water draft
for irrigation
(BCM)
Provision for
domestic and
industrial
requirement
supply to 2025
(BCM)
Net annual
groundwater
availability for
future
irrigation
development
(BCM)
Stage of
ground-
water
development
(%)
Category
Ballabgarh 0.10004 0.07493 0.07759 0.00453 0.02058 78 Semi-critical
Faridabad 0.10224 0.06625 0.08591 0.02293 0.01306 84 Semi-critical
Total 0.20228 0.14118 0.16350 0.02746 0.03364 81
Source: Central Ground Water Board, 2011
Source: India Water Tool
Figure 13 Groundwater Level of Ballabgarh
Irrespective of the increasing gap between the supply and demand for water, not much increase in
the pricing of water by the Public Health and Engineering Department has been seen. The industrial
water supply rate has increased merely from 0.05 USD/ kl in 2006 to 0.06 USD/ kl. The wastewater
disposal charges in 2006 were 0.02 USD/kl (wastewater discharge was taken to be 70% of the water
consumed), which was changed to 25% of the total water charges. Considering substantial increase in
water demand for industrial use, it is necessary to have a revision of water pricing.

27
4.2.2.4.2.2.4.2.2.4.2.2. Increasing Water Pollution Problem of HaryanaIncreasing Water Pollution Problem of HaryanaIncreasing Water Pollution Problem of HaryanaIncreasing Water Pollution Problem of Haryana
Apart from water availability, the problem of water pollution also plagues the industrial belt of
Haryana. Haryana state has three river stretches falling under priority 1 and one stretch each under
priority 3 and 5.45 Priority level of river stretches is set by CPCB based on the risk defined as a product
of frequency of violation of criteria and magnitude. The degree of violation is with respect to water
quality criteria for drinking water source with conventional treatment with respect to BOD.
Table 9 Categorization of Polluted Stretches of River in Haryana according to the BOD Level
River Polluted stretch Source/town Monitoring location BOD
(mg/l)
Polluted River Stretches: Priority 1 (BOD>30mg/l and BOD exceeding 6mg/l on all occasions )
Ghaggar
Interstate border of
Punjab &
Haryana to Ottu
wier at Sirsa
Industrial &
Municipal waste
from Patiala,
Derabassi, Sirsa
1. Before Ottu Weir (Before Mixing of Satluj
Canal Water)
50
2. Gh-1 At Road Brdg. Sirsa,Debwali
Road
33
3. Gh-2 At Chandarpur Syphon 40
4. Near Bankarpur, Dera Bassi 22
5. U/S Dhakansu Nallah 21
Markanda
Kala Amb to
Narayan Garh
Industrial &
Domestic waste
from Kala Amb
1.Kala Amb D/S
590
Western
Yamuna Canal
D/s of Yamuna
Nagar
Yamuna Nagar
Industrial &
Domestic
wastewater
1. 100 meter D/s after receiving
Industrial & Sewage effluent
247
2.At Damla d/s of Yamuna Nagar 188
Polluted river stretches: Priority 3 (BOD between 10 & 20 mg/l and BOD exceeding 6mg/l on all occasions)
Gurgaon
Canal
D/s of Delhi
Delhi
1. GC-1 Near Badarpur Border
24
Polluted river stretches: Priority 5 (BOD between 3 & 6 mg/l)
Yamuna
Kalanaur to Sonepat
- 1. Hathnikund 3
2. At Kalanaur 4
3. At Sonepat 5
4. U/s Paonta Sahib 3
Source: Central Pollution Control Board
River stretches having BOD more than 30 mg/l and more than 6 mg/l on all occasions is categorized
as priority 1 because the associated risk is the highest. BOD of 30 mg/l is the criteria for sewage
treatment plant and in the river without dilution. BOD beyond 6 mg/l greatly reduces the DO level
and BOD greater than 5 mg/l forms complex chemicals on chlorination for municipal water supplies,
thus the associated rivers are considered as high risk zones. Priority 3 has relatively less risk because
the BOD ranges between 10 and 20 mg/l and exceeds 6mg/l on all occasions. Priority 5 is considered
to have the least risk because the BOD level is much lower than the rest and only the areas having
BOD greater than 3mg/l and less than 6 g/l.
River Yamuna is one of the most important tributaries of Ganges, having a catchment of 21265 km2 in
Haryana state alone. Almost 500 km stretch of this river is in deteriorated condition and unsuitable
for designated best use.

28
Table 10 Observations for river Yamuna
Parameter Value
pH 7.0-9.4
Conductivity 80-3040 μmhos/cm
DO 0.0-17.9 mg/l
BOD 0.2-103 mg/l
Fecal coliform 9- 21, 00,00,00,00 MPN/100ml
Total coliform 4- 23,00,00,00,000 MPN/100ml
Source: Ministry of Water Resources, 2009
Table 11 The Surface Water Quality Level in Haryana at Some Monitoring Stations
Parameter Value
Gurgaon canal
upstream
Gurgaon canal
downstream
Yamuna river u/s at
Manjhawali village
Fecal Coliform (MPN/100ml) 1100 1400 1700
Total Coliform (MPN/100ml) 3300 5000 7000
Dissolved Oxygen (mg/l) 1.6 1.2 2.3
Biochemical Oxygen Demand (mg/l) 2.04 2.95 1.82
Conductivity (microsiemens/cm) 922 952 1214
pH 7.04 7.08 7.17
Sodium Absorption Ratio 2.3 2.12 2.26
Chemical Oxygen Demand (mg/l) 98 112 134
Source: India Water Tool, 2013
The groundwater quality is also a grave problem with salinity, high fluoride, and arsenic as the major
concern for the state.9
Table 12 Some of the Contaminants and Affected Districts
Contaminants Districts affected (in part)
Salinity (EC > 3000µS/cm at 250C) Bhiwani, Faridabad, Gurgaon, Hissar, Jhajjar, Jind, Kaithal,
Mahendergarh,Palwal, Rohtak, Sonepat and Sirsa
Fluoride (>1.5mg/l) Bhiwani, Faridabad, Gurgaon, Hissar, Jind, Kaithal, Panipat, Rewari, Sirsa
and Sonepat
Arsenic (above 0.05mg/l) Ambala, Fatehabad, Karnal, Sonepat, Mewat
Iron (>1.0mg/l) Ambala, Bhiwani, Faridabad, Fatehabad, Gurgaon, Hissar, Jhajjar, Jind,
Sonepat, Sirsa and Yamunanagar,
Nitrate (>45 mg/l) Bhiwani, Faridabad, Gurgaon, Hissar, Jhajjar, Jind, Kaithal, Mahendergarh,
Palwal, Sirsa and Sonepat
Heavy metals:
Lead (above 0.01 mg/l)
Cadmium (Above 0.003mg/l)
Lead: Bhiwani, Faridabad, Fatehabad, Gurgaon, Hissar, Jhajjar, Jind, Kaithal,
Karnal, Mahendergarh, Panchkula, Rewari, Rohtak,Sonepat and Sirsa
Cadmium: Gurgaon, Jhajjar, Jind, Rohtak
Source: Central Ground Water Board
4.3.4.3.4.3.4.3. Perception on Physical Water RiskPerception on Physical Water RiskPerception on Physical Water RiskPerception on Physical Water Risk
Faridabad and Ballabgarh regions of Haryana are major industrial towns and hence significant
consumer of water and primary sources of pollution in the area. CKinetics estimates that the textile
wet processing units in the Faridabad-Ballabgarh cluster alone consumes 200 MLD46 of water and the
major physical water risks associated with the region are both water scarcity and quality.

29
Decline in groundwater level and its pollution have become the main concern for the region.
Depleting groundwater level was unanimously stated as one of the greatest challenges for the textile
industry. It also degrades the quality of the groundwater, which then increases the challenge for the
water intensive industry. The declining groundwater table also increases abstraction and processing
cost for the industry.
The indiscriminate disposal of waste in the last decade by the industry has brought about the
deterioration of water. Pollution of the shallow groundwater is the reason for high concentration of
fluoride, chloride, sulphate, nitrate in most parts of the region. Concentration of heavy metals in this
area is attributed to the discharge of industrial effluents and needs immediate attention.47 The three
primary reasons that has brought about deterioration of water quality are:
a) The under capacity of the installed Effluent Treatment Plants (ETP)
b) The lower operation of ETP than as prescribed.
c) Unavailability of skilled labour.
The Faridabad-Ballabgarh region in Haryana suffers from the problem of very high Total Dissolved
Solids (TDS) value. The high TDS levels of the region drives the industries to depend greatly on
tankers for water availability. The TDS in the region is in the range of 2500-3000 mg/l, while the
water supplied by the tankers has TDS value of about 1000 mg/l. The maximum TDS allowed for the
operation of the boiler is 200 mg/l, for which the industries need to depend on RO systems with an
efficiency of about 50%. It implies that 50% of the water fed into the RO system is discarded and due
to its high TDS value it cannot be used for other purposes. The majority of the industries in this
region partly or completely depend on tankers for water supply. The water is purchased at the rate
of about 8.84 USD/ 12 kl, which acts as an incentive to minimize the amount of water used.
Driven by the ZLD policy, the region is currently motivated to take up measures to ensure that toxic
waste from the industries does not further degrade the streams, rivers and other water bodies.

30
Chapter 5Chapter 5Chapter 5Chapter 5 Water Governance Landscape Pertaining to Textile IWater Governance Landscape Pertaining to Textile IWater Governance Landscape Pertaining to Textile IWater Governance Landscape Pertaining to Textile Industryndustryndustryndustry
5.1.5.1.5.1.5.1. National Level Policy Landscape of Water GovernanceNational Level Policy Landscape of Water GovernanceNational Level Policy Landscape of Water GovernanceNational Level Policy Landscape of Water Governance
The management of water resources is a matter of proper implementation of rules, processes and
practices and hence requires good governance. Water governance in India is managed by different
ministries and their subordinate bodies to ensure that the society’s use of water resources does not
compromise water security. The main government bodies involved in establishing policies in relation
to water governance is mapped below.
Source: Government of India
Figure 14 Water Governance Structure at National Level
Each of those regulatory bodies play crucial roles in the value chain of water governance to ensure
sustainable development of the textile industry by means of various laws, regulations and initiatives
which can be delineated as below. These value chains of textile water use entail water allocation to
the industry; water abstraction or water use permits and pricing by companies; water savings or
water use efficiency in the production process; water pollution prevention and control, including
permits and pricing, water reuse and return flow to water environment.

31
Source: Government of India
Figure 15 Water Governance Value Chain Pertaining to Textile and Leather Industry Water Use in India
Key actor
Central Ground Water Board
(Ministry of Water Resources,
River Development and Ganges
Rejuvination),
Ministry of Urban Development
Central Ground Water Board
(Ministry of Water Resources,
River Development and Ganges
Rejuvination)
Industries,
Ministry of Textiles
Central Pollution Control Board (Ministry of Environment, Forest and Climate Change)
Roles Central Ground Water Board:
1) To Issue No Objection
Certificates (NOC’s) for
groundwater abstraction by
industry or process
Ministry of Urban Development:
To supply water (subject to
water planning by Ministry of
Water Resources, River
Development and Ganges
Rejuvenation)
To Issue NOC’s before
establishment of an industry or
process for withdrawal of
ground water
Industries:
1) To adopt water efficient
technologies
Ministry of Textiles:
1) To assist textile industries to
upgrade to water efficient
technologies
1) To plan and execute programmes for prevention and control of water pollution.
2) To provide technical assistance to the State Boards.
3) To prepare guidelines, codes and manuals relating to treatment and disposal of effluents.
4) To set norms for water use and waste water discharge by industries.
Laws/
regulations
1) National Water Policy, 2012
1) National Textile policy, 2000
1) The Water (Prevention and Control of Pollution) Act, 1974
2) The Water (Prevention and Control of Pollution) Cess Act, 1977
Initiatives
1) Technology Upgradation
Fund Scheme
(TUFS, RRTUFS, ATUFS)
1) Integrated Processing Development Scheme
(IPDS)
2) Zero Liquid Discharge (ZLD)
3) Scheme of Integrated Textile Parks
(SITP)
4) Micro and Small Enterprises – Cluster Development Programme
(MSE-CDP)
5) National Water Quality Monitoring Programme

32
5.1.1.5.1.1.5.1.1.5.1.1. Key Actors and Their RolesKey Actors and Their RolesKey Actors and Their RolesKey Actors and Their Roles
A. A. A. A. Ministry of Environment, Forest and Climate Change (MoEFCC)Ministry of Environment, Forest and Climate Change (MoEFCC)Ministry of Environment, Forest and Climate Change (MoEFCC)Ministry of Environment, Forest and Climate Change (MoEFCC)
The Ministry of Environment, Forest and Climate Change (MoEFCC) is the nodal agency in the
administrative setup of the Government of India with the key responsibilities of overseeing the
proper planning and implementation of the country’s environmental and forestry related policies and
programmes. Under the principle of sustainable development, the Ministry works for the
enhancement of social wellbeing and animal welfare. The ministry primarily aims at the conservation
of natural resources of the country, such as rivers, lakes, biodiversity and prevention and control of
pollution by the use of environmental audit, natural resource accounting, command and control
measures, voluntary regulations, awareness drives and fiscal methods. The focus of the various
programmes and schemes of the Ministry is on pollution prevention and control as well as the
promotion of clean and low waste technologies, waste minimization, reuse and recycling,
improvement of water quality, institutional and human resource development, etc.48
Central Pollution ControlCentral Pollution ControlCentral Pollution ControlCentral Pollution Control BoardBoardBoardBoard
The Central Pollution Control Board (CPCB) under the MoEFCC was constituted under the Water
(Prevention and Control of Pollution) Act, 1974. Additional responsibilities was established related to
air pollution control in 1981. The umbrella legislation Environment (Protection) Act, 1986 further
widened the scope of action of the CPCB. The key roles of the CPCB in relation to water are as
follows:
a) Advisory on matters relating to the prevention and control of pollution and restoration of the
quality of water and Coordinate the activities of the boards at the state level and resolve disputes
amongst them.
b) Monitoring and regulation of water pollution prevention and control, e.g. by establishing and
modifying standards for wells or streams.
c) Training and capacity building, i.e. through technical guidance and all types of assistance for the
state boards; prepare guidelines and manuals on treatment of effluents; plan and organize
nationwide programmes; conduct mass awareness campaign; and collate and publish technical
and statistical data on water pollution.49
National River Conservation Directorate National River Conservation Directorate National River Conservation Directorate National River Conservation Directorate
The National River Conservation Directorate (NRCD) under the MoEFCC has the responsibility of
improving river water quality by implementation of River Action Plans in the polluted stretches of the
river. NRCD is also responsible for the implementation of the centrally sponsored scheme of National
River Conservation Plan (NRCP) and National Plan for Conservation of Aquatic Eco-systems (NPCA).50
The NRCP was launched in 1985 as the Ganges Action Plan (GAP) Phase I with the primary aim to
prevent the pollution and improve the quality of the Ganges. GAP Phase II approved Yamuna and
Gomati Action Plan in 1993. Other major river conservation programmes were approved in 1995. In
1996, GAP II and NRCP were finally merged.51
The NPCA programme of NRCD aims at improving and conserving aquatic systems such as lakes and
wetlands by means of uniform policy, guidelines and conservation strategies. 52
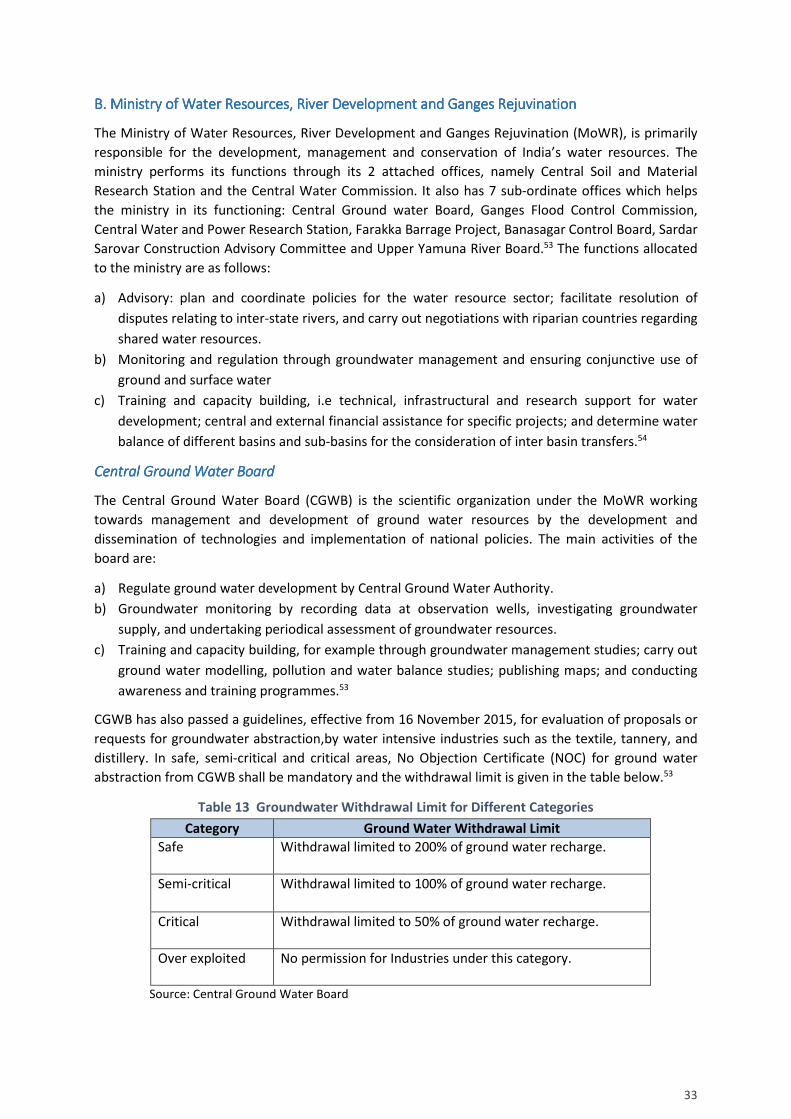
33
B. B. B. B. Ministry of Water Resources, RiMinistry of Water Resources, RiMinistry of Water Resources, RiMinistry of Water Resources, River Development and ver Development and ver Development and ver Development and GangesGangesGangesGanges RejuvinationRejuvinationRejuvinationRejuvination
The Ministry of Water Resources, River Development and Ganges Rejuvination (MoWR), is primarily
responsible for the development, management and conservation of India’s water resources. The
ministry performs its functions through its 2 attached offices, namely Central Soil and Material
Research Station and the Central Water Commission. It also has 7 sub-ordinate offices which helps
the ministry in its functioning: Central Ground water Board, Ganges Flood Control Commission,
Central Water and Power Research Station, Farakka Barrage Project, Banasagar Control Board, Sardar
Sarovar Construction Advisory Committee and Upper Yamuna River Board.53 The functions allocated
to the ministry are as follows:
a) Advisory: plan and coordinate policies for the water resource sector; facilitate resolution of
disputes relating to inter-state rivers, and carry out negotiations with riparian countries regarding
shared water resources.
b) Monitoring and regulation through groundwater management and ensuring conjunctive use of
ground and surface water
c) Training and capacity building, i.e technical, infrastructural and research support for water
development; central and external financial assistance for specific projects; and determine water
balance of different basins and sub-basins for the consideration of inter basin transfers.54
Central Ground Water BoardCentral Ground Water BoardCentral Ground Water BoardCentral Ground Water Board
The Central Ground Water Board (CGWB) is the scientific organization under the MoWR working
towards management and development of ground water resources by the development and
dissemination of technologies and implementation of national policies. The main activities of the
board are:
a) Regulate ground water development by Central Ground Water Authority.
b) Groundwater monitoring by recording data at observation wells, investigating groundwater
supply, and undertaking periodical assessment of groundwater resources.
c) Training and capacity building, for example through groundwater management studies; carry out
ground water modelling, pollution and water balance studies; publishing maps; and conducting
awareness and training programmes.53
CGWB has also passed a guidelines, effective from 16 November 2015, for evaluation of proposals or
requests for groundwater abstraction,by water intensive industries such as the textile, tannery, and
distillery. In safe, semi-critical and critical areas, No Objection Certificate (NOC) for ground water
abstraction from CGWB shall be mandatory and the withdrawal limit is given in the table below.53
Table 13 Groundwater Withdrawal Limit for Different Categories
Category Ground Water Withdrawal Limit
Safe Withdrawal limited to 200% of ground water recharge.
Semi-critical Withdrawal limited to 100% of ground water recharge.
Critical Withdrawal limited to 50% of ground water recharge.
Over exploited
No permission for Industries under this category.
Source: Central Ground Water Board

34
Central Ground Water AuthorityCentral Ground Water AuthorityCentral Ground Water AuthorityCentral Ground Water Authority
The Central Ground Water Authority was constituted to regulate, develop and manage the ground
water resources of India under Section 3 (3) of the Environment (Protection) Act, 1986. The CGWA
has three key regulatory functions:
a) Regulate the ground water withdrawal by industries or projects for the over exploited and critical
assessment units. SPCB and MoEFCC need to refer to CGWA for permission to establish a new
industry or process in critical zones.
b) Notify critical/overexploited areas, e.g. in Haryana for control and regulation of the resources.
c) Prohibit construction of new groundwater structures in notified area,s except drilling of tube-
wells for drinking water supply by government agencies.55
Central Water Commission Central Water Commission Central Water Commission Central Water Commission
The Central Water Commission (CWC) is the attached office of the Ministry of Water Resources, River
Development and Ganges Rejuvination as its main technical arm. CWC initiates and coordinates in
consultation with the state government, schemes for conservation and sustainable utilization of the
water resources throughout the country for various purposes such as navigation, flood control,
drinking water supply and water power development. The broad functions of CWC are:
a) Advise the government on water resources development and act as Central Bureau of
Information relating to water resources, including production of relevant statistical data.
b) Undertake river valley development project on behalf of the national and state government .
c) Training and capacity building through investigations and surveys for development of the river
valleys for various purposes including water supply, power generation, flood management,
irrigation and restoration; undertake research on various aspects of river valley development
schemes; and promote modern data collection techniques such as remote sensing technology.
CWC also has a Yamuna Basin Organization who is responsible for observation of relevant data and
flood forecasting in relevant states including Haryana; monitoring of schemes such as the
Accelerated Irrigation Benefit Program (AIBP), Common Area Development (CAD) Programme and
restoration of water bodies.56
C. C. C. C. Ministry of Urban DevelopmentMinistry of Urban DevelopmentMinistry of Urban DevelopmentMinistry of Urban Development
The Ministry of Urban Development was constituted on May 13, 1952 as the authority to formulate
policies, support, sponsor and monitor programmes related to urban development and also assist
coordination between central ministries, state governments and other nodal agencies. The ministry
has also been delegated an additional responsibility under India (Allocation of Business) Rules 1961
to supply water, subjected to coordination with the MoWR, sewerage, drainage and sanitation
facilities to the urban areas. 57
D. D. D. D. Ministry of TextilesMinistry of TextilesMinistry of TextilesMinistry of Textiles
The Ministry of Textiles is responsible for formulating policies, planning, developing, promoting
exports and regulating trade of the textile industry, which includes all types of natural and man-
made cellulosic fibres used in the making of textiles, handicrafts and clothing. The Ministry’s vision is
to improve industrial production capacities to ensure a global standing in the manufacturing and
exports of all the types of textiles. It also works towards preserving the cultural heritage associated

35
with the industry and promote handlooms and handicrafts for economic development. The Ministry
also promotes growth and technological upgrade for sustainable development of the industry.58
E. E. E. E. National Green Tribunal (NGT)National Green Tribunal (NGT)National Green Tribunal (NGT)National Green Tribunal (NGT)
The National Green Tribunal was established under the National Green Tribunal Act, 2010 for
expeditious and effective disposal of cases related to environment. The tribunal is required to
dispose cases within 6 months from its filing. It is guided by the principle of natural justice and not
bound by the procedure under the Code of Civil Procedure, 1908. The main functions of the NGT are:
a) Ensure expeditious and effective disposal of cases related to conservation and protection of
environment and its natural resources.
b) Enforce legal right relating to environment and giving compensation and relief to persons and
property for damages.
c) Handle environmental disputes.59
5.1.2.5.1.2.5.1.2.5.1.2. Laws and RegulationsLaws and RegulationsLaws and RegulationsLaws and Regulations
India has always been very serious about the water issue and has a very well established regulatory
framework when it comes to prevention of water pollution. The Water (Prevention and Control of
Pollution) Act, 1974 has stringent provisions for maintenance of the nation’s water resources. The
Water (Prevention and Control of Pollution) Cess Act, 1977 supports the Water Act of 1974 by
augmenting resources for the pollution control authorities by charging cess from the industries. The
National Water Policy, 1987 is also a very crucial, in terms of protection of the river bodies of the
country. These policies complement and supplement each other and help in ensuring that the water
resources of India are managed and safeguarded to ensure sustainable development. These policies
are discussed in detail as follows.
A. A. A. A. The Water (PreventioThe Water (PreventioThe Water (PreventioThe Water (Prevention and Control of Pollution) Act,n and Control of Pollution) Act,n and Control of Pollution) Act,n and Control of Pollution) Act, 1974197419741974 (amended in 1988)(amended in 1988)(amended in 1988)(amended in 1988)
Water Act was enacted in the year 1974 with the aim to prevent and control water pollution4. This
act is India’s comprehensive attempt to deal with the problem of environmental deterioration and its
key features are:
a) Establishes CPCB (Subs. by Act 53 of 1988, s. 3) and SPCB (Subs. by Act 53 of 1988, s. 4).
b) Authorizes the CPCB to pass directions to SPCB. In case of inconsistency between the directives
from CPCB and the state government, the matter is to be referred to CPCB.
c) Empowers state governments to restrict the act to certain area in consultation with SPCB.
d) Authorizes SPCB to carry out survey of any area and keep the records of the characteristics, flow
or volume of a stream and collect samples of any trade effluent, sewage or stream for the
purpose of analysis.
e) Prohibits the disposal of polluting matter into a stream or well.
f) Restricts the establishment of a new industry, process or treatment disposal system, which is
most likely to discharge effluent or sewage without previous consent of SPCB.
g) Authorizes SPCB to refuse or withdraw consent in the absence of treatment and disposal system
for an industry, operation or a process.
4 Pollution as defined In the act is “contamination of water or such alteration of the physical, chemical or biological properties of water or
such discharge of any sewage or trade effluent or of any other liquid, gaseous or solid substance into water (whether directly or indirectly)
as may, or is likely to, create a nuisance or render such water harmful or injurious to public health or safety, or to domestic, commercial,
industrial, agricultural or other legitimate uses, or to the life and health of animals or plants or of aquatic organisms”
36
h) Prescribes a time frame to install a treatment plant to meet the provisions of the act and
empowers the Central Board to establish and modify standards.60
B. B. B. B. The Water (Prevention The Water (Prevention The Water (Prevention The Water (Prevention and Control of Pollution) Rules,and Control of Pollution) Rules,and Control of Pollution) Rules,and Control of Pollution) Rules, 1975197519751975
The Water (Prevention and Control of Pollution) rules, 1975 authorizes CPCB to function as a SPCB
for a Union Territory under sub-section (4) of section 4. The rule empowers the Central Board to take
samples of water from any stream, sewer or that of a trade effluent for the purpose of analysis
passing from any plant, vessel or over or from any place into a stream or well within the boundaries
of the union territory.61
C.C.C.C. The Water (Prevention andThe Water (Prevention andThe Water (Prevention andThe Water (Prevention and Control of Pollution) Cess Act,Control of Pollution) Cess Act,Control of Pollution) Cess Act,Control of Pollution) Cess Act, 1977(amended in 1992, 2003)1977(amended in 1992, 2003)1977(amended in 1992, 2003)1977(amended in 1992, 2003)
The Water Cess Act was passed in 1977 and further amended in 1992 and 2003 with the aim to
augment the resources of the Central and State Pollution Control Boards. The Act made provisions to
charge and collect cess (taxes) from specified industries mentioned in Schedule I for various
operations and process specified in Schedule II. The amendment in 2003 omitted the Schedule I and
defined Industry as “any operation or process, or treatment and disposal system, which consumes
water or gives rise to sewage effluent or trade effluent, but does not include any hydel power unit”.
Schedule II includes various processes in which water is consumed, such as cooling, spraying in boiler
feeds or mine pits; for domestic purpose; processing which may pollute the water. The cess charge
depends on the process involved. The amendment also authorizes the Central Government to
exempt cess from any industry consuming water less than mentioned in the after considering: the
nature of raw material, manufacturing process, source of water abstraction, effluent receiving water
body, and production data, including water consumption per unit production, in the industry and the
location of the industry.62
D. D. D. D. National Water Policy,National Water Policy,National Water Policy,National Water Policy, 1987 (amended in 2002, 2012)1987 (amended in 2002, 2012)1987 (amended in 2002, 2012)1987 (amended in 2002, 2012)
The National Water Policy (NWP) was formulated by the MoWR in 1987 and amended in 2002 and
2012 with the aim of water resource development and sustainable utilization. NWP 2012 only deals
with sustainable and efficient use of water resources and not the allocation unlike the predecessors.
The act supports the formulation of National Framework Law as a guiding statement for assisting
governance in each state. A number of issues are addressed within the NWP, such as the minimum
amount of potable water and its adaption due to climate induced variability; water footprint in of
industrial projects; water reuse and recycle; the use of new strategies like rainwater harvesting,
avoiding evapotranspiration, desalination, and water pricing issue. It views that water needs to be
fairly priced to ensure its efficient use and equitable access for all purposes, as decided by an
independent Water Regulatory Authority established by each state after stakeholder consultation .63
A National Water Board was constituted in 1990 under the chairmanship of Secretary of MoWR to
review the implementation and progress of NWP and report periodically to National Water
Resources Council that has the Prime Minister as its chairman.64
5.2.5.2.5.2.5.2. State Level Landscape of Water GovernanceState Level Landscape of Water GovernanceState Level Landscape of Water GovernanceState Level Landscape of Water Governance
At the state level, there are fewer actors involved in the governance of water. Their roles across
water governance value chain pertaining to the textile industry is mapped in Figure 16.

37
Source: Ministry of Haryana
Figure 16 Governance structure for Haryana
5.2.1.5.2.1.5.2.1.5.2.1. Key Actors and their RolesKey Actors and their RolesKey Actors and their RolesKey Actors and their Roles
A.A.A.A. Haryana State Pollution ContrHaryana State Pollution ContrHaryana State Pollution ContrHaryana State Pollution Control Boardol Boardol Boardol Board
The Haryana State Pollution Control Board (HSPCB) is the statutory authority set up under the Water
(Prevention and Control of Pollution) Act, 1974 to implement environmental laws and rules. HSPCB
implements all judicial, legislative pronouncements regarding protection and maintenance of the
environment in Haryana. The primary functions and responsibilities of the board are:
a) Advise state government on the prevention and control of pollution and the location of any
industry which is likely to pollute a stream or well.
b) Monitoring and regulation of policy by inspecting industrial effluents and plants; setting
standards for industrial effluent and ambient water quality; varying or revoking any orders as
well as requiring construction or modification of systems for the prevention, control and
abatement of water pollution.
c) Planning and implementation of reliable and economic methods of effluent treatments.
d) Training and capacity building, e.g. through comprehensive programmes, publishing information,
research and investigations, training programmes and mass education, for the prevention and
control of pollution. 65
B.B.B.B. Department of EnvironmentDepartment of EnvironmentDepartment of EnvironmentDepartment of Environment
The Department of Environment was established in 1989 to coordinate the working of the HSPCB to
ensure effective implementation of all the laws and acts regarding environment and pollution
control.66

38
Key actor
Public Health and
Engineering
Department
(PHED),
Municipal
Corporation of
Faridabad (MCF)
Public Health
and
Engineering
Department
(PHED)
Industries Haryana State Pollution Control Board (HSPCB)
Department of Environment (DoE)
Public Health and Engineering Department (PHED)
Roles PHED:
1) To supply water
to urban and rural
areas except
panchkula and
Faridabad
MCF:
1) To supply water
to Faridabad
district.
PHED:
1) To fix the
price for water
supply to
industries
Abstraction of
groundwater is
overlooked by
regional offices
of the Central
Groundwater
Authority
(CGWA)
Industries-
1) To adopt water
efficient
technologies
HSPCB:
1) To provide No Objection Certificate for establishment of
a new industry
2) To monitor the quality and level of pollution in the
receiving water
3) To plan and execute programmes for prevention and
control of water pollution.
4) To advise state government on prevention and control
of pollution
DoE:
1) To assist in implementation of pollution prevention
policies
PHED:
1) To fix the price for wastewater discharge by industries
Figure 17 Water Governance Value Chain in Haryana

39
C.C.C.C. Public Health and EngPublic Health and EngPublic Health and EngPublic Health and Engineering Departmentineering Departmentineering Departmentineering Department
The Public Health and Engineering Department (PHED) under the state government of Haryana was
established to provide adequate water supply and sewerage facilities, except in Faridabad and
Panchkula towns where Municipal Corporation of Faridabad and HUDA are responsible respectively.
The main functions of the department are:
1) Provide piped drinking water supply to the villages and towns.
2) Provide sewerage facilities and storm water disposal facilities in towns.
3) Construction of sewage treatment plants.
4) Installation of sanitary amenities in government buildings.67
D.D.D.D. Municipal Corporation of FaridabadMunicipal Corporation of FaridabadMunicipal Corporation of FaridabadMunicipal Corporation of Faridabad
The Municipal Corporation of Faridabad has the primary responsibility to maintain, develop and
upgrade the services provided to the citizens of Faridabad, including water supply and sewerage
facilities through the following tasks:
1) Upkeep and maintenance of 800 km of surface drains.
2) Upkeep and maintenance of 638 km of sewer lines.
3) Upkeep and maintenance of 910 km of water supply lines.68
5.2.2.5.2.2.5.2.2.5.2.2. InitiativesInitiativesInitiativesInitiatives
In spite of the existence of various laws and regulations, the water resources have had a decline in
quality as well as quantity. Degrading quality of water resources pertaining to industrial wastewater
has called for effective initiatives to monitor and prohibit further pollution. The Government of India
has launched some major initiatives for regulating industrial water pollution, such as monitoring of
water quality, assistance to upgrade to water efficient technologies, development of Common
Effluent Treatment Plants, in order to ensure the protection and management of water bodies. The
following section discusses these initiatives.
A.A.A.A. National Project on Aquifer Management (NAQUIM)National Project on Aquifer Management (NAQUIM)National Project on Aquifer Management (NAQUIM)National Project on Aquifer Management (NAQUIM)
Due to depleting ground water resource, NAQUIM was started with the objective of understanding
the current status of the aquifer so as to assist Central Ground Water Board in managing of the
groundwater resources during the XII & XIII Plan period. NAQUIM does not merely map the ground
water but also involves community for the management of groundwater in order to infuse a sense of
ownership among the stakeholders. Hence, it also supports groundwater management, upgrading
irrigation facility, drinking water security and sustainable development of water resource in rural and
urban area.69
B.B.B.B. National Water Quality Monitoring ProgrammeNational Water Quality Monitoring ProgrammeNational Water Quality Monitoring ProgrammeNational Water Quality Monitoring Programme
To ensure maintenance of the quality of water body as required by The Water Act, 1974, the CPCB
has established a number of monitoring stations across India, which includes a network of 2500
stations, including 807 groundwater stations spread across 28 states and 6 Union Territories in the
country monitoring 445 rivers (1275 stations), 154 lakes (190 stations), 12 tanks (12 stations), 78
ponds (79 stations), 41 creeks/seawater (41 stations), 255 canal (41 stations), 45 drains (45 stations),
10 water treatment plants (10 stations) and 807 wells. The main objectives behind monitoring of the
water quality are as follows:

40
1) Plan and prioritize pollution control strategies.
2) Gauge the extent and nature of pollution control measures required.
3) Evaluate and assess the effectiveness of existing measures for pollution control.
4) Assess the trend of the water quality.
5) Evaluate the assimilative capacity of the water body to reduce pollution control costs.
6) Understand the fate of pollutant in the water body.
7) Evaluate the suitability of water body for different uses.70
C.C.C.C. Micro and Small Enterprises Micro and Small Enterprises Micro and Small Enterprises Micro and Small Enterprises –––– Cluster Development Programme (MSECluster Development Programme (MSECluster Development Programme (MSECluster Development Programme (MSE----CDP)CDP)CDP)CDP)
The Ministry of Micro, Small and Medium Enterprises (MSME) has implemented the cluster
development programme as a key strategy for improving the productivity and capacity building of
the micro and small enterprises (MSEs) in the country. A cluster is a group of enterprises within an
identified, contiguous area producing similar products and services. The important characteristics of
enterprises in a cluster are: a) similar and complimentary methods in production, pollution control,
consumption of energy; b) similar technology and marketing practices; c) similar communication
channels in the cluster; and d) conjoint challenges and prospects.
In 2007 the scheme for cluster development Small Industries Cluster Development Programme
(SICDP) was renamed as Micro and Small Enterprises – Cluster Development Programme (MSE-CDP).
The Integrated Infrastructural Development (IID) Scheme was also merged with MSE-CDP to upgrade
existing infrastructure and develop sites for new enterprises. The objective of MSE-CDP was to
address common issues, such as technology upgrade, improving skills and quality, enhancing market
access, developing self-help groups for capacity building, infrastructure upgrade, and setting up
common facility centres, such as raw material storehouse, testing centre and effluent treatment.71
D.D.D.D. Scheme of Integrated Textile Parks Scheme of Integrated Textile Parks Scheme of Integrated Textile Parks Scheme of Integrated Textile Parks (SITP)(SITP)(SITP)(SITP)
The (SITP) was launched by Ministry of Textiles in 2005 to support the compliance Scheme of
Integrated Textile Park of textile units to international social and environmental standards.72 The
primary objective of the SITP is to provide the industry with world-class state-of-the-art
infrastructure facilities. This scheme engages a group of professional agencies for project
identification and implementation in order to create potential growth centres of international
standard.
The total cost for the project was to be jointly funded by a mix of equity or grants from the Ministry
of Textiles, state government, State Industrial Development Corporation, industry, project
management consultant and finally loans from banks and financial institutions. The support of the
central government is limited to 40% of the total project cost and a maximum of Rs. 40 crorev (US$ 6
million) by means of grant or equity for the textile park.
E. E. E. E. Centrally Sponsored Scheme for Integrated Processing Development Scheme (IPDS)Centrally Sponsored Scheme for Integrated Processing Development Scheme (IPDS)Centrally Sponsored Scheme for Integrated Processing Development Scheme (IPDS)Centrally Sponsored Scheme for Integrated Processing Development Scheme (IPDS)
The Integrated Processing Development Scheme (IPDS) was launched by the Ministry of Textile based
on the learnings from the SITP in order to deal with the problem of highly polluting effluents from
textile dyeing units. The primary objective of IPDS was to increase the competitiveness of textile
industry in the global market through environmental-friendly production technology and standards.
The scheme created new processing parks and upgraded existing clusters, in terms of cleaner
technology and water and waste management. The scheme includes:
v 1 crore equals to 10 million.

41
1) Group A: Water treatment and effluent treatment plant and technology (including marine,
Riverine and ZLD), which is supported by mandatory grant from central government.
2) Group B: Common infrastructure, such as captive power generation plants on technology
preferably renewable/green technology.
3) Group C: Common facilities such as Testing Laboratories and R&D centres.
The cost of land is not part of the total project cost and the Indian Government shall not give grants
for the procurement of land which under the scheme is to be arranged by the Special Purpose
Vehicle (SPV). The total project cost shall be borne in the ratio 50:25:15:10 by the centre, state,
beneficiary, bank loan.73
F.F.F.F. Zero Liquid Discharge (ZLD) by Zero Liquid Discharge (ZLD) by Zero Liquid Discharge (ZLD) by Zero Liquid Discharge (ZLD) by Polluting IPolluting IPolluting IPolluting Indndndndustriesustriesustriesustries
The Madras High Court had passed the direction to textile industries in Tirupur region to achieve Zero
Liquid Discharge (ZLD) in order to achieve approval from Tamil Nadu Pollution Control Board. CPCB
also passed notification to nine SPCB along the Ganges River Basin for industrial sectors, including
textile (wet processing), which discharge effluent into the river with a BOD load of 500kg/day or
having hazardous chemical in it.
ZLD refers to the process of absolute recycling of the industrial effluent and conversion of solute, i.e.
dissolved organic and inorganic compounds or salt into solid residue by means of concentration and
thermal evaporation. It is certified on the basis of two criteria: water consumption with respect to
wastewater reused/recycled and the corresponding amount of solid recovered. The purpose of ZLD is
to prevent further degradation of water resources due to disposal of highly degrading effluent into
the water environment thus rendering it improper for any kind of use.74
G.G.G.G. TechTechTechTechnology Upgradation Fund Scheme (TUFS)nology Upgradation Fund Scheme (TUFS)nology Upgradation Fund Scheme (TUFS)nology Upgradation Fund Scheme (TUFS)
The Technology Upgradation Fund Scheme (TUFS) aims to catalyze investment in the textile sector by
providing subsidies and assistance to upgrade existing technologies. The scheme covers technologies,
such as wet type venture scrubbers and dry type bag filter, which may be used in pollution control
and prevention.75 The subsidies motivates textile industries to switch technology to improve water
efficiency in the textile mills. An assessment by M/S CRISIL revealed that TUFS was helpful in
improving the quality of the entire value chain and reducing cost and waste.76
Source: Ministry of Textile.
Figure 18 TUF Scheme Timeline

42
“In the short run, textile industries may think that ZLD is not feasible but they need to learn from Tirupur and see
this as an opportunity of recycling water and hence saving on money” -Technology service provider
“The small scale industries are employment generators and hence the government needs to be flexible in their
approach and should assist and support them”
- Professor (Department of Regional Water Studies), TERI University
“It was also stated that the increase in production cost would be most likely absorbed by the exporters. India would
not lose its competitive advantage in the global market due to low end product cost impact of the textile industry.
The ZLD initiative is also likely to reduce the gap between buyers and sellers and hence an opportunity for the
factory.”
- Creative Dyeing and Printing Mills
5.3.5.3.5.3.5.3. RegulatoryRegulatoryRegulatoryRegulatory Water RiskWater RiskWater RiskWater Risk
Policy is currently driving action in the Faridabad-Ballabgarh textile cluster. The Zero Liquid Discharge
policy calls for adoption of practices to ensure complete recycling of industrial effluent and
concentration of the solute into a solid mass by means of evaporation by December 2016. This is a
major step which has been undertaken to ensure that the heavily polluting, water intensive industry,
such as textile units, does not further degrade the quality of the ground and surface water resources.
The region already has immense water scarcity and quality issue and in such a scenario it is a ray of
hope for the region.
However, this is also a big hurdle for the industries, which face the risk of increased production cost
and loss of market competitiveness, compared to those who do not face the same regulation.
Moreover, there are many challenges in the implementation of this policy. For this very reason
various stakeholders from industries, service providers, government representatives and educational
institutions were interviewed to trace out the implications, challenges and perceptions to risks with
regard to this recent ZLD policy.
5.3.1.5.3.1.5.3.1.5.3.1. Perceptions on Risks and Opportunities Associated with Perceptions on Risks and Opportunities Associated with Perceptions on Risks and Opportunities Associated with Perceptions on Risks and Opportunities Associated with ZLD policyZLD policyZLD policyZLD policy
For the textile wet processing units in the Faridabad-Ballabgarh cluster, the ZLD policy, if
implemented properly, would lead to the shutting down of many small enterprises since upfront
capital expenditure as well as on-going operating expenditure associated with installing ZLD is
extremely high. It is likely that the industry goes through a phase of consolidation in which the
medium and large scale textile industries would not witness much loss in business, provided that the
ZLD policy is extended to the entire country instead of being restricted to the nine Ganges states.
The industries also stated that in a scenario wherein the policy is not properly implemented, the
medium and large scale industry may adversely get affected as the units that will implement ZLD will
face an increase in end-product cost and hence lose their competitiveness, in comparison to units
that do not need to comply with the policy.
However, most of the textile wet processing units in the focused clusters in Haryana view the ZLD
policy as an opportunity in the long run. These units believe that they will have enhanced
opportunities as the larger brands would prefer environmentally sustainable production and they will
not face undue competition from smaller units, which currently use non-compliant, low-cost
materials and processes, that do not properly treat their effluent.

43
“There is no subsidy for setting up ZLD units by individual industries and it is also difficult to avail
subsidies under the TUF scheme.”
- Shivam Devansh Fab Pvt. Ltd.
Moreover, since the impact on end product cost is not very high and ZLD would reduce the overall
chemicals and water requirement, the industries would benefit from the change in process
efficiencies. Hence, the ZLD policy may create shocks initially but would eventually consolidate the
industry and help it become more competitive both in domestic and international markets.
5.3.2.5.3.2.5.3.2.5.3.2. Implementation ChallengesImplementation ChallengesImplementation ChallengesImplementation Challenges
Although the policy has been passed and ZLD is to be achieved by end of 2016, there are a number of
practical difficulties, which have been pointed out by different industries during the interviews. Most
of the units view ZLD policy as a necessary step to protect the environment and are also ready to
implement it. However, they are still unsure about how this would be executed. Although a CETP
seems to be a solution for this, the majority of the units do not intend to take part in it due to the
perceived practical difficulties. The stakeholders believe that it is imperative to analyze the situation
at a local level and understand the gaps and barriers so as to ensure proper implementation.
Figure 19 Understanding Major Implementation Challenges for ZLD in Faridabad-Ballabgarh Cluster
FinancingFinancingFinancingFinancing
ZLD is likely to increase the cost of dyeing and coloring segment of the textile value chain by as much
as 6% to 10%. The capital cost and operational cost associated with the technology to achieve zero
liquid discharge is very high, which is a major risk for the industry. The capital expenditure for ZLD is
as high as Rs. 6 Crores for a typical 1000KLD plant, while the operating expenditure is three times
the amount for running the plant for just 6 years according to Business-as-Usual.77
The difficulty in the disbursement of loans and funds under some of the existing scheme (eg: TUFS) is
one of the key implementation barriers for the industries. The industry believes that there should be
incentives, such as low cost interest loans and fast tracking of loan processes, that ensure that the
industries do not bear undue losses in the process of implementing the policy.

44
“Nano-filtration alone requires about 25 sq. km. area, hence setting up a ZLD unit is difficult due to lack of space,
especially for the small scale industries”
- Creative Dyeing and Printing
“Changing the mindset of the operator is difficult and yet very important for optimizing water use and hence
capacity building is required”
-Creative Dyeing and Printing Mills
“Technology is a major barrier. No one seems to know exactly about the practical difficulties. Technologies like
Membrane Bio Reactor are being offered, which is not appropriate for textile wastewater”
-Richa Industries
“There should be a roadmap which if followed by us would help us in getting funds from the financial
institution. Moreover, banks should be asked to fast track cases concerning loan for ZLD
implementation”
- Richa Industries
“Technology is not a barrier, the industries should learn from Tirupur and the government should facilitate the
process, so the best can be made out from the Tirupur experience”
-Technology service provider
It was also pointed out by different stakeholders that incentivizing the implementation of the policy
by proper financial instruments, especially for the small scale enterprises, is extremely important.
TechnologyTechnologyTechnologyTechnology
There are a plethora of technology options available in the market to achieve ZLD. However, all the
companies stated that too many options had created confusion for them and made them unsure
which technology would best fit them economically and otherwise. Lack of confidence and technical
knowledge about the Zero Liquid Discharge is a large implementation hurdle for them.
The technology provider interviewed suggested that because the OPEX was much higher, the
industries should have a synoptic vision when they selected the ZLD technology as lower cost
technology might in the longer run incur higher operating cost and lead to plant shutdown.
The companies also pointed out that lack of skillsets and difficulty in changing the mindset of the
skillsets was a major barrier.
SpaceSpaceSpaceSpace
Setting up a ZLD plant requires a lot of space. Industry representatives pointed that most of the wet
processing units in the Faridabad-Ballabgarh region do not have enough space to install ZLD plant
within their factory premises.
Because industrial units in the region are dispersed and the collected wastewater may be
heterogeneous in nature, a Common Effluent Treatment Plant might not be a feasible solution,
unlike Tirupur, where the textile parks were already established.

45
“A CETP will be atleast 10-12 km far from the factory and getting clearances for it from different government bodies
will be nerve wrecking”
- Creative Dyeing and Printing
“There were a lot of complaints and queries raised after putting up of the notification in October which have been
forwarded to MoEFCC and shall be catered to”
-Representative from CPCB
“Transparency is low with very little disclosure from both industries and government and low participation as no
feedback is taken from the mill, however we are hopeful about increase in accountability with time.
- Creative Dyeing and Printing
Furthermore, the stakeholders view that having two way pipelines to send the wastewater for
treatment and bring back treated water to the industrial unit would not practically and economically
be feasible. The civil work required alone would take a minimum of 1.5 years and hence the
construction would not be completed within the given time frame. Concerns were also raised
regarding the functioning of the CETP since quite a few of industrial units were set up on rented
property where the land was not owned by the unit. Most of the medium and large textile wet
processing units are likely to construct individual treatment plants to meet the ZLD policy.
5.3.3.5.3.3.5.3.3.5.3.3. The Need for The Need for The Need for The Need for Increased Transparency and Enhanced Coordination Increased Transparency and Enhanced Coordination Increased Transparency and Enhanced Coordination Increased Transparency and Enhanced Coordination
The stakeholders believe there is lack of coordination between various government agencies, which
act as a hurdle for implementation of policies. It was stated by the majority of industrial units that all
actions require permissions from different government agencies, which leads to loss of time and
money and hence demotivates the units to take appropriate actions. Most of the stakeholders
pointed out that laying of pipelines from the industry to the Common Effluent Treatment Plant
(CETP) is not feasible in a short time frame bevause it requires approvals from various government
agencies, including the National Highway Authority of India and the City Municipal Corporation.
Tirupur has already implemented Zero Liquid Discharge and can be taken as an example for
implementation of the policy in the Faridabad-Ballabgarh region. Nevertheless, communication gap
between the authorities render provide a challenge to learn from the experiences of Tirupur. Hence,
most of the stakeholders were of the opinion that there was a lack of coordination and
communication that needed to be addressed to enhance learnings from past experiences.
It was stated by majority of the stakeholders that there is corruption, lack of transparency and
disclosures at both ends – industry as well as government agencies. There is lack of transparent
disclosure from the industry on parameters such as amount of groundwater extracted, installed ETP
capacity, effluent quantity and quality, etc.
On the other hand, the government agencies released the policy without prior consultation with the
industry. Though concerns raised by the industries after the policy was passed were forwarded to
Ministry of Environment, Forests and Climate Change (MoEFCC), the industry is still unsure to what
extent they would be addressed.

46
Chapter Chapter Chapter Chapter 6666 CCCCapacity Building Workshopapacity Building Workshopapacity Building Workshopapacity Building Workshop
6666.1. .1. .1. .1. WorkshoWorkshoWorkshoWorkshop Organisationp Organisationp Organisationp Organisation
Stockholm International Water Institute (SIWI) in collaboration with Sustainability Outlook under the
Sweden Textile Water Initiative Project organized a multi-stakeholder capacity building workshop
with a focus on driving innovations toward sustainable textile industry in India through ZLD Policy.
The workshop focused on the risks, opportunities and challenges faced by the industry in the
implementation of ZLD as an industrial water governance policy. This workshop also provided a
forum for the stakeholders to discuss potential incentive instruments and solutions to catalyse
technological, business and governance innovations toward sustainability as a competitive advantage
of the industry.
The capacity building workshop took place at the 6th Annual Summit of the Sustainable Business
Leadership Forum on 24th November 2016 at Hotel Taj Palace, New Delhi.
6666....2222. . . . IIIInputs from the Workshopnputs from the Workshopnputs from the Workshopnputs from the Workshop
Session 1: Water Risks and ZLD Implementation: Current Status, Opportunities and
Implementation Challenges
The first session saw participation from representatives from Central Pollution Control Board and key
textile industry representing both large and medium scale units. The opening remarks for the session
were provided by Ms. Josa Kärre, Head of Economic and Trade Section, Embassy of Sweden.
A snapshot of the Industrial Water Governance Report prepared by Stockholm International Water
Institute (SIWI) in collaboration with Sustainability Outlook was presented during the session. The
presentation elaborated on the evolution of policy in India with respect to industrial water
governance.
It was identified, that though there is high upfront and operational cost, the impact of ZLD on a shirt
would be less than 1% impact on the end product pricing. Hence, it does make sense to go for ZLD in
the industry. However, all the participants agreed that some major challenges which are decelerating
the uptake are lack of space, high implementation cost, by-product disposal, escalated carbon
footprint, lack of understanding of appropriate technology and lack of financing sources
Key Highlights of the New Policy:
1) Same norms made applicable to all integrated textile units, units of cotton/ woollen/
carpets/ polyester, units having printing/ dyeing/ bleaching process or manufacturing and
garment units.
2) Parameter for Total Dissolved Solids (TDS) introduced
3) The TDS value with respect to treated effluent was notified to be 2100 mg/l; however, in
cases where TDS in intake water is above 1100 mg/l, a maximum contribution up to 1000
mg/l was permitted, provided the maximum value of 3100 mg/l was not exceeded in the
treated effluent.
4) The standalone Micro, Small and Medium Enterprises (MSMEs) as per the MSME
Development Act, 2006 were mandated to meet the new notified standards.

47
5) The standalone large scale units were notified to meet the new standards; the large scale
units in environmentally sensitive /critical areas could be mandated to achieve Zero Liquid
Discharge by CPCB or SPCBs /PCCs with prior approval of CPCB.
Session 2: Bridging implementation gap and capturing opportunities
The workshop also provided a forum for the stakeholders to discuss potential incentive instruments
and solutions to catalyse technological, business and governance innovations toward sustainability as
a competitive advantage of the industry. The participants for the group discussions included
representatives from textile wet processing industry, water treatment solution providers and catalyst
agencies.
The focussed group discussion discussed three key problem statements:
1) What are the innovative ways for ZLD implementation through following interventions:
• Good Governance
• Incentivizing through Policy Instruments
2) How do we create standardization in operating performance and applicability of technologies
to enable different stakeholders (industry, policy makers, etc.) for smoother roll-out and
reliable implementation.
3) Given the pros and cons of individual vs. Central ZLD Systems, what would emerge as a
preferred and reliable way forward, why and what steps need to be taken to enable it.
Key Takeaways:
1) Financially incentivize uptake of wastewater as make-up water
2) Need to create standards for water consumption
3) Test technologies on pilot basis and create a standard user manual to ensure usage of clean
and efficient technologies
4) Individual ZLD facilities are more preferable than common facilities
It was also highlighted that there is a need to financially incentivize uptake of more sustainable
techniques like waiving away of the cess for units using partially or untreated wastewater for the
amount of make-up water being consumed in excess of the benchmark. Moreover, a stick and carrot
approach needs to be introduced as per the benchmarks to ensure better compliance.
Comparison between common treatment facilities and individual ZLD facilities was made based on
the criteria of accountability, effluent characteristics, financial aspects and longevity. It was
concluded that due to greater accountability and much more stable and better monitored effluent
characteristics in case of individual facilities, the concept of individual ZLD makes more sense as this
also increases the longevity of the system. In terms of the expenditure involved, though the burden
on the units is reduced in case of a common treatment facility but it is achievable in both the
scenarios. Moreover, setting up the two-way pipelines to send the effluent to the common facility
and taking back the recycled water in itself is a huge hassle and hence individual ZLD is a preferred
option.
The workshop hence took stock on ZLD implementation and addressed the major challenges and
risks associated thus building capacity as a step towards a more water efficient textile industry.

48
Chapter Chapter Chapter Chapter 7777 Conclusions and Conclusions and Conclusions and Conclusions and Recommendations Recommendations Recommendations Recommendations
7.1. 7.1. 7.1. 7.1. ConclusionConclusionConclusionConclusion
As outlined in the first chapter, this report aims to look at the physical and regulatory water risks as
well as the water governance landscape pertaining to the textile industry in India, with a special focus
on the Faridabad-Ballabgarh cluster in the state Haryana. Based on the desk research as well as
interviews to the stakeholders, the report finds that:
1) To a large extent, the key physical water risks related to the textile industry at the national level
are similar to those at the state level and even at the industrial cluster level. The main physical
water risks are:
a. Increasing gap between the supply and demand of freshwater that are required to
underpin the growth and ambition of the textile industry.
b. Declining groundwater table due to overexploitation of the resources.
c. Degrading water quality both for surface water and groundwater.
d. Suboptimal performance of existing individual ETPs or CETPs.
There is a vicious circle between declining groundwater table, degrading water quality due to
increased salinity or pollution, higher costs of water use in the textile production due to either
declining water table or degrading water quality, and sub-optimal effluent treatment by the
industry. It is clear that appropriate intervention is needed to address each of the key water risks
and break the vicious circle.
2) The government, both at the national and state level, has had in place a water governance
landscape with a broad coverage regarding the types of key actors and their responsibilities,
existing laws and regulations, as well as progressive initiatives at the national and state level.
The institutions involved in the governance of water for textile industry entail beyond the typical
line ministries in charge of water resources, but also the Ministry of Textile and the Ministry of
Law and Justice. The initiatives target not only the monitoring of the situations of the water
resources (both quantity and quality) and stringent effluent standards, but also on upgrading
technologies for cleaner production, including efficient water use and effluent treatment at
textile unit as well as at industrial parks.
3) Lack of good water governance contribute to regulatory water risks in the form of:
a. The gap between industry readiness in practice and the expected performance of the
industry as required by the regulations, especially but not limited to the small scale industry.
b. Some regulations have not been able to keep up with the fast pace of degrading quantity and
quality of water resources, which require timely adjustment of the regulations so as to
provide incentives for improved water management by the industry. For example, water
price for water abstraction by the industry that does not substantially change over time
despite increasing water scarcity; and CETP that allows effluent with high TDS, which
ultimately contribute to the suboptimal performance of CETP.
c. Lack of good governance capacities, especially with regard to coordination across
government agencies and lack of transparency and accountability in the implementation of

49
the regulations and initiatives. This will add not only higher costs to the industry and also
demotivate the industry in adopting cleaner technologies for better water management in
their production processes.
4) The ZLD policy as the most ambitious initiative that the Government of India has launched in
terms of sustainable water management has been seen both as opportunities and risks by the
stakeholders, especially the affected industry, under the implementation challenges regarding
financing, technology and space availability.
7.2. 7.2. 7.2. 7.2. RecommendationsRecommendationsRecommendationsRecommendations
Based on the findings of the report and the inputs from the capacity building workshop, the report
suggests the following priority areas for capacity building in view of improving industry’s readiness
toward the ZLD policy:
10) Assessment of appropriate financial instruments and mechanisms to catalyse faster adoption of cleaner
technology for the industry, especially for the small scale industry considering its importance in generating
employment.
11) Development of guidelines for selecting cost-efficient and appropriate technology for the industry with
regard to the scale, characteristics, and production line of the textile units. The guidelines can facilitate a
rapid development of customised or mixed solutions for textile units. The assessment shall employ Cost
Benefit Analysis of potential solutions, including the construction of new ETPs or CETPs or improvement of
existing ETPs/CETPs that are suitable to local conditions and current water risk challenges, especially in the
view of limited space availability.
12) Improving the skills in operating cleaner production processes and effluent treatment plants, through
capacity building activities across the industry. STWI Projects has undertaken such workshops but this
needs to be replicated on a wider scale across the industry.
13) Improving communication and harmonisation of regulations across government agencies in order to
expedite: a) learning of best practices from other states (e.g. Tirupur) or countries; b) enhance the efficacy
of regulations.
14) Enhancing good water governance through better transparency and accountability of decision making
processes as well as the implementation of various initiatives related to the ZLD policy.
15) Financially incentivize uptake of wastewater as make-up water.
16) Need to create standards for water consumption.
17) Test technologies on pilot basis and create a standard user manual to ensure usage of clean and
efficient technologies.
18) Individual ZLD facilities are more preferable than common facilities.

50
Annex A: Annex A: Annex A: Annex A: WorkshopWorkshopWorkshopWorkshop NotesNotesNotesNotes
Key Participants in the Workshop

51
Testimonials

52
Pictures

53

54
REFERENCESREFERENCESREFERENCESREFERENCES
1 Census of India, 2011.
http://www.censusindia.gov.in/Census_Data_2001/National_Summary/National_Summary_DataPage.aspx
Accessed: 1 February 2016. 2 Planning Commission, Government of India. 2013. Twelfth Five Year Plan (2012-2017). Faster, More Inclusive
and Sustainable Growth. Volume I.
http://planningcommission.gov.in/plans/planrel/12thplan/pdf/12fyp_vol1.pdf Accessed: 1 February 2016. 3 2030 Water Resources Group. 2009. Charting Our Water Future. Economic Frameworks to inform decision-
making. Accessed: 1 February 2016. 4 Kumar, S.V., and Bharat, S.K. 2014. Perspectives on a Water Resource Policy for India. Discussion Paper
October 2014. The Energy and Resources Institute TERI. 5 Government of India, Ministry of Water Resources. 2012. National Water Policy (2012).
http://wrmin.nic.in/writereaddata/NationalWaterPolicy/NWP2012Eng6495132651.pdf Accessed: 1 February
2016. 6 Ministry of Textiles. 2011. Strategic Plan (20112-2016).
http://www.performance.gov.in/sites/default/files/document/strategy/Textiles.pdf 7 Central Ground Water Board. 8 http://www.cgwbchd.nic.in/qulhar.htm 9 http://cgwb.gov.in/gw_profiles/st_Haryana.htm 10 http://www.cgwb.gov.in/District_Profile/Haryana/Faridabad.pdf 11 World Trade Organisation’s Statistics.
https://www.wto.org/english/res_e/statis_e/its2014_e/its14_highlights2_e.pdf 12 World Trade Organisation. 2015. International Trade Statisctis 2015.
https://www.wto.org/english/res_e/statis_e/its2015_e/its2015_e.pdf 13 Indiska, KappAhl, Lindex, SIWI. 2015. Final Report for Sida on the Sustainable Water Resources Management
for Textile Industries in Delhi and Jaipur Project (SWAR). 14 One Year MBA. Textile Industry Needs Long-term Roadmap for Sustainable Growth: Shankar Raman,
PGPX’14. 7 Dec 2014. http://www.oneyearmba.co.in/textile-industry-needs-long-term-roadmap-sustainable-
growth-shankar-raman-pgpx-14/ 15 Sustainability Outlook. 2015. Zero Liquid Discharge: Outlook for Indian Industry. Market Brief. 16 http://www.cseindia.org/dte-supplement/industry20040215/misuse.htm 17 Department of Economic and Statistical Analysis, Haryana. 18 Farhat Naz, Saravanan V. Subramanian. 2010. Water Management across Space and Time in India. ZEF
Working Paper Series 61. Department of Political and Cultural Change. Center for Development Research.
University of Bonn. 19 World Bank. 2005. India's Water Economy: Bracing for a Turbulent Future. World Bank Report. Washington
DC: World Bank. 20 CSE. 2004. Down To Earth Supplement, 29 February 2004. It isn’t agriculture. http://www.cseindia.org/dte-
supplement/industry20040215/agriculture.htm . Accessed: 8 February 2016. 21 http://www.nih.ernet.in/water_res_india.html Accessed: 9 February 2016. 22 World Bank. 2015. World Development Indicator. Accessed: 8 February 2016. 23 Narsimhan, T N. 2008. A note on India's water budget and evapotranspiration. Journal of Earth System
Science. Vol 117. No 3. PP 237- 240. 24 S.K. Gupta and R.D. Deshpande. 2004. ‘Water for India in 2050: First Order Assessment of Available Options’,
Current Science, Vol. 86. 25 T.N. Narasimhan and V.K. Gaur. 2009. A Framework for India’s Water Policy. National Institute for Advanced
Studies, Bangalore. 26 Ministry of Environment and Forest (MoEF). 2006. National Environment Policy 2006. Ahmedabad: Center for
Environment Education. 27 Devineni, N., S.Perveen and U.Lall. 2011.Climate variability and water stress: How much storage is needed
and where?. White Paper February 2012, Columbia Water Center. Columbia University, NY.

55
28 Gaur, A., and Amerasinghe, P. 2011. A River Basin Perspective of Water Resources and Challenges. Chapter 1.
In India Infrastructure Report 2011. Water: Policy and Performance for Sustainable Development.
Infrastructure Development Finance Company. Oxford University Press: New Delhi, India. 29 World Bank. 2010a. Deep Well and Prudence: Towards Pragmatic Action for Addressing Groundwater
Overexploitation in India. Washington, DC: The World Bank. http://www-
wds.worldbank.org/external/default/WDSContentServer/WDSP/IB/2010/03/04/000333037_20100304230610/
Rendered/PDF/516760ESW0P0951round0Water129101110.pdf 30 Perveen, S., Sen, R., and Ghosh, M. 2012. India’s Deepening Water Crisis? Water Risks for Indian Industries.
A Preliminary Study of 27 Industrial Sectors. Report. Federation of Indian Chambers of Commerce and Industry
(FICCI) and Columbia University Water Center (CWC). 31 Mohan, D. and S. Sinha. 2009. Vulnerability Assessment of People, Livelihoods and Ecosystems in the Ganges
Basin. Delhi: WWF. 32 Hallegatte, S. et al. (2010). 'Flood Risks, Climate Change Impacts and Adaptation Benefits in Mumbai: An
Initial Assessment of Socio-Economic Consequences of Present and Climate Change Induced Flood Risks and of
Possible Adaptation Options', OECD Environment Working Papers, No. 27, OECD Publishing. 33 Government of India, Ministry of Water Resources. (2009) National Water Mission under National Action
Plan on Climate Change. 34 Kumar, R., K.D. Sharma, and R.D. Singh. 2005. 'Water Resources of India', Current Science, Special Section:
Water, vol. 89, no. 5, pp. 794-811 35 Ministry of Environment and Forests (MoEF). 2010. Climate Change and India: A 4X4 Assessment- A Sectoral
and Regional Analysis for 2030s. 36 UNESCAP and UNISDR. 2010. The Asia Pacific Disaster Report 2010. Protecting Development Gains. Reducing
Disaster Vulnerability and Building Resilience in Asia and the Pacific.
http://www.unisdr.org/files/16132_asiapacificdisasterreport20101.pdf 37 Asian Development Bank (ADB). 2009. 'Water Resources Development in India: Critical Issues and Strategic
Options'. Asian Development Bank, New Delhi. 38 http://www.fao.org/docrep/005/y4495e/y4495e06.htm 39 http://www.cgwb.gov.in/documents/Ground%20Water%20Year%20Book%202013-14.pdf 40 Hegde, N.G. 2012. Water scarcity and security in India, Dr. Narayan G., BAIF Development Research
Foundation 41 Central Polllution Control Board. 2013. Status of Water Quality in India – 2012.
http://www.cpcb.nic.in/WQ_Status_Report2012.pdf 42 https://nmcg.nic.in/pdf/Pollution%20Assessment.pdf 43 Government of India, Ministry of Water Resources. 2014. Ganges Basin. http://www.india-
wris.nrsc.gov.in/Publications/BasinReports/Ganges%20Basin.pdf 44 Central Pollution Control Board. 2015. Global good practices in industrial wastewater treatment and
disposal/reuse, with special reference to common effluent treatment plants.
http://www.cpcb.nic.in/Report_CETP_GGP.pdf 45 Central Pollution Control Board. 2011. Polluted River Stretches in India: Criteria and Status
http://cpcb.nic.in/upload/NewItems/NewItem_172_FinalPollutedStretches.pdf 46 cKinetics analysis 47 http://www.cgwbchd.nic.in/qulhar.htm 48 http://envfor.nic.in/division/introduction-7 49 http://cpcb.nic.in/upload/AnnualReports/AnnualReport_43_AR_2011-12_English.pdf 50 http://envfor.nic.in/division/national-river-conservation-directorate-nrcd 51 http://www.moef.nic.in/sites/default/files/NRCD/More.html 52 http://envfor.nic.in/division/national-river-conservation-directorate-nrcd 53 http://wrmin.nic.in/writereaddata/Annual_Report_2014-15.pdf 54 http://mowr.gov.in/forms/list.aspx?lid=239 55 http://cgwb.gov.in/aboutcgwa.html 56 http://mowr.gov.in/forms/list.aspx?lid=565 57 http://moud.gov.in/sites/upload_files/moud/files/Mandate_updated.pdf 58 http://texmin.nic.in/about-us 59 http://www.greentribunal.gov.in/history.aspx# 60 Water act, 1974, Central Pollution Control Board 61 http://envfor.nic.in/legis/water/water2.html
56
62 http://envfor.nic.in/legis/water/wc_act_03.pdf 63 http://wrmin.nic.in/writereaddata/NationalWaterPolicy/NWP2012Eng6495132651.pdf 64 http://www.archive.india.gov.in/sectors/water_resources/index.php?id=5 65 http://hspcb.gov.in/annex-a-3.htm 66 http://hspcb.gov.in/CC.pdf 67 http://wss.hry.nic.in/WSStatus.htm 68 https://www.mcfbd.com/duties-functions 69 http://cgwb.gov.in/AQM/documents/Concept%20Note%20on%20Aquifer%20mapping%2015.07.2012.pdf 70 http://www.cpcb.nic.in/divisionsofheadoffice/pams/NWMP.pdf 71 https://haryanaindustries.gov.in/themes/backend/uploads/Uploads/ModifiedGuidelinesofMSE.pdf 72 http://texmin.nic.in/sites/default/files/sitp%20new%20park%20guidelines.pdf 73 http://texmin.nic.in/sites/default/files/GUIDELINES_FOR_IPDS.pdf 74 http://cpcb.nic.in/Final-ZLD%28Draft%291.pdf 75 http://aepcindia.com/app/webroot/files/pdf/publication_31087_1402390034.pdf 76 http://texmin.nic.in/sites/default/files/Anx-A%20Modified%20TUFS%20Scheme%202012-2017.pdf 77 http://sustainabilityoutlook.in/content/market/zero-liquid-discharge-outlook-indian-industry-755079