Embed Size (px)
Citation preview
ABSTRACTAdvances in space activity are linked to reductions in launch cost. Air-breathing propulsion-assisted flight systems offer the potential for revolutionary change of the space operations paradigm. Horizontal launch of a space-access system provides mission flexibility, responsiveness, and affordability. One way to reduce launch cost is to increase the Mach number at which a launch vehicle is staged from a carrier aircraft. Without exceeding the engine and airframe design limits, the pre-compressor cooling technology allows an operational aircraft to operate at Mach numbers and altitudes beyond its basic operational limits. This is an essential, near-term technology for reducing launch cost to place small-weight payloads in low Earth orbit. The advantage of this technology is assessed with a modified McDonnell Douglas QF-4C aircraft. Payloads are unachievable or marginal with an unmodified QF-4C. However, payloads weighing around 150 pounds are plausible with this aircraft when incorporating the water injection pre-compressor cooling (WIPCC) technology.
The AeronAuTicAl JournAl FebruAry 2015 Volume 119 no 1212 145
Paper No. 4012. Manuscript received 3 June 2013, revised version received 16 Septembet 2014, accepted 26 September 2014.
Water injection pre-compressor cooling assist space accessU. Mehta [email protected] J. Bowles and J. MeltonNASA Ames Research Center Moffett Field, California USA
L. Huynh Science and Technology Corporation Moffett Field, California USA
P. Hagseth Lockheed Martin Company Fort Worth, Texas USA
146 The AeronAuTicAl JournAl FebruAry 2015
NOMENCLATURE
Symbols
e ‘specific’ energy, ftg gravitational acceleration, ft/sec2
h altitude, ftM freestream Mach numberV velocity, ft/sec∆ delta
Acronyms
ALASA Airborne Launch Assist Space AccessATREX Air Turbo Ramjet Engine with eXpander cycleDARPA Defense Advanced Research Projects AgencyDOF degree of freedomERV expendable rocket vehicleESA energy state approximationLEO low Earth orbitMIPCC mass injection pre-compressor coolingMPV MIPCC-powered vehicle PCC pre-compressor coolingPOST2 Program to Optimise Simulated Trajectories IIQF-4C unmanned F-4C aircraft without WIPCC technologyQF-4X unmanned experimental F-4 aircraft with WIPCC technologyRASCAL Rapid Access Small Cargo Affordable LaunchRF-4X manned experimental F-4 aircraft for reconnaissanceSABRE Synergetic Air-Breathing Rocket EngineWIPCC water injection pre-compressor coolingWIPCCASA water injection pre-compressor cooling assist space access
Abbreviations
ft feetIsp specific impulse, seckg kilogramlbm pound massnm nautical milepsf pounds per square footsec seconds
1.0 INTRODUCTIONAffordable, reliable, and safe transportation of small- and medium-weight payloads from Earth to low Earth orbit (LEO) and flexible transportation operations can only be achieved by a paradigm change in space-access transportation. This change can be done, in part, only if existing chemical rocket engines are replaced by revolutionary modes of propulsion for the carrier vehicle at
mehTA et al WATer inJecTion pre-compressor cooling AssisT spAce Access 147
launch from Earth. Air-breathing propulsion is such a mode for flight in Earth’s atmosphere. One approach to place a payload in LEO at low cost and in an operationally robust manner is to develop an airborne high-speed launch capability. Horizontal launch of the space access system with air-breathing propulsion on the carrier aircraft provides mission flexibility, responsiveness, and resilience(1). The use of high-speed aircraft, off-the-shelf turbine and rocket technologies, and a robust launch demand make space transportation for small and medium payloads affordable.
Air-breathing engines are needed to fully exploit atmospheric flight, starting with the Mach range 0-6, subsequently with Mach ranges 3-8 and 6-12, and finally, with Mach range 0-12. However, operational turbine engines are generally limited to freestream Mach numbers below 2·5. The operation of these engines could be pushed to Mach 3-3·5. They could be made to operate to a speed of around Mach 5·5, with pre-compressor cooling using either coolants or a heat exchanger. Another way to increase the Mach range of air-breathing propulsion devices is to use a turbine-based combination cycle engine, such as turbo(fan) plus ramjet, turbine plus dual-mode ramjet/scramjet, or turbo(fan)-ramjet plus scramjet. To transform the seemingly impossible feat of reaching Mach range 0-12 to an improbable feat, and eventually to an inevitable feat, the crawl-walk-run approach is proposed. The near-term, mid-term, and far-term development options are, respectively, turbine engines with water injection pre-compressor cooling (WIPCC) technology, turbo-ramjet engines or turbines engines with heat exchangers (e.g. SABRE(2-4) and ATREX(5) engines), and turbine plus dual-mode ramjet/scramjet or turbofan-ramjet plus scramjet engines.
Supersonic aircraft such as the F-4(6), F-15(7-10), Rafale(11,12) and MiG-31(13), have been studied for launching small payloads to LEO. The launch vehicle is either staged at high subsonic speeds or low supersonic speeds. The use of pre-compressor cooling technology to reduce the energy (delta-V) required to place a payload in orbit with airborne launch assist was not considered in these efforts. However, the need for WIPCC has been identified to place medium-weight payloads in LEO(14). This mission requires a new carrier aircraft using operational advanced turbine engines. The Defense Advanced Research Projects Agency (DARPA) Airborne Launch Assist Space Access (ALASA) demonstrator to place a 100-lbm payload in low Earth orbit did not consider the pre-compressor cooling (PCC) technology(15).
Current launch options for small satellites are very expensive or require them to piggyback or be secondary payloads on an existing large launcher and its orbit/launch objectives(15). With the development of new capabilities and compact technologies these satellites will offer a large market for new space operations, including civil government, military, commercial, and R&D/university uses(16,17,18,19,20).
In the absence of high supersonic and hypersonic air-breathing engines, the performance of existing engines can be improved with WIPCC technology. In the present study, the viability of this approach is assessed for transporting small payloads to LEO. The overall technical objective is to perform an engineering assessment of an F-4 aircraft with WIPCC to launch, at supersonic speed, a rocket-powered launch vehicle carrying a small payload.
2.0 USE OF THE PRE-COMPRESSOR COOLING CONCEPT
Historically, WIPCC has been referred to as PCC or pre-compressor evapourative cooling. Research, technology development, and application of mass injection pre-compressor cooling (MIPCC) systems have taken place since 1950(21-35). Thus, WIPCC has become an off-the-shelf technology, and its use is simply an engineering task.
148 The AeronAuTicAl JournAl FebruAry 2015
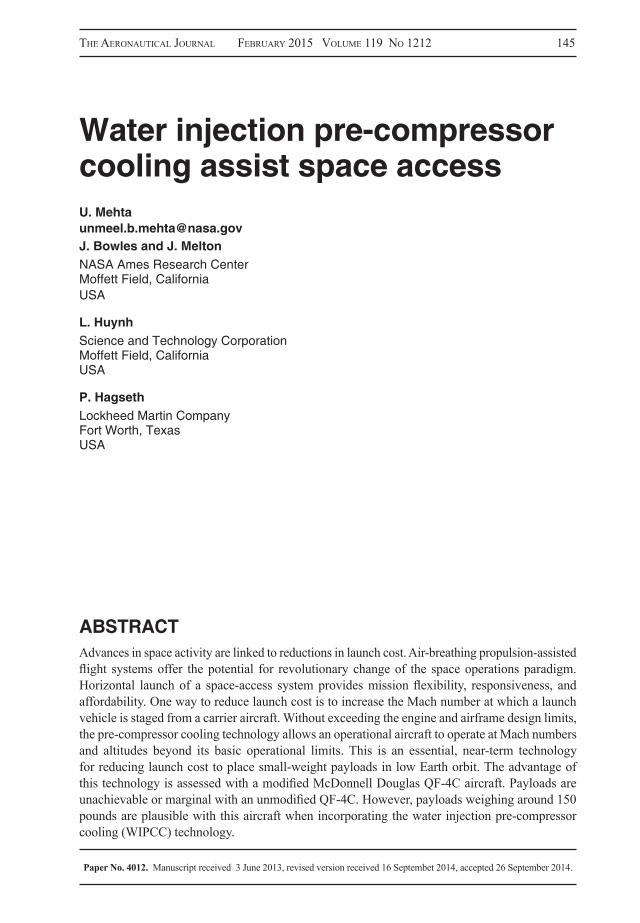
The PCC concept sprays water into the inlet duct of an engine operating at high-temperature condi-tions to reduce the temperature of the air by evapouration before it enters the engine compressor. The net effect of WIPCC is to increase the density of the inlet air and provide increased air capture. The reduced inlet air temperature and increased air mass to the engine have nearly the same effect as if the engine were operating on an extremely cold day. This low-cost technical approach allows a turbine engine to operate with its existing control systems at higher supersonic speeds and altitudes without modification and requalification, and to produce thrust at altitudes and Mach numbers beyond its designed maximum altitude and Mach number (Fig. 1). The injection of liquid oxidisers and water enables the engine to operate at even higher altitudes and Mach numbers than with water injection alone.
WIPCC could both overcome drag penalties owing to the launch vehicle and reduce the energy required for the launch vehicle to achieve orbit. WIPCC increases the staging Mach number and thus reduces the size of the staged system. A supersonic aircraft with WIPCC can achieve
4
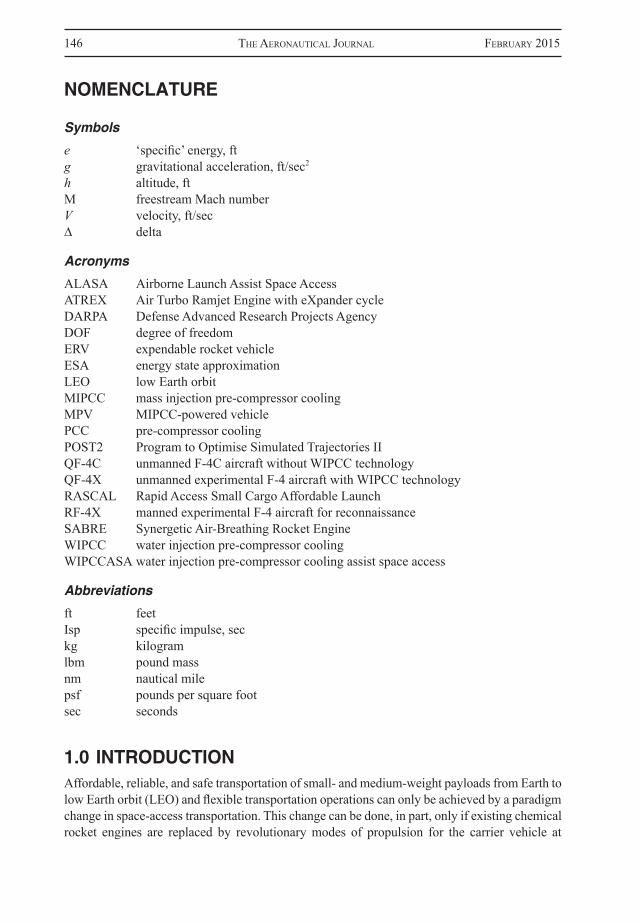
when necessary. Water tanks were mounted on the F-4E fuselage (Fig. 2). The RF-4X effort was cancelled for nontechnical reasons(36).
Figure 1. Fuel-specific excess power envelopes (i.e., equilibrium flight envelopes)
with and without pre-compressor cooling.
Figure 2. The RF-4X with enlarged inlets and with fuselage blisters for water tanks.
The RASCAL program coined the phrase “Mass Injection Pre-Compressor Cooling” in order to distinguish this pre-compressor cooling technique from those utilizing pre-compressor heat exchanger cooling. The word “mass” refers to water and/or a liquid oxidizer. In the present study, “water injection” instead of “mass injection” is used since we are considering only water injection to minimize cost and complexity by not handling liquid oxygen.
The goal of the RASCAL program was to develop a low-cost orbital insertion capability for micro-sized satellite payloads(38). RASCAL was intended to be a responsive small payload delivery system for flexible access to space. The concept included a reusable airplane-like carrier vehicle called the MIPCC-powered vehicle (MPV) and a two-stage, expendable rocket vehicle (ERV).
RASCAL was predicated on existing and off-the-shelf technologies: MIPCC propulsion enhancement and a newly built aircraft with four Pratt & Whitney F100-PW-220 engines. The motivation to use MIPCC was identical to that of Peace Jack. The coolants used were water and liquid oxygen. Based on analysis, it was predicted to achieve a maximum speed of about Mach 3, followed by a zoom maneuver and exo-atmospheric staging of the launch vehicle at approximately Mach 1.1, 180,000 ft altitude, and dynamic
4
when necessary. Water tanks were mounted on the F-4E fuselage (Fig. 2). The RF-4X effort was cancelled for nontechnical reasons(36).
Figure 1. Fuel-specific excess power envelopes (i.e., equilibrium flight envelopes)
with and without pre-compressor cooling.
Figure 2. The RF-4X with enlarged inlets and with fuselage blisters for water tanks.
The RASCAL program coined the phrase “Mass Injection Pre-Compressor Cooling” in order to distinguish this pre-compressor cooling technique from those utilizing pre-compressor heat exchanger cooling. The word “mass” refers to water and/or a liquid oxidizer. In the present study, “water injection” instead of “mass injection” is used since we are considering only water injection to minimize cost and complexity by not handling liquid oxygen.
The goal of the RASCAL program was to develop a low-cost orbital insertion capability for micro-sized satellite payloads(38). RASCAL was intended to be a responsive small payload delivery system for flexible access to space. The concept included a reusable airplane-like carrier vehicle called the MIPCC-powered vehicle (MPV) and a two-stage, expendable rocket vehicle (ERV).
RASCAL was predicated on existing and off-the-shelf technologies: MIPCC propulsion enhancement and a newly built aircraft with four Pratt & Whitney F100-PW-220 engines. The motivation to use MIPCC was identical to that of Peace Jack. The coolants used were water and liquid oxygen. Based on analysis, it was predicted to achieve a maximum speed of about Mach 3, followed by a zoom maneuver and exo-atmospheric staging of the launch vehicle at approximately Mach 1.1, 180,000 ft altitude, and dynamic
Figure 1. Fuel-specific excess power envelopes (i.e. equilibrium flight envelopes) with and without pre-compressor cooling.
Figure 2. The RF-4X with enlarged inlets and with fuselage blisters for water tanks.
mehTA et al WATer inJecTion pre-compressor cooling AssisT spAce Access 149
higher speed and altitude, and thus place a heavier payload in LEO than one without the WIPCC modification. WIPCC technology thus enlarges the operational range of the aircraft with the mated launch vehicle reducing the launch cost. This technology is appropriate for acceleration missions but not for long-duration cruise missions because of an increase in water usage and specific fuel consumption during WIPCC operation. The heat exchanger technology, which also provides the same advantages, is necessary for such cruise missions.
The relevant noteworthy attempts at the use of this technology are the Peace Jack project(36) (1973-1975) and the Rapid Access Small Cargo Affordable Launch (RASCAL) program(37) (2002-2005). The former used an F-4E with WIPCC for an advanced photoreconnaissance mission. The latter project planned to develop a new aircraft with MIPCC to launch small payloads to LEO.
The objective of Peace Jack was to modify an F-4E aircraft to enable operation at higher altitudes and speeds. This was to be achieved with PCC for thrust augmentation at supersonic speeds. PCC could be installed as a kit without major aircraft modification. The enhanced capability of the F-4E, in conjunction with PCC, was achieved with an increased inlet size to accommodate the additional airflow and/or capture area size required at the high Mach number and high-altitude condition, and with a bypass for air when necessary. Water tanks were mounted on the F-4E fuselage (Fig. 2). The RF-4X effort was cancelled for nontechnical reasons(36).
The RASCAL program coined the phrase ‘Mass Injection Pre-Compressor Cooling’ in order to distinguish this pre-compressor cooling technique from those utilising pre-compressor heat exchanger cooling. The word ‘mass’ refers to water and/or a liquid oxidiser. In the present study, ‘water injection’ instead of ‘mass injection’ is used since we are considering only water injection to minimise cost and complexity by not handling liquid oxygen.
The goal of the RASCAL program was to develop a low-cost orbital insertion capability for micro-sized satellite payloads(38). RASCAL was intended to be a responsive small payload delivery system for flexible access to space. The concept included a reusable aircraft-like carrier vehicle called the MIPCC-powered vehicle (MPV) and a two-stage, expendable rocket vehicle (ERV).
RASCAL was predicated on existing and off-the-shelf technologies: MIPCC propulsion enhancement and a newly built aircraft with four Pratt & Whitney F100-PW-220 engines. The motivation to use MIPCC was identical to that of Peace Jack. The coolants used were water and liquid oxygen. Based on analysis, it was predicted to achieve a maximum speed of about Mach 3, followed by a zoom manoeuvre and exo-atmospheric staging of the launch vehicle at approxi-mately Mach 1·1, 180,000ft altitude, and dynamic pressure of 1·0psf. The staging altitude was increased at the expense of delta-V (∆V). Exo-atmospheric staging was necessitated because the launch vehicle had no fairing to cover the payload.
The RASCAL program conducted MIPCC tests and experiments and demonstrated the utility of the propulsion augmentation technology. The MPV and ERV development portions of the program did not continue into Phase III(38), as the increasing costs to develop RASCAL exceeded what was felt to be practical(39).
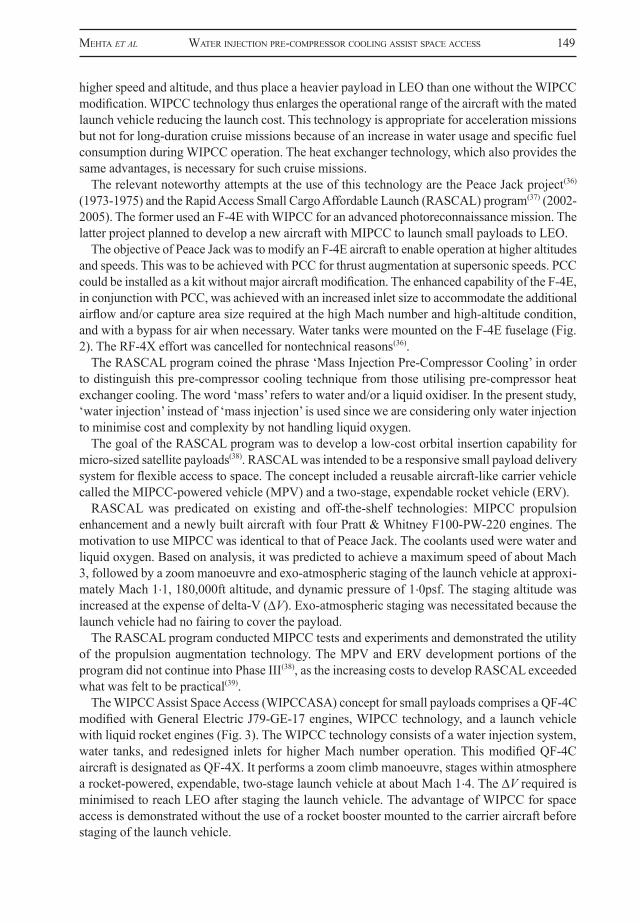
The WIPCC Assist Space Access (WIPCCASA) concept for small payloads comprises a QF-4C modified with General Electric J79-GE-17 engines, WIPCC technology, and a launch vehicle with liquid rocket engines (Fig. 3). The WIPCC technology consists of a water injection system, water tanks, and redesigned inlets for higher Mach number operation. This modified QF-4C aircraft is designated as QF-4X. It performs a zoom climb manoeuvre, stages within atmosphere a rocket-powered, expendable, two-stage launch vehicle at about Mach 1·4. The ∆V required is minimised to reach LEO after staging the launch vehicle. The advantage of WIPCC for space access is demonstrated without the use of a rocket booster mounted to the carrier aircraft before staging of the launch vehicle.
150 The AeronAuTicAl JournAl FebruAry 2015
3.0 ANALYSISThe performance of a WIPCC-enhanced turbine engine is evaluated, critical flight conditions defined, trajectory optimisation of the carrier mated with the launcher performed, and the launcher’s preliminary performance estimated. Aerodynamic and engine performance models, with and without WIPCC, have been developed at the engineering level to support initial trajectory optimisation. Performance comparisons are made between a reference supersonic QF-4C aircraft and a QF-4X aircraft.
3.1 Performance
The detailed drag polars(40) spanning the Mach number range from 0·4 to 2·4 for the baseline QF-4C were digitised and reformatted for use in Program to Optimise Simulated Trajectories II (POST2(41)). The POST program when determining instantaneous aerodynamic coefficients interpolated these data tables. Since the available data were extensive, models were not developed to build database; modelling errors were not introduced. In order to estimate the impact of the enlarged WIPCC inlets, water tanks, and the second stage of the QF-4X, zero lift drag increments were extracted from available theoretical data(42). After comparing RF-4X polars with those for the QF-4C, it became clear that the application of zero-lift drag offsets would be entirely sufficient for realistic QF-4X simulations.
Because complete engine data decks for the J79-GE-8, J79-GE-15 or J79-GE-17 engines were not available, the performance of the J79 turbojet engine, both with and with out WIPCC, was modeled using the corrected engine performance parameter method(43). This included thrust, fuel flow, and in the case of the WIPCC engine, the water flow rate. The selected independent engine operating parameter was the corrected relative inlet temperature. Curves of corrected thrust, fuel flow, and water flow rates were then developed as a function of this parameter. This approach allowed for prediction of the engine performance across a wide range of flight conditions.
5
pressure of 1.0 psf. The staging altitude was increased at the expense of delta-V (∆V). Exo-atmospheric staging was necessitated because the launch vehicle had no fairing to cover the payload.
The RASCAL program conducted MIPCC tests and experiments and demonstrated the utility of the propulsion augmentation technology. The MPV and ERV development portions of the program did not continue into Phase III(38), as the increasing costs to develop RASCAL exceeded what was felt to be practical(39).
The WIPCC Assist Space Access (WIPCCASA) concept for small payloads comprises a QF-4C modified with General Electric J79-GE-17 engines, WIPCC technology, and a launch vehicle with liquid rocket engines (Fig. 3). The WIPCC technology consists of a water injection system, water tanks, and redesigned inlets for higher Mach number operation. This modified QF-4C aircraft is designated as QF-4X. It performs a zoom climb maneuver, stages within atmosphere a rocket-powered, expendable, two-stage launch vehicle at about Mach 1.4. The ∆V required is minimized to reach LEO after staging the launch vehicle. The advantage of WIPCC for space access is demonstrated without the use of a rocket booster mounted to the carrier aircraft before staging of the launch vehicle.
Figure 3. The WIPCCASA concept for small payloads and its operation. 3.0 ANALYSIS
The performance of a WIPCC-enhanced turbine engine is evaluated, critical flight conditions defined, trajectory optimization of the carrier mated with the launcher performed, and the launcher’s preliminary performance estimated. Aerodynamic and engine performance models, with and without WIPCC, have been developed at the engineering level to support initial trajectory optimization. Performance comparisons are made between a reference supersonic QF-4C aircraft and a QF-4X aircraft. 3.1 Performance
The detailed drag polars(40) spanning the Mach number range from 0.4 to 2.4 for the baseline QF-4C were digitized and reformatted for use in Program to Optimize Simulated Trajectories II (POST2)(41). The POST program when determining instantaneous aerodynamic coefficients interpolated these data tables. Since the available data were extensive, models were not developed to build database; modeling errors were not introduced. In order to estimate the impact of the enlarged WIPCC inlets, water tanks, and the second stage of the QF-4X, zero lift drag increments were extracted from available theoretical data(42). After comparing RF-4X polars with those for the QF-4C, it became clear that the application of zero-lift drag offsets would be entirely sufficient for realistic QF-4X simulations.
Figure 3. The WIPCCASA concept for small payloads and its operation.
mehTA et al WATer inJecTion pre-compressor cooling AssisT spAce Access 151
Basic J79 engine performance consisted of engine thrust and fuel flow as a function of flight Mach number and altitude. Two sets of performance curves were developed, one for maximum afterburner operation of the J79-GE-17 engine, and another for J79-GE-8/15 engine performance at normal rated power. The former was used for climb performance and trajectory optimisation, while the latter was used for the post-staging fly-back trajectory modelling. The available data ranged from Mach 0 to 2·2 and an altitude range of 0 to 70,000ft.
The corrected thrust exhibits a Mach number dependence that was accounted for in the engine model used for the trajectory simulation, while the corrected fuel flow was found to be essentially independent of both Mach number and altitude for the purposes of this study. Finally, a corrected table of net thrust and fuel flow was developed for the J79-GE-8/15 at idle power, to be used for trajectory computations for post-launch flight and letdown after cruise back to the launch site. The dataset consisted of corrected net thrust and specific fuel consumption as a function of Mach number and altitude.
The performance of the J79-GE-17 engine with WIPCC was available at limited flight condi-tions(42) from efforts related to the Peace Jack(36) program. In anticipation of the numerical optimisation’s need for engine performance across the flight envelope, an approach was developed to generalise engine performance. The analysis method also included a model for predicting the compressor face total temperature using WIPCC, and applying the corrected engine performance method to the available data.
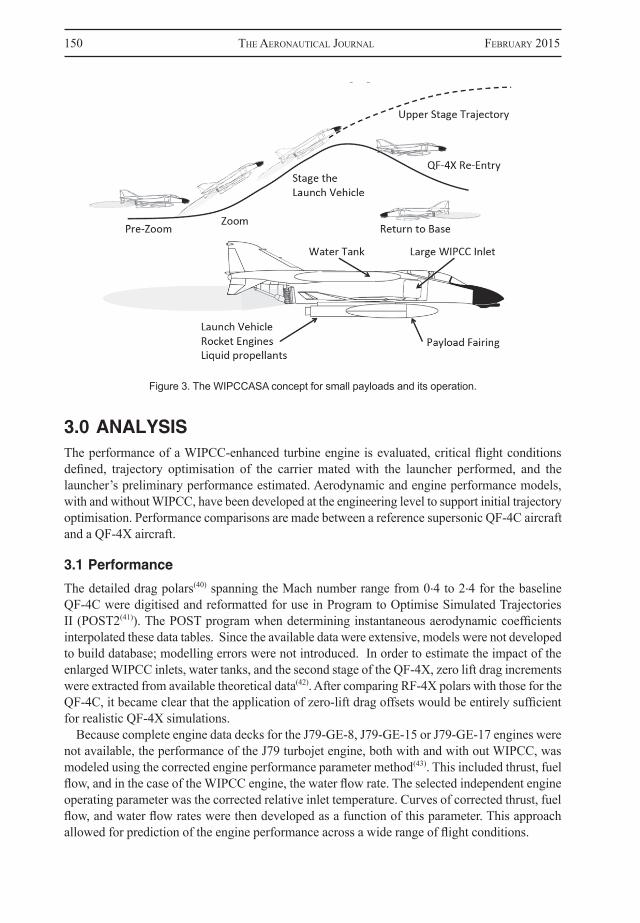
The first step was to model the effect of pre-compressor water injection on the total temperature at the compressor face. The control volume for the engine inlet is presented in Fig. 4. The process is assumed to be adiabatic. The inlet air total enthalpy is computed from freestream conditions, with the inlet temperature of the injected water assumed to be 100 degrees Fahrenheit. The enthalpy of saturated air-water mixture was computed as a function of static pressure, static temperature, and vapour-to-air mass ratio at Station 2. The static temperature at Station 2 was iterated until convergence on the total enthalpy of the mixture and the total temperature and vapour-to-air mass rate was determined. The prediction of compressor face total temperature and vapour-to-air mass rate were compared to the available data. Excellent agreement was achieved in both compressor face total temperature and vapour-to-air mass rate as a function of Mach number.
The second step in modelling the RF-4X/J79-GE-17 engine performance, both with and without WIPCC, was to apply the corrected engine parameter method to the available data. Based on the modelling of the J79-GE-8/15 engine performance, the corrected relative turbine inlet temperature was chosen as the independent parameter. The thrust performance of the RF-4X/J79-GE-17 engine
Figure 4. Engine inlet control volume for computing WIPCC performance.
152 The AeronAuTicAl JournAl FebruAry 2015
7
interpolation across the flight operating conditions. The engine performance with WIPCC exhibits an altitude dependency, probably tied to the water injection rate variation with altitude and drag dependence on the freestream Reynolds number.
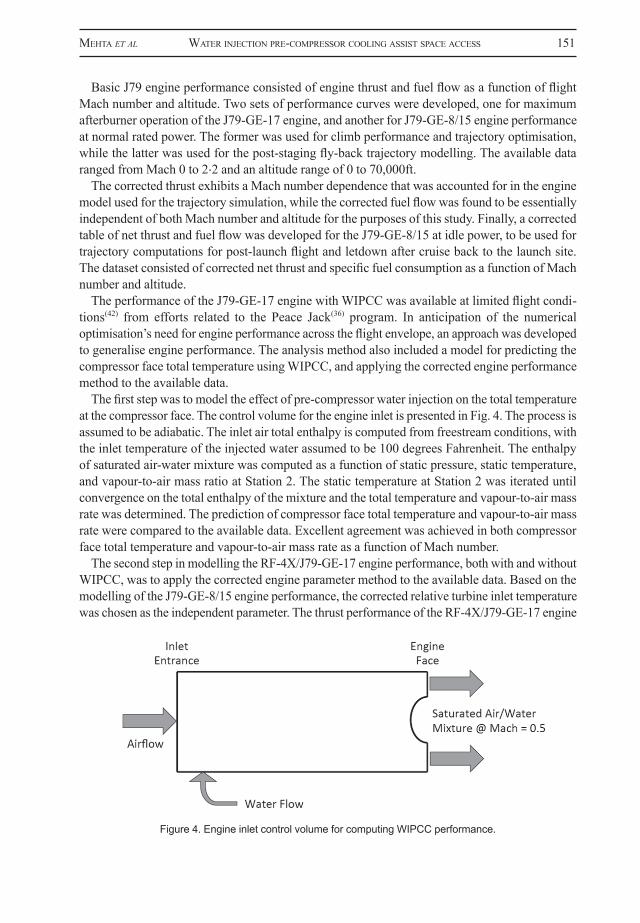
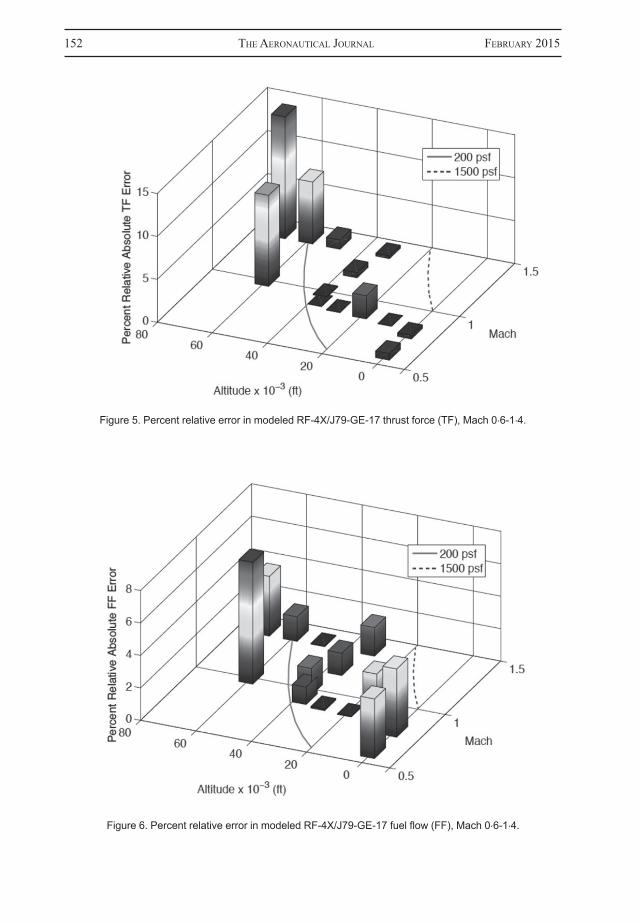
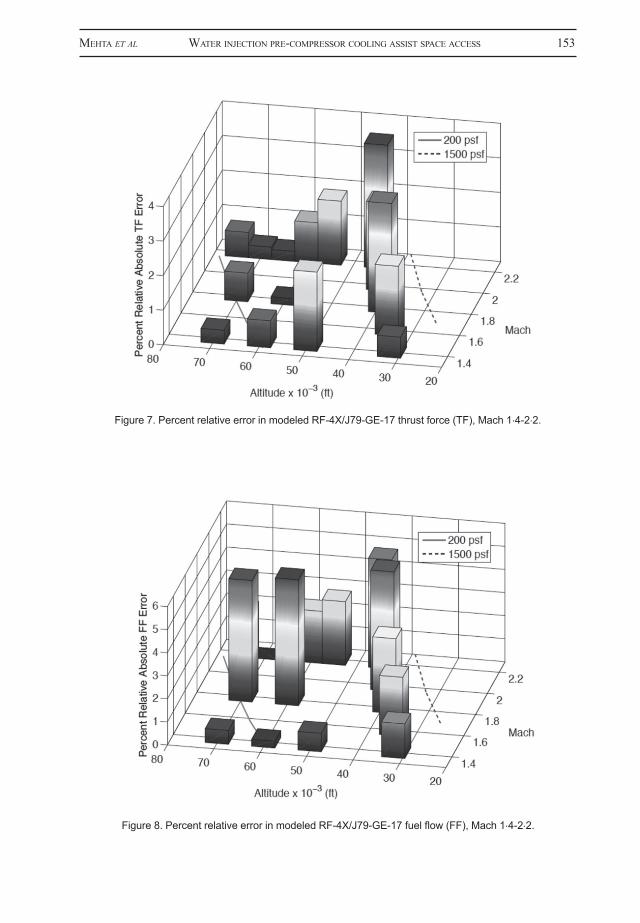
The curve-fits to the engine performance data used in the trajectory simulation were determined. Figures 5 and 6 present the relative error as a function of Mach number and altitude in the corrected engine parameter and/or curve-fit modeled performance with respect to the available data for the RF-4X/J79-GE-17 engine, with maximum afterburner operation in the range of Mach 0.6 to 1.4 and without WIPCC. Figures 7, 8, and 9 present the relative error in the corrected engine parameter/curve-fit modeled performance with respect to the available data for the RF-4X/J79-GE-17 configuration with WIPCC, in the range of Mach 1.4 to 2.2. Absolute values of relative errors are shown in the presented histograms.
Figure 5. Percent relative error in modeled RF-4X/J79-GE-17 thrust force (TF), Mach 0.6-1.4.
Figure 6. Percent relative error in modeled RF-4X/J79-GE-17 fuel flow (FF), Mach 0.6-1.4.
7
interpolation across the flight operating conditions. The engine performance with WIPCC exhibits an altitude dependency, probably tied to the water injection rate variation with altitude and drag dependence on the freestream Reynolds number.
The curve-fits to the engine performance data used in the trajectory simulation were determined. Figures 5 and 6 present the relative error as a function of Mach number and altitude in the corrected engine parameter and/or curve-fit modeled performance with respect to the available data for the RF-4X/J79-GE-17 engine, with maximum afterburner operation in the range of Mach 0.6 to 1.4 and without WIPCC. Figures 7, 8, and 9 present the relative error in the corrected engine parameter/curve-fit modeled performance with respect to the available data for the RF-4X/J79-GE-17 configuration with WIPCC, in the range of Mach 1.4 to 2.2. Absolute values of relative errors are shown in the presented histograms.
Figure 5. Percent relative error in modeled RF-4X/J79-GE-17 thrust force (TF), Mach 0.6-1.4.
Figure 6. Percent relative error in modeled RF-4X/J79-GE-17 fuel flow (FF), Mach 0.6-1.4.
Figure 5. Percent relative error in modeled RF-4X/J79-GE-17 thrust force (TF), Mach 0·6-1·4.
Figure 6. Percent relative error in modeled RF-4X/J79-GE-17 fuel flow (FF), Mach 0·6-1·4.
mehTA et al WATer inJecTion pre-compressor cooling AssisT spAce Access 153
8
Figure 7. Percent relative error in modeled RF-4X/J79-GE-17 thrust force (TF), Mach 1.4-2.2.
Figure 8. Percent relative error in modeled RF-4X/J79-GE-17 fuel flow (FF), Mach 1.4-2.2.
The modeled performance data do not match exactly with the reference performance data(42), because the latter set was available at limited conditions and owing to the curve fitting of the corrected engine performance parameters across the operating envelope. Without WIPCC, the general agreement is fairly good (Figs 5 and 6). The outlying points having largest percentage relative error in thrust of 14.2% at M = 1.4 and 70,000 ft and fuel flow error of 7.5% at M = 1.0 and 60,000 ft were ignored since the trajectory
Figure 7. Percent relative error in modeled RF-4X/J79-GE-17 thrust force (TF), Mach 1·4-2·2.
Figure 8. Percent relative error in modeled RF-4X/J79-GE-17 fuel flow (FF), Mach 1·4-2·2.
154 The AeronAuTicAl JournAl FebruAry 2015
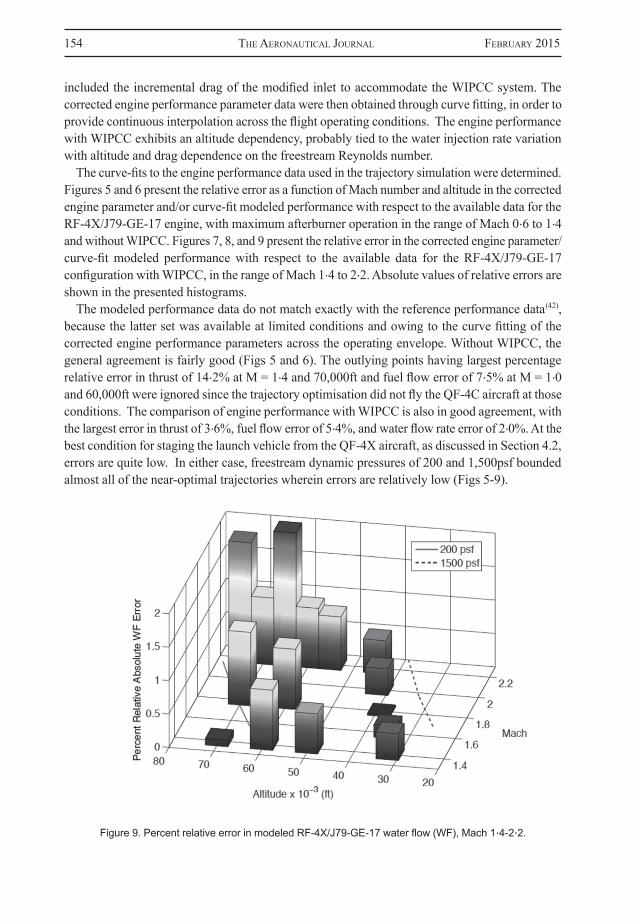
included the incremental drag of the modified inlet to accommodate the WIPCC system. The corrected engine performance parameter data were then obtained through curve fitting, in order to provide continuous interpolation across the flight operating conditions. The engine performance with WIPCC exhibits an altitude dependency, probably tied to the water injection rate variation with altitude and drag dependence on the freestream Reynolds number.
The curve-fits to the engine performance data used in the trajectory simulation were determined. Figures 5 and 6 present the relative error as a function of Mach number and altitude in the corrected engine parameter and/or curve-fit modeled performance with respect to the available data for the RF-4X/J79-GE-17 engine, with maximum afterburner operation in the range of Mach 0·6 to 1·4 and without WIPCC. Figures 7, 8, and 9 present the relative error in the corrected engine parameter/curve-fit modeled performance with respect to the available data for the RF-4X/J79-GE-17 configuration with WIPCC, in the range of Mach 1·4 to 2·2. Absolute values of relative errors are shown in the presented histograms.
The modeled performance data do not match exactly with the reference performance data(42), because the latter set was available at limited conditions and owing to the curve fitting of the corrected engine performance parameters across the operating envelope. Without WIPCC, the general agreement is fairly good (Figs 5 and 6). The outlying points having largest percentage relative error in thrust of 14·2% at M = 1·4 and 70,000ft and fuel flow error of 7·5% at M = 1·0 and 60,000ft were ignored since the trajectory optimisation did not fly the QF-4C aircraft at those conditions. The comparison of engine performance with WIPCC is also in good agreement, with the largest error in thrust of 3·6%, fuel flow error of 5·4%, and water flow rate error of 2·0%. At the best condition for staging the launch vehicle from the QF-4X aircraft, as discussed in Section 4.2, errors are quite low. In either case, freestream dynamic pressures of 200 and 1,500psf bounded almost all of the near-optimal trajectories wherein errors are relatively low (Figs 5-9).
9
optimization did not fly the QF-4C aircraft at those conditions. The comparison of engine performance with WIPCC is also in good agreement, with the largest error in thrust of 3.6%, fuel flow error of 5.4%, and water flow rate error of 2.0%. At the best condition for staging the launch vehicle from the QF-4X aircraft, as discussed in Section 4.2, errors are quite low. In either case, freestream dynamic pressures of 200 and 1500 psf bounded almost all of the near-optimal trajectories wherein errors are relatively low (Figs 5-9).
Figure 9. Percent relative error in modeled RF-4X/J79-GE-17 water flow (WF), Mach 1.4-2.2.
3.2 Energy State Approximation Trajectory Modeling As a first step in optimizing the trajectory of the QF-4C and QF-4X configurations, an energy state approximation (ESA) method(44) was used to optimize the ascent trajectory to the maximum level flight Mach number, with the objective function being minimum fuel for the QF-4C and minimum propellant (i.e., fuel plus water) for the QF-4X to climb. At this flight condition, a pull-up is initiated to zoom to the launch point, which is not modeled in the ESA method here. The ESA method substitutes total specific energy as the prime dependent variable and neglects all the time derivatives of the other state variables to produce a “near-optimum” trajectory and the associated control law, in this case, the angle of attack versus total specific energy. The only motivation for using the ESA method here is to provide an initial guess at the optimal control to be used in the POST2, a numerical optimization code. The plotted ESA results show some chatter in the near optimum solution, a characteristic of both the ESA method and of the choice of energy or altitude step size selected.
The aerodynamic and engine performance data described in Section 3.1 was used to compute the ESA optimized trajectory needed for minimum fuel (QF-4C) or propellant (QF-4X) in order to climb each energy step. Maximum and minimum freestream dynamic pressure constraints of 1,300 psf and 50 psf, respectively, were introduced as bounds on the ESA search method for minimum fuel or propellant to climb each energy step. The angle of attack was limited to a maximum value of 15º. The objective function for minimization across each energy step is the total propellant divided by the specific excess power. The initial climb point was defined to be Mach 0.5 at 5,000 ft altitude.
Figure 10 shows the near-optimal altitude versus Mach number trace for both configurations. For both vehicles, no additional drag owing to the externally carried upper stage is assumed at this point. Both vehicles accelerate to approximately Mach 0.9 and begin to achieve a nearly constant subsonic Mach
Figure 9. Percent relative error in modeled RF-4X/J79-GE-17 water flow (WF), Mach 1·4-2·2.
mehTA et al WATer inJecTion pre-compressor cooling AssisT spAce Access 155
3.2 Energy state approximation trajectory modelling
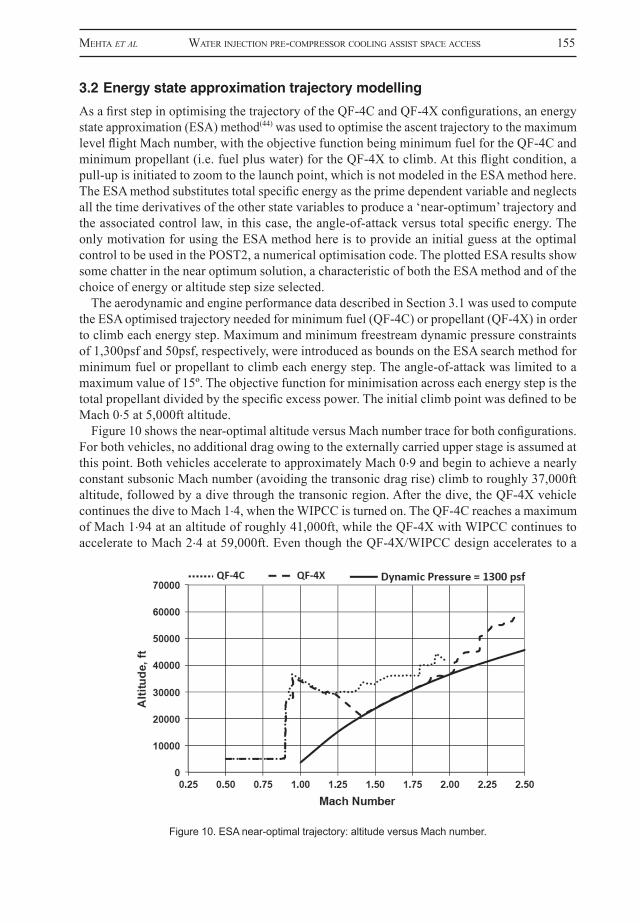
As a first step in optimising the trajectory of the QF-4C and QF-4X configurations, an energy state approximation (ESA) method(44) was used to optimise the ascent trajectory to the maximum level flight Mach number, with the objective function being minimum fuel for the QF-4C and minimum propellant (i.e. fuel plus water) for the QF-4X to climb. At this flight condition, a pull-up is initiated to zoom to the launch point, which is not modeled in the ESA method here. The ESA method substitutes total specific energy as the prime dependent variable and neglects all the time derivatives of the other state variables to produce a ‘near-optimum’ trajectory and the associated control law, in this case, the angle-of-attack versus total specific energy. The only motivation for using the ESA method here is to provide an initial guess at the optimal control to be used in the POST2, a numerical optimisation code. The plotted ESA results show some chatter in the near optimum solution, a characteristic of both the ESA method and of the choice of energy or altitude step size selected.
The aerodynamic and engine performance data described in Section 3.1 was used to compute the ESA optimised trajectory needed for minimum fuel (QF-4C) or propellant (QF-4X) in order to climb each energy step. Maximum and minimum freestream dynamic pressure constraints of 1,300psf and 50psf, respectively, were introduced as bounds on the ESA search method for minimum fuel or propellant to climb each energy step. The angle-of-attack was limited to a maximum value of 15º. The objective function for minimisation across each energy step is the total propellant divided by the specific excess power. The initial climb point was defined to be Mach 0·5 at 5,000ft altitude.
Figure 10 shows the near-optimal altitude versus Mach number trace for both configurations. For both vehicles, no additional drag owing to the externally carried upper stage is assumed at this point. Both vehicles accelerate to approximately Mach 0·9 and begin to achieve a nearly constant subsonic Mach number (avoiding the transonic drag rise) climb to roughly 37,000ft altitude, followed by a dive through the transonic region. After the dive, the QF-4X vehicle continues the dive to Mach 1·4, when the WIPCC is turned on. The QF-4C reaches a maximum of Mach 1·94 at an altitude of roughly 41,000ft, while the QF-4X with WIPCC continues to accelerate to Mach 2·4 at 59,000ft. Even though the QF-4X/WIPCC design accelerates to a
10
number (avoiding the transonic drag rise) climb to roughly 37,000 ft altitude, followed by a dive through the transonic region. After the dive, the QF-4X vehicle continues the dive to Mach 1.4, when the WIPCC is turned on. The QF-4C reaches a maximum of Mach 1.94 at an altitude of roughly 41,000 ft, while the QF-4X with WIPCC continues to accelerate to Mach 2.4 at 59,000 ft. Even though the QF-4X/WIPCC design accelerates to a higher Mach number and altitude, it takes less time to reach the final climb point, 290 seconds versus over 500 seconds for the QF-4C (Fig. 11).
Figure 10. ESA near-optimal trajectory: altitude versus Mach number.
Figure 11. ESA near-optimal trajectory: altitude versus time.
As seen in Fig. 12, both configurations fly similar freestream dynamic pressure profiles up to the
initiation of the transonic dive maneuver. Only the QF-4X hits the maximum dynamic pressure limit, starting from around Mach 1.4 to Mach 2.0. WIPCC provides a significant increase in the specific excess power above Mach 1.4. The QF-4X uses less total propellant compared to the fuel used by the QF-4C. The near-optimal control is presented in Fig. 13, depicting the angle of attack versus total specific energy. Up to the end of the transonic dive, the near-optimal control is virtually the same for both vehicles. During the supersonic climb phase, the QF-4X flies at a lower angle of attack, owing to the higher flight dynamic pressure compared to that of the basic QF-4C during this phase.
Figure 10. ESA near-optimal trajectory: altitude versus Mach number.

156 The AeronAuTicAl JournAl FebruAry 2015
higher Mach number and altitude, it takes less time to reach the final climb point, 290 seconds versus over 500 seconds for the QF-4C (Fig. 11).
As seen in Fig. 12, both configurations fly similar freestream dynamic pressure profiles up to the initiation of the transonic dive manoeuvre. Only the QF-4X hits the maximum dynamic pressure limit, starting from around Mach 1·4 to Mach 2·0. WIPCC provides a significant increase in the specific excess power above Mach 1·4. The QF-4X uses less total propellant compared to the fuel used by the QF-4C. The near-optimal control is presented in Fig. 13, depicting the angle-of-attack versus total specific energy. Up to the end of the transonic dive, the near-optimal control is virtually the same for both vehicles. During the supersonic climb phase, the QF-4X flies at a lower angle-of-attack, owing to the higher flight dynamic pressure compared to that of the basic QF-4C during this phase.
10
number (avoiding the transonic drag rise) climb to roughly 37,000 ft altitude, followed by a dive through the transonic region. After the dive, the QF-4X vehicle continues the dive to Mach 1.4, when the WIPCC is turned on. The QF-4C reaches a maximum of Mach 1.94 at an altitude of roughly 41,000 ft, while the QF-4X with WIPCC continues to accelerate to Mach 2.4 at 59,000 ft. Even though the QF-4X/WIPCC design accelerates to a higher Mach number and altitude, it takes less time to reach the final climb point, 290 seconds versus over 500 seconds for the QF-4C (Fig. 11).
Figure 10. ESA near-optimal trajectory: altitude versus Mach number.
Figure 11. ESA near-optimal trajectory: altitude versus time.
As seen in Fig. 12, both configurations fly similar freestream dynamic pressure profiles up to the
initiation of the transonic dive maneuver. Only the QF-4X hits the maximum dynamic pressure limit, starting from around Mach 1.4 to Mach 2.0. WIPCC provides a significant increase in the specific excess power above Mach 1.4. The QF-4X uses less total propellant compared to the fuel used by the QF-4C. The near-optimal control is presented in Fig. 13, depicting the angle of attack versus total specific energy. Up to the end of the transonic dive, the near-optimal control is virtually the same for both vehicles. During the supersonic climb phase, the QF-4X flies at a lower angle of attack, owing to the higher flight dynamic pressure compared to that of the basic QF-4C during this phase.
11
Figure 12. ESA near-optimal trajectory: dynamic pressure versus time.
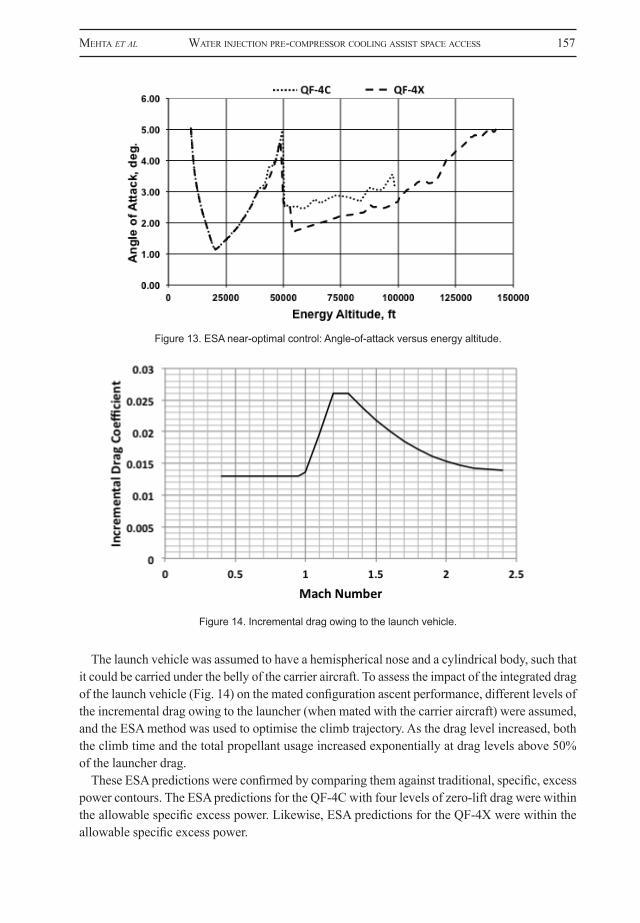
Figure 13. ESA near-optimal control: Angle of attack versus energy altitude.
The launch vehicle was assumed to have a hemispherical nose and a cylindrical body, such that it
could be carried under the belly of the carrier aircraft. To assess the impact of the integrated drag of the launch vehicle (Fig. 14) on the mated configuration ascent performance, different levels of the incremental drag owing to the launcher (when mated with the carrier aircraft) were assumed, and the ESA method was used to optimize the climb trajectory. As the drag level increased, both the climb time and the total propellant usage increased exponentially at drag levels above 50% of the launcher drag.
These ESA predictions were confirmed by comparing them against traditional, specific, excess power contours. The ESA predictions for the QF-4C with four levels of zero-lift drag were within the allowable specific excess power. Likewise, ESA predictions for the QF-4X were within the allowable specific excess power.
Figure 11. ESA near-optimal trajectory: altitude versus time.
Figure 12. ESA near-optimal trajectory: dynamic pressure versus time.
mehTA et al WATer inJecTion pre-compressor cooling AssisT spAce Access 157
The launch vehicle was assumed to have a hemispherical nose and a cylindrical body, such that it could be carried under the belly of the carrier aircraft. To assess the impact of the integrated drag of the launch vehicle (Fig. 14) on the mated configuration ascent performance, different levels of the incremental drag owing to the launcher (when mated with the carrier aircraft) were assumed, and the ESA method was used to optimise the climb trajectory. As the drag level increased, both the climb time and the total propellant usage increased exponentially at drag levels above 50% of the launcher drag.
These ESA predictions were confirmed by comparing them against traditional, specific, excess power contours. The ESA predictions for the QF-4C with four levels of zero-lift drag were within the allowable specific excess power. Likewise, ESA predictions for the QF-4X were within the allowable specific excess power.
Figure 13. ESA near-optimal control: Angle-of-attack versus energy altitude.
Figure 14. Incremental drag owing to the launch vehicle.
158 The AeronAuTicAl JournAl FebruAry 2015
3.3 Trajectory
In order to assess the WIPCC capabilities, the 3-degree-of-freedom (DOF) trajectories of the QF-4C and QF-4X were simulated with POST2. This is accomplished in two parts: the first part addresses the advantages of the WIPCC QF-4X over the QF-4C, and the second part assesses the impact of the upper stage drag on the performance of the QF-4X.
Each simulated trajectory consists of two phases: ascent and fly-back. The ascent phase is started at an altitude of 5,000ft with the system (QF-4C, QF-4X, or one of these aircraft with the launch vehicle) weighing 56,139lbm and flying at Mach 0·75 and at 2·703 degrees incidence. The ascent trajectory is simulated in POST2 as an optimisation problem with the objective function being the minimisation of the total propellant consumed. The constraints are the dynamic pressure limit (approximately 1,500psf) and the final minimum altitude (90,000ft). The dynamic pressure constraint assures the vehicle structural integrity. The final minimum altitude constraint forces POST2 to perform the zoom manoeuvre at the end of the ascent phase. This constraint ensures advantageous upper stage launch conditions (high flight path angle, low dynamic pressure). The simulated ascent trajectory is divided into 12 phases marked by ‘specific’ energy (e = V2 / (2g) + h), with angle-of-attack as the control parameter. The exception is the last (zoom) phase that ends when the rate of climb becomes zero.
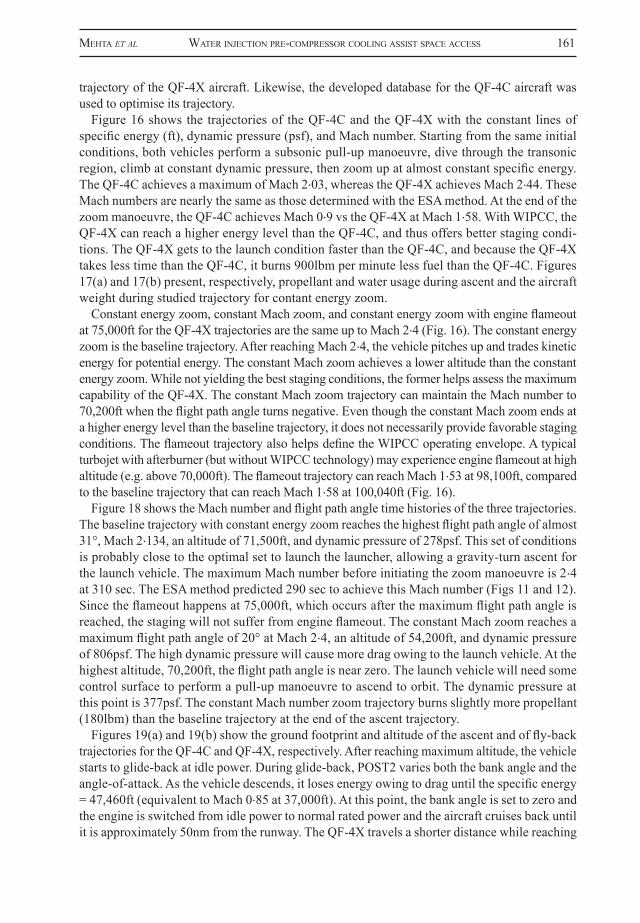
During ascent, the engine is on the maximum afterburner setting. The corrections to thrust, fuel flow, and water flow discussed in Section 3.1 are included in POST2 through generalised tables. In order to avoid extrapolation, engine performance at Mach 2·6 was set to be the same as at Mach 2·0 (because the engine inlet is designed for Mach 2·2 and the original data goes up to Mach 2·4). Starting from Mach 0·75, an altitude of 5,000ft, and at a down range distance of 50 nautical miles (nm), the vehicle must reach specific energy of 128,800ft (equivalent to Mach 2·4 at 45,000ft altitude) before it begins the zoom climb phase. During the zoom phase, the vehicle flies at high angle-of-attack (~8°) until the vehicle reaches the maximum altitude. The starting weight of the QF-4C aircraft is assumed to be the same as that of the QF-4X, with or without the launch vehicle.
In this study, the optimisation method used in POST2 is based on the projected gradient search. It is very important to begin with a good initial guess to help POST2 find the solution. For this estimate, ESA provides excellent guidance. Based on the ESA solution, the ascent trajectory consists of five
13
The fly-back abort option is set up in POST2 as a targeting problem. Starting from the final conditions of the ascent trajectory, at an altitude of about 100,000 ft, the vehicle glides (idle power setting) and banks until e = 47,460 ft (equivalent to Mach 0.85 at 37,000 ft). The angle of attack and the bank angle are used as control variables during the glide. This specific energy is chosen because it is the optimum cruise condition for the QF-4C at the normal rated power setting. The vehicle then cruises back to the target longitude and latitude, about 50 nm from the runway. The flight direction toward the runway is set before the cruise phase is started. During the cruise phase, the bank angle is set to zero and the angle of attack is the only control variable. The approach and landing phase is not simulated in this study, but the fuel required (2,000 lbm) for this phase is included in the total mission propellant required. The empty weight of both QF-4C and QF-4X aircraft is assumed to be the same, specifically, 32,203 lbm.
4.0 RESULTS
4.1 Results Without Launch Vehicle
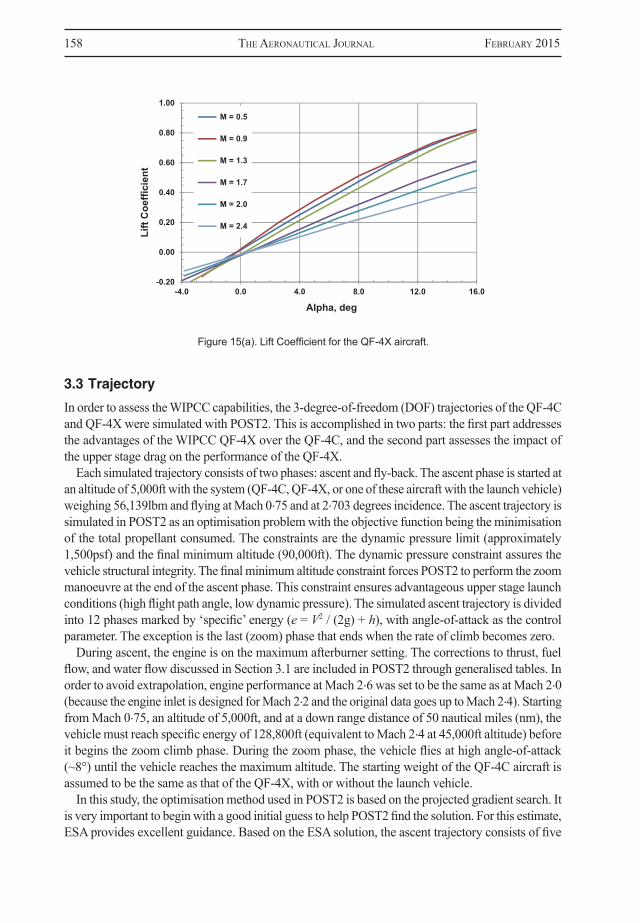
Figure 15 shows some developed drag polars for the QF-4X aircraft. Figures 15a and Fig. 15b provide the lift coefficient at different angles of attack and Mach numbers and the drag coefficient for different values of the lift coeificient, respectively. This database was used to optimize the trajectory of the QF-4X aircraft. Likewise, the developed database for the QF-4C aircraft was used to optimize its trajectory.
Figure 15a. Lift Coefficient for the QF-4X aircraft. Figure 16 shows the trajectories of the QF-4C and the QF-4X with the constant lines of specific energy (ft), dynamic pressure (psf), and Mach number. Starting from the same initial conditions, both vehicles perform a subsonic pull-up maneuver, dive through the transonic region, climb at constant dynamic pressure, then zoom up at almost constant specific energy. The QF-4C achieves a maximum of Mach 2.03, whereas the QF-4X achieves Mach 2.44. These Mach numbers are nearly the same as those determined with the ESA method. At the end of the zoom maneuver, the QF-4C achieves Mach 0.9 vs. the QF-4X at Mach 1.58. With WIPCC, the QF-4X can reach a higher energy level than the QF-4C, and thus offers better staging conditions. The QF-4X gets to the launch condition faster than the QF-4C, and
-0.20
0.00
0.20
0.40
0.60
0.80
1.00
-4.0 0.0 4.0 8.0 12.0 16.0
Lift
Coe
ffici
ent
Alpha, deg
M = 0.5
M = 0.9
M = 1.3
M = 1.7
M = 2.0
M = 2.4
Figure 15(a). Lift Coefficient for the QF-4X aircraft.
mehTA et al WATer inJecTion pre-compressor cooling AssisT spAce Access 159
phases: (1) Accelerate to Mach 0·9 at constant altitude. (2) Pull up to an altitude of approximately 40,000ft at a constant Mach number (about 0·9). (3) Dive through the transonic region to Mach 1·4 when the WIPPC technology is activated. (4) Climb at constant dynamic pressure until e = 128,800ft - this is the ‘specific’ energy at Mach 1·4 and 45,000ft. (5) Zoom up at approximately alpha 8° until the rate of climb becomes zero.
The simulated trajectory in POST2 is constructed to include the above phases. In each of these phases, the control variable, the angle-of-attack, is constrained to vary linearly. Some of the critical POST2 values that mark the event are also varied to give the optimiser more flexibility. The objective is to maximise the system weight (that is, to minimise fuel/propellant usage) at the end of the zoom phase.
The fly-back abort option is set up in POST2 as a targeting problem. Starting from the final conditions of the ascent trajectory, at an altitude of about 100,000ft, the vehicle glides (idle power setting) and banks until e = 47,460ft (equivalent to Mach 0·85 at 37,000ft). The angle-of-attack and the bank angle are used as control variables during the glide. This specific energy is chosen because it is the optimum cruise condition for the QF-4C at the normal rated power setting. The vehicle then cruises back to the target longitude and latitude, about 50nm from the runway. The flight direction toward the runway is set before the cruise phase is started. During the cruise phase, the bank angle is set to zero and the angle-of-attack is the only control variable. The approach and landing phase is not simulated in this study, but the fuel required (2,000lbm) for this phase is included in the total mission propellant required. The empty weight of both QF-4C and QF-4X aircraft is assumed to be the same, specifically, 32,203lbm.
4.0 RESULTS
4.1 Results without launch vehicle
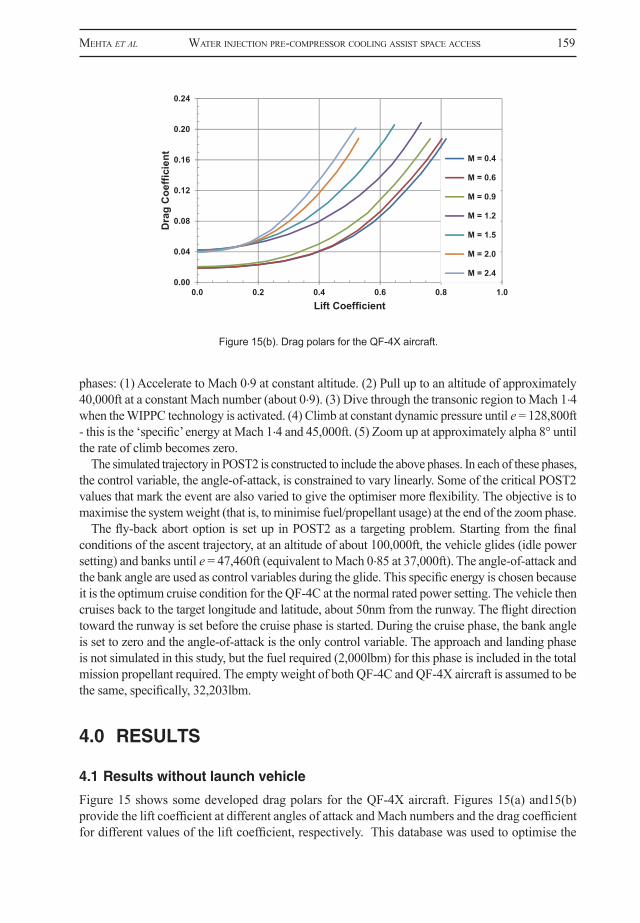
Figure 15 shows some developed drag polars for the QF-4X aircraft. Figures 15(a) and15(b) provide the lift coefficient at different angles of attack and Mach numbers and the drag coefficient for different values of the lift coefficient, respectively. This database was used to optimise the
14
because the QF-4X takes less time than the QF-4C, it burns 900 lbm per minute less fuel than the QF-4C. Figures 17a and 17b present, respectively, propellant and water usage during ascent and the aircraft weight during studied trajectory for contant energy zoom.
Figure 15b. Drag polars for the QF-4X aircraft.
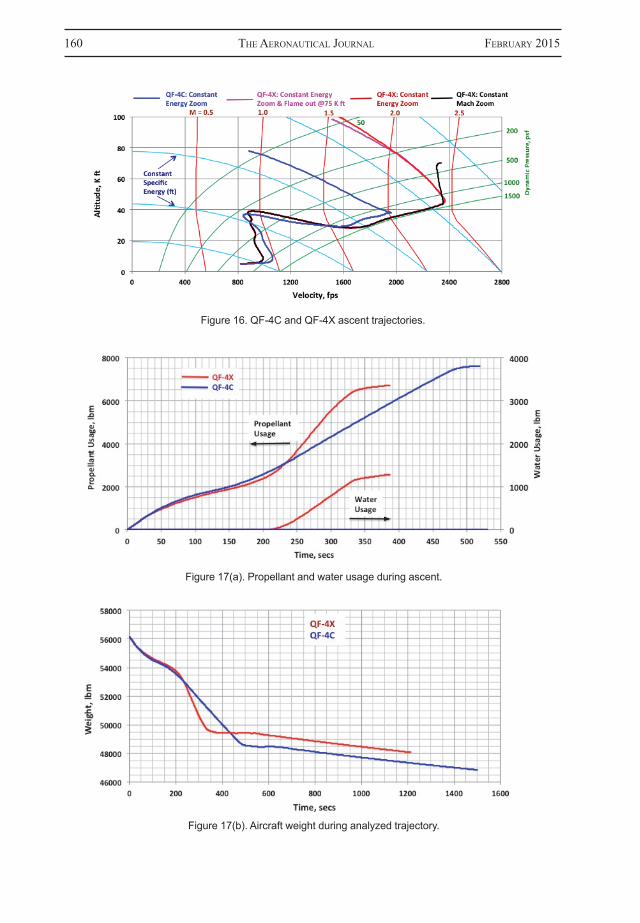
Figure 16. QF-4C and QF-4X ascent trajectories.
Constant energy zoom, constant Mach zoom, and constant energy zoom with engine flameout at
75,000 ft for the QF-4X trajectories are the same up to Mach 2.4 (Fig. 16). The constant energy zoom is the baseline trajectory. After reaching Mach 2.4, the vehicle pitches up and trades kinetic energy for potential energy. The constant Mach zoom achieves a lower altitude than the constant energy zoom. While not yielding the best staging conditions, the former helps assess the maximum capability of the QF-4X. The constant Mach zoom trajectory can maintain the Mach number to 70,200 ft when the flight path
0.00
0.04
0.08
0.12
0.16
0.20
0.24
0.0 0.2 0.4 0.6 0.8 1.0
Dra
g C
oeffi
cien
t
Lift Coefficient
M = 0.4
M = 0.6
M = 0.9
M = 1.2
M = 1.5
M = 2.0
M = 2.4
Figure 15(b). Drag polars for the QF-4X aircraft.
160 The AeronAuTicAl JournAl FebruAry 2015
15
angle turns negative. Even though the constant Mach zoom ends at a higher energy level than the baseline trajectory, it does not necessarily provide favorable staging conditions. The flameout trajectory also helps define the WIPCC operating envelope. A typical turbojet with afterburner (but without WIPCC technology) may experience engine flameout at high altitude (e.g., above 70,000 ft). The flameout trajectory can reach Mach 1.53 at 98,100 ft, compared to the baseline trajectory that can reach Mach 1.58 at 100,040 ft (Fig. 16).
Figure 17a. Propellant and water usage during ascent.
Figure 17b. Aircraft weight during analyzed trajectory.
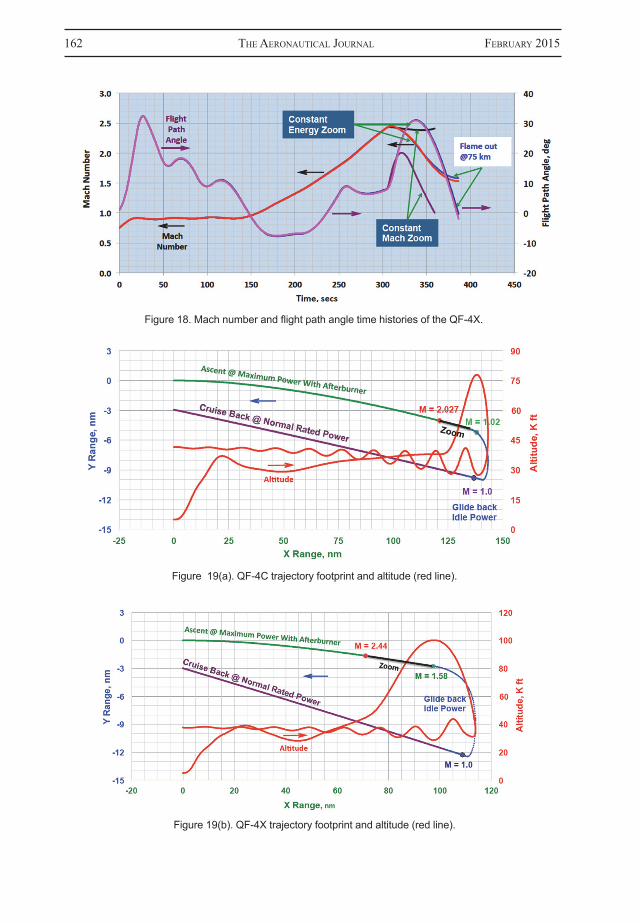
Figure 18 shows the Mach number and flight path angle time histories of the three trajectories. The
baseline trajectory with constant energy zoom reaches the highest flight path angle of almost 31o, Mach 2.134, an altitude of 71,500 ft, and dynamic pressure of 278 psf. This set of conditions is probably close to the optimal set to launch the launcher, allowing a gravity-turn ascent for the launch vehicle. The maximum Mach number before initiating the zoom maneuver is 2.4 at 310 sec. The ESA method predicted 290 sec to achieve this Mach number (Figs 11 and 12). Since the flameout happens at 75,000 ft, which occurs after the maximum flight path angle is reached, the staging will not suffer from engine flameout. The constant Mach zoom reaches a maximum flight path angle of 20o at Mach 2.4, an altitude of 54,200 ft, and dynamic pressure of 806 psf. The high dynamic pressure will cause more drag owing to the launch vehicle. At the highest altitude, 70,200 ft, the flight path angle is near zero. The launch vehicle will need some control surface to perform a pull-up maneuver to ascend to orbit. The dynamic pressure at
15
angle turns negative. Even though the constant Mach zoom ends at a higher energy level than the baseline trajectory, it does not necessarily provide favorable staging conditions. The flameout trajectory also helps define the WIPCC operating envelope. A typical turbojet with afterburner (but without WIPCC technology) may experience engine flameout at high altitude (e.g., above 70,000 ft). The flameout trajectory can reach Mach 1.53 at 98,100 ft, compared to the baseline trajectory that can reach Mach 1.58 at 100,040 ft (Fig. 16).
Figure 17a. Propellant and water usage during ascent.
Figure 17b. Aircraft weight during analyzed trajectory.
Figure 18 shows the Mach number and flight path angle time histories of the three trajectories. The
baseline trajectory with constant energy zoom reaches the highest flight path angle of almost 31o, Mach 2.134, an altitude of 71,500 ft, and dynamic pressure of 278 psf. This set of conditions is probably close to the optimal set to launch the launcher, allowing a gravity-turn ascent for the launch vehicle. The maximum Mach number before initiating the zoom maneuver is 2.4 at 310 sec. The ESA method predicted 290 sec to achieve this Mach number (Figs 11 and 12). Since the flameout happens at 75,000 ft, which occurs after the maximum flight path angle is reached, the staging will not suffer from engine flameout. The constant Mach zoom reaches a maximum flight path angle of 20o at Mach 2.4, an altitude of 54,200 ft, and dynamic pressure of 806 psf. The high dynamic pressure will cause more drag owing to the launch vehicle. At the highest altitude, 70,200 ft, the flight path angle is near zero. The launch vehicle will need some control surface to perform a pull-up maneuver to ascend to orbit. The dynamic pressure at
Figure 16. QF-4C and QF-4X ascent trajectories.
Figure 17(a). Propellant and water usage during ascent.
Figure 17(b). Aircraft weight during analyzed trajectory.
mehTA et al WATer inJecTion pre-compressor cooling AssisT spAce Access 161
trajectory of the QF-4X aircraft. Likewise, the developed database for the QF-4C aircraft was used to optimise its trajectory.
Figure 16 shows the trajectories of the QF-4C and the QF-4X with the constant lines of specific energy (ft), dynamic pressure (psf), and Mach number. Starting from the same initial conditions, both vehicles perform a subsonic pull-up manoeuvre, dive through the transonic region, climb at constant dynamic pressure, then zoom up at almost constant specific energy. The QF-4C achieves a maximum of Mach 2·03, whereas the QF-4X achieves Mach 2·44. These Mach numbers are nearly the same as those determined with the ESA method. At the end of the zoom manoeuvre, the QF-4C achieves Mach 0·9 vs the QF-4X at Mach 1·58. With WIPCC, the QF-4X can reach a higher energy level than the QF-4C, and thus offers better staging condi-tions. The QF-4X gets to the launch condition faster than the QF-4C, and because the QF-4X takes less time than the QF-4C, it burns 900lbm per minute less fuel than the QF-4C. Figures 17(a) and 17(b) present, respectively, propellant and water usage during ascent and the aircraft weight during studied trajectory for contant energy zoom.
Constant energy zoom, constant Mach zoom, and constant energy zoom with engine flameout at 75,000ft for the QF-4X trajectories are the same up to Mach 2·4 (Fig. 16). The constant energy zoom is the baseline trajectory. After reaching Mach 2·4, the vehicle pitches up and trades kinetic energy for potential energy. The constant Mach zoom achieves a lower altitude than the constant energy zoom. While not yielding the best staging conditions, the former helps assess the maximum capability of the QF-4X. The constant Mach zoom trajectory can maintain the Mach number to 70,200ft when the flight path angle turns negative. Even though the constant Mach zoom ends at a higher energy level than the baseline trajectory, it does not necessarily provide favorable staging conditions. The flameout trajectory also helps define the WIPCC operating envelope. A typical turbojet with afterburner (but without WIPCC technology) may experience engine flameout at high altitude (e.g. above 70,000ft). The flameout trajectory can reach Mach 1·53 at 98,100ft, compared to the baseline trajectory that can reach Mach 1·58 at 100,040ft (Fig. 16).
Figure 18 shows the Mach number and flight path angle time histories of the three trajectories. The baseline trajectory with constant energy zoom reaches the highest flight path angle of almost 31°, Mach 2·134, an altitude of 71,500ft, and dynamic pressure of 278psf. This set of conditions is probably close to the optimal set to launch the launcher, allowing a gravity-turn ascent for the launch vehicle. The maximum Mach number before initiating the zoom manoeuvre is 2·4 at 310 sec. The ESA method predicted 290 sec to achieve this Mach number (Figs 11 and 12). Since the flameout happens at 75,000ft, which occurs after the maximum flight path angle is reached, the staging will not suffer from engine flameout. The constant Mach zoom reaches a maximum flight path angle of 20° at Mach 2·4, an altitude of 54,200ft, and dynamic pressure of 806psf. The high dynamic pressure will cause more drag owing to the launch vehicle. At the highest altitude, 70,200ft, the flight path angle is near zero. The launch vehicle will need some control surface to perform a pull-up manoeuvre to ascend to orbit. The dynamic pressure at this point is 377psf. The constant Mach number zoom trajectory burns slightly more propellant (180lbm) than the baseline trajectory at the end of the ascent trajectory.
Figures 19(a) and 19(b) show the ground footprint and altitude of the ascent and of fly-back trajectories for the QF-4C and QF-4X, respectively. After reaching maximum altitude, the vehicle starts to glide-back at idle power. During glide-back, POST2 varies both the bank angle and the angle-of-attack. As the vehicle descends, it loses energy owing to drag until the specific energy = 47,460ft (equivalent to Mach 0·85 at 37,000ft). At this point, the bank angle is set to zero and the engine is switched from idle power to normal rated power and the aircraft cruises back until it is approximately 50nm from the runway. The QF-4X travels a shorter distance while reaching
162 The AeronAuTicAl JournAl FebruAry 2015
16
this point is 377 psf. The constant Mach number zoom trajectory burns slightly more propellant (180 lbm) than the baseline trajectory at the end of the ascent trajectory.
Figures 19a and 19b show the ground footprint and altitude of the ascent and of fly-back trajectories for the QF-4C and QF-4X, respectively. After reaching maximum altitude, the vehicle starts to glide-back at idle power. During glide-back, POST2 varies both the bank angle and the angle of attack. As the vehicle descends, it loses energy owing to drag until the specific energy = 47,460 ft (equivalent to Mach 0.85 at 37,000 ft). At this point, the bank angle is set to zero and the engine is switched from idle power to normal rated power and the aircraft cruises back until it is approximately 50 nm from the runway. The QF-4X travels a shorter distance while reaching a higher Mach number and altitude (energy level). This also means the fly-back distance for the QF-4X is shorter, hence less fuel. The QF-4C trajectory takes 288 seconds longer and its weight at the end of the cruise phase is 1,310 lbm less than the QF-4X. The WIPCC system significantly improves the acceleration and climb performance of the QF-4X over the QF-4C (34.4% in terms of specific energy) while burning 11% less propellant.
Figure 18. Mach number and flight path angle time histories of the QF-4X.
Figure 19a. QF-4C trajectory footprint and altitude (red line).
17
Figure 19b. QF-4X trajectory footprint and altitude (red line).
4.2 Results With Launch Vehicle
In Section 4.1, both the QF-4C and QF-4X were evaluated as “clean” vehicles; the additional drag caused by the launch vehicle was not included. This subsection will assess the QF-4X capability of carrying the launch vehicle under the fuselage. The incremental drag owing to the launch vehicle is added to the POST2 simulation. Trajectories with 50%, 75%, 85%, and 100% of the launcher-related drags are discussed. The launch vehicle weight is included in total the mated system weight at the simulation starting point: Mach 0.75, and an altitude of 5,000 ft.
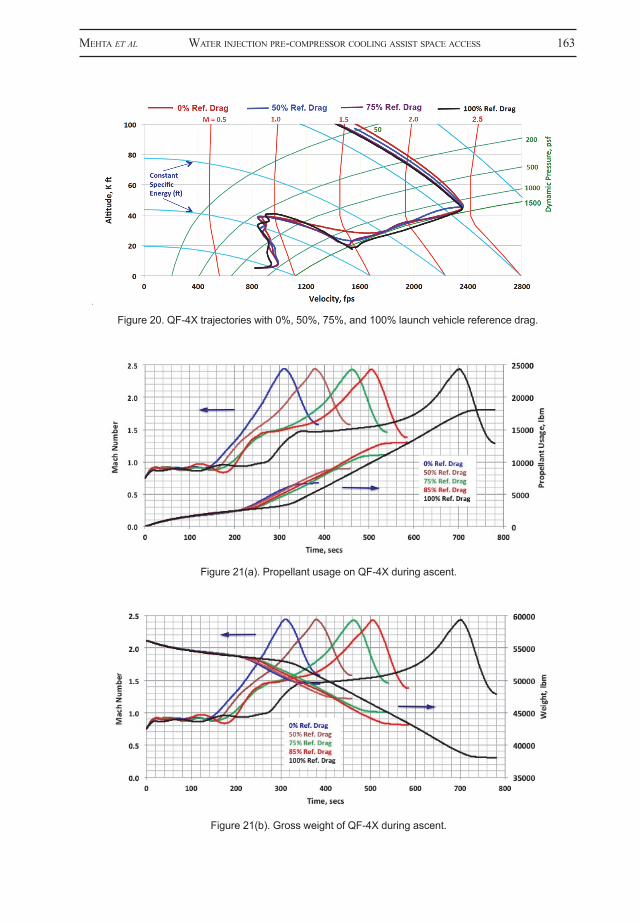
Figure 20 shows the QF-4X ascent trajectories in velocPity-altitude space (with constant lines of Mach number, dynamic pressure, and specific energy) with 0%, 50%, 75%, and 100% drag owing to the launch vehicle. At the beginning of the zoom maneuver, all trajectories reach about the same point, approximately Mach 2.44, altitude 45,000 ft. However, as more drag is added, the vehicle final velocity is reduced. Also seen in this figure, as the vehicle incurs higher drag, it has to dive to a lower altitude (i.e., higher dynamic pressure) in order to successfully accelerate through the high drag region of Mach 1.15-1.6. Even though higher dynamic pressure means higher drag, the engine also produces more thrust, and as the vehicle reaches Mach 1.4, the WIPCC is activated, which provides extra thrust. High drag requires diving to a low altitude to take advantage of the WIPCC’s additional thrust before the mated system can climb and further accelerate.
As more drag is added to the mated system, it takes a longer time to accelerate through the 1.15-1.6 Mach region, resulting in a longer flight time and more propellant usage (Fig. 21a). The flight time and the weight of the mated system with the 100% reference drag launcher are, respectively, more than twice and much less than that of the QF-4X aircraft (Fig. 21b) at the end of constant energy zoom. Also, the former burns 2.69 times more propellant than the latter.
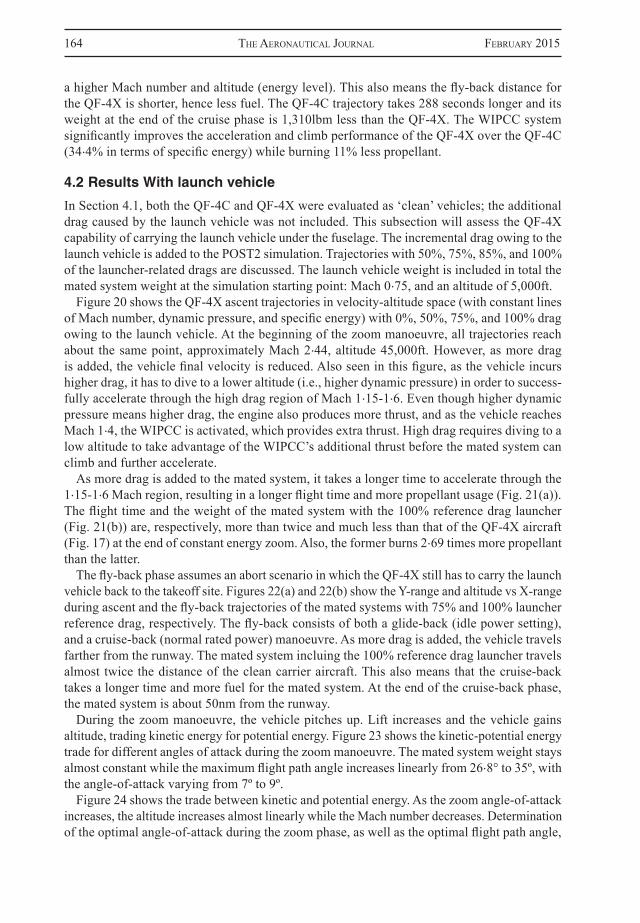
The fly-back phase assumes an abort scenario in which the QF-4X still has to carry the launch vehicle back to the takeoff site. Figures 22a and 22b show the Y-range and altitude vs. X-range during ascent and the fly-back trajectories of the mated systems with 75% and 100% launcher reference drag, respectively. The fly-back consists of both a glide-back (idle power setting), and a cruise-back (normal rated power) maneuver. As more drag is added, the vehicle travels farther from the runway. The mated system including the 100% reference drag launcher travels almost twice the distance of the clean carrier aircraft. This also means that the cruise-back takes a longer time and more fuel for the mated system. At the end of the cruise-back phase, the mated system is about 50 nm from the runway.
Figure 18. Mach number and flight path angle time histories of the QF-4X.
Figure 19(a). QF-4C trajectory footprint and altitude (red line).
Figure 19(b). QF-4X trajectory footprint and altitude (red line).
mehTA et al WATer inJecTion pre-compressor cooling AssisT spAce Access 163
18
Figure 20. QF-4X trajectories with 0%, 50%, 75%, and 100% launch vehicle reference drag.
Figure 21a. Propellant usage on QF-4X during ascent.
Figure 21b. Gross weight of QF-4X during ascent.
18
Figure 20. QF-4X trajectories with 0%, 50%, 75%, and 100% launch vehicle reference drag.
Figure 21a. Propellant usage on QF-4X during ascent.
Figure 21b. Gross weight of QF-4X during ascent.
18
Figure 20. QF-4X trajectories with 0%, 50%, 75%, and 100% launch vehicle reference drag.
Figure 21a. Propellant usage on QF-4X during ascent.
Figure 21b. Gross weight of QF-4X during ascent.
Figure 20. QF-4X trajectories with 0%, 50%, 75%, and 100% launch vehicle reference drag.
Figure 21(a). Propellant usage on QF-4X during ascent.
Figure 21(b). Gross weight of QF-4X during ascent.
164 The AeronAuTicAl JournAl FebruAry 2015
a higher Mach number and altitude (energy level). This also means the fly-back distance for the QF-4X is shorter, hence less fuel. The QF-4C trajectory takes 288 seconds longer and its weight at the end of the cruise phase is 1,310lbm less than the QF-4X. The WIPCC system significantly improves the acceleration and climb performance of the QF-4X over the QF-4C (34·4% in terms of specific energy) while burning 11% less propellant.
4.2 Results With launch vehicle
In Section 4.1, both the QF-4C and QF-4X were evaluated as ‘clean’ vehicles; the additional drag caused by the launch vehicle was not included. This subsection will assess the QF-4X capability of carrying the launch vehicle under the fuselage. The incremental drag owing to the launch vehicle is added to the POST2 simulation. Trajectories with 50%, 75%, 85%, and 100% of the launcher-related drags are discussed. The launch vehicle weight is included in total the mated system weight at the simulation starting point: Mach 0·75, and an altitude of 5,000ft.
Figure 20 shows the QF-4X ascent trajectories in velocity-altitude space (with constant lines of Mach number, dynamic pressure, and specific energy) with 0%, 50%, 75%, and 100% drag owing to the launch vehicle. At the beginning of the zoom manoeuvre, all trajectories reach about the same point, approximately Mach 2·44, altitude 45,000ft. However, as more drag is added, the vehicle final velocity is reduced. Also seen in this figure, as the vehicle incurs higher drag, it has to dive to a lower altitude (i.e., higher dynamic pressure) in order to success-fully accelerate through the high drag region of Mach 1·15-1·6. Even though higher dynamic pressure means higher drag, the engine also produces more thrust, and as the vehicle reaches Mach 1·4, the WIPCC is activated, which provides extra thrust. High drag requires diving to a low altitude to take advantage of the WIPCC’s additional thrust before the mated system can climb and further accelerate.
As more drag is added to the mated system, it takes a longer time to accelerate through the 1·15-1·6 Mach region, resulting in a longer flight time and more propellant usage (Fig. 21(a)). The flight time and the weight of the mated system with the 100% reference drag launcher (Fig. 21(b)) are, respectively, more than twice and much less than that of the QF-4X aircraft (Fig. 17) at the end of constant energy zoom. Also, the former burns 2·69 times more propellant than the latter.
The fly-back phase assumes an abort scenario in which the QF-4X still has to carry the launch vehicle back to the takeoff site. Figures 22(a) and 22(b) show the Y-range and altitude vs X-range during ascent and the fly-back trajectories of the mated systems with 75% and 100% launcher reference drag, respectively. The fly-back consists of both a glide-back (idle power setting), and a cruise-back (normal rated power) manoeuvre. As more drag is added, the vehicle travels farther from the runway. The mated system incluing the 100% reference drag launcher travels almost twice the distance of the clean carrier aircraft. This also means that the cruise-back takes a longer time and more fuel for the mated system. At the end of the cruise-back phase, the mated system is about 50nm from the runway.
During the zoom manoeuvre, the vehicle pitches up. Lift increases and the vehicle gains altitude, trading kinetic energy for potential energy. Figure 23 shows the kinetic-potential energy trade for different angles of attack during the zoom manoeuvre. The mated system weight stays almost constant while the maximum flight path angle increases linearly from 26·8° to 35º, with the angle-of-attack varying from 7º to 9º.
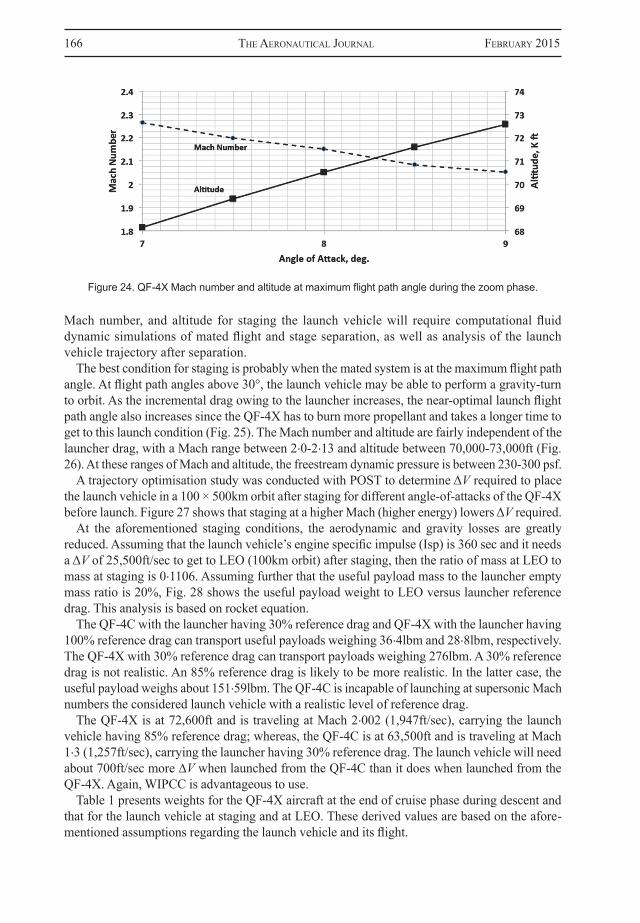
Figure 24 shows the trade between kinetic and potential energy. As the zoom angle-of-attack increases, the altitude increases almost linearly while the Mach number decreases. Determination of the optimal angle-of-attack during the zoom phase, as well as the optimal flight path angle,
mehTA et al WATer inJecTion pre-compressor cooling AssisT spAce Access 165
19
Figure 22a. QF-4X 75% launcher reference drag trajectory footprint and altitude (red line).
Figure 22b. QF-4X 100% launcher reference drag trajectory footprint and altitude (red line).
During the zoom maneuver, the vehicle pitches up. Lift increases and the vehicle gains altitude,
trading kinetic energy for potential energy. Figure 23 shows the kinetic-potential energy trade for different angles of attack during the zoom maneuver. The mated system weight stays almost constant while the maximum flight path angle increases linearly from 26.8º to 35º, with the angle of attack varying from 7º to 9º.
Figure 24 shows the trade between kinetic and potential energy. As the zoom angle of attack increases, the altitude increases almost linearly while the Mach number decreases. Determination of the optimal angle of attack during the zoom phase, as well as the optimal flight path angle, Mach number, and altitude for staging the launch vehicle will require computational fluid dynamic simulations of mated flight and stage separation, as well as analysis of the launch vehicle trajectory after separation.
Figure 22(a). QF-4X 75% launcher reference drag trajectory footprint and altitude (red line).
Figure 22(b). QF-4X 100% launcher reference drag trajectory footprint and altitude (red line).
Figure 23. Zoom maneuver of QF-4X at different angle-of-attacks.
166 The AeronAuTicAl JournAl FebruAry 2015
Mach number, and altitude for staging the launch vehicle will require computational fluid dynamic simulations of mated flight and stage separation, as well as analysis of the launch vehicle trajectory after separation.
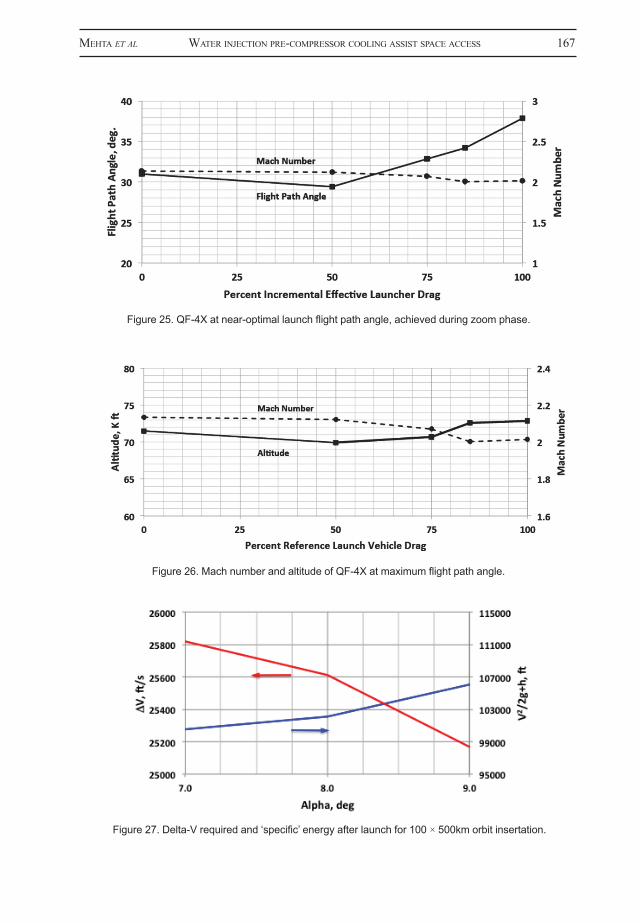
The best condition for staging is probably when the mated system is at the maximum flight path angle. At flight path angles above 30°, the launch vehicle may be able to perform a gravity-turn to orbit. As the incremental drag owing to the launcher increases, the near-optimal launch flight path angle also increases since the QF-4X has to burn more propellant and takes a longer time to get to this launch condition (Fig. 25). The Mach number and altitude are fairly independent of the launcher drag, with a Mach range between 2·0-2·13 and altitude between 70,000-73,000ft (Fig. 26). At these ranges of Mach and altitude, the freestream dynamic pressure is between 230-300 psf.
A trajectory optimisation study was conducted with POST to determine ΔV required to place the launch vehicle in a 100 × 500km orbit after staging for different angle-of-attacks of the QF-4X before launch. Figure 27 shows that staging at a higher Mach (higher energy) lowers ΔV required.
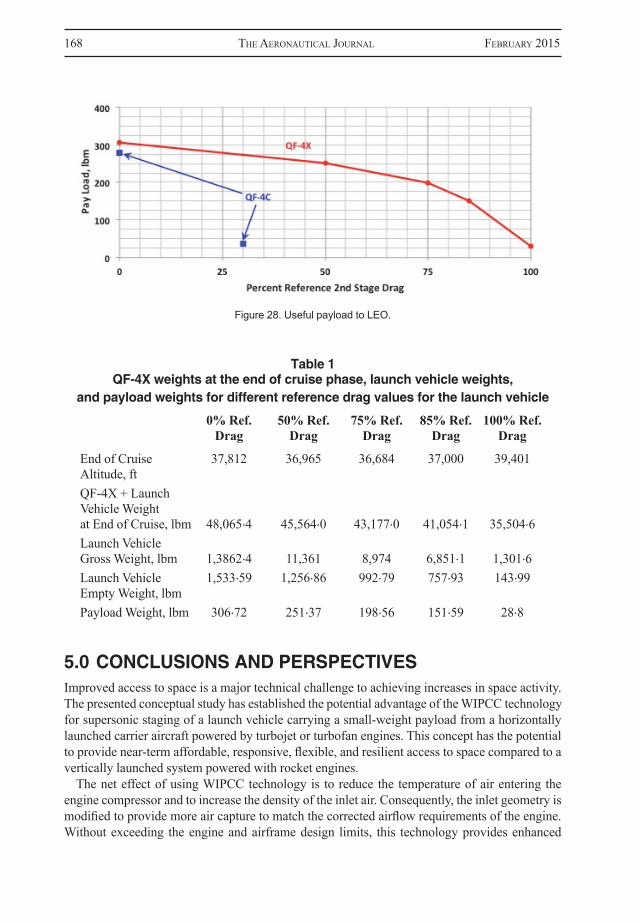
At the aforementioned staging conditions, the aerodynamic and gravity losses are greatly reduced. Assuming that the launch vehicle’s engine specific impulse (Isp) is 360 sec and it needs a ΔV of 25,500ft/sec to get to LEO (100km orbit) after staging, then the ratio of mass at LEO to mass at staging is 0·1106. Assuming further that the useful payload mass to the launcher empty mass ratio is 20%, Fig. 28 shows the useful payload weight to LEO versus launcher reference drag. This analysis is based on rocket equation.
The QF-4C with the launcher having 30% reference drag and QF-4X with the launcher having 100% reference drag can transport useful payloads weighing 36·4lbm and 28·8lbm, respectively. The QF-4X with 30% reference drag can transport payloads weighing 276lbm. A 30% reference drag is not realistic. An 85% reference drag is likely to be more realistic. In the latter case, the useful payload weighs about 151·59lbm. The QF-4C is incapable of launching at supersonic Mach numbers the considered launch vehicle with a realistic level of reference drag.
The QF-4X is at 72,600ft and is traveling at Mach 2·002 (1,947ft/sec), carrying the launch vehicle having 85% reference drag; whereas, the QF-4C is at 63,500ft and is traveling at Mach 1·3 (1,257ft/sec), carrying the launcher having 30% reference drag. The launch vehicle will need about 700ft/sec more ∆V when launched from the QF-4C than it does when launched from the QF-4X. Again, WIPCC is advantageous to use.
Table 1 presents weights for the QF-4X aircraft at the end of cruise phase during descent and that for the launch vehicle at staging and at LEO. These derived values are based on the afore-mentioned assumptions regarding the launch vehicle and its flight.
20
Figure 23. Zoom maneuver of QF-4X at different angle of attacks.
Figure 24. QF-4X Mach number and altitude at maximum flight path angle during the zoom phase.
The best condition for staging is probably when the mated system is at the maximum flight path angle.
At flight path angles above 30o, the launch vehicle may be able to perform a gravity-turn to orbit. As the incremental drag owing to the launcher increases, the near-optimal launch flight path angle also increases since the QF-4X has to burn more propellant and takes a longer time to get to this launch condition (Fig. 25). The Mach number and altitude are fairly independent of the launcher drag, with a Mach range between 2.0-2.13 and altitude between 70,000-73,000 ft (Fig. 26). At these ranges of Mach and altitude, the freestream dynamic pressure is between 230-300 psf.
A trajectory optimization study was conducted with POST to determine ∆V required to place the launch vehicle in a 100x500 km orbit after staging for different angle of attacks of the QF-4X before launch. Figure 27 shows that staging at a higher Mach (higher energy) lowers ∆V required.
At the aforementioned staging conditions, the aerodynamic and gravity losses are greatly reduced. Assuming that the launch vehicle’s engine specific impulse (Isp) is 360 sec and it needs a ∆V of 25,500 ft/sec to get to LEO (100km orbit) after staging, then the ratio of mass at LEO to mass at staging is 0.1106. Assuming further that the useful payload mass to the launcher empty mass ratio is 20%, Fig. 28 shows the useful payload weight to LEO versus launcher reference drag. This analysis is based on rocket equation.
Figure 24. QF-4X Mach number and altitude at maximum flight path angle during the zoom phase.
mehTA et al WATer inJecTion pre-compressor cooling AssisT spAce Access 167
21
Figure 25. QF-4X at near-optimal launch flight path angle, achieved during zoom phase.
Figure 26. Mach number and altitude of QF-4X at maximum flight path angle.
Figure 27. Delta-V required and “specific” energy after launch for 100x500 km orbit insertation.
21
Figure 25. QF-4X at near-optimal launch flight path angle, achieved during zoom phase.
Figure 26. Mach number and altitude of QF-4X at maximum flight path angle.
Figure 27. Delta-V required and “specific” energy after launch for 100x500 km orbit insertation.
Figure 25. QF-4X at near-optimal launch flight path angle, achieved during zoom phase.
Figure 26. Mach number and altitude of QF-4X at maximum flight path angle.
Figure 27. Delta-V required and ‘specific’ energy after launch for 100 × 500km orbit insertation.
168 The AeronAuTicAl JournAl FebruAry 2015
Table 1QF-4X weights at the end of cruise phase, launch vehicle weights,
and payload weights for different reference drag values for the launch vehicle
0% Ref. 50% Ref. 75% Ref. 85% Ref. 100% Ref. Drag Drag Drag Drag Drag
End of Cruise 37,812 36,965 36,684 37,000 39,401 Altitude, ft
QF-4X + Launch Vehicle Weight at End of Cruise, lbm 48,065·4 45,564·0 43,177·0 41,054·1 35,504·6
Launch Vehicle Gross Weight, lbm 1,3862·4 11,361 8,974 6,851·1 1,301·6
Launch Vehicle 1,533·59 1,256·86 992·79 757·93 143·99 Empty Weight, lbm
Payload Weight, lbm 306·72 251·37 198·56 151·59 28·8
5.0 CONCLUSIONS AND PERSPECTIVESImproved access to space is a major technical challenge to achieving increases in space activity. The presented conceptual study has established the potential advantage of the WIPCC technology for supersonic staging of a launch vehicle carrying a small-weight payload from a horizontally launched carrier aircraft powered by turbojet or turbofan engines. This concept has the potential to provide near-term affordable, responsive, flexible, and resilient access to space compared to a vertically launched system powered with rocket engines.
The net effect of using WIPCC technology is to reduce the temperature of air entering the engine compressor and to increase the density of the inlet air. Consequently, the inlet geometry is modified to provide more air capture to match the corrected airflow requirements of the engine. Without exceeding the engine and airframe design limits, this technology provides enhanced
22
Figure 28. Useful payload to LEO.
The QF-4C with the launcher having 30% reference drag and QF-4X with the launcher having 100%
reference drag can transport useful payloads weighing 36.4 lbm and 28.8 lbm, respectively. The QF-4X with 30% reference drag can transport payloads weighing 276 lbm. A 30% reference drag is not realistic. An 85% reference drag is likely to be more realistic. In the latter case, the useful payload weighs about 151.59 lbm. The QF-4C is incapable of launching at supersonic Mach numbers the considered launch vehicle with a realistic level of reference drag.
The QF-4X is at 72,600 ft and is traveling at Mach 2.002 (1,947 ft/sec), carrying the launch vehicle having 85% reference drag; whereas, the QF-4C is at 63,500 ft and is traveling at Mach 1.3 (1,257 ft/sec), carrying the launcher having 30% reference drag. The launch vehicle will need about 700 ft/sec more ∆V when launched from the QF-4C than it does when launched from the QF-4X. Again, WIPCC is advantageous to use.
Table 1 presents weights for the QF-4X aircraft at the end of cruise phase during descent and that for the launch vehicle at staging and at LEO. These derived values are based on the aforementioned assumptions regarding the launch vehicle and its flight.
Table 1. QF-4X weights at the end of cruise phase, launch vehicle weights, and payload weights for different reference drag values for the launch vehicle.
0% Ref. Drag
50% Ref. Drag
75% Ref. Drag
85% Ref. Drag
100% Ref. Drag
End of Cruise Altitude, ft 37,812 36,965 36,684 37,000 39,401 QF-4X + Launch Vehicle Weight at End of Cruise, lbm 48,065.4 45,564.0 43,177.0 41,054.1 35,504.6
Launch Vehicle Gross Weight, lbm 13862.4 11,361 8,974 6,851.1 1,301.6
Launch Vehicle Empty Weight, lbm 1533.59 1256.86 992.79 757.93 143.99
Payload Weight, lbm 306.72 251.37 198.56 151.59 28.8
Figure 28. Useful payload to LEO.
mehTA et al WATer inJecTion pre-compressor cooling AssisT spAce Access 169
thrust levels at elevated Mach numbers and allows the aircraft to operate at Mach numbers and altitudes beyond its basic operational limits. The study confirms that adding WIPCC to a QF-4C vehicle significantly increases its operational envelope.
The mated configuration with the WIPCC technology accelerates to higher launch speeds than the mated configuration without this technology—reducing the total ∆V requirement of the rocket-powered launcher. This reduction in ∆V reduces launch costs. In the present study, the launcher with 85% reference drag launched from the QF-4X requires approximately 700ft/sec less ∆V than the launcher with 30% reference drag launched from the QF-4C. This seemingly small decrease in the total required ∆V, however, has a significant impact on launcher closure mass for relatively low specific impulse engines.
The capability of the QF-4X to carry a launch vehicle under its fuselage is assessed by accounting for the impact of the integrated drag of the launch vehicle on the mated system ascent perfor-mance. The launch vehicle from this aircraft could be staged at about Mach 2·0 and a dynamic pressure of 200psf. Payloads weighing around 150lbm are plausible. An optimisation study of the mated system along with the launcher design and trajectory will confirm this plausibility. With the QF-4C aircraft, payloads are unachievable or marginal. This aircraft is incapable of launching the considered launch vehicle at supersonic Mach numbers.
Initially, operational supersonic aircraft modified with pre-compressor cooling technology could be used to launch small payloads to LEO. Subsequently, new hypersonic aircraft with SABRE-like engines could be developed to launch medium-weight payloads.
ACKNOWLEDGEMENTUnmeel Mehta thanks Jacob (‘Jake’) McReaken and Tristan Young (United States Air Force Materials Command), Stephanie Dozier (The Boeing Company) for providing the J79-GE-8/15 engine performance and the RF-4C performance data. This paper is an updated version of AIAA-2012-5922.
REFERENCES1. bilArdo, V., currAn, F., hunT, J., loVell, n., mAggio, g., WilhiTe, A. and mcKinney, l. The Benefits
of Hypersonic Airbreathing Launch Systems for Access to Space, AIAA 2003-5265. 2. longsTAFF, R. and bond, A. The SKYLON Project, AIAA 2011-2244. 3. European Space Agency, Skylon Assessment Report, TEC-MPC/2011/946/MF, June 2011.4. Reaction Engines, The Biggest Breakthrough in Propulsion Since the Jet Engine, Press Release, 28
November 2012.5. sATo, T., TAnATsugu, n., hiroAKi, K. hATTA, h., sAWAi, y. and mAru, y. Development Study on the
ATREX Engine, IAC-03-S.5.02.6. bolTz, F.W. Low-cost small-satellite delivery system, J Spacecraft and Rockets, 2002, 39, (5), pp
818–820.7. hAgue, n., siegenThAler, e. and roThmAn, J. Enabling Responsive Space: F-15 Microsatellite Launch
Vehicle, Proceedings of the Aerospace Conference, 2003, IEEE, 6, March 2003, pp 6_2703 – 6_2708. 8. chen, T., Ferguson, p., deAmer, d. and hensley, J. Responsive Air Launch Using F-15 Global Strike
Eagle, AIAA, RS4-2006-2001.9. socher, A. and gAny, A. Investigation of Combined Air-breathing/Rocket Propulsion for Air Launch
of Micro-Satellities from a Combat Aircraft, AIAA, RS6-2008-5003.10. depAsquAle, d., chArAniA, A., mATsudA, s. and KAnAyAmA, h. NanoLauncher: An affordable and
dedicated air-launch transportation service for nanosatellites, American Institute of Aeronautics and Astronautics, AIAA-2010-8629.
11. Dassault Aviation, Rafale, Satellite Launcher Study, Web. Issue No 3, 23 October 2008.
170 The AeronAuTicAl JournAl FebruAry 2015
12. TAlboT, C. and bonnAl, C. Air Launch Solutions for Microsatellites, Centre National d’Etudes Spatiales (CNES) briefing slides, presented at Surrey University, Surrey, UK, 9 September 2008.
13. Riding MiG to orbit, Take-off, May 2006, pp 46-47. (http://www.take-off.ru)14. boWcuTT, K.g., smiTh, T.r., KoThAri, A.p., rAghAVAn, V. TArpley, c. and liVingsTon, J.W. The Hypersonic
Space and Global Transportation System: A Concept for Routine and Affordable Access to Space, AIAA 2011-2295.
15. DARPA Industry Day Notice, Airborne Launch Assist Space Access (ALASA), DARPA-BAA-12-07. 16. King, J.A. Can Small Do What Big Does – Only Better? (An Update), SSC11-VII-1 AIAA Utah State
University SmallSat 2011 Conference, 2011.17. FousT, J. New Opportunies for Smallsat Launchers, The Space Review, 22 August 2011.18. FousT, J. A Quarter Century of Smallsat Progress, The Space Review, 6 September 2011.19. morring, Jr, F. More With Less, Aviation Week & Space Technology, 30 July 2012.20. depAsquAle, D. and brAdFord, J. Nano/Microsatellite Market Assessment, Public Release, Revision A,
SpaceWorks, February 2013.21. TrouT, A.M. Theoretical Turbojet Thrust Augmentation by Evapouration of Water During Compression
as Determined by use of Mollier Diagrams, NACA TN 2104, June 1950, 93R12197.22. Wilcox, E.C. and TrouT, A.M. Analysis of thrust augmentation of turbojet engines by water injection at
compressor inlet including charts for calculating compression processes with water injection, NACA-TR-1006, NACA Lewis Flight Propulsion Laboratory, 1 January 1951, 93R21353.
23. Willens, D. Liquid Injection on Turbojet Engines for High Speed Aircraft. Propulsion Research Report R-139, 25 February 1955, AD0140167.
24. sohn, R.L. Theoretical and Experimental Studies of Pre-Compressor Evapourative Cooling for Application to the Turbojet Engine in High Altitude Supersonic Flight. Propulsion Research Corporation, WADC-TR-56-477, August 1956, AD097262.
25. King, p.g. and nygAArd, r.c. Mechanical Operating Experience with Three J57-P-11 Turbojet Enging during a Pre-Compressor Spray Cooling Test in an Altitude Test Chamber, AEDC-TN-57-70, February 1958, AD150076.
26. Jones, W.L., siVo, J.N. and WAnhAinen, J.P. The effect of compressor-inlet water injection on engine and afterburner performance, NACA-RM-E58D03B, July 1958, 71N70228.
27. neely, J. and WArd, T.r. Maximum Power Performance of a J57 and a YJ75 Turbojet engine with Pre-Compressor Water Evapourative Cooling, AEDC-TR-58-18, February 1959, AD-304817.
28. King, L.D. Design and Testing of a Pre-Compressor Cooling System for a High Speed Aircraft, Chase Vought Corporation, Vought Aeronautics Division, May 1961, AD324250.
29. henneberry, H.M. and snyder, C.A. Analysis of Gas Turbine Engines Using Water and Oxygen Injection to Achieve High Mach Numbers and High Thrust, NASA TM-106270, July 1993, 94N13143.
30. bAlepin, V. Method and Apparatus for Reducing the Temperature of Air Entering a Compressor of a Turbojet Engine by Variably Injecting Fluid into the Incoming Air, United States Patent US 6,202,404, 20 March 2001.
31. bAlepin, V., lisTon, g. and moszee, r. Combined Cycles with Inlet Air Conditioning, AIAA-2002-5148.32. cArTer, p., bAlepin, V., spATh, T. and ossello, c. MIPCC Technology Development, AIAA-2003-6929.33. bAlepin, V., bruno, c. and ingeniTo, A. Evaluation of the Combustion Process in the Mass Injection
Precompression Cooling Engine, ISABE-2003-1127.34. BAlepin, V., engers, r., spATh, T. and ossello, c. MIPCC Technology Development, ISABE-2005-1297.35. bAlepin, V. High Speed Propulsion Cycles. In Advances on Propulsion Technology for High-Speed Aircraft
(Paper 2, pp 1-32). Educational Notes RTO-EN-AVT-150. Neuilly-sur-Seine, France: RTO, 2007. (http://www.rto.nato.int).
36. miller, J. Peace Jack An Enigma Exposed, Air International, July 1985, pp 18-23.37. cArTer, p., broWn, o. and rice, T. DARPA’s Rapid Access Small Cargo Affordable Launch (RASCAL)
Program, AIAA-2003-8004.38. Department of Defense Fiscal Year (FY) 2006/FY 2007 Budget Estimates; Research, Development, Test,
and Evaluation, Defense-Wide; Volume 1; Defense Advanced Research Projects Agency (DARPA), February 2005.
39. S. HRG. 109–22, PT. 5; Department of Defense Authorization for Appropriations for Fiscal Year 2006; Hearings Before the Committee on Armed Services United States Senate One Hundred Ninth Congress First Session on S. 1042 to Authorize Appropriations for Fiscal Year 2006 For Military Activities of the Department of Defense; for Military Construction, and for Defense Activities of The Department Of Energy; to Prescribe Personnel Strengths for Such Fiscal Year for the Armed Forces, and for Other

mehTA et al WATer inJecTion pre-compressor cooling AssisT spAce Access 171
Purposes; Part 5; Emerging Threats And Capabilities; March 9; April 11-22, 2005. 40. bonine, W.J., niemAnn, C.R., sonnTAg, A.H. and Weber, W.B. Aerodynamic Derivatives, McDonnell
Aircraft Corporation, 10 February 1964, Model F/RF-4B-C, Revision K, 10 December 1971.41. sTriepe, s.A., poWell, r.W., desAi, p.n., queen, e.m., brAuer, g.l., cornicK, d.e., olson, d.W.,
peTersen, F.m., sTeVenson, r., engel, m.c., mArsh, s.m. and gromoKo, A.m. Program to Optimize Simulated Trajectories (POST II), Vol. II Utilization Manual Version 1.1.6.G; Jan. 2004, NASA Langley Research Center, Hampton, VA, USA.
42. Technical Analyses of RF-4X Concept, Lockheed Martin Company, 12 April 1973.43. hesse, J. and mumFord, Jr n. Jet Propulsion for Aerospace Applications, 2nd ed, Pitman Publishing
Corporation, 1964.44. ArdemA, M. Solution of the minimum time-to-climb problem by matched asymptotic expansion, AIAA
J, July 1976, 14, (7), pp 843-850.