Embed Size (px)
Citation preview

3/26/2014
1
Going Viral: Emerging
Benchmarks for Water Efficiency
Water Loss in North America
Presented by:
William G. “Gus” Simmons, Jr., P.E.
VP, Director of Engineering
Cavanaugh & Associates, P.A.
Relevance
• Frustrated that revenues are down
• Upset that critical O&M is deferred
• Disappointed with current loss control results
• Worried about a looming rate increase
• Anxious about the thought of regulation
• Concerned about staffing gaps
• Angry about “helpers” pushing conservation

3/26/2014
2
Environmental Drivers
RI
States with Varying Mechanisms for Water Loss
Auditing, Reporting & Performance Targets
DV 65, NRW%(cost) 30%
25% WL (small) 15% (large)
10% Leakage
10% Leakage, 3 year average
10% UFW
10% UFW
10% WL
15% NAW
15% UFW
15% WL
25% WL
Median UFW % of Class
8% UFW
WA
OR
TX
WI
MN
IL IN WV
MD PA NJ
DRBC
MA NH
TN
GA
FL 10% UFW
CA
NM
MO KY
VA
NC
SC
NY
DE
Year 5, improvement or top 20% or below benchmark leakage value
10% UFW
15% UFW
30% Leakage
15% NRW
15% WL

3/26/2014
3
RI
States with Varying Mechanisms for Water Loss
Auditing, Reporting & Performance Targets
DV 65, NRW%(cost) 30%
25% WL (small) 15% (large)
10% Leakage
10% Leakage, 3 year average
10% UFW
10% UFW
10% WL
15% NAW
15% UFW
15% WL
25% WL
Median UFW % of Class
8% UFW
WA
OR
TX
WI
MN
IL IN WV
MD PA NJ
DRBC
MA NH
TN
GA
FL 10% UFW
CA
NM
MO KY
VA
NC
SC
NY
DE
Year 5, improvement or top 20% or below benchmark leakage value
10% UFW
15% UFW
30% Leakage
15% NRW
15% WL
AWWA outreach and education
through NCAWWA, WRRI &
NCDENR
AWWA outreach and education
through DHEC. Sanitary Survey
modified to include AWWA Water
Audit as best-practice
AWWA Water Audits required
annually, no performance
targets
AWWA outreach and
education through VA-AWWA
AWWA Water Audits required
annually, with performance
targets
AWWA outreach and education
through KY-TN AWWA & KY-DoW
Regional Outreach

3/26/2014
4
Political Drivers
$0
$500,000
$1,000,000
$1,500,000
$2,000,000
$2,500,000
$3,000,000
$/
YE
AR
Annualized Cost of Non-Revenue Water - Trailing 12 Month Average
Financial Drivers (Case Study in GA)

3/26/2014
5
Scope of Validated Water Loss Data
Dataset Source(s) n 1. Southeast Data Sets Cavanaugh & Associates, P.A.
2008-2013 Georgia Environmental Protection Division
Georgia Environmental Finance Authority 238
2. Water Audit Data Initiative AWWA Water Loss Control Committee
2011-2013 72
Total = 310
Southeast Dataset

3/26/2014
6
North American Dataset
AWWA Tools for Water Loss Control
The “M” Series: Manuals of Practice Guidance Manuals: widely
recognized around the world as source of best practices in water utility operations and management
AWWA Water Loss Control Committee’s Free Water Audit Software© Originally released 2006; current
Version 4.2 software (2010)
Water Research Foundation Research Reports
Textbooks
www.awwa.org - type “water loss control” in search box; select first item in list
Water Audit Report for: Philadelphia Water Department
Reporting Year:
ALL VOLUMES TO BE ENTERED AS ANNUAL QUANTITIES
WATER SUPPLIED
Volume from own sources: M 95,526.0 million gallons (US) per year
Master meter error adjustment: M 695.4 million gallons (US) per year
Water Imported: M 0.0 million gallons (US) per year
Water Exported: M 7,210.2 million gallons (US) per year.
WATER SUPPLIED: . 89,011.2 million gallons (US) per year..
AUTHORIZED CONSUMPTION .
Billed metered: M 57,535.2 million gallons (US) per year
Billed unmetered: M 0.0 million gallons (US) per year
Unbilled metered: M 179.3 million gallons (US) per year
Unbilled unmetered: E 693.6 million gallons (US) per year.
AUTHORIZED CONSUMPTION: . 58,408.1 million gallons (US) per year
.
.
WATER LOSSES (Water Supplied - Authorized Consumption) . 30,603.1 million gallons (US) per year.
Apparent Losses .
Unauthorized consumption: E 1,145.2 million gallons (US) per year
Customer metering inaccuracies: E 162.5 million gallons (US) per year
Data handling errors: E 2,751.2 million gallons (US) per year
Apparent Losses: . 4,058.9 million gallons (US) per year
Real Losses .
Real Losses (Water Losses - Apparent Losses): . 26,544.2 million gallons (US) per year.
WATER LOSSES: . 30,603.1 million gallons (US) per year..
NON_REVENUE WATER .
NON-REVENUE WATER: . 31,476.0 million gallons (US) per year
.
SYSTEM DATA ..
Length of mains: M 3,160.0 miles
Number of active AND inactive service connections: M 548,289
Connection density: . 174 conn./mile main
Average length of private pipe: E 12.0 ft
.
Average operating pressure: E 55.0 psi
.
COST DATA ..
Total annual cost of operating water system: M $167,604,000 $/Year
Customer retail unit cost (applied to apparent losses): M $3.95
Variable production cost (applied to real losses): M $133.58 $/million gallons (US)
DATA REVIEW - Please review the following information and make changes above if necessary:
- Input values should be indicated as either measured or estimated. You have entered:
12 as measured values
6 as estimated values
0 without specifying measured or estimated
- It is important to accurately measure the master meter - you have entered the measurement type as: measured
- Cost Data: No problems identified
PERFORMANCE INDICATORS
Financial Indicators
Non-revenue water as percent by volume: 35.4%
Non-revenue water as percent by cost: 11.7%
AWWA WLCC Water Audit Software: Reporting Worksheet
2004
under-registered
$/1000 gallons (US)
?
?
?
?
?
? Click to access definition
?
?
?
?
?
?
Back to Instructions
Please enter data in the white cells below. Where possible, metered values should be used; if metered values are unavailable please estimate a value. Indicate this by selecting a choice from the gray box to the left, where M = measured (or accurately known value) and E = estimated.
?
?
?
?
?
?
?
(pipe length between curbstop and
customer meter or property
Copyright © 2006, American Water Works Association. All Rights Reserved.

3/26/2014
7
Thank You Will Jernigan, P.E.
ACKNOWLEDGEMENTS
Water Audit Software Subcommittee (WASS) Members:
WLCC Chair: John Van Arsdel, M.E. Simpson Company, Inc.
WASS Chair: Andrew Chastain-Howley, Black & Veatch
George Kunkel, Philadelphia Water Department
Will Jernigan, Cavanaugh & Associates, P.A.
Alain Lalonde, Veritec Consulting Inc.
Ralph McCord, Louisville Water Company
David Sayers, Delaware River Basin Commission
Brian Skeens, CH2M HILL
Isabel Szendry, Puerto Rico ASA
Other Acknowledgements
Jason Bodwell, Georgia Environmental Finance Authority
Lebone Moeti, Georgia Environmental Protection Division
Steve Cavanaugh, Cavanaugh & Associates, P.A.
Rachel Harris , Cavanaugh & Associates, P.A.
Veronica Jarrin, CH2M HILL
Unaccounted-For No More
3/26/2014
8
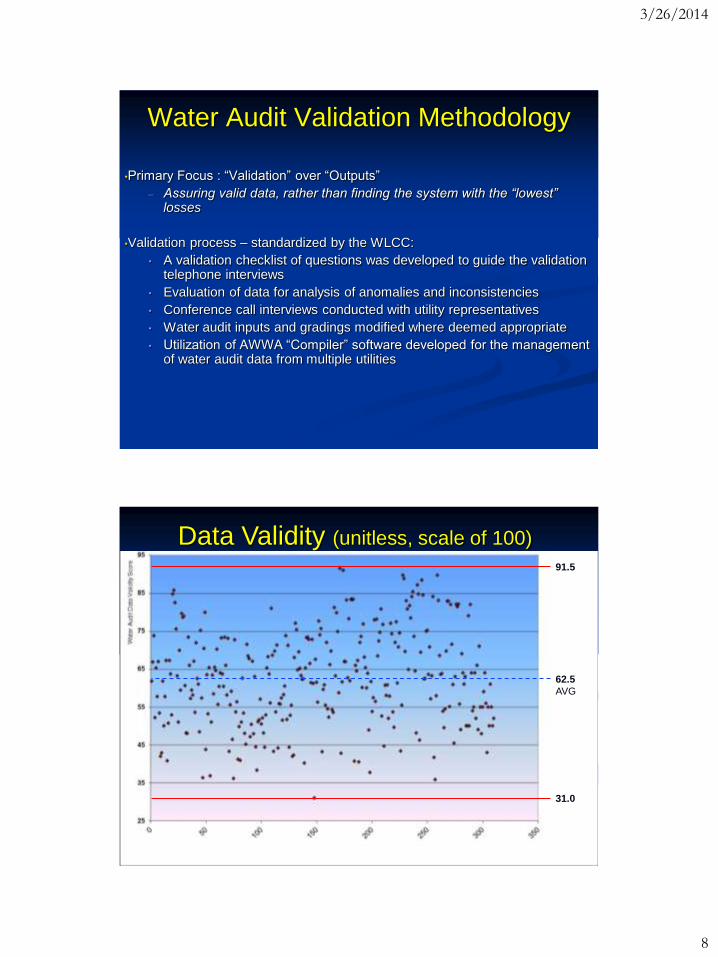
Water Audit Validation Methodology
•Primary Focus : “Validation” over “Outputs”
– Assuring valid data, rather than finding the system with the “lowest” losses
•Validation process – standardized by the WLCC:
• A validation checklist of questions was developed to guide the validation telephone interviews
• Evaluation of data for analysis of anomalies and inconsistencies
• Conference call interviews conducted with utility representatives
• Water audit inputs and gradings modified where deemed appropriate
• Utilization of AWWA “Compiler” software developed for the management of water audit data from multiple utilities
Data Validity (unitless, scale of 100)
91.5
31.0
62.5
AVG

3/26/2014
9
Data Validity v System Size
Distribution of Top Priority for Audit Improvement

3/26/2014
10
NRW (% of Water Supplied)
79.6%
2.7%
23.1%
AVG
NRW v System Size

3/26/2014
11
Infrastructure Leakage Index (unitless)
ILI = 3.0
AVG
Customer Retail Unit Cost ($/kgal)
$4.25/KGAL
AVG

3/26/2014
12
Variable Production Cost ($/MG)
$813/MG
AVG-Total
$485/MG
AVG-Own
Real Loss v VPC
3/26/2014
13
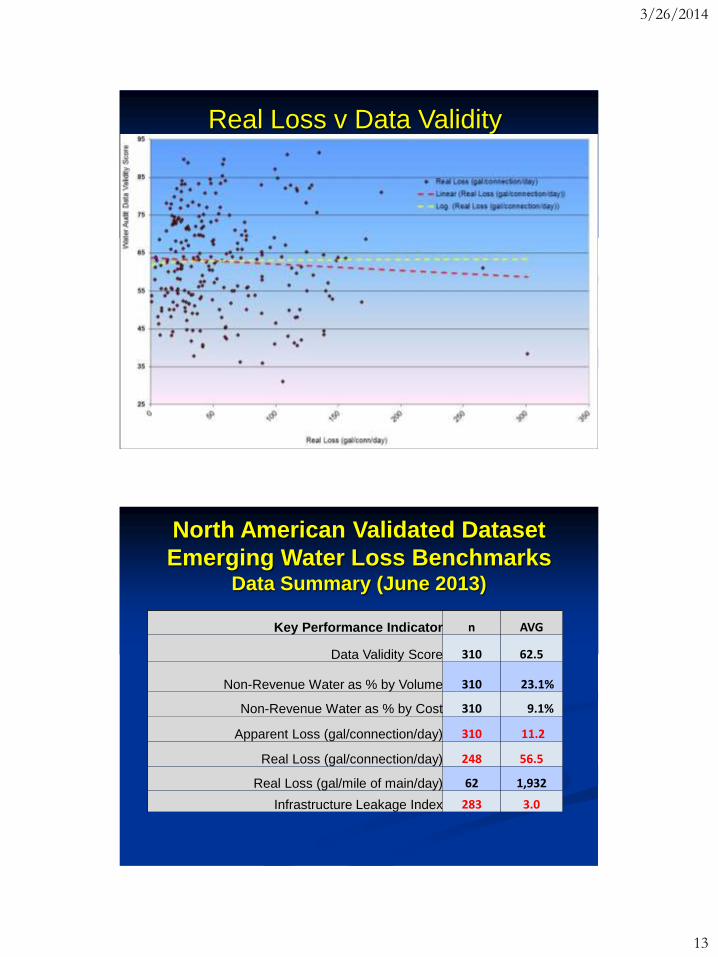
Real Loss v Data Validity
The North American Dataset
Key Performance Indicator n AVG
Data Validity Score 310 62.5
Non-Revenue Water as % by Volume 310 23.1%
Non-Revenue Water as % by Cost 310 9.1%
Apparent Loss (gal/connection/day) 310 11.2
Real Loss (gal/connection/day) 248 56.5
Real Loss (gal/mile of main/day) 62 1,932
Infrastructure Leakage Index 283 3.0
North American Validated Dataset
Emerging Water Loss Benchmarks Data Summary (June 2013)

3/26/2014
14
The Future of Validated Water Loss Benchmarking
• The AWWA Water Loss Control Committee intends to continue to
advance the Water Audit Data Initiative, especially seeking participation
from utilities in under-represented geographic regions. This will add a
few dozen audits to the dataset each year.
•Some utilities who have been through the validation process may still
have challenges with their data; continuous improvement of Data Validity
in the industry will be important to the ongoing benchmarking efforts.
•As the regulatory arena continues to encourage or require AWWA Water
Auditing, there will be opportunity for significant enhancement to the
North American Dataset, but will require reliable validation of the data on
a state-by-state basis.
Thank You Gus Simmons, P.E.
ACKNOWLEDGEMENTS
Water Audit Software Subcommittee (WASS) Members:
WLCC Chair: John Van Arsdel, M.E. Simpson Company, Inc.
WASS Chair: Andrew Chastain-Howley, Black & Veatch
George Kunkel, Philadelphia Water Department
Will Jernigan, Cavanaugh & Associates, P.A.
Alain Lalonde, Veritec Consulting Inc.
Ralph McCord, Louisville Water Company
David Sayers, Delaware River Basin Commission
Brian Skeens, CH2M HILL
Isabel Szendry, Puerto Rico ASA
Other Acknowledgements
Jason Bodwell, Georgia Environmental Finance Authority
Lebone Moeti, Georgia Environmental Protection Division
Steve Cavanaugh, Cavanaugh & Associates, P.A.
Rachel Harris , Cavanaugh & Associates, P.A.
Veronica Jarrin, CH2M HILL


![Water Loss Quality Cantwell2013.pptx [Read-Only]ucce.ucdavis.edu/files/datastore/234-2540.pdf · About 3-4% weight loss = soft head Texture and Water loss Water Loss and Fruit Ripening](https://img.pdfslide.net/doc/110x75/5f0d1eba7e708231d438c70a/water-loss-quality-read-onlyucceucdavisedufilesdatastore234-2540pdf-about.jpg)