Embed Size (px)
Citation preview

Water Management for the 21st Century
September 24, 2015
SPE – Ft. Worth Chapter

308
310
220 218192
84 78 62 59 49 46 4123
Resource-focused strategy, with activity concentrated in 2 of the most active U.S. fields
Operating in core Spraberry/Wolfcamp asset since early 1980s
–PXD holds ~825,000 acres in Spraberry/Wolfcamp
–Largest producer in Spraberry/Wolfcamp
–Preeminent, low-cost operator benefitting from vertical integration strategy
Best performing energy stock in S&P 500 since 2009
2nd most active driller in Texas
4th most active driller in the U.S.
Pioneer At A Glance
Total Enterprise Value ($B) ~$252014 Drilling Capex ($B) $3.1Q1 2014 Production (MBOEPD) 1862013 Reserves + Resource (BBOE) >11.0
Total Enterprise Value ($B) ~$252014 Drilling Capex ($B) $3.1Q1 2014 Production (MBOEPD) 1862013 Reserves + Resource (BBOE) >11.0
Top U.S. Fields By Rig Count(Pioneer Operated Count in Green – 38 rigs)
Baker Hughes Rig Count (10/31/14) and PXD Internal
Spraberry/Wolfcamp Gross Production By Operator3
(MBOEPD)
3) August 2014 DrillingInfo data, gross reported oil and wet gas

Developing the Permian Basin
The largest oil field in the U.S.
20,000 drilling location inventory
$200B to fully develop this field over the next 50+ years
Infrastructure needs: pipeline capacity, gas processing, water, electric power and roads
300,000 barrels of water used in a typical horizontal hydraulic fracture job
Moving away from using fresh water is the right thing to do
3

Outline
Formation of Pioneer Water Management, LLC (PWM)
Supply Diversification
Infrastructure Build Out
Disposal & Recycling
Conclusions 4

5
“Great Water Balance”

Establishing a Sustainable “Water Business”
6
Supply sufficient water for drilling & completions
Source lower cost “non-fresh” water supplies
Study and plan for potential
disposal limitations
Develop recycling
projects in support of
“Water Balance”
Reduce transfer costs and trucks
on road

WHY was PWM Created ?
Sustainable Water Solutions– Significant ramp-up of D&C requirements (1,000,000 BPD)
– Reduce reliance on fresh water sources
– Mitigate need for disposal of produced water (Recycling)
Develop in house water expertise to support growth in West Texas– “Cradle to Grave” water planning and handling
– “One Stop Shop” supporting Drilling, Completions & Operations
Long term planning to increase water handling efficiency– Fewer trucks
– Smaller footprint
– Lower cost
7

WHAT ? “In House Expertise”
1. Establish and maintain a profitable “water
business”
2. Supply sufficient water for hydraulic fracturing
3. Source lower cost “non-fresh” water supplies
4. Study and plan for potential disposal limitations
5. Develop recycling projects in support of “Water
Balance”
6. Develop 3rd party business to enhance PWM’s
profitability
7. Reduce transfer costs and trucks on road
8

9
HOW ? “One Stop Shop” Supply
– Diversification of supply to meet growing demand• Local and external sources• Decreased reliance on fresh water
Distribution/Storage
– Permanent infrastructure planning• Truck traffic (238,000 BWPD equates to ~2,000 fewer truck
loads/day)• Smaller footprint & lower cost• 400,000 bbl. impoundments for storage of water• Storage used to meet “Peaks and Valleys” of demand
Recycling/Disposal
– Utilize produced water to meet drilling and completion demand• Minimize need to dispose of produced water• Monitoring of disposal wells

Supply Diversification
10

110
30
60
90
120
150
180
210
240
270
300
0
100,000
200,000
300,000
400,000
500,000
600,000
700,000
800,000
900,000
1,000,000
2014 2015 2016 2017 2018 2019 2020 2021 2022 2023
BW
PD
West Texas Growth Increases Water Demand
Drillin
g & Fra
c. Wate
r
Needs
Hori
zon
tal R
igs
0
0
100+
Rig Count
Demand = 2 × City of IrvingGeographic Extent = Delaware

12
Supply (Diversify Water Sourcing)
• Small Volume• Minimal Infrastructure• Short Lead Time• Sustainable?
PXD Water Wells
Local “Fresh” Water Wells
• Medium Volume• Minimal Infrastructure• Short Lead Time
PXD Santa Rosa Well
Local Santa Rosa “Brackish” Wells
• Medium Volume• Reliant on
Infrastructure• Medium Lead Time• Reduces Disposal
Gradient/Fountain Quail
Local Recycling
Large “Effluent” Supply Source
• Large Volume• Long Term Deal• Reliant on
Infrastructure
3rd Party Source
Large “Brackish” Supply Source
• Large Volume• Long Term Deal• Reliant on
Infrastructure• Non-Political
Odessa Effluent
Minimize “Discounted” BBL Cost and Meet Asset Demands

Infrastructure Build Out
13
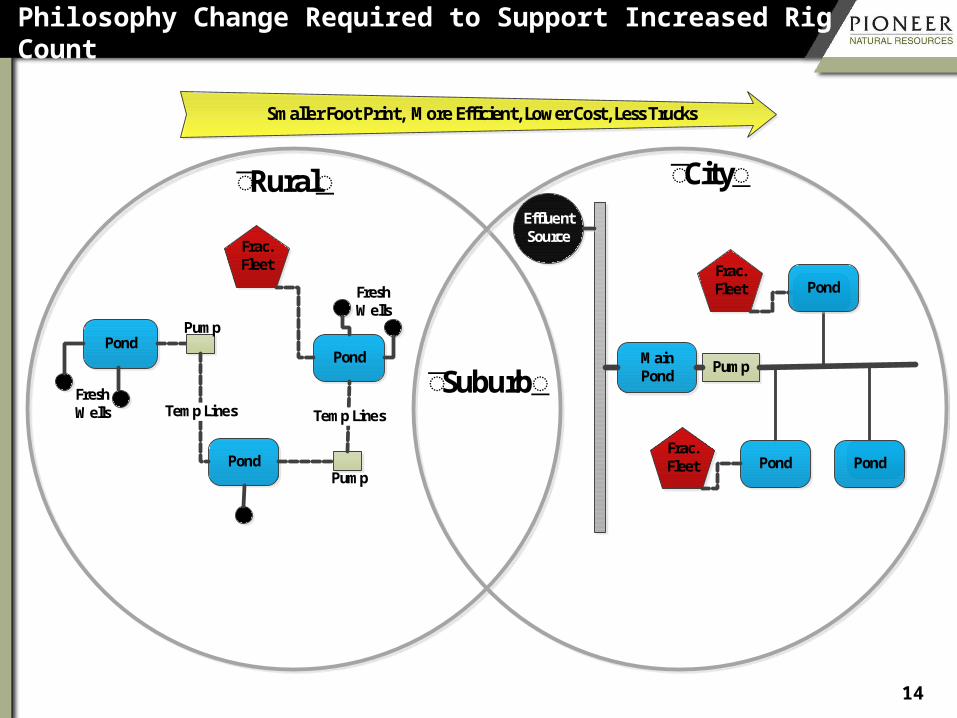
Philosophy Change Required to Support Increased Rig Count
14
Pond
Pond
Pond
Temp Lines Temp Lines
Smaller Foot Print, More Efficient, Lower Cost, Less Trucks
Frac. Fleet
Main Pond
Pump
Frac. Fleet
Frac. Fleet
EffluentSource
+͞Rural -͞
+͞Suburb -͞
+͞City -͞
Pond
Pond
Pond
Pump
Pump
Fresh Wells
Fresh Wells

Infrastructure PlanningInfrastructure Elements:
− Mainline
− Ponds
− Subsystems
− Source pipelines
Optimize Based On:
−Rig count
−Locations of sources
−% Recycling
−Minimized headcount (automation) 15
Mainline
Subsystem
SourcePipeline
Ponds
Pump Station

16
Storage “Frac. Ponds”
400,000 BBL ponds
Standard design increase life and make ponds safer
Covers minimize evaporation
Disposal and Recycling
17

Water Disposal Plans
Monitoring disposal program
Evaluating recycling technologies and increasing recycling volumes
Monitoring regulatory environment & legislation on recycling, fresh water, and brackish water
Balancing disposal and recycling
18
19
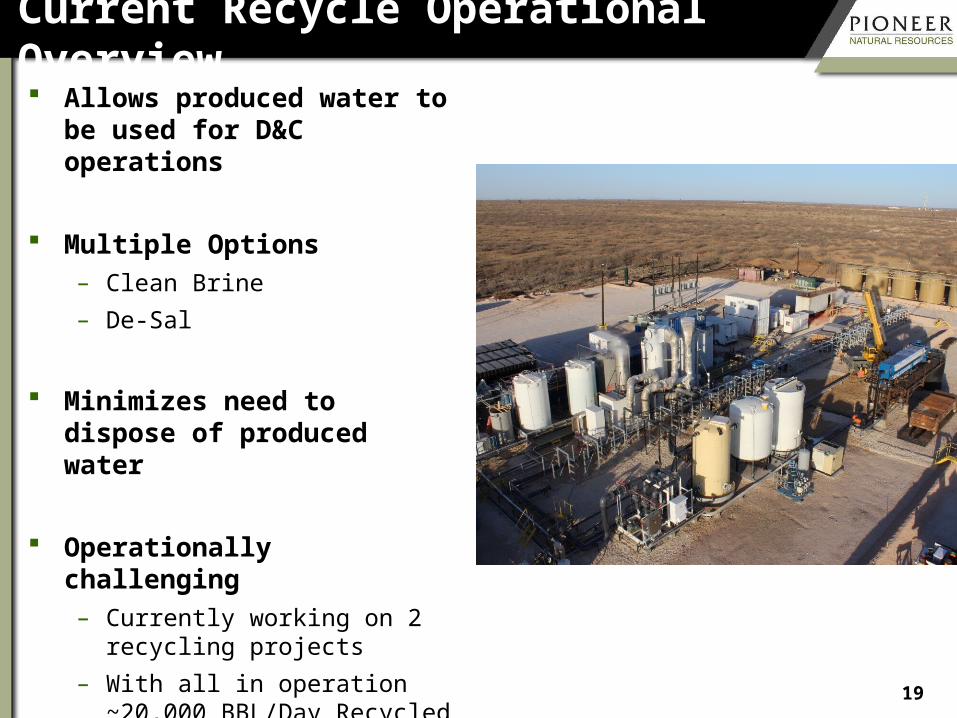
Current Recycle Operational Overview Allows produced water to
be used for D&C operations
Multiple Options– Clean Brine
– De-Sal
Minimizes need to dispose of produced water
Operationally challenging– Currently working on 2
recycling projects
– With all in operation ~20,000 BBL/Day Recycled

Recycling Cost Discussion
Source and dispose approaching parity with minimal treatment
Recycling reduces disposal needs, lowering drilling costs
Desal costs significantly more than minimal treatment
Water quality required drives recycling costs
20

Recycling Challenges
OperationsLogistical coordination
Linking of disposal network
Flow-back volume peaks
Continuous flow into recycle plant
Backup SWD for recycling
21
Recycle Plant
Recycle Plant
Produced Water
Useable Product
Unusable Product(Operations)
(Operations)
(D&C/Res.)
D&C & ReservoirWater quality/gelling
Sufficient supply to meet schedule
Formation compatibility
Multi-department incremental costs/savings
PWMInfrastructure
Blending
Changing technology
Manpower
Balancing with other take-or-pay requirements
Environmental (storage/transport)
PXD Aggressively Pursuing Integrated Solutions to Recycling Challenges

Conclusions
22
PWM the “One Stop Shop” for Water Achieving strong success in sourcing
– Odessa, Santa Rosa, (Midland)
Infrastructure build-out underway– Significant progress on design and construction– Sized to accommodate 3rd party sales and transport– Permanent infrastructure provide significant cost savings for all
parties
Continue to balance disposal and recycling – Recycling implementation is complex– Balance volume, logistics, and added infrastructure– Storage and transport of minimally treated produced water
adds environmental challenges
23