Embed Size (px)
Citation preview

In Association with
Ecological Resource Consultants, Inc.
BBC Research & Consulting
Lytle Water Solutions, LLC
Water Management StudyPHASE I
Evaluation of Pulse Flows for the Platte River Recovery
Implementation Program
FINALPhase I ReportApril 8, 2008
TABLE OF CONTENTS
1.0 INTRODUCTION AND PURPOSE.........................................................................1
2.0 GUIDANCE OF PROGRAM PARTICIPANTS.....................................................3
3.0 EVALUATION OF PROGRAM FLOW TARGETS.............................................6
3.1 Program Water..............................................................................................................6
3.2 River Channel, NPPD, and CNPPID System Capacity................................................7
3.2.1 North Platte River Channel Limitations and Capacities below Keystone Diversion
Dam ............................................................................................................................11
3.2.2 CNPPID System Limitations and Capacities .............................................................11
3.2.3 NPPD System Limitations and Capacities .................................................................12
3.2.4 Reregulation within the District’s System..................................................................14
3.2.5 Limitations in Capacities and Operational Flexibilities .............................................14
3.3 Hydrologic Data Analysis ..........................................................................................15
3.4 Update of WMC Loss Model Spreadsheet.................................................................19
3.5 Travel Times and Daily Losses ..................................................................................19
3.5.1 Estimation of Travel Times ........................................................................................19
3.5.2 Estimation of River Losses.........................................................................................21
3.6 Available Capacities for Program Water....................................................................26
3.7 Development of Routing Tool for Program Water.....................................................27
3.8 Analysis of Routing Program Water to Overton ........................................................37
3.9 Recommendations for Further Evaluation of Capacities............................................45
4.0 PROJECT ASSESSMENT......................................................................................47
4.1 CNPPID Regulating Reservoir...................................................................................48
April 8, 2008 PRRIP - Water Management Study, Phase I
Page i
4.2 Water Leasing in Nebraska ........................................................................................49
4.3 Nebraska Water Management Incentives (Conservation Cropping, Deficit Irrigation,
Fallowing, and On-Farm Irrigation Changes) ............................................................50
4.4 Groundwater Management in Nebraska.....................................................................51
4.5 Dry Creek/Fort Kearny Cutoffs..................................................................................52
4.6 Dawson and Gothenburg Canal Groundwater Recharge............................................52
4.7 Central Platte Power Interference...............................................................................53
4.8 Net Controllable Conserved Water by CNPPID ........................................................54
4.9 Pathfinder Modification Municipal Account (Wyoming)..........................................55
4.10 Glendo Storage (Wyoming) .......................................................................................56
4.11 Temporary Water Leasing in Wyoming.....................................................................57
4.12 La Prele Reservoir (Wyoming) ..................................................................................58
4.13 Groundwater Management – Tamarack III ................................................................58
4.14 Cost Effectiveness ......................................................................................................59
5.0 CONCLUSIONS AND RECOMMENDATIONS .................................................63
5.1 Conclusions ................................................................................................................63
5.2 Recommendations and Key Issues for Further Analysis............................................66
6.0 REFERENCES .........................................................................................................67
April 8, 2008 PRRIP - Water Management Study, Phase I
Page ii

LIST OF TABLES
Table 2-1 Interview Participants................................................................................................4
Table 3-1 Average Yields (ac-ft x 1,000) .................................................................................7
Table 3-2 Estimated Flow at NWS Flood Stage for Platte River Reaches..............................10
Table 3-3 Table of System Capacities .....................................................................................15
Table 3-4 Classification of Water Years Based on Average Annual Flow at Overton (1947-
2006)...........................................................................................................................18
Table 3-5 Travel Times on the Platte River – Keystone to Overton .......................................20
Table 3-6 Diversions and Returns Included in Daily Loss Estimates .....................................22
Table 3-7 Daily Loss Factor Estimates....................................................................................26
Table 3-8 Remaining Capacities for Program Water for Average, Wet, and Dry Years ........29
Table 3-9 Resulting Peak Flows for Target 5,000 cfs Case I and Case II ...............................38
Table 3-10 Resulting Peak Flows for Target 800 cfs Case I and Case II ................................39
Table 4-1 Project Summary .....................................................................................................62
LIST OF FIGURES
Figure 1-1 Study Area and Locations ...................................................................End of Report
Figure 3-1 Classification of Water Years Based on Average Annual Flow at Overton (1947-
2006)...........................................................................................................................17
Figure 3-2 South Platte River Loss Estimate – Roscoe to North Platte...................................24
Figure 3-3 North Platte River Loss Estimate – Keystone to North Platte ...............................24
Figure 3-4 Platte River Loss Estimate – Confluence to Brady................................................25
Figure 3-5 Platte River Loss Estimate – Brady to Overton .....................................................25
Figure 3-6 Hydrographs for 5,000 cfs Program Water Targets ...............................................43
April 8, 2008 PRRIP - Water Management Study, Phase I
Page iii
APPENDICES
Appendix 1: WMS Interview Meeting Notes
Appendix 2: WMC Loss Model Update Technical Memorandum and Tables
Appendix 3: Routing Tool Analysis Results
Appendix 4: Request for Proposal – Engineering Services for the Platte River Recovery
Implementation Program Water Management Study
April 8, 2008 PRRIP - Water Management Study, Phase I
Page iv
Page 1 of 68 April 8, 2008 PRRIP - Water Management Study, Phase I
1.0 INTRODUCTION AND PURPOSE
Phase I of the Water Management Study (WMS) for the Platte River Recovery
Implementation Program (PRRIP or Program) evaluates the ability of the Program to achieve
pulse flows of Program water during the low demand period on the Platte River in central
Nebraska. Phase I also evaluates the potential to provide a maintenance flow to the same
geographic area during the summer irrigation months. This report presents the results of this
Phase I evaluation. The study will be used by the Governance Committee of the PRRIP to
meet certain Program water supply objectives, including the determination of water delivery
timing and quantities, and additional water supply and conservation project needs.
Figure 1-1 entitled, “Study Area and Locations” illustrates key locations on the Platte River
in central Nebraska which are referenced in this report. Figure 1-1 is located at the end of the
main report section.
The Phase I study objective, as defined in the Request for Proposals (RFP) included as
Appendix 4, is to evaluate the feasibility of meeting the following water supply goals by
December 31, 2011:
1. Provide 5,000 cubic feet per second (cfs) of Program water for three days to the
Overton gage on the Platte River in central Nebraska for pulse flows when other
demands that may be competing for river channel and irrigation system capacity
are low (normally September 1 through May 31). Assuming this water-delivery
availability, Program water may be used to supplement existing flows to achieve
pulse flows in excess of 6,000 cfs two out of three years. If these flows are
achieved by existing flows (without Program water), the deliveries of Program
water would not be necessary.
2. Identify feasible measures and quantify the Program water necessary to ensure a
yield of 800 cfs of Program water at the Overton gage during the irrigation season
(May 1 through September 30). The USFWS indicated that the intent of the 800
cfs flow is augment flows from May 11 to September 15 as outlined in the
Page 2 of 68 April 8, 2008 PRRIP - Water Management Study, Phase I
Instream Flow Recommendations Document (see FWS Meeting Notes in
Appendix 1).
In addition to the objectives identified in the Problem Statement of the RFP presented
above, the following objectives were also identified in the RFP and elaborated on during
discussions with Program participants.
3. Evaluate how the 13 alternatives in the Program Final Environmental Impact
Statement (FEIS) (USDOI, 2006) may contribute to the 5,000 and 800 cfs flows,
as opposed to the average annual reduction determined in prior studies.
4. Provide initially required modeling tools and initial characterization of the
projects to guide further assessments in Phase II of the study.
The 5,000 cfs pulse flow and 800 cfs irrigation season flow targets represent Program water
only. These target flows are in addition to other flows that may be in the river including
natural flows or other managed water. The evaluation of providing these targets of Program
water was specifically stated in the RFP as the objective of the WMS and stated in the RFP.
As stated above, the location for evaluating the flow objectives in the WMS is the Overton,
NE gage in contrast to the use of the Grand Island gage in evaluating target flows in other
Program work. The Overton location is representative of the upstream end of the critical
habitat and was identified in the FEIS as the basis for the pulse flow. The pulse flow
recommendations were developed based on target flows at Overton that were anticipated to
meet goals for channel restoration and improving habitat within the critical reach. In
addition, evaluation at this location recognizes the proximity of the Overton gage just
downstream of the J-2 Return which is a key delivery point evaluated in the pulse flow
analysis.
The objective of Phase II is to evaluate additional potential alternatives and combinations of
alternatives for meeting the target flows of 5,000 cfs and 800 cfs of Program water (6,000 cfs
total flow in two of three years). The evaluation will include revisions to these alternatives if
necessary and updated operational scenarios as identified in the Phase I participant
interviews.
Page 3 of 68 April 8, 2008 PRRIP - Water Management Study, Phase I
The development of the Program was authorized with the signing of the Cooperative
Agreement on July 1, 1997. The Governance Committee’s Alternative was selected as the
Preferred Alternative for meeting the goals of the Program when the Record of Decision was
signed on September 27, 2006 by the Secretary of the Interior. The Program Agreement was
subsequently signed by the governors of Nebraska, Wyoming, and Colorado and the
Secretary of the Interior.
The Program was initiated on January 1, 2007 between Nebraska, Wyoming, and Colorado
and the Department of the Interior (DOI) (the parties) to address issues related to certain
threatened and endangered species that have habitat in the Platte River Basin. The target
species are the whooping crane, piping plover, interior least tern, and pallid sturgeon.
2.0 GUIDANCE OF PROGRAM PARTICIPANTS
The Program Document Water Plan defines the Program’s water management process,
describes the initial projects to be implemented to meet Program water supply objectives, and
identifies additional projects to be considered in the Program’s first increment. The focus of
this study is to quantify how these projects are able to reduce shortages to the target flows at
Overton and to assist the Governance Committee in the selection of projects capable of
meeting the Program’s water supply goals. The Program Document Water Plan (PRRIP,
2006) and the FEIS provided the basis for the analysis.
Boyle reviewed the Program Document Water Plan as well as additional documentation,
including the Water Conservation/Supply Reconnaissance Study (Boyle, 1999) and the FEIS
(USDOI 2006).
In addition to a review of the literature, meetings, or interviews, were held with
representatives of several of the Program participants to discuss the intent of the WMS and to
provide information on key aspects of the project. These Program representatives shared a
wealth of knowledge on the Platte River system, the importance of the routing studies and
how identified projects would work today and in the future. A total of 9 meetings were held
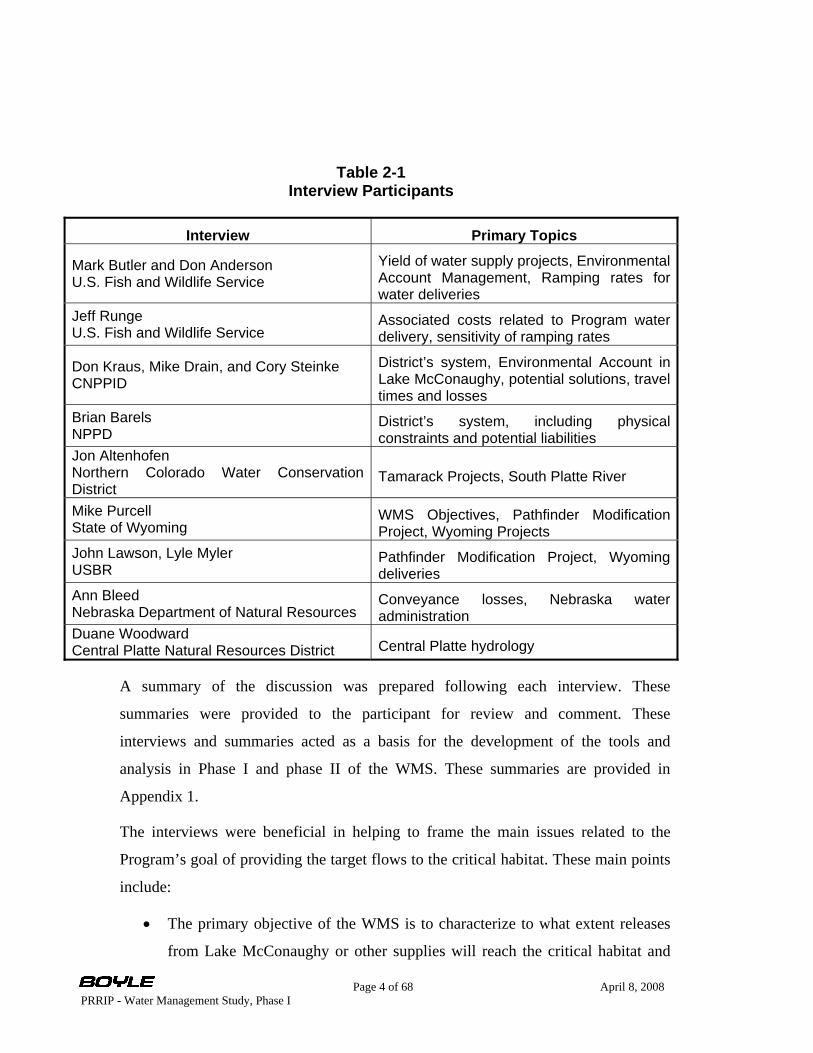
with 8 agencies during the initial stages of the study. Table 2-1 entitled, “Interview
Participants” presents a summary of these contributors and the highlighted topics of
discussion.
Page 4 of 68 April 8, 2008 PRRIP - Water Management Study, Phase I
Table 2-1 Interview Participants
Interview Primary Topics
Mark Butler and Don Anderson U.S. Fish and Wildlife Service
Yield of water supply projects, Environmental Account Management, Ramping rates for water deliveries
Jeff Runge U.S. Fish and Wildlife Service
Associated costs related to Program water delivery, sensitivity of ramping rates
Don Kraus, Mike Drain, and Cory Steinke CNPPID
District’s system, Environmental Account in Lake McConaughy, potential solutions, travel times and losses
Brian Barels NPPD
District’s system, including physical constraints and potential liabilities
Jon Altenhofen Northern Colorado Water Conservation District
Tamarack Projects, South Platte River
Mike Purcell State of Wyoming
WMS Objectives, Pathfinder Modification Project, Wyoming Projects
John Lawson, Lyle Myler USBR
Pathfinder Modification Project, Wyoming deliveries
Ann Bleed Nebraska Department of Natural Resources
Conveyance losses, Nebraska water administration
Duane Woodward Central Platte Natural Resources District Central Platte hydrology
A summary of the discussion was prepared following each interview. These
summaries were provided to the participant for review and comment. These
interviews and summaries acted as a basis for the development of the tools and
analysis in Phase I and phase II of the WMS. These summaries are provided in
Appendix 1.
The interviews were beneficial in helping to frame the main issues related to the
Program’s goal of providing the target flows to the critical habitat. These main points
include:
• The primary objective of the WMS is to characterize to what extent releases
from Lake McConaughy or other supplies will reach the critical habitat and
Page 5 of 68 April 8, 2008 PRRIP - Water Management Study, Phase I
the total volume necessary. This goal focuses much of the analysis on moving
water through the Platte River system, NPPD’s system, and CNPPID’s system
given many physical and administrative constraints. In addition to applying
these limitations and constraints to the routing of flows, this study provides a
basis for a critical analysis of which of these constraints is limiting, and to
what extent modifications or relaxations are possible.
• Another issue related to the framework of the tools developed as a part of this
study is how Program water will be administered by the State of Nebraska.
Program water is administered separate from natural flows, similar to other
storage releases. This water is charged a pro-rata amount for river losses, but
in the case of a gain in the river, it does not accrue gains. Program water run
through the NPPD and CNPPID (the Districts) systems is administered the
same losses as if it were to remain in the river. Similar to this administration,
the travel times are assumed to be equivalent to travel times in the river.
• Since the development of the Water Conservation/Supply Reconnaissance
Study, the Reconnaissance Water Action Plan, and the FEIS, the Platte River
has seen significant changes in hydrology and flows. The recent dry years
coupled with the spread of phragmites has changed the regime of the river.
These changes reemphasize the need to consider how Program water can be
used to benefit the critical habitat and target species.
• These meetings and future meetings with Program participants are valuable in
framing the operations and benefits of the current alternatives identified in the
Water Action Plan and additional alternatives to be considered in Phase II to
aid in providing the target flows of 5,000 cfs and 800 cfs of Program water.
Page 6 of 68 April 8, 2008 PRRIP - Water Management Study, Phase I
3.0 EVALUATION OF PROGRAM FLOW TARGETS
3.1 Program Water
A long-term objective of the Program is to reduce shortages to specified target flows
by an average of 130,000-150,000 acre-feet (ac-ft) per year in the Platte River in
central Nebraska (Platte River valley area from Lexington to Chapman, Nebraska).
The following list describes three initial Program projects and a reference to the
description of the respective projects that can be found in the Program Document
Water Plan:
a. Nebraska’s Environmental Account in Lake McConaughy (NEA)
(Attachment 5, Section 5)
b. Wyoming’s Pathfinder Modification Project (PMP) (Attachment 5,
Section 4)
c. Colorado’s Initial Water Project (Tamarack I) (Attachment 5, Section 3)
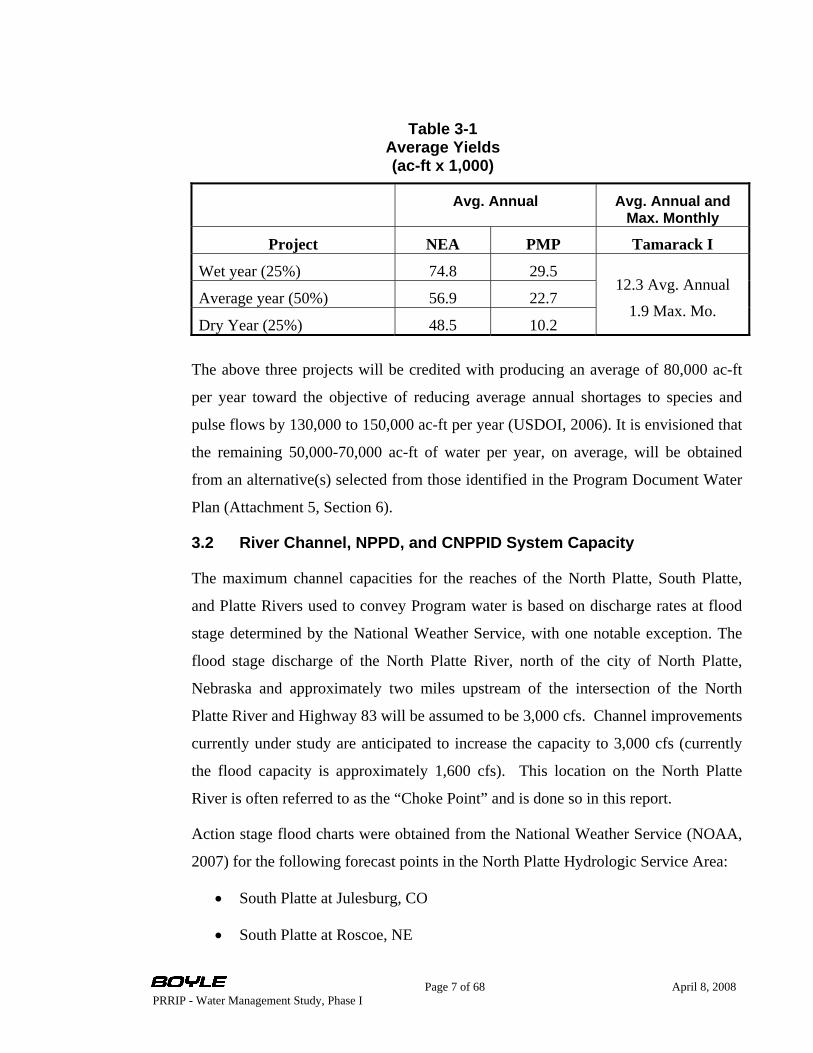
Table 3-1 entitled, “Average Yields”, depicts estimated quantities of Program water
that will be available in Average, Wet, and Dry years. The following yields are based
on model runs used in the FEIS for the Program for the 1947 through 1994
hydrologic period. The yields of the NEA and PMP are achieved in Lake
McConaughy. The Tamarack I contributions represent an average annual volume as
presented in Attachment 5, Section 3 of the Program Document. The yields of
Tamarack I are based on increased flows below the Western Canal in Nebraska.
Page 7 of 68 April 8, 2008 PRRIP - Water Management Study, Phase I
Table 3-1 Average Yields (ac-ft x 1,000)
Avg. Annual Avg. Annual and Max. Monthly
Project NEA PMP Tamarack I
Wet year (25%) 74.8 29.5
Average year (50%) 56.9 22.7
Dry Year (25%) 48.5 10.2
12.3 Avg. Annual
1.9 Max. Mo.
The above three projects will be credited with producing an average of 80,000 ac-ft
per year toward the objective of reducing average annual shortages to species and
pulse flows by 130,000 to 150,000 ac-ft per year (USDOI, 2006). It is envisioned that
the remaining 50,000-70,000 ac-ft of water per year, on average, will be obtained
from an alternative(s) selected from those identified in the Program Document Water
Plan (Attachment 5, Section 6).
3.2 River Channel, NPPD, and CNPPID System Capacity
The maximum channel capacities for the reaches of the North Platte, South Platte,
and Platte Rivers used to convey Program water is based on discharge rates at flood
stage determined by the National Weather Service, with one notable exception. The
flood stage discharge of the North Platte River, north of the city of North Platte,
Nebraska and approximately two miles upstream of the intersection of the North
Platte River and Highway 83 will be assumed to be 3,000 cfs. Channel improvements
currently under study are anticipated to increase the capacity to 3,000 cfs (currently
the flood capacity is approximately 1,600 cfs). This location on the North Platte
River is often referred to as the “Choke Point” and is done so in this report.
Action stage flood charts were obtained from the National Weather Service (NOAA,
2007) for the following forecast points in the North Platte Hydrologic Service Area:
• South Platte at Julesburg, CO
• South Platte at Roscoe, NE
Page 8 of 68 April 8, 2008 PRRIP - Water Management Study, Phase I
• South Platte at North Platte, NE
• North Platte at Casper, WY
• North Platte at Glenrock, WY
• North Platte at Orin, WY
• North Platte at Henry, NE
• North Platte at Mitchell, NE
• North Platte near Minatare, NE
• North Platte at Bridgeport, NE
• North Platte at Lisco, NE
• North Platte at Lewellen, NE
• North Platte at North Platte, NE
• Platte River at Brady, NE
• Platte River near Cozad, NE
• Platte River near Overton, NE
The action stage is when a river is three quarters bank full. Calculated rating tables
for specific river gage sites are used to determine flows for minor, moderate, and
major flood stages. The flood stage value cited on the NWS charts correlated directly
with a flow value for the majority of the gages. Flood flows corresponding to the
NWS flood stages were not available as direct take-offs from the NWS charts for the
Cozad, Lewellen, Brady and North Platte at North Platte gages. These gages required
use of the rating table and flow equations defined by the Nebraska DNR to calculate
the corresponding flow for flood stage. The rating tables were provided by the
Nebraska Department of Natural Resources (DNR). The estimated flood flows are
presented in Table 3-2 entitled, “Estimated Flow at NWS Flood Stage for Platte River
Reaches”.

Page 9 of 68 April 8, 2008 PRRIP - Water Management Study, Phase I
The Central Nebraska Public Power and Irrigation District (CNPPID) and Nebraska
Public Power District (NPPD) divert available flows up to the diversion capacity
throughout the year, including Program water. Program water may also be
intentionally re-regulated within the Districts’ systems and/or Program water may be
intentionally bypassed to the river under specific conditions described in the Program
Document Water Plan (Attachment 5, Section 1), and current and future agreement(s)
with the Districts.
The following are the known limitations and capacities, as presented in the WMS
Request for Proposals (RFP), within the Districts’ systems and the North Platte River
below Lake McConaughy that affect the delivery of Program water. These limitations
and capacities were confirmed during discussions with NPPD and CNPPID staff.
The capacities discussed below are also presented in Table 3-3 entitled, “Table of
System Capacities”, and annotated on Figure 1-1.
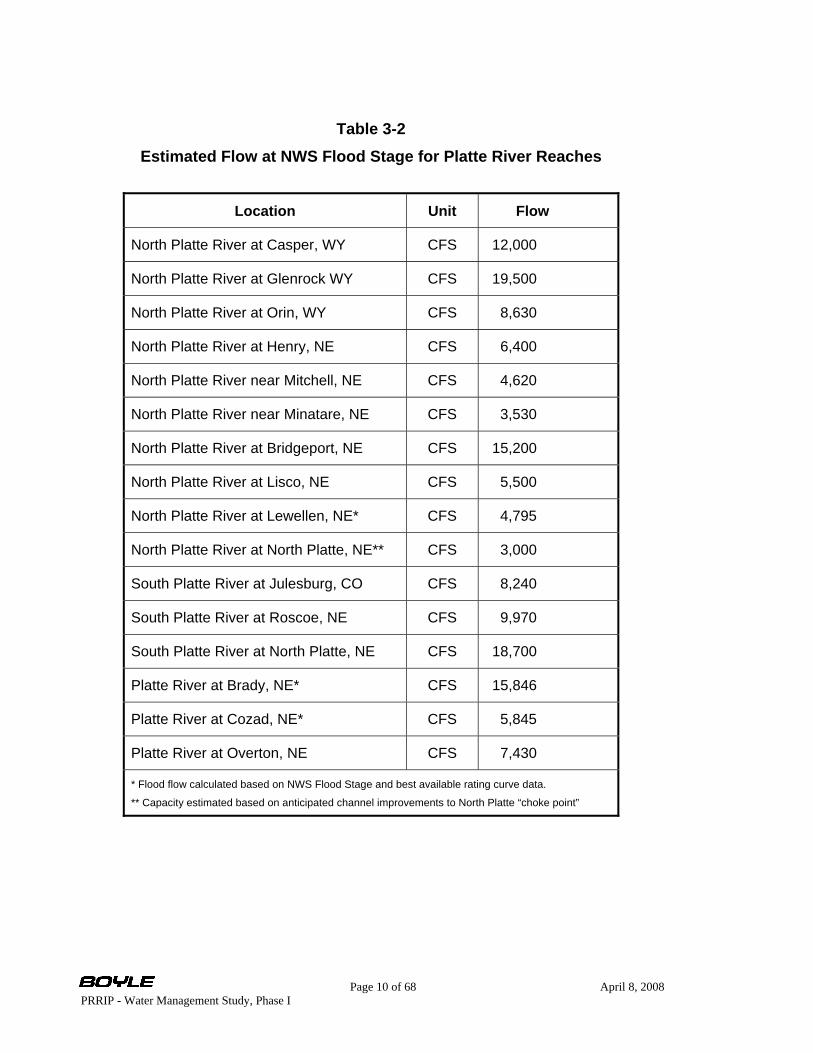
Table 3-2 Estimated Flow at NWS Flood Stage for Platte River Reaches
Location Unit Flow
North Platte River at Casper, WY CFS 12,000
North Platte River at Glenrock WY CFS 19,500
North Platte River at Orin, WY CFS 8,630
North Platte River at Henry, NE CFS 6,400
North Platte River near Mitchell, NE CFS 4,620
North Platte River near Minatare, NE CFS 3,530
North Platte River at Bridgeport, NE CFS 15,200
North Platte River at Lisco, NE CFS 5,500
North Platte River at Lewellen, NE* CFS 4,795
North Platte River at North Platte, NE** CFS 3,000
South Platte River at Julesburg, CO CFS 8,240
South Platte River at Roscoe, NE CFS 9,970
South Platte River at North Platte, NE CFS 18,700
Platte River at Brady, NE* CFS 15,846
Platte River at Cozad, NE* CFS 5,845
Platte River at Overton, NE CFS 7,430
* Flood flow calculated based on NWS Flood Stage and best available rating curve data.
** Capacity estimated based on anticipated channel improvements to North Platte “choke point”
Page 10 of 68 April 8, 2008 PRRIP - Water Management Study, Phase I
Page 11 of 68 April 8, 2008 PRRIP - Water Management Study, Phase I
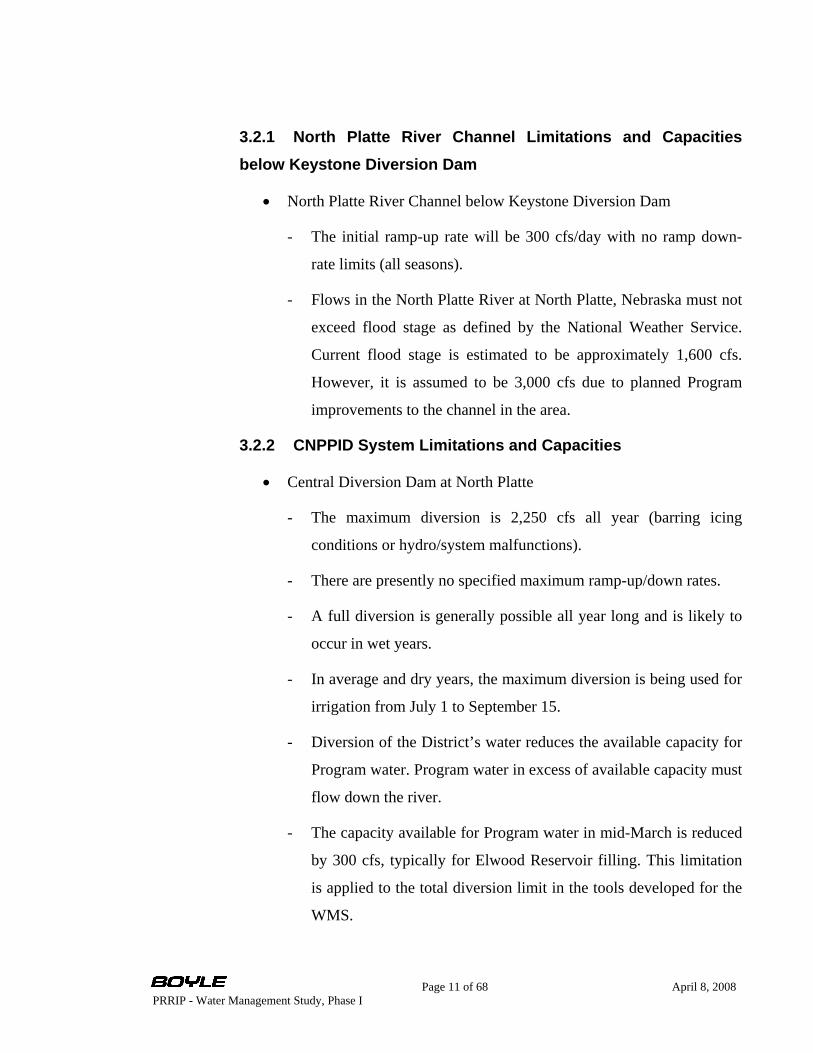
3.2.1 North Platte River Channel Limitations and Capacities below Keystone Diversion Dam
• North Platte River Channel below Keystone Diversion Dam
- The initial ramp-up rate will be 300 cfs/day with no ramp down-
rate limits (all seasons).
- Flows in the North Platte River at North Platte, Nebraska must not
exceed flood stage as defined by the National Weather Service.
Current flood stage is estimated to be approximately 1,600 cfs.
However, it is assumed to be 3,000 cfs due to planned Program
improvements to the channel in the area.
3.2.2 CNPPID System Limitations and Capacities
• Central Diversion Dam at North Platte
- The maximum diversion is 2,250 cfs all year (barring icing
conditions or hydro/system malfunctions).
- There are presently no specified maximum ramp-up/down rates.
- A full diversion is generally possible all year long and is likely to
occur in wet years.
- In average and dry years, the maximum diversion is being used for
irrigation from July 1 to September 15.
- Diversion of the District’s water reduces the available capacity for
Program water. Program water in excess of available capacity must
flow down the river.
- The capacity available for Program water in mid-March is reduced
by 300 cfs, typically for Elwood Reservoir filling. This limitation
is applied to the total diversion limit in the tools developed for the
WMS.
Page 12 of 68 April 8, 2008 PRRIP - Water Management Study, Phase I
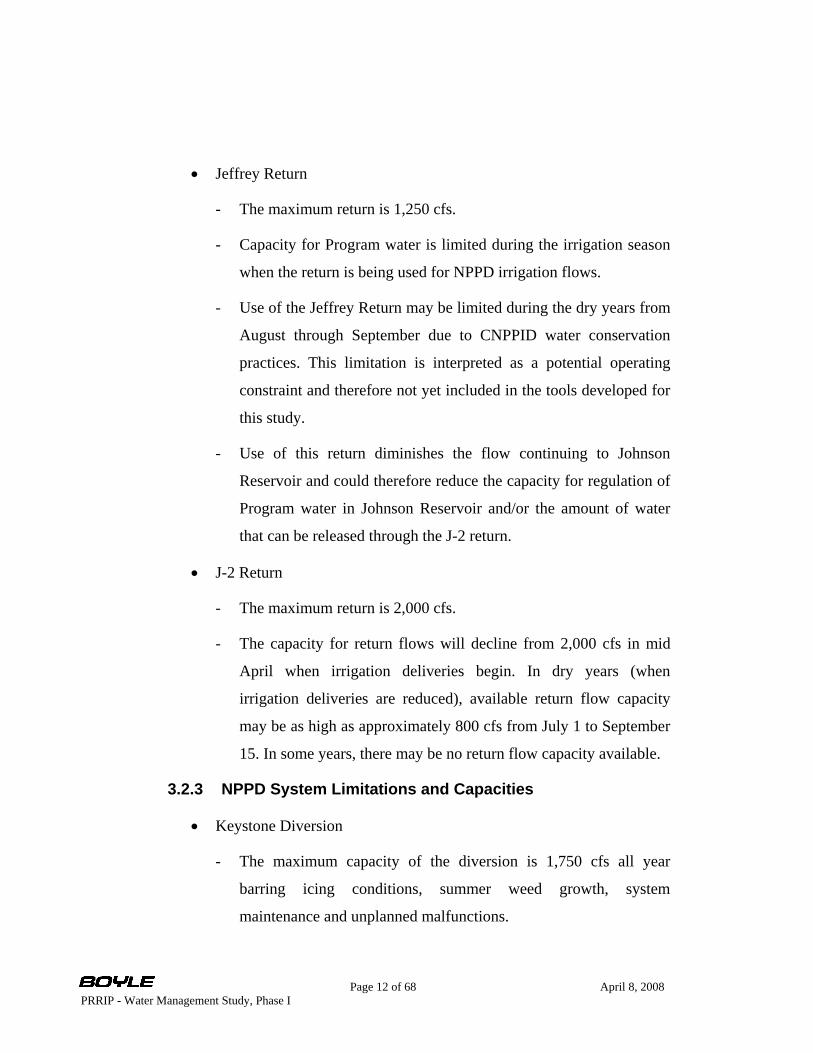
• Jeffrey Return
- The maximum return is 1,250 cfs.
- Capacity for Program water is limited during the irrigation season
when the return is being used for NPPD irrigation flows.
- Use of the Jeffrey Return may be limited during the dry years from
August through September due to CNPPID water conservation
practices. This limitation is interpreted as a potential operating
constraint and therefore not yet included in the tools developed for
this study.
- Use of this return diminishes the flow continuing to Johnson
Reservoir and could therefore reduce the capacity for regulation of
Program water in Johnson Reservoir and/or the amount of water
that can be released through the J-2 return.
• J-2 Return
- The maximum return is 2,000 cfs.
- The capacity for return flows will decline from 2,000 cfs in mid
April when irrigation deliveries begin. In dry years (when
irrigation deliveries are reduced), available return flow capacity
may be as high as approximately 800 cfs from July 1 to September
15. In some years, there may be no return flow capacity available.
3.2.3 NPPD System Limitations and Capacities
• Keystone Diversion
- The maximum capacity of the diversion is 1,750 cfs all year
barring icing conditions, summer weed growth, system
maintenance and unplanned malfunctions.

Page 13 of 68 April 8, 2008 PRRIP - Water Management Study, Phase I
- The ramp-up/down rate is 100 cfs/day all year, barring icing
conditions and summer weed growth and system malfunctions.
This ramp rate limitation is intended to avoid canal system damage
that could result in a loss of the cooling water supply to Gerald
Gentlemen power plant.
- The entire capacity is typically required for irrigation from July 1
to September 15.
• Korty Diversion
- The maximum capacity of the diversion is 850 cfs all year, barring
icing conditions, summer weed growth and system malfunctions.
• Total NPPD Diversion
- The total diversion to NPPD can be no more than 1,900 cfs below
the confluence of the Keystone and Korty Diversions all year,
barring icing conditions, summer weed growth and system
malfunctions.
• NPPD North Platte Hydro
- The maximum capacity is 1,750 cfs. As the hydro discharge rate
increases to the maximum, a reduction in the storage level in Lake
Maloney is required due to the fact that the system has no by-pass
potential at the North Platte Hydro. When the outlet canal is
flowing at a high rate, additional space is necessary in Lake
Maloney to allow for the storage of the additional flow. The
maximum hydro discharge rate may also decrease as the storage
level in Lake Maloney is reduced, assuming inadequate
replacement inflows in the Sutherland Outlet Canal.
- The ramp-up rate is 200 cfs per day and there is no maximum
ramp-down rate, as long as adequate storage space exists in
Sutherland and Maloney Reservoirs for flows in the canals.
Page 14 of 68 April 8, 2008 PRRIP - Water Management Study, Phase I
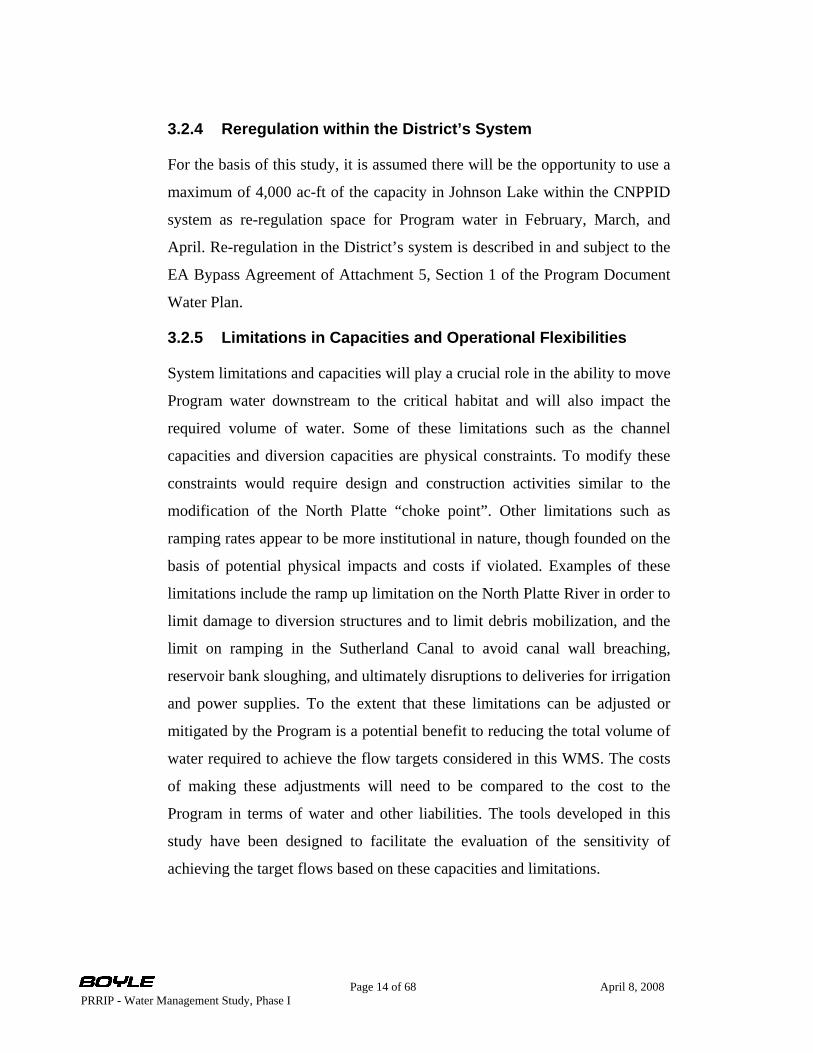
3.2.4 Reregulation within the District’s System
For the basis of this study, it is assumed there will be the opportunity to use a
maximum of 4,000 ac-ft of the capacity in Johnson Lake within the CNPPID
system as re-regulation space for Program water in February, March, and
April. Re-regulation in the District’s system is described in and subject to the
EA Bypass Agreement of Attachment 5, Section 1 of the Program Document
Water Plan.
3.2.5 Limitations in Capacities and Operational Flexibilities
System limitations and capacities will play a crucial role in the ability to move
Program water downstream to the critical habitat and will also impact the
required volume of water. Some of these limitations such as the channel
capacities and diversion capacities are physical constraints. To modify these
constraints would require design and construction activities similar to the
modification of the North Platte “choke point”. Other limitations such as
ramping rates appear to be more institutional in nature, though founded on the
basis of potential physical impacts and costs if violated. Examples of these
limitations include the ramp up limitation on the North Platte River in order to
limit damage to diversion structures and to limit debris mobilization, and the
limit on ramping in the Sutherland Canal to avoid canal wall breaching,
reservoir bank sloughing, and ultimately disruptions to deliveries for irrigation
and power supplies. To the extent that these limitations can be adjusted or
mitigated by the Program is a potential benefit to reducing the total volume of
water required to achieve the flow targets considered in this WMS. The costs
of making these adjustments will need to be compared to the cost to the
Program in terms of water and other liabilities. The tools developed in this
study have been designed to facilitate the evaluation of the sensitivity of
achieving the target flows based on these capacities and limitations.
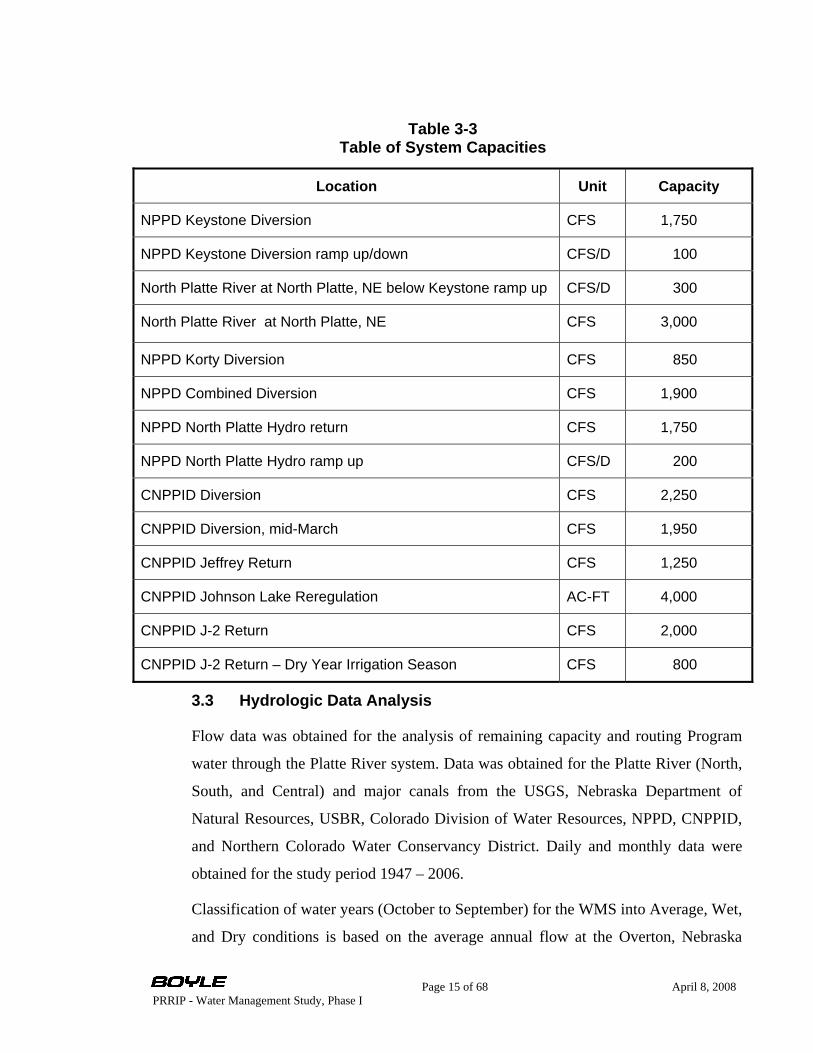
Table 3-3 Table of System Capacities
Location Unit Capacity
NPPD Keystone Diversion CFS 1,750
NPPD Keystone Diversion ramp up/down CFS/D 100
North Platte River at North Platte, NE below Keystone ramp up CFS/D 300
North Platte River at North Platte, NE CFS 3,000
NPPD Korty Diversion CFS 850
NPPD Combined Diversion CFS 1,900
NPPD North Platte Hydro return CFS 1,750
NPPD North Platte Hydro ramp up CFS/D 200
CNPPID Diversion CFS 2,250
CNPPID Diversion, mid-March CFS 1,950
CNPPID Jeffrey Return CFS 1,250
CNPPID Johnson Lake Reregulation AC-FT 4,000
CNPPID J-2 Return CFS 2,000
CNPPID J-2 Return – Dry Year Irrigation Season CFS 800
3.3 Hydrologic Data Analysis
Flow data was obtained for the analysis of remaining capacity and routing Program
water through the Platte River system. Data was obtained for the Platte River (North,
South, and Central) and major canals from the USGS, Nebraska Department of
Natural Resources, USBR, Colorado Division of Water Resources, NPPD, CNPPID,
and Northern Colorado Water Conservancy District. Daily and monthly data were
obtained for the study period 1947 – 2006.
Classification of water years (October to September) for the WMS into Average, Wet,
and Dry conditions is based on the average annual flow at the Overton, Nebraska
Page 15 of 68 April 8, 2008 PRRIP - Water Management Study, Phase I
Page 16 of 68 April 8, 2008 PRRIP - Water Management Study, Phase I
gage. The classification of years is done to facilitate the presentation and
interpretation of hydrologic conditions and resulting analysis. The WMS study period
is water year 1947 through water year 2006. These years are classified as Wet (25%
wettest years), Dry (25% driest years), and Average (remaining years). The 60 year
period results in 30 Average, 15 Wet, and 15 Dry years. This methodology for
classifying hydrologic conditions for use in the WMS was determined by the Program
participants and outlined in the RFP. The hydrologic period of record for the Water
Action Plan and the FEIS ended in 1994. Inclusion of the years 1995-2006 in the
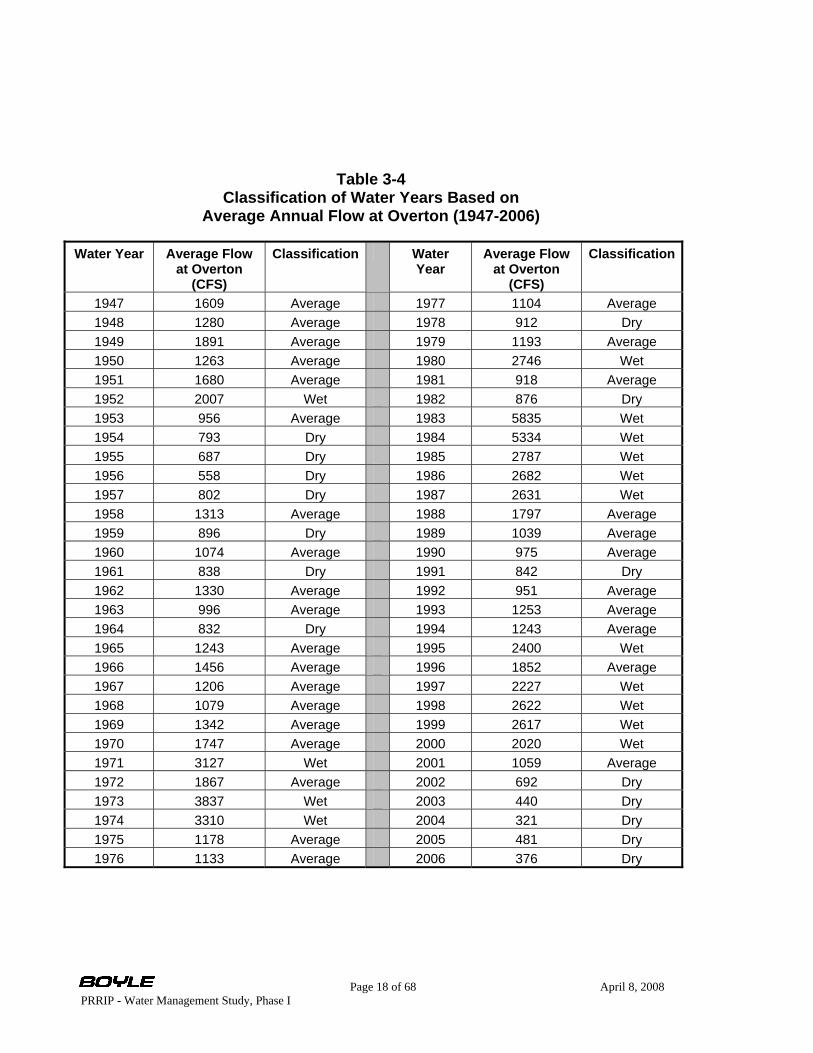
WMS add five of the seven lowest flow years in the 60-year study period. Figure 3-1
entitled “Classification of Water Years Based on Average Annual Flow at Overton
(1947-2006)” presents the classification graphically for the average annual flows at
the Overton gage. Table 3-4 entitled “Classification of Water Years Based on
Average Annual Flow at Overton (1947-2006) details the classification and the
associated average annual flow at Overton.
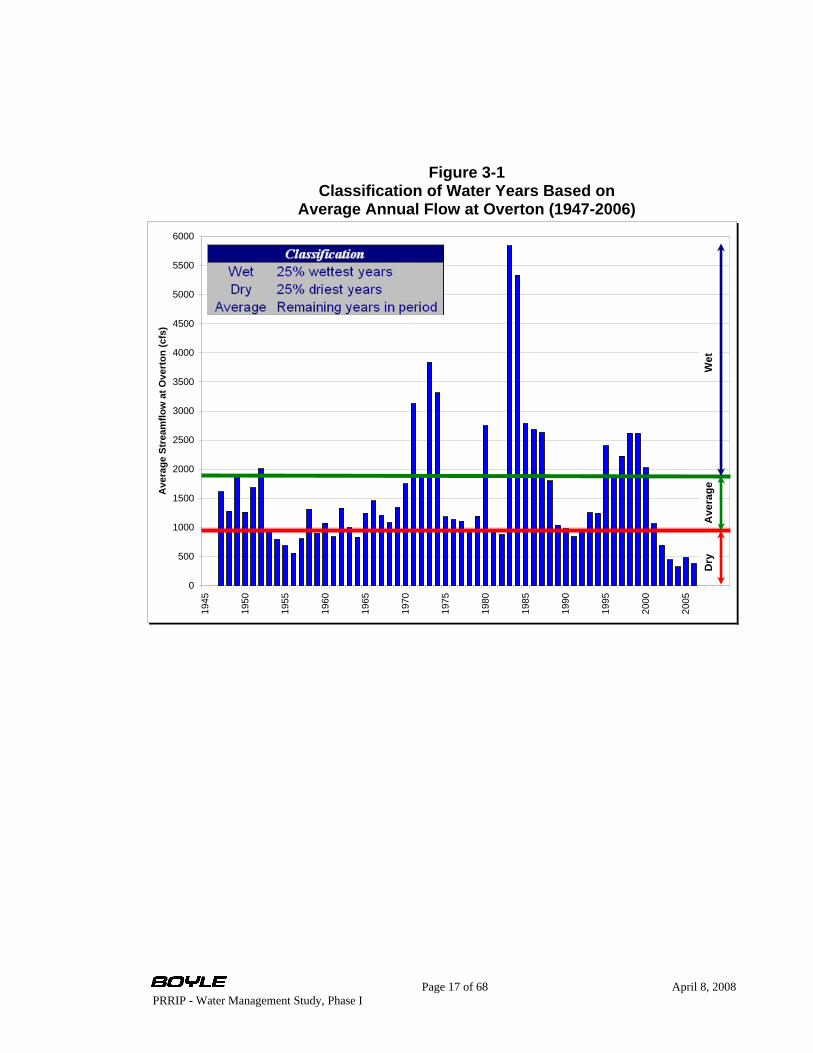
Figure 3-1 Classification of Water Years Based on
Average Annual Flow at Overton (1947-2006)
0
500
1000
1500
2000
2500
3000
3500
4000
4500
5000
5500
6000
1945
1950
1955
1960
1965
1970
1975
1980
1985
1990
1995
2000
2005
Ave
rage
Str
eam
flow
at O
vert
on (c
fs)
Wet
Dry
Ave
rage
Page 17 of 68 April 8, 2008 PRRIP - Water Management Study, Phase I
Page 18 of 68 April 8, 2008 PRRIP - Water Management Study, Phase I
Table 3-4 Classification of Water Years Based on
Average Annual Flow at Overton (1947-2006)
Water Year Average Flow at Overton
(CFS)
Classification Water Year
Average Flow at Overton
(CFS)
Classification
1947 1609 Average 1977 1104 Average 1948 1280 Average 1978 912 Dry 1949 1891 Average 1979 1193 Average 1950 1263 Average 1980 2746 Wet 1951 1680 Average 1981 918 Average 1952 2007 Wet 1982 876 Dry 1953 956 Average 1983 5835 Wet 1954 793 Dry 1984 5334 Wet 1955 687 Dry 1985 2787 Wet 1956 558 Dry 1986 2682 Wet 1957 802 Dry 1987 2631 Wet 1958 1313 Average 1988 1797 Average 1959 896 Dry 1989 1039 Average 1960 1074 Average 1990 975 Average 1961 838 Dry 1991 842 Dry 1962 1330 Average 1992 951 Average 1963 996 Average 1993 1253 Average 1964 832 Dry 1994 1243 Average 1965 1243 Average 1995 2400 Wet 1966 1456 Average 1996 1852 Average 1967 1206 Average 1997 2227 Wet 1968 1079 Average 1998 2622 Wet 1969 1342 Average 1999 2617 Wet 1970 1747 Average 2000 2020 Wet 1971 3127 Wet 2001 1059 Average 1972 1867 Average 2002 692 Dry 1973 3837 Wet 2003 440 Dry 1974 3310 Wet 2004 321 Dry 1975 1178 Average 2005 481 Dry 1976 1133 Average 2006 376 Dry

Page 19 of 68 April 8, 2008 PRRIP - Water Management Study, Phase I
3.4 Update of WMC Loss Model Spreadsheet
The original Water Management Committee (WMC) water budget spreadsheet model
(loss model) spanned 20 water years from 1975 through 1994. The loss model was
expanded to include hydrology for water years 1995 through 2006 to provide a
comprehensive analysis by including the driest drought years of 2002 through 2006.
A technical memorandum is included in Appendix 2, providing a detailed explanation
of modifications and assumptions made.
3.5 Travel Times and Daily Losses
The geographic separation of Lake McConaughy and Overton, Nebraska, the natural
and constructed environment, and variability in hydrology all contribute to the
complexity of estimating the timing and magnitude of a timed release of Program
water necessary to meet target flows downstream at the Critical Habitat. These
complexities are approximated with the use of travel times and loss factors
incorporated into spreadsheet calculations. Empirical estimates for these variables
were derived based on analysis of daily streamflow and diversion data for specific
river reaches and information gathered from the participant interviews.
3.5.1 Estimation of Travel Times
Travel times were estimated for the river and canal systems from Lake
McConaughy on the North Platte River and the Roscoe gage on the South
Platte River, downstream to the Overton gage on the Platte River.
Intermediate locations include North Platte, NE (the confluence) and the
Brady gage. These intermediate locations were chosen based on the location
of stream gages, and relative proximity to the Districts’ diversions and returns.
The confluence of the North and South Platte Rivers, the North Platte Hydro
Return, and the CNPPID diversion are grouped together for purposes of
estimating travel time. Travel times were rounded to daily increments due to
the daily time step of the routing tool. Based on discussions with the Districts’
staff, travel times for the canals are estimated to be the same as travel time in
the coincident river reach.
Page 20 of 68 April 8, 2008 PRRIP - Water Management Study, Phase I
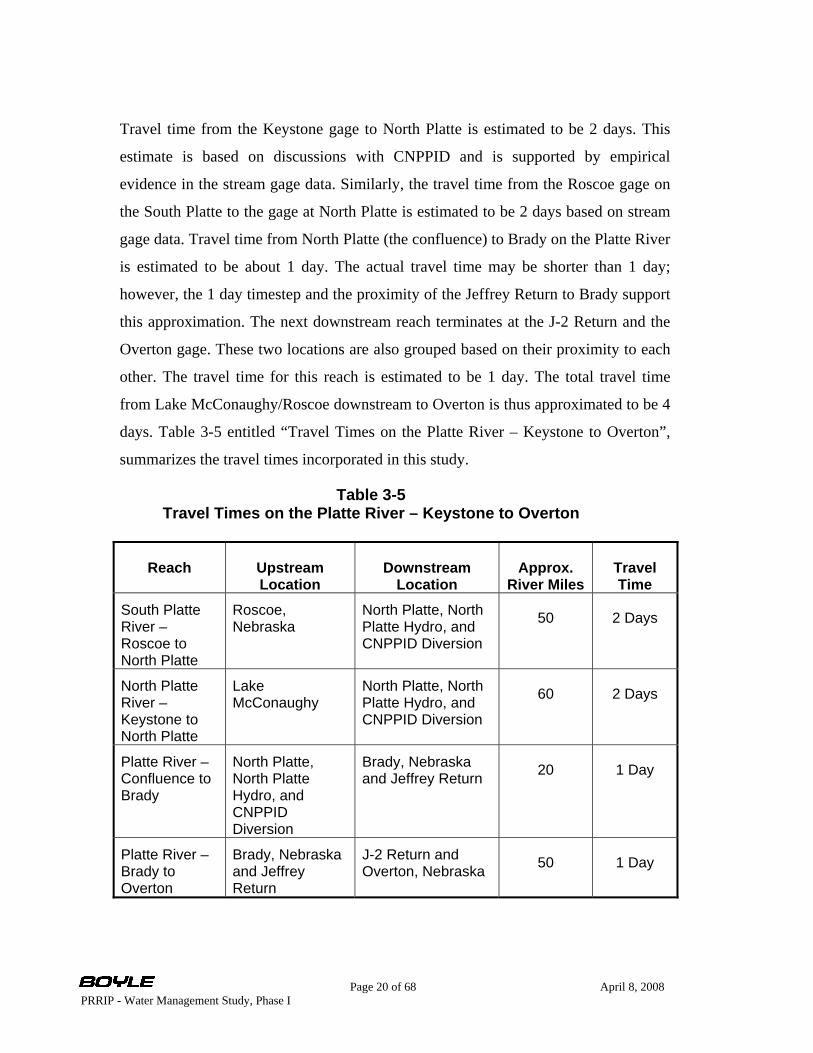
Travel time from the Keystone gage to North Platte is estimated to be 2 days. This
estimate is based on discussions with CNPPID and is supported by empirical
evidence in the stream gage data. Similarly, the travel time from the Roscoe gage on
the South Platte to the gage at North Platte is estimated to be 2 days based on stream
gage data. Travel time from North Platte (the confluence) to Brady on the Platte River
is estimated to be about 1 day. The actual travel time may be shorter than 1 day;
however, the 1 day timestep and the proximity of the Jeffrey Return to Brady support
this approximation. The next downstream reach terminates at the J-2 Return and the
Overton gage. These two locations are also grouped based on their proximity to each
other. The travel time for this reach is estimated to be 1 day. The total travel time
from Lake McConaughy/Roscoe downstream to Overton is thus approximated to be 4
days. Table 3-5 entitled “Travel Times on the Platte River – Keystone to Overton”,
summarizes the travel times incorporated in this study.
Table 3-5 Travel Times on the Platte River – Keystone to Overton
Reach Upstream Location
Downstream Location
Approx. River Miles
Travel Time
South Platte River – Roscoe to North Platte
Roscoe, Nebraska
North Platte, North Platte Hydro, and CNPPID Diversion
50 2 Days
North Platte River – Keystone to North Platte
Lake McConaughy
North Platte, North Platte Hydro, and CNPPID Diversion
60 2 Days
Platte River – Confluence to Brady
North Platte, North Platte Hydro, and CNPPID Diversion
Brady, Nebraska and Jeffrey Return 20 1 Day
Platte River – Brady to Overton
Brady, Nebraska and Jeffrey Return
J-2 Return and Overton, Nebraska 50 1 Day
Page 21 of 68 April 8, 2008 PRRIP - Water Management Study, Phase I
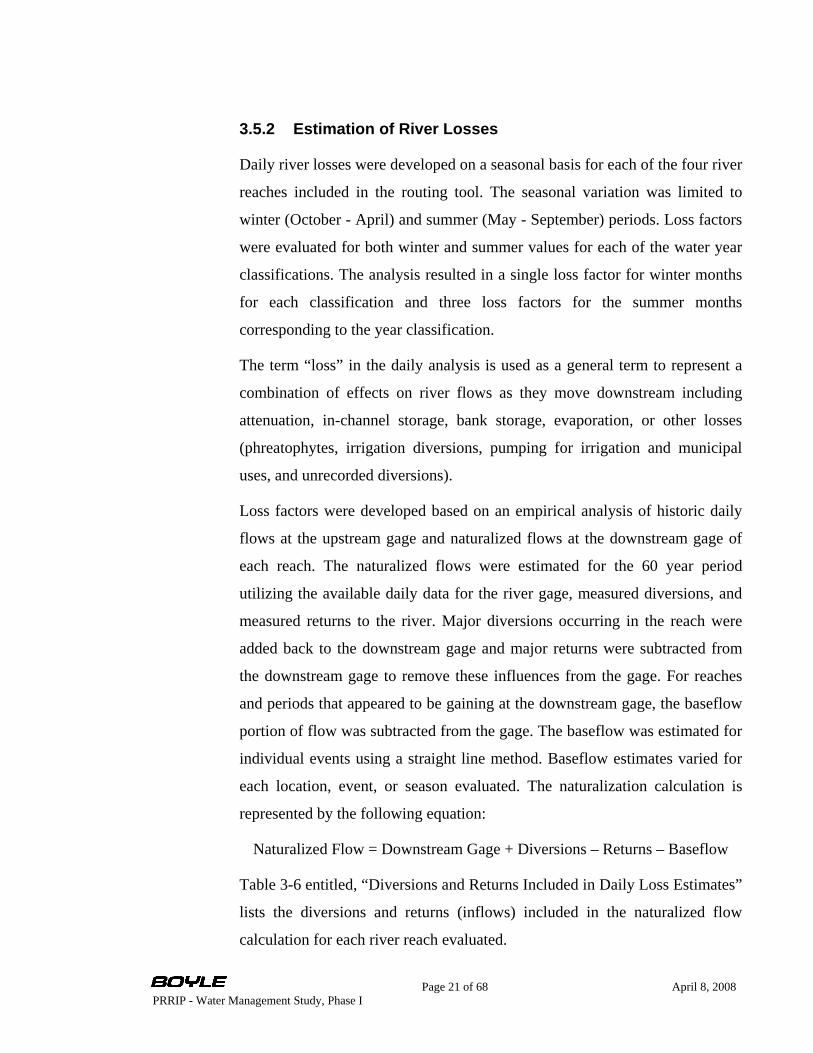
3.5.2 Estimation of River Losses
Daily river losses were developed on a seasonal basis for each of the four river
reaches included in the routing tool. The seasonal variation was limited to
winter (October - April) and summer (May - September) periods. Loss factors
were evaluated for both winter and summer values for each of the water year
classifications. The analysis resulted in a single loss factor for winter months
for each classification and three loss factors for the summer months
corresponding to the year classification.
The term “loss” in the daily analysis is used as a general term to represent a
combination of effects on river flows as they move downstream including
attenuation, in-channel storage, bank storage, evaporation, or other losses
(phreatophytes, irrigation diversions, pumping for irrigation and municipal
uses, and unrecorded diversions).
Loss factors were developed based on an empirical analysis of historic daily
flows at the upstream gage and naturalized flows at the downstream gage of
each reach. The naturalized flows were estimated for the 60 year period
utilizing the available daily data for the river gage, measured diversions, and
measured returns to the river. Major diversions occurring in the reach were
added back to the downstream gage and major returns were subtracted from
the downstream gage to remove these influences from the gage. For reaches
and periods that appeared to be gaining at the downstream gage, the baseflow
portion of flow was subtracted from the gage. The baseflow was estimated for
individual events using a straight line method. Baseflow estimates varied for
each location, event, or season evaluated. The naturalization calculation is
represented by the following equation:
Naturalized Flow = Downstream Gage + Diversions – Returns – Baseflow
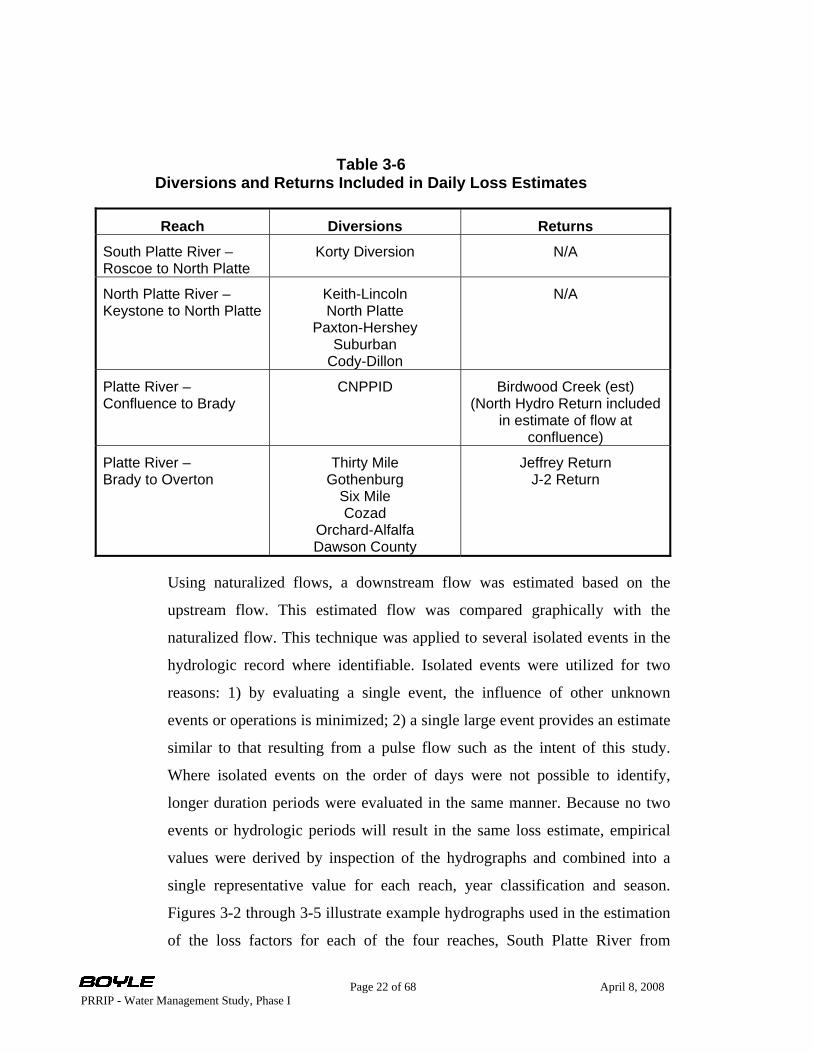
Table 3-6 entitled, “Diversions and Returns Included in Daily Loss Estimates”
lists the diversions and returns (inflows) included in the naturalized flow
calculation for each river reach evaluated.
Page 22 of 68 April 8, 2008 PRRIP - Water Management Study, Phase I
Table 3-6 Diversions and Returns Included in Daily Loss Estimates
Reach Diversions Returns
South Platte River – Roscoe to North Platte
Korty Diversion N/A
North Platte River – Keystone to North Platte
Keith-Lincoln North Platte
Paxton-Hershey Suburban
Cody-Dillon
N/A
Platte River – Confluence to Brady
CNPPID Birdwood Creek (est) (North Hydro Return included
in estimate of flow at confluence)
Platte River – Brady to Overton
Thirty Mile Gothenburg
Six Mile Cozad
Orchard-Alfalfa Dawson County
Jeffrey Return J-2 Return
Using naturalized flows, a downstream flow was estimated based on the
upstream flow. This estimated flow was compared graphically with the
naturalized flow. This technique was applied to several isolated events in the
hydrologic record where identifiable. Isolated events were utilized for two
reasons: 1) by evaluating a single event, the influence of other unknown
events or operations is minimized; 2) a single large event provides an estimate
similar to that resulting from a pulse flow such as the intent of this study.
Where isolated events on the order of days were not possible to identify,
longer duration periods were evaluated in the same manner. Because no two
events or hydrologic periods will result in the same loss estimate, empirical
values were derived by inspection of the hydrographs and combined into a
single representative value for each reach, year classification and season.
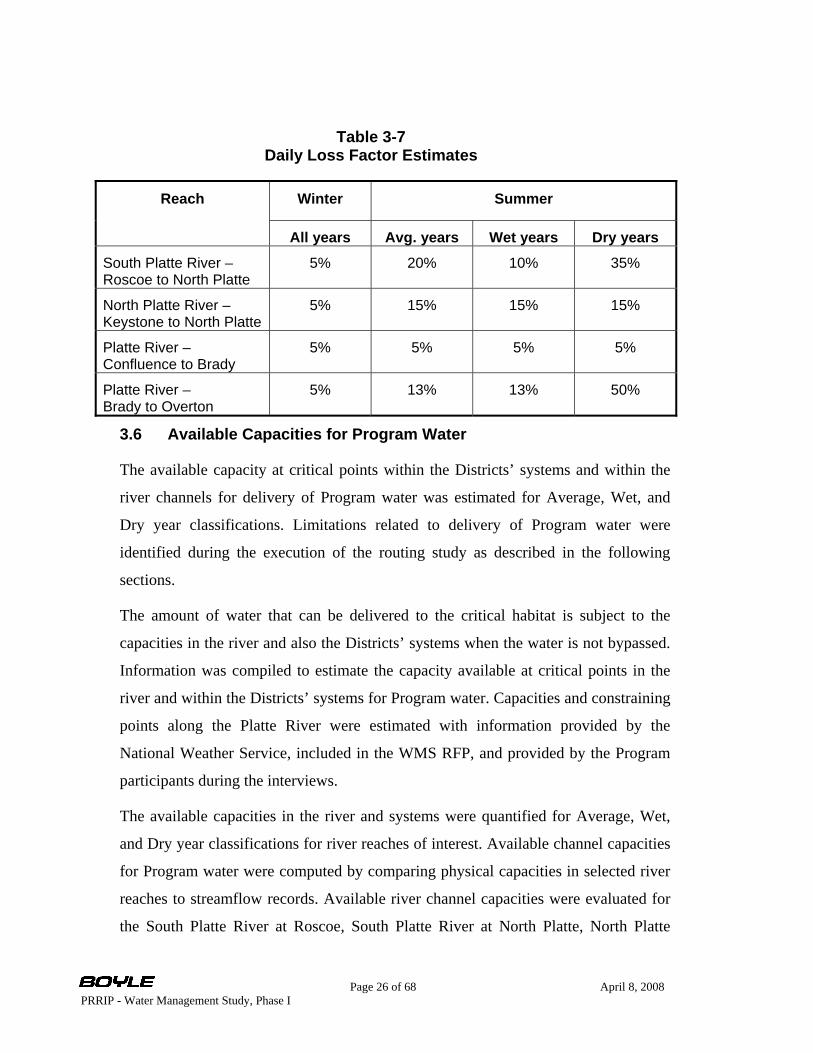
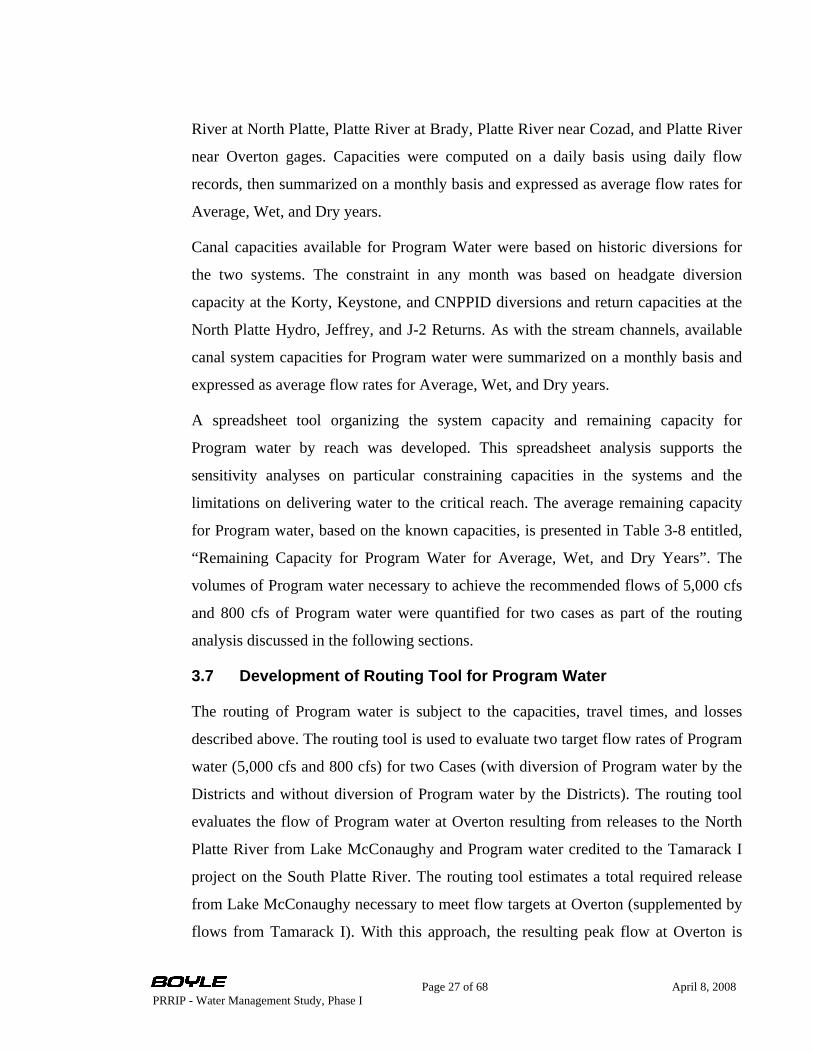
Figures 3-2 through 3-5 illustrate example hydrographs used in the estimation
of the loss factors for each of the four reaches, South Platte River from
Page 23 of 68 April 8, 2008 PRRIP - Water Management Study, Phase I
Roscoe to North Platte, North Platte River from Keystone to North Platte,
Platte River from the confluence to Brady, and Platte River from Brady to
Overton. These graphs show the recorded upstream flow, recorded
downstream flow, calculated naturalized flow at the downstream gage, and the
estimated downstream flow. The estimated downstream flow is calculated by
applying the loss factor for that event or period to the upstream recorded flow.
The estimated loss factor for a given event, or period, is derived iteratively by
inspection of how well the estimated flow hydrograph matches the naturalized
flow hydrograph. This process was performed for several events over each
reach and the resulting estimated factors combined to a representative factor.
The estimated loss factors for the summer months vary based on year
classification. In the case of winter months, little variability was seen across
year classification, and therefore a single winter loss factor is used. Table 3-7
entitled, “Daily Loss Factor Estimates” summarizes the loss terms by season
and water year classification.
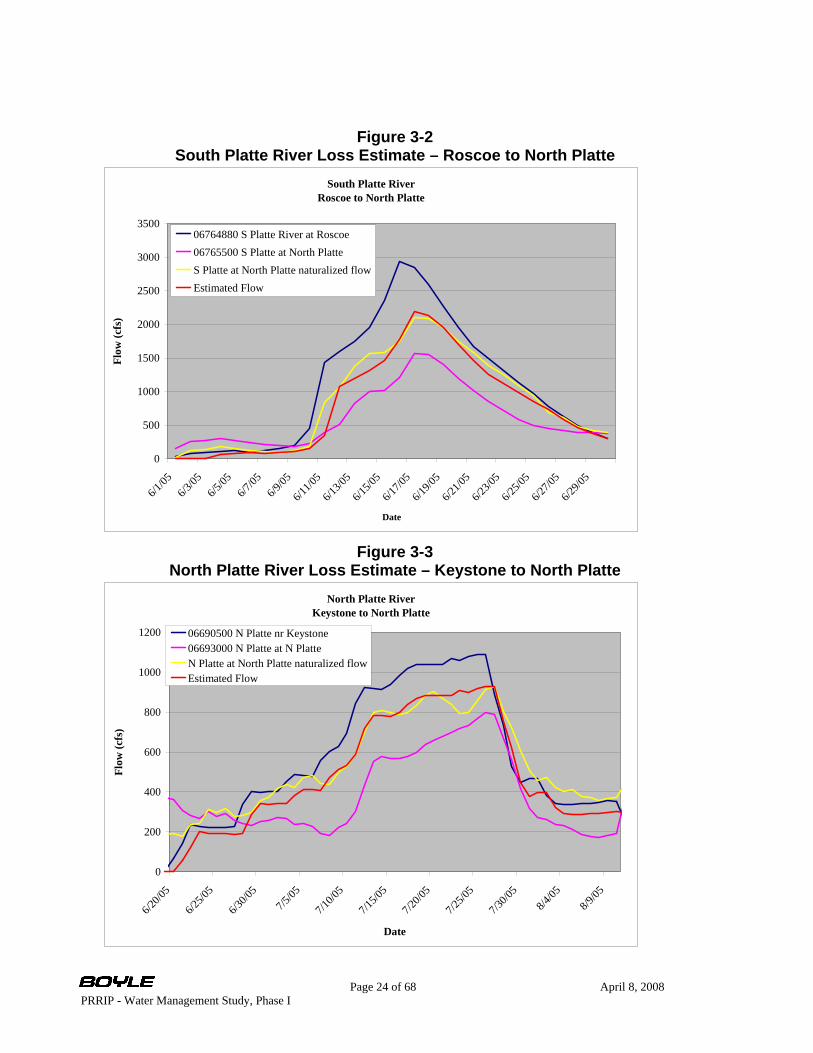
Figure 3-2 South Platte River Loss Estimate – Roscoe to North Platte
South Platte RiverRoscoe to North Platte
0
500
1000
1500
2000
2500
3000
3500
6/1/05
6/3/05
6/5/05
6/7/05
6/9/05
6/11/0
5
6/13/0
5
6/15/0
5
6/17/0
5
6/19/0
5
6/21/0
5
6/23/0
5
6/25/0
5
6/27/0
5
6/29/0
5
Date
Flow
(cfs
)
06764880 S Platte River at Roscoe06765500 S Platte at North PlatteS Platte at North Platte naturalized flowEstimated Flow
Figure 3-3
North Platte River Loss Estimate – Keystone to North Platte North Platte River
Keystone to North Platte
0
200
400
600
800
1000
1200
6/20/0
5
6/25/0
5
6/30/0
57/5
/05
7/10/0
5
7/15/0
5
7/20/0
5
7/25/0
5
7/30/0
58/4
/058/9
/05
Date
Flow
(cfs
)
06690500 N Platte nr Keystone06693000 N Platte at N PlatteN Platte at North Platte naturalized flowEstimated Flow
Page 24 of 68 April 8, 2008 PRRIP - Water Management Study, Phase I
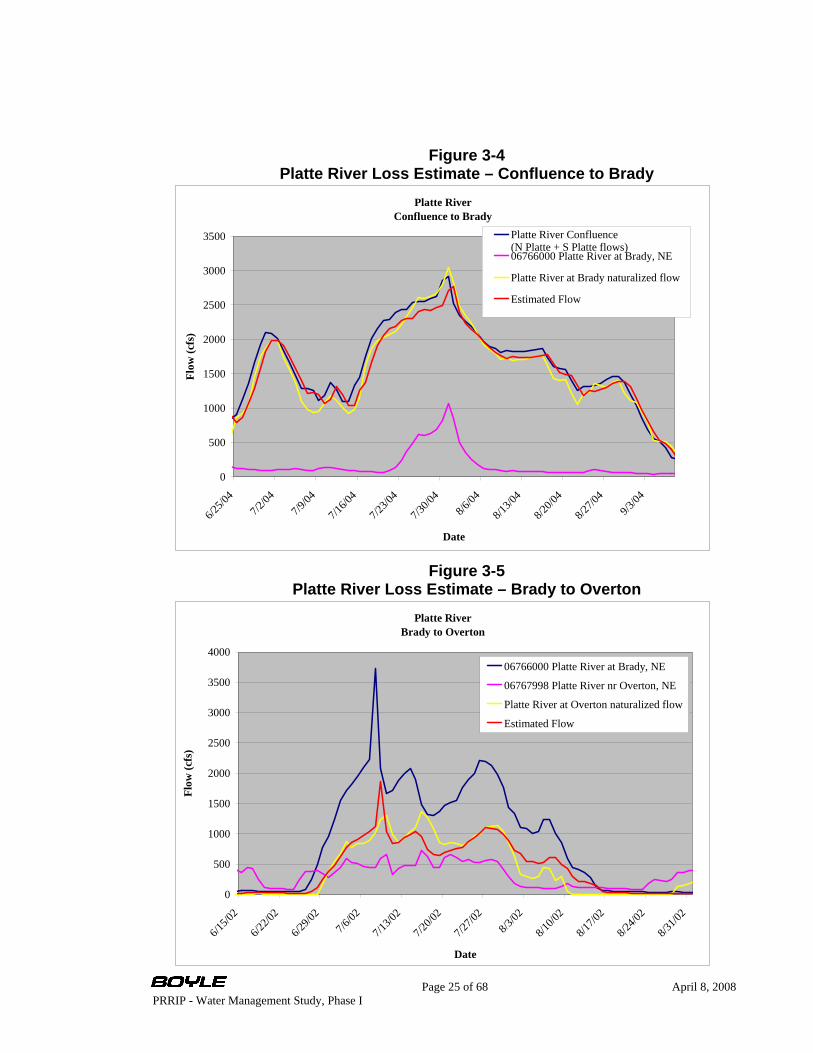
Figure 3-4
Platte River Loss Estimate – Confluence to Brady Platte River
Confluence to Brady
0
500
1000
1500
2000
2500
3000
3500
6/25/0
47/2
/047/9
/04
7/16/0
4
7/23/0
4
7/30/0
48/6
/04
8/13/0
4
8/20/0
4
8/27/0
49/3
/04
Date
Flow
(cfs
)
Platte River Confluence (N Platte + S Platte flows)06766000 Platte River at Brady, NE
Platte River at Brady naturalized flow
Estimated Flow
Figure 3-5
Platte River Loss Estimate – Brady to Overton Platte River
Brady to Overton
0
500
1000
1500
2000
2500
3000
3500
4000
6/15/0
2
6/22/0
2
6/29/0
27/6
/02
7/13/0
2
7/20/0
2
7/27/0
28/3
/02
8/10/0
2
8/17/0
2
8/24/0
2
8/31/0
2
Date
Flow
(cfs
)
06766000 Platte River at Brady, NE
06767998 Platte River nr Overton, NE
Platte River at Overton naturalized flow
Estimated Flow
Page 25 of 68 April 8, 2008 PRRIP - Water Management Study, Phase I
Page 26 of 68 April 8, 2008 PRRIP - Water Management Study, Phase I
Table 3-7 Daily Loss Factor Estimates
Winter Summer Reach
All years Avg. years Wet years Dry years
South Platte River – Roscoe to North Platte
5% 20% 10% 35%
North Platte River – Keystone to North Platte
5% 15% 15% 15%
Platte River – Confluence to Brady
5% 5% 5% 5%
Platte River – Brady to Overton
5% 13% 13% 50%
3.6 Available Capacities for Program Water
The available capacity at critical points within the Districts’ systems and within the
river channels for delivery of Program water was estimated for Average, Wet, and
Dry year classifications. Limitations related to delivery of Program water were
identified during the execution of the routing study as described in the following
sections.
The amount of water that can be delivered to the critical habitat is subject to the
capacities in the river and also the Districts’ systems when the water is not bypassed.
Information was compiled to estimate the capacity available at critical points in the
river and within the Districts’ systems for Program water. Capacities and constraining
points along the Platte River were estimated with information provided by the
National Weather Service, included in the WMS RFP, and provided by the Program
participants during the interviews.
The available capacities in the river and systems were quantified for Average, Wet,
and Dry year classifications for river reaches of interest. Available channel capacities
for Program water were computed by comparing physical capacities in selected river
reaches to streamflow records. Available river channel capacities were evaluated for
the South Platte River at Roscoe, South Platte River at North Platte, North Platte
Page 27 of 68 April 8, 2008 PRRIP - Water Management Study, Phase I
River at North Platte, Platte River at Brady, Platte River near Cozad, and Platte River
near Overton gages. Capacities were computed on a daily basis using daily flow
records, then summarized on a monthly basis and expressed as average flow rates for
Average, Wet, and Dry years.
Canal capacities available for Program Water were based on historic diversions for
the two systems. The constraint in any month was based on headgate diversion
capacity at the Korty, Keystone, and CNPPID diversions and return capacities at the
North Platte Hydro, Jeffrey, and J-2 Returns. As with the stream channels, available
canal system capacities for Program water were summarized on a monthly basis and
expressed as average flow rates for Average, Wet, and Dry years.
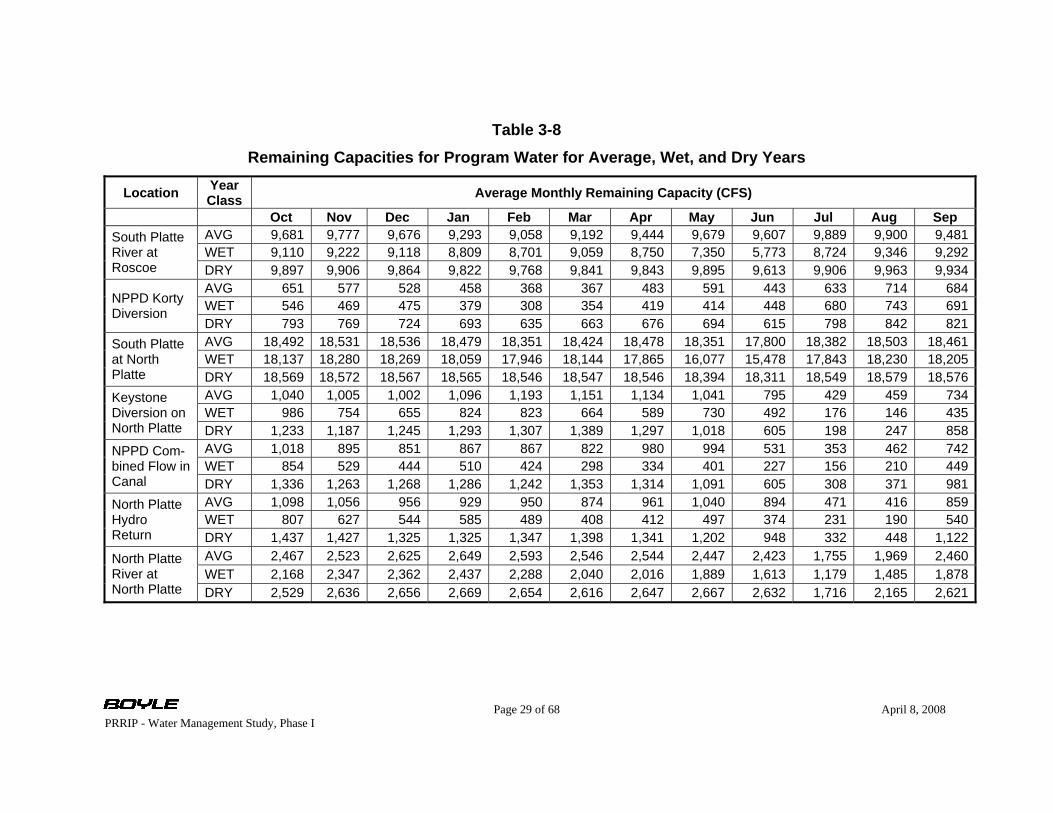
A spreadsheet tool organizing the system capacity and remaining capacity for
Program water by reach was developed. This spreadsheet analysis supports the
sensitivity analyses on particular constraining capacities in the systems and the
limitations on delivering water to the critical reach. The average remaining capacity
for Program water, based on the known capacities, is presented in Table 3-8 entitled,
“Remaining Capacity for Program Water for Average, Wet, and Dry Years”. The
volumes of Program water necessary to achieve the recommended flows of 5,000 cfs
and 800 cfs of Program water were quantified for two cases as part of the routing
analysis discussed in the following sections.
3.7 Development of Routing Tool for Program Water
The routing of Program water is subject to the capacities, travel times, and losses
described above. The routing tool is used to evaluate two target flow rates of Program
water (5,000 cfs and 800 cfs) for two Cases (with diversion of Program water by the
Districts and without diversion of Program water by the Districts). The routing tool
evaluates the flow of Program water at Overton resulting from releases to the North
Platte River from Lake McConaughy and Program water credited to the Tamarack I
project on the South Platte River. The routing tool estimates a total required release
from Lake McConaughy necessary to meet flow targets at Overton (supplemented by
flows from Tamarack I). With this approach, the resulting peak flow at Overton is

PRRIP - Water
Page 28 of 68 April 8, 2008 Management Study, Phase I
limited by the system capacities and not the available supply of EA water in Lake
McConaughy. This approach focuses on conveyance constraints that are limiting,
helps to limit the number of potential routing solutions for a particular study year, and
answers the question, “How much water would need to be released from Lake
McConaughy in an attempt to achieve the pulse flow target”.
Page 29 of 68 April 8, 2008 PRRIP - Water Management Study, Phase I
Table 3-8 Remaining Capacities for Program Water for Average, Wet, and Dry Years
Location Year Class Average Monthly Remaining Capacity (CFS)
Oct Nov Dec Jan Feb Mar Apr May Jun Jul Aug Sep AVG 9,681 9,777 9,676 9,293 9,058 9,192 9,444 9,679 9,607 9,889 9,900 9,481WET 9,110 9,222 9,118 8,809 8,701 9,059 8,750 7,350 5,773 8,724 9,346 9,292
South Platte River at Roscoe DRY 9,897 9,906 9,864 9,822 9,768 9,841 9,843 9,895 9,613 9,906 9,963 9,934
AVG 651 577 528 458 368 367 483 591 443 633 714 684WET 546 469 475 379 308 354 419 414 448 680 743 691NPPD Korty
Diversion DRY 793 769 724 693 635 663 676 694 615 798 842 821AVG 18,492 18,531 18,536 18,479 18,351 18,424 18,478 18,351 17,800 18,382 18,503 18,461WET 18,137 18,280 18,269 18,059 17,946 18,144 17,865 16,077 15,478 17,843 18,230 18,205
South Platte at North Platte DRY 18,569 18,572 18,567 18,565 18,546 18,547 18,546 18,394 18,311 18,549 18,579 18,576
AVG 1,040 1,005 1,002 1,096 1,193 1,151 1,134 1,041 795 429 459 734WET 986 754 655 824 823 664 589 730 492 176 146 435
Keystone Diversion on North Platte DRY 1,233 1,187 1,245 1,293 1,307 1,389 1,297 1,018 605 198 247 858
AVG 1,018 895 851 867 867 822 980 994 531 353 462 742WET 854 529 444 510 424 298 334 401 227 156 210 449
NPPD Com-bined Flow in Canal DRY 1,336 1,263 1,268 1,286 1,242 1,353 1,314 1,091 605 308 371 981
AVG 1,098 1,056 956 929 950 874 961 1,040 894 471 416 859WET 807 627 544 585 489 408 412 497 374 231 190 540
North Platte Hydro Return DRY 1,437 1,427 1,325 1,325 1,347 1,398 1,341 1,202 948 332 448 1,122
AVG 2,467 2,523 2,625 2,649 2,593 2,546 2,544 2,447 2,423 1,755 1,969 2,460WET 2,168 2,347 2,362 2,437 2,288 2,040 2,016 1,889 1,613 1,179 1,485 1,878
North Platte River at North Platte DRY 2,529 2,636 2,656 2,669 2,654 2,616 2,647 2,667 2,632 1,716 2,165 2,621

Page 30 of 68 April 8, 2008 PRRIP - Water Management Study, Phase I
Table 3-8 Remaining Capacities for Program Water for Average, Wet, and Dry Years
(continued)
Location Year Class Average Monthly Remaining Capacity (CFS)
Oct Nov Dec Jan Feb Mar Apr May Jun Jul Aug Sep AVG 897 906 898 928 782 677 754 733 587 281 266 723WET 504 524 618 589 336 312 290 259 215 168 137 399
CNPPID Diversion at North Platte DRY 1,367 1,441 1,381 1,393 1,332 1,332 1,298 1,107 803 218 419 1,138
AVG 15,682 15,687 15,671 15,590 15,494 15,513 15,605 15,498 15,006 14,821 15,135 15,599WET 14,976 15,117 15,043 14,841 14,703 14,520 14,008 11,896 10,586 13,285 14,004 14,397Platte River
at Brady DRY 15,733 15,718 15,698 15,690 15,678 15,666 15,672 15,554 15,575 14,965 15,315 15,732
AVG 1,201 1,199 1,242 1,243 1,237 1,237 1,246 1,194 1,089 1,098 1,003 1,139WET 1,189 1,184 1,248 1,218 1,218 1,247 1,246 1,245 1,220 1,149 1,138 1,211
CNPPID Jeffrey Return DRY 1,208 1,248 1,249 1,249 1,249 1,245 1,247 1,158 1,036 955 903 1,147
AVG 5,595 5,566 5,594 5,389 5,389 5,367 5,497 5,522 5,242 5,496 5,693 5,645WET 4,785 4,966 4,914 4,525 4,525 4,395 4,039 3,339 2,825 4,772 4,960 4,649Platte River
nr Cozad DRY 5,708 5,656 5,626 5,604 5,604 5,558 5,592 5,586 5,709 5,770 5,769 5,768AVG 1,071 1,012 933 864 864 750 1,002 1,362 1,452 1,652 1,721 1,325WET 756 730 679 437 437 453 574 834 1,138 1,727 1,587 922J-2 Return DRY 1,535 1,446 1,371 1,284 1,284 1,321 1,556 1,754 1,753 1,927 1,924 1,746AVG 6,185 6,080 6,011 5,707 5,707 5,489 5,916 6,300 6,097 6,528 6,878 6,475WET 4,966 5,082 4,958 4,296 4,296 4,209 4,028 3,512 3,141 5,776 5,942 4,961Platte River
nr Overton DRY 6,698 6,549 6,454 6,324 6,324 6,246 6,509 6,741 6,876 7,195 7,182 7,016
Page 31 of 68 April 8, 2008 PRRIP - Water Management Study, Phase I
The routing tool was applied to evaluate two flow targets, the 5,000 cfs 3-day pulse
during the low-demand period (September to May) and the 800 cfs steady flow during the
irrigation season (May to September), for the 60 year period from 1947 through 2006.
The results for each of the 60 years are summarized for the Average, Wet, and Dry year
classifications. The routing studies for each target flow were completed for the following
cases:
• Case I –Program water will first be diverted by the Districts when the Districts have
the capacity within their system to divert it. When constrained by canal system
capacity, available Program water not diverted by the Districts will be left in the river
to flow down to the critical reach.
• Case II – Program water will bypass the Districts’ system even if the Districts have
the capacity to divert it. Program water will bypass the Districts and be subject to the
operations of the river.
The tool developed for the routing of flows through the Platte system was developed as
an Excel spreadsheet representation of the Platte River from the Roscoe gage on the
South Platte River and Lake McConaughy on the North Platte River downstream to the
Overton gage. The spreadsheet includes the Platte River reaches from upstream gage to
downstream, the NPPD Korty and Keystone Diversions, the CNPPID Diversion, and the
North Platte Hydro, Jeffrey, and J-2 Returns.
Canal capacities, ramping rates, and river capacities, are represented in the routing tool as
described in Section 3.2. Specifically, the canal capacities incorporated in the routing tool
are the Korty Diversion, Keystone Diversion, combined capacity of Sutherland Canal,
North Platte Hydro Return, CNPPID Diversion, Jeffrey Return, and J-2 Return. These
capacities are included as variables in the tool to facilitate sensitivity analyses of these
constraints. Ramping rates are included for the North Platte River below Keystone,
Keystone Diversion, and North Platte Hydro Return. These rates are incorporated as
variables similar to the canal capacities to facilitate sensitivity analyses. River capacities,
represented by flood stage capacities, are included in the routing tool for North Platte
River at North Platte, Platte River at Brady, Cozad, and Overton. The North Platte “choke

Page 32 of 68 April 8, 2008 PRRIP - Water Management Study, Phase I
point” is incorporated in the calculation of releases of Program water from Lake
McConaughy. The Brady, Cozad, and Overton gages are included for use in comparison
to total flow. These locations are less constraining than the reaches and canal systems
below McConaughy and therefore not explicitly included as constraints in the routing
tool.
The routing tool utilizes a daily timestep to estimate the travel times and losses through
the system. Travel times are estimated at 1 or 2 days depending on the location in the
system. Historical travel times may vary or may be more or less than a multiple of a day,
but the use of a daily increment necessitates this approximation. The estimated travel
times for the key locations in the spreadsheet are summarized in Table 3-5 (Section 3.5).
River and canal losses as described in Section 3.5 and Table 3-7 are incorporated in the
routing tool based on water year classification. The river reaches for which these losses
were developed coincide with the reaches in the routing tool.
Program water is routed ‘on top of’ the historical hydrology, diversions, and return flows
in the Platte River and the Districts’ systems, constrained to the remaining available
capacity. Historical daily data for the period of 1947 through 2006 was obtained from the
USGS and Nebraska DNR to represent the historical hydrology and operations of the
river system. The historical data contains some periods of missing data. It is not clear in
the presentation of the data if a period of missing data represents a period of zero flow, or
a period of non-recorded flow. A period of zero flow can represent times when a canal or
return might be shut down for the season, for maintenance, or for inspections, such as
occurs with FERC re-licensing (required every five years). Since the reason for the
missing data is unclear, periods of missing data were filled with averages of recorded
values based on year classification. The average daily flow from the respective calendar
day for the Average, Wet, or Dry year classifications was substituted for missing data.
See Section 3.3 for more explanation on how the Average, Wet, and Dry water year
classifications were determined.
Sites that required filling included:

Page 33 of 68 April 8, 2008 PRRIP - Water Management Study, Phase I
• Roscoe Gage – Missing water years 1947 through 1982
• Korty Diversion – Missing fall months for water years 1955 through 1977
• Keystone Diversion – Missing fall and spring months from water years 1955
through 1977
• North Platte Hydro Return – Missing winter months for water year 1956 and fall
months for water years 1968, 1969 and 1977
• CNPPID Diversion at North Platte – Missing December 1989
• Jeffrey Return – Missing the fall through spring months with occasional summer
days for water years 1955 through 1977; winter months for water years 1978 and
1992; fall months water year 1993
• J-2 Return – Missing December 1989; days in July and August 2000
The first Program water to be routed through the system is that available from the
Tamarack I Project on the South Platte River, as measured below the Western Canal, and
an estimate of the required release from Lake McConaughy. The estimated release from
Lake McConaughy represents the volume of water that would be required from the EA
and Pathfinder Modification Project (PMP) (and other potential sources) in Lake
McConaughy combined.
The spreadsheet tracks Program water downstream to the Overton gage by incorporating
an order of operations in conjunction with the capacities, travel times, and losses. These
operations are similar for both the 5,000 cfs and the 800 cfs target flows. Operations for
Case I and Case II are, by the nature of the scenarios, different. Routing of water through
the river and Districts for Case I (Districts divert up to capacity) is done in the following
order:
1. Program water available at Korty (Tamarack I) is diverted subject to remaining
capacity in the Korty Diversion and Sutherland Canal. This Program water is
always diverted subject to available capacity first and the remaining Program
water is routed downstream to North Platte.

Page 34 of 68 April 8, 2008 PRRIP - Water Management Study, Phase I
2. Program water released from Lake McConaughy is diverted at the Keystone
Diversion subject to the remaining capacity at the diversion, ramping rates, and
remaining capacity in the Sutherland Canal below the junction of the Keystone
and Korty portions of the canal. The construct of this operation in the spreadsheet
is such that the release is a function of these constraints, travel times, and losses.
3. Program water released from Lake McConaughy not diverted at the Keystone
Diversion is routed downstream to North Platte subject to the capacity at the
“choke point” and channel ramping rates. The construct of this operation in the
spreadsheet is such that the release is a function of these constraints, travel times,
and losses.
4. Program water in the Sutherland Canal is returned to the South Platte River at
North Platte via the North Platte Hydro Return.
5. Program water in the North Platte and South Platte Rivers is added at the
confluence for a total combined flow of Program water.
6. Program water available at the CNPPID Diversion is diverted subject to the
remaining capacity. Remaining Program water in the river is routed downstream
to the Overton gage.
7. If selected by the user, Program water is returned to the Platte River via the
Jeffrey Return subject to remaining capacity for the Return. Program water is then
routed downstream to the Overton gage.
8. If re-regulation at Johnson Lake is selected, Program water is bypassed, stored, or
released to the J-2 Return. Program water is routed downstream to the Overton
gage.
9. Program water reaching the Overton gage is the sum of Program water at Brady,
Jeffrey Return, and J-2 Return subject to travel times and losses.
Routing of water through the river for Case II (Districts do not divert Program water) is
performed in the following order:
Page 35 of 68 April 8, 2008 PRRIP - Water Management Study, Phase I
1. Program water in the South Platte River (Tamarack I) is routed downstream to
North Platte (confluence).
2. Program water is released from Lake McConaughy to the North Platte River
subject to ramping rate limitations and remaining capacity at the North Platte
“choke point”.
3. Program water in the North Platte and South Platte Rivers is added at the
confluence for a total combined flow of Program water.
4. Program water is routed downstream from North Platte to Overton subject to
travel time and losses.
The routing tool is applied to each year of the study period for each the two target flows
and two cases. The spreadsheet is set up to evaluate one target and case combination,
resulting in four individual spreadsheets for each year of the study.
User input and evaluation is required to identify the operations and time period most
likely to achieve the target flow. The user is required to flag days for releases from Lake
McConaughy to meet the flow targets at Overton considering travel times, capacities, and
estimated start dates to accommodate ramping rates. More input is required by the user in
evaluating the 5,000 cfs target flow compared to the 800 cfs irrigation season target. This
is because the operations for the 800 cfs are simply turned on and the 5,000 cfs requires
identification of periods with capacity in the system and determination of necessary
operations.
The target period for the 5,000 cfs, Case I scenario is generally February, March, or April
to allow the use of the Johnson Lake reregulation storage. With this starting point, the
available capacity in the North Platte River at the choke point and the remaining capacity
in the J-2 Return typically determine the best target release period. The user must also
determine when and if to store, bypass, or release flows at Johnson Lake. In addition, to
supplement the peak flow from the J-2 Return, operation of the Jeffrey Return a day prior
to the anticipated peak flow is set by a user variable. Exceptions to these considerations
do occur as a result of the historical flow data used in the routing tool.
Page 36 of 68 April 8, 2008 PRRIP - Water Management Study, Phase I
In the scenario of a 5,000 cfs target and Case II, the maximum deliveries are governed by
the maximum remaining capacity at the North Platte River choke point. Periods identified
for this scenario range from November to April. The month of May is typically avoided
due to the higher loss factors applied during the irrigation season in the routing tool.
The 800 cfs target flow runs from May through September. The target period for the 800
cfs flow evaluated in this study is from May 1 to September 30. USFWS indicated that
the 800 cfs flow is intended to augment flows from May 11 to September 15 as outlined
in the Instream Flow Recommendations Document (see FWS Meeting Notes in Appendix
1). The difference in volume of the two durations is approximately 40,000 ac-ft at
Overton. The release from McConaughy is capped based on an estimated required release
determined by travel times and losses to Overton. The start date to meet the target flow
on May 1 varies from year to year subject to remaining capacities and ramping rates for
Case I. The Case II scenario relies solely on the capacity at the North Platte River choke
point, and also varies the start date subject to ramping rates on the North Platte River.
Output for each scenario includes the following summary:
• Total annual release from Lake McConaughy (EA water)
• Total EA water reaching Overton (including Tamarack I water)
• Peak EA water flow at Overton
• Peak 3-day volume of EA water at Overton (5,000 cfs target scenarios)
• Total number of days of EA flows at Overton greater than 5,000 cfs (5,000 cfs
target scenarios)
• Total number of days of total flows at Overton greater than 6,000 cfs (5,000 cfs
target scenarios)
• Total number of days of EA flows at Overton greater than 800 cfs (800 cfs target
scenarios)
• Total EA reaching Overton for May through September (800 cfs target scenarios)
Page 37 of 68 April 8, 2008 PRRIP - Water Management Study, Phase I
Additional results regarding shortages to target flows and days of operations are included
in the summary tables in Appendix 3.
3.8 Analysis of Routing Program Water to Overton
The routing tool was applied to both flow targets for Cases I and II for the entire 60 year
study period. Table 3-9 entitled, “Resulting Peak Flows for Target 5,000 cfs Case I and
Case II”, summarizes the results of targeting 5,000 cfs of Program water at Overton for
Average, Wet, and Dry year classifications. These results are average values for each
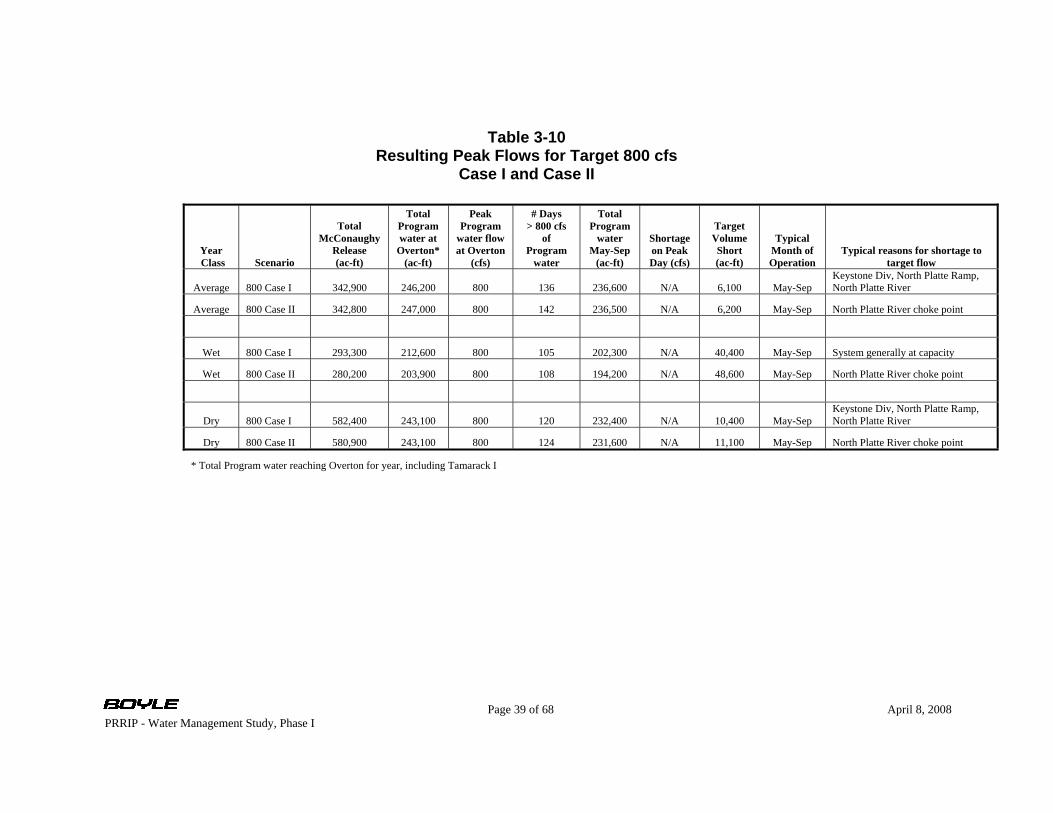
water year classification. Table 3-10 entitled, “Resulting Peak Flows for Target 800 cfs
Case I and Case II”, summarizes the results of targeting 800 cfs of Program water at
Overton for Average, Wet, and Dry year classifications. These results are average values
for each year classification.

Table 3-9 Resulting Peak Flows for Target 5,000 cfs
Case I and Case II
Year Class Scenario
Total McConaughy
Release (ac-ft)
Total Program water at
Overton*(ac-ft)
Peak Program
water flow at Overton
(cfs)
Peak 3-Day Total (ac-ft)
# Days > 5,000 cfs
of Program
water
# Days > 6,000 cfs
Total Flow
Shortage from 5,000
on Peak Day (cfs)
Target Volume Short (ac-ft)
Typical Month of Operation
Typical reasons for shortage to target flow
Average 5000 Case I 81,300 78,300 4,700 22,200 - 2 300 7,600 Apr Keystone Div, Sutherland Canal, North Platte Hydro, North Platte River
Average 5000 Case II 41,100 44,800 2,500 14,500 - 2 2,500 15,200 Dec, Jan, Feb, Apr North Platte River choke point
Wet 5000 Case I 71,600 70,600 3,800 19,100 - 41 1,200 10,700 Apr, Feb Keystone Div, Sutherland Canal, North Platte Hydro, North Platte River
Wet 5000 Case II 46,300 49,100 2,500 14,500 - 40 2,500 15,300 Dec, Jan, Feb, Apr North Platte River choke point
Dry 5000 Case I 99,900 91,500 5,200 24,300 1 - (200) 5,500 Apr Keystone Div, Sutherland Canal, North Platte Hydro, North Platte River
Dry 5000 Case II 42,800 44,600 2,500 14,600 - - 2,500 15,100 Apr North Platte River choke point
* Total Program water reaching Overton for year, including Tamarack I
Page 38 of 68 April 8, 2008 PRRIP - Water Management Study, Phase I
Year Class Scenario
Total McConaughy
Release (ac-ft)
Total Program water at
Overton* (ac-ft)
Peak Program
water flow at Overton
(cfs)
# Days > 800 cfs
of Program
water
Total Program
water May-Sep
(ac-ft)
Shortage on Peak Day (cfs)
Target Volume Short (ac-ft)
Typical Month of Operation
Typical reasons for shortage to target flow
Average 800 Case I 342,900 246,200 800 136 236,600 N/A 6,100 May-Sep Keystone Div, North Platte Ramp, North Platte River
Average 800 Case II 342,800 247,000 800 142 236,500 N/A 6,200 May-Sep North Platte River choke point
Wet 800 Case I 293,300 212,600 800 105 202,300 N/A 40,400 May-Sep System generally at capacity
Wet 800 Case II 280,200 203,900 800 108 194,200 N/A 48,600 May-Sep North Platte River choke point
Dry 800 Case I 582,400 243,100 800 120 232,400 N/A 10,400 May-Sep Keystone Div, North Platte Ramp, North Platte River
Dry 800 Case II 580,900 243,100 800 124 231,600 N/A 11,100 May-Sep North Platte River choke point
* Total Program water reaching Overton for year, including Tamarack I
Page 39 of 68 April 8, 2008 PRRIP - Water Management Study, Phase I
Table 3-10 Resulting Peak Flows for Target 800 cfs
Case I and Case II
Page 40 of 68 April 8, 2008
PRRIP - Water Management Study, Phase I
The results for each individual year are presented in Appendix 3. Appendix 3 presents the
total amount of Program water released from Lake McConaughy, the total Program water
reaching the Overton gage, the peak Program water delivery, and the period of release to
achieve the target flows.
The following results correspond to Table 3-9 and Appendix 3 for the target flow of
5,000 cfs of Program water for Cases I and II:
5,000 cfs Program water - Case I (Districts divert Program water):
• Pulse flows of 5,000 cfs of Program water are achieved for 19 of the 60 years of the
study period, about 1 in 3 years. However, peak flows in excess of 5,000 cfs occur
for only one day. The three day duration is not achieved. Of these 19 years, 10
occur in Average years and 9 occur in Dry years; the 5,000 cfs target is not
achieved in any of the Wet years of the study period.
• Average year classification- A peak flow of 5,000 cfs of Program water is
achievable in some years, for a duration of 1 day only, but on average is not met.
On average, the peak Program water flow at Overton is 4,700 cfs. The average
volume for the 3 day pulse flow is 22,200 ac-ft, and is 7,600 ac-ft less than the
target volume. This volume at Overton is achieved with a release from Lake
McConaughy of 81,300 ac-ft (in addition to a small volume of Tamarack I water).
• Wet years - A peak flow of 5,000 cfs of Program water is never achieved due to the
system being generally full. On average, the peak Program water flow at Overton is
3,800 cfs in these Wet years. The average volume for the 3 day pulse flow is 19,100
ac-ft, and is 10,700 ac-ft less than the target volume. This volume at Overton is
achieved with a release from Lake McConaughy of 71,600 ac-ft (in addition to a
small volume of Tamarack I water).
• Dry years - A peak flow of 5,000 cfs of Program water is achievable for 1 day in
some years, but not all years. On average, the peak Program water flow at Overton
is 5,200 cfs in these Dry years. The average volume for the 3 day pulse flow is
24,300 ac-ft, and is 5,500 ac-ft less than the target volume. This volume at Overton

Page 41 of 68 April 8, 2008
PRRIP - Water Management Study, Phase I
is achieved with a release of 99,900 ac-ft of water from Lake McConaughy (in
addition to a small volume of Tamarack I water).
• February and April are the typical months that the peak flow of Program water is
possible as a result of system capacity and the potential for reregulation in Johnson
Lake.
Shortages to the 5,000 cfs target flow occur for various reasons for Case I, including:
• North Platte River capacity at North Platte – The modeled capacity of 3,000 cfs at
this location on the North Platte limits the release to the river from Lake
McConaughy.
• Capacity and ramping rates of the Keystone Diversion, capacity in Sutherland
Canal, and capacity and ramping rates at the North Platte Hydro Return – the flow
diverted at the Keystone Diversion is influenced by the capacities and historical
flows at all three of these locations. On occasion, one, two, or all three can limit the
amount of Program water that can be returned to the South Platte River to
circumvent the choke point on the North Platte River.
• Regulating capacity in Johnson Lake, both volume and time of year per the “Bypass
Agreement” – Reregulation in Johnson Lake is limited to the months of February,
March, and April. There are situations when reregulation in other months may
better coincide with available historical system capacities. The limit of 4,000 ac-ft
of reregulation provides peaking flow typically for one day. The use of the Johnson
Lake reregulation to achieve the 5,000 cfs target is made when the remaining
capacity in the J-2 Return is the highest, and therefore consumes the reregulation
volume in about 1 day.
5,000 cfs Program water - Case II (Districts Bypass):
• In all 3 types of year classifications, Average, Wet, and Dry, the average peak
Program water reaching Overton is 2,500 cfs. The average volume for the 3 day
pulse flow is approximately 14,500 ac-ft. The shortage to the target volume ranges
from 15,100 ac-ft to 15,300 ac-ft on average for the target three-day period. These
Page 42 of 68 April 8, 2008
PRRIP - Water Management Study, Phase I
flows at Overton are achieved with a release from Lake McConaughy of ranging
from 41,100 ac-ft for Average years to 46,300 ac-ft in Wet years (in addition to a
small volume of Tamarack I water). The constraint to target flows in Case II is the
chokepoint capacity on the North Platte River at North Platte.
Figure 3-6 entitled, “Hydrographs for 5,000 cfs Program Water Targets”, illustrates the
results of routing Program water from Lake McConaughy and Tamarack I for
representative Average, Wet, and Dry year classifications for Cases I and II.
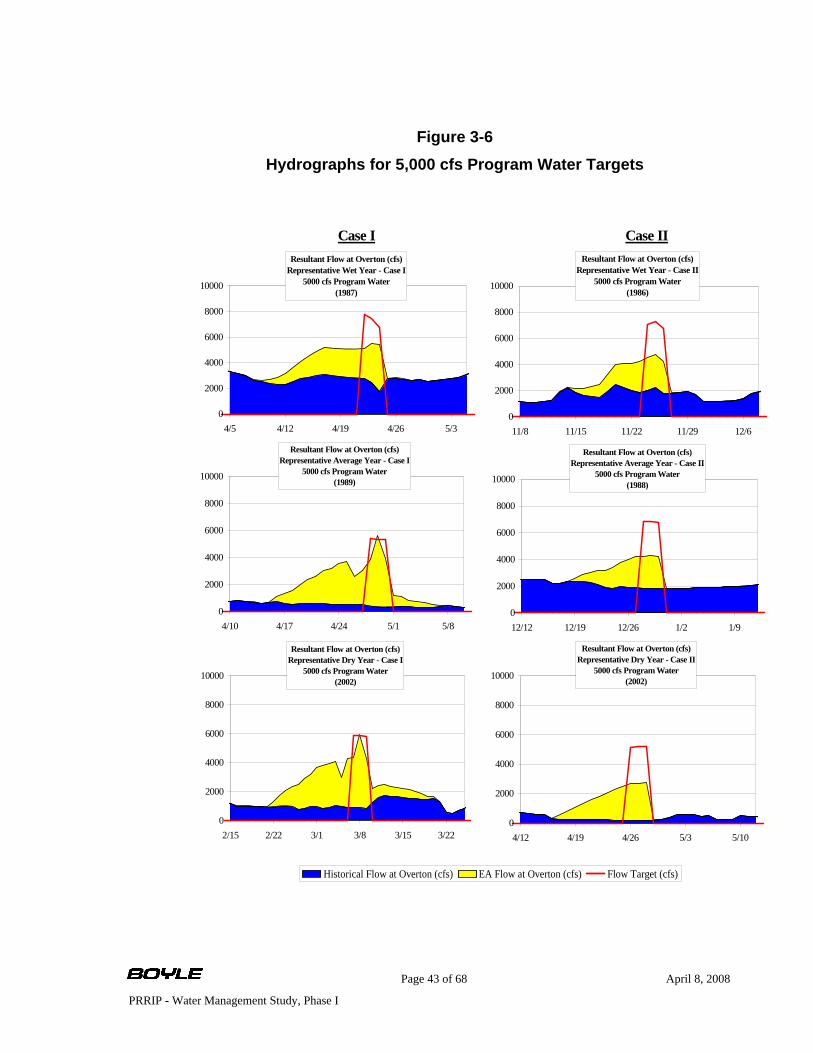
Figure 3-6 Hydrographs for 5,000 cfs Program Water Targets
Page 43 of 68 April 8, 2008
PRRIP - Water Management Study, Phase I
Historical Flow at Overton (cfs) EA Flow at Overton (cfs) Flow Target (cfs)
Case I Case IIResultant Flow at Overton (cfs)
Representative Wet Year - Case II5000 cfs Program Water
(1986)
0
2000
4000
6000
8000
10000
11/8 11/15 11/22 11/29 12/6
Resultant Flow at Overton (cfs)Representative Wet Year - Case I
5000 cfs Program Water(1987)
0
2000
4000
6000
8000
10000
4/5 4/12 4/19 4/26 5/3
Resultant Flow at Overton (cfs)Representative Average Year - Case I
5000 cfs Program Water(1989)
0
2000
4000
6000
8000
10000
4/10 4/17 4/24 5/1 5/8
Resultant Flow at Overton (cfs)Representative Average Year - Case II
5000 cfs Program Water(1988)
0
2000
4000
6000
8000
10000
12/12 12/19 12/26 1/2 1/9
Resultant Flow at Overton (cfs)Representative Dry Year - Case II
5000 cfs Program Water(2002)
0
2000
4000
6000
8000
10000
4/12 4/19 4/26 5/3 5/10
Resultant Flow at Overton (cfs)Representative Dry Year - Case I
5000 cfs Program Water(2002)
0
2000
4000
6000
8000
10000
2/15 2/22 3/1 3/8 3/15 3/22
Page 44 of 68 April 8, 2008
PRRIP - Water Management Study, Phase I
Flows in excess of 6,000 cfs (total flow) for 3 days in 2 out of every 3 years were also
analyzed for the 60 year period to quantify the number of occurrences of these flows and
to evaluate the contribution of the modeled EA releases. The number of days the flow at
Overton exceeds 6,000 cfs is summarized for each year in Appendix 3. The results of this
analysis are:
• Flows in excess of 6,000 cfs occur for durations of 3 days or more for 18 years of
the 60 year period (aggregating all year classifications). This is approximately
equal to 1 year in 3, in contrast to the target of 2 years in 3.
• Flows in excess of 6,000 occur 6 times in Average years, 12 times in Wet years,
and no times in Dry years.
• On occasion, EA water contributes to the flow in excess of 6,000 cfs. However,
the flow is never entirely EA water.
• Most occurrences of these target flows are a result of historical flows. The 3 days
or longer duration is always a result of historical events.
For the second flow objective, 800 cfs of Program water during the May through
September irrigation season, the following results correspond to Table 3-10 and
Appendix 3:
800 cfs Program water - Cases I and II:
The 800 cfs of Program water for May-September (153 days) is achievable on most days
for each year type assuming there were to be adequate EA water in storage at the start of
each year. Occasional shortages occur and vary in timing and magnitude among the six
scenarios (three year classifications and Cases I and II). The 800 cfs flow target equates
to a volume of Program water of about 243,000 ac-ft for the 153 day season from May 1
to September 30. (If based on the period of May 11 to September 15 as outlined in the
Instream Flow Recommendations, the volume is about 200,000 ac-ft). (Releases from
Lake McConaughy in an attempt to meet this target range from about 280,000 ac-ft in
Wet years (Case II), to about 580,000 ac-ft in Dry years (Case II), when losses are
highest. Part of the flow target is met by yields of the Tamarack I project on the South
Page 45 of 68 April 8, 2008
PRRIP - Water Management Study, Phase I
Platte, but these are small compared to the required release from Lake McConaughy.
Shortages occur on individual days due to system capacity constraints. Shortages are
typically a result of:
• North Platte River capacity at North Platte – The modeled capacity of 3,000 cfs at
this location on the North Platte limits the release to the river from Lake
McConaughy.
• North Platte River below Keystone ramping limitation – this ramping rate
typically limits releases from Lake McConaughy when diversions at Keystone are
changed based on downstream limits or historical operations.
• Capacity and ramping rates of the Keystone Diversion, capacity in Sutherland
Canal, and capacity and ramping rates at the North Platte Hydro Return – the flow
diverted at the Keystone Diversion is influenced by the capacities and historical
flows at all three of these locations. On occasion, one, two, or all three can limit
the amount of Program water able to return to the South Platte River,
circumventing the choke point on the North Platte River.
These limitations to target flows vary from year to year and within the same year being
analyzed.
There are instances during the irrigation season of some years when flows in the river
exceed flood stage limits due to historical flows. The occurrence of these events near the
downstream end of the system are difficult to incorporate into the release determination
for achieving the 800 cfs target. These events are infrequent and do not appear to
represent a significant impact on the volume of EA water released. Refinement of this
capacity limitation will potentially be addressed in Phase II as part of routing tool
refinements.
3.9 Recommendations for Further Evaluation of Capacities
It is recommended that a sensitivity analysis of certain limits and capacities included in
the routing tool be evaluated further in Phase II. During the routing analysis, insights
were developed regarding some of the more limiting constraints in achieving the target
Page 46 of 68 April 8, 2008
PRRIP - Water Management Study, Phase I
flow rates and volumes. Limits to achieving the target flows as described in Section 3.8
include physical capacities of the Districts’ systems, the North Platte choke point and the
reregulation capacity in Johnson Lake. Ramping rates, to some degree, impact the
achievable peak flow. Current ramping rates greatly affect the required volume of
Program water releases to achieve the pulse flow on both the rising and falling limbs of
the hydrograph. The following are recommendations for additional evaluation as part of
Phase II:
• North Platte choke point – The channel capacity at the North Platte choke point is
currently set at 3,000 cfs in the routing tool. This capacity is in anticipation of
channel improvements at this location. This capacity is a constraint to achieving a
pulse flow of 5,000 cfs of Program water for both Cases I and II.
• Johnson Lake reregulation operations – An increase in the available capacity and
relaxation of the timing of operations for the use of Johnson Lake reregulation
should be evaluated. Reregulation is currently allowed by the Bypass Agreement
to occur in the months of February, March, and April. In some years, there
appears to be additional available capacities elsewhere in the system, outside of
these months, that if combined with reregulation may achieve a higher pulse flow.
The available capacity for reregulation in Johnson Lake is limited to 4,000 ac-ft in
a year. This volume of water is able to contribute to the pulse flow for typically
one day via the J-2 Return. Additional capacity would provide additional volume
to extend the duration of the pulse flow.
• Ramping rates – An increase in the ramping rates are likely to reduce the required
volume of Program water to achieve the pulse flow, and to a limited degree the
steady summer flow targets. A sensitivity analysis of the ramping rates on the
North Platte below Keystone, Keystone Diversion ramp up and down limit, and
the North Platte Hydro Return is recommended.
• Canal capacities – If additional capacity in the NPPD system to circumvent the
North Platte choke point, or additional capacity in the CNPPID system to fill
Johnson Lake faster, were available, this might increase the ability to meet the

Page 47 of 68 April 8, 2008
PRRIP - Water Management Study, Phase I
pulse flow targets. However, due to the physical nature of the structures,
flexibility in these constraints is not anticipated. Further evaluation of the
sensitivity to canal capacities, if performed, should be based in part on input from
the Districts.
4.0 PROJECT ASSESSMENT
The Platte River Water Conservation/Supply Study (Boyle, 1999) and Reconnaissance-Level
Water Action Plan (Boyle, 2000) provided supporting information for the Governance
Committee to select a package of thirteen alternatives to reduce average annual shortages to
target flows by more than 60,000 ac-ft. The selection of projects considered: 1) yield at the
Critical Habitat; 2) up-front capital costs; 3) long-term operating costs; 4) legal and institutional
issues (e.g. the need for new authorizing legislation, state water rights administration and water
export constraints, maximum lease terms, NEPA compliance and site-specific environmental
permit requirements); 5) third-party impacts; and 6) implementation schedule. Table VI-1 of the
Water Action Plan presents “First Increment Unit Costs” (initial capital cost plus the present
worth of first 13 years of operation) ranging from $580 - $1,070 per ac-ft of yield at the critical
habitat (1999 price levels). Although the FEIS analysis arrived at estimates of water yield that,
in some cases, differ from the earlier estimates, the FEIS credits this combination of thirteen
“water elements” or projects with accomplishing the Program objectives based on the aggregate
yield of all the Governance Committee Alternative actions (FEIS, page 3-29). Per the
Governance Committee’s requirements for this study, this section: 1) reviews the 13 Water
Action Plan projects; and 2) identifies those projects that would likely be the most cost-effective
in reducing shortfalls to the Program water delivery objectives focusing on their individual and
combined ability to accomplish the 5,000 cfs and the 800 cfs flow criteria under three hydrologic
conditions (Average, Wet, and Dry years) and two water administration scenarios (Cases I and
II, without, and with, respectively, irrigation district bypasses of Program water).
The following project descriptions are summarized from the Program Water Plan. Information
from the interviews with Program participants will be used to revise project configurations and
operational scenarios in Phase II. References to reach numbers correspond to those described in
the Water Action Plan and the WMC Loss Model Update.
Page 48 of 68 April 8, 2008
PRRIP - Water Management Study, Phase I
4.1 CNPPID Regulating Reservoir
Nebraska indicated they are willing to consider a re-regulating reservoir(s) capable of
yielding an annual average of up to 8,000 ac-ft of target flow reductions at the critical
habitat, of which 4,000 to 5,500 ac-ft would be made available to the Program (Cook,
2000). The remaining portion of the yield will be retained by Nebraska to potentially
offset future depletions. Up to an average of 8,000 ac-ft/yr of target flow reductions could
be attained through a single re-regulating reservoir or a combination of reservoirs. The
six most promising re-regulating reservoir options evaluated in the Depletion Mitigation
Study Phase I conducted by HDR include:
• Option 1: Jeffrey Canyon Reservoir. Located south of Brady in Lincoln County
on the south side of the Central District Supply (Canal). Would be fed from Jeffrey
Reservoir. Capacity is estimated at 10,390 ac-ft.
• Option 2: Smith Canyon Reservoir. Located southwest of Gothenburg in Dawson
County on the south side of the Canal. Would be fed by water pumped from the Canal.
Capacity is estimated at 12,895 ac-ft.
• Options 3 & 4: Midway Lakes Reservoirs No. 2 and No. 5. Located south of
Willow Island in Dawson County on the south side of the Canal. Would be fed by water
pumped from the Canal. Capacities are estimated at 6,433 ac-ft and 11,429 ac-ft,
respectively.
• Option 5: North Plum Creek Reservoir. Located southeast of Cozad in Dawson
County on the north side of the Canal. Would be fed by water from the Canal. Capacity is
estimated at 2,320 ac-ft.
• Option 6: J-2 Forebay Reservoir. Located southeast of Lexington in Gosper
County in the Plum Creek basin, south of the J-2 Forebay on the south side of the Canal.
Would be gravity fed from the Canal. Capacity is estimated at 3,436 ac-ft.
Re-regulating reservoirs capture Platte River water beyond that required for irrigation
deliveries and mainstem instream flows during periods of excess flow at the critical
habitat. In general, water would be diverted from the Central District Supply Canal
Page 49 of 68 April 8, 2008
PRRIP - Water Management Study, Phase I
during periods of excess and released during periods of shortage at the critical habitat. In
the case of the Jeffrey Canyon and the J-2 Forebay Reservoirs, water would be supplied
from Jeffrey Reservoir and the J-2 Forebay, respectively, as opposed to the Canal.
CNPPID would re-regulate the flows in their system, in which case diversions will not be
increased or decreased, only return flows will change.
CNPPID has provided additional information on other potential storage sites that will be
evaluated as part of Phase II.
4.2 Water Leasing in Nebraska
Nebraska has not yet identified specific irrigation districts or individual farmers that are
willing to participate in a leasing program in conjunction with the Program. The
willingness to participate is also unknown at this time. Due to these conditions, a leasing
program was evaluated for Reaches 10 (Julesburg, CO gage to South Platte at North
Platte, Nebraska gage) and 14 through 19 (Keystone Diversion gage to Grand Island,
Nebraska gage). It was assumed that representative leasing projects are located at the
mid-point of each reach because specific irrigation districts and lands willing to
participate in the Program are not yet known. The reaches are defined as follows:
• Reach 10: Julesburg, CO gage to South Platte at North Platte, Nebraska gage
• Reach 14: Keystone Diversion gage to North Platte at North Platte, Nebraska
gage
• Reach 15: North Platte at North Platte, Nebraska, gage to Brady, Nebraska
gage
• Reach 16: Brady, Nebraska gage to Cozad, Nebraska gage
• Reach 17: Cozad, Nebraska gage to Overton, Nebraska gage
• Reach 18: Overton, Nebraska gage to Odessa, Nebraska gage
• Reach 19: Odessa, Nebraska gage to Grand Island, Nebraska gage

Page 50 of 68 April 8, 2008
PRRIP - Water Management Study, Phase I
In general, water would be leased from an irrigation district or farmer with storage rights
in Lake McConaughy. The reduction in consumptive use will likely be added to the EA
when storage space is available and released during times of shortage at the critical
habitat. The leasing program that has been analyzed considers leasing approximately
25,500 ac-ft annually, which corresponds to a reduction of approximately 17,000 ac-ft/yr
delivered on farm and a reduction in consumptive use of about 8,400 ac-ft/yr.
4.3 Nebraska Water Management Incentives (Conservation Cropping, Deficit Irrigation, Fallowing, and On-Farm Irrigation Changes)
Irrigation districts or individual farmers have not been identified that are willing to
participate in a water management program in conjunction with the Program. The
following options have been analyzed.
• Option 1: Conservation cropping in Reaches 16 through 19.
• Option 2: Deficit irrigation in Reaches 16 through 19.
• Option 3: Land fallowing in Reaches 10, and 14 through 19.
• Option 4: On-farm changes in irrigation techniques in Reaches 17 through 19.
These programs ideally would be located downstream, close to the critical habitat to
minimize difficulties associated with “protecting” the water. Because participating
irrigation districts and farmers are not yet known, it was assumed that representative
water management projects are located at the mid-point of each reach (same as the Water
Leasing in Nebraska).
Water management alternatives consist of programs resulting in reductions in
consumptive use, or in the case of on-farm changes in irrigation techniques, reductions in
the return flows that do not return to the Platte River above the critical habitat. An
irrigation district or farmer with storage rights in Lake McConaughy will be paid to
reduce their diversions through conservation cropping, deficit irrigation, land fallowing,
or changes in irrigation techniques. The reduction in consumptive use will likely be
added to the EA when storage space is available and released during times of shortage at
the critical habitat.

Page 51 of 68 April 8, 2008
PRRIP - Water Management Study, Phase I
The yield has been limited to surface water irrigation; however, if additional water
generated from these options is not protected, it may be institutionally easier to apply
these programs close to the critical habitat. In order to achieve the proposed yields below
Kearney, Nebraska these types of projects would also have to be applied to lands
irrigated with groundwater because there is not a sufficient amount of surface water
irrigation below Kearney to realize the proposed yield.
4.4 Groundwater Management in Nebraska
Potential groundwater management areas in Phelps and Kearney Counties are:
• 13,000-acre high groundwater table area bounded by the Phelps Canal to the
south and east, the Township 6 line to the north, and the Funk Odessa Road to the
west.
• 60 acre Reynold’s and Robb Wetland, located in Section 10, Township 8 North,
Range 21 West.
• 22,000 acres in Township 7 North, Ranges 18 and 19 West.
• 23,000 acres in Townships 6 and 7 North and Ranges 15, 16, and 17 West.
Options that could be implemented for groundwater management are described below.
• Option 1: Active Groundwater Pumping from High Groundwater Areas
• Option 2: Passive Lowering of the Groundwater Table
• Option 3: Groundwater Irrigation
• Option 4: Conjunctive Use
Groundwater management has been limited to a total yield no more than 6,000 ac-ft/yr.
Nebraska has indicated they will not consider expanding groundwater management
unless further investigation and study reveals that higher yields can be sustained.
Nebraska also intends to reserve as much of the yield necessary to offset new depletions
in that state. However, Nebraska currently estimates that 1,400 ac-ft/yr of the yield of this
project (of the 6,000 ac-ft/yr potential) would be in addition to that needed for new
Page 52 of 68 April 8, 2008
PRRIP - Water Management Study, Phase I
depletion offset and therefore could be made available to the Program.
Changes in the status of the groundwater mound will be addressed as part of Phase II.
4.5 Dry Creek/Fort Kearny Cutoffs
There are two Dry Creek/Ft. Kearny Cutoffs projects within Tri-Basin Natural Resources
District and within the area influenced by the groundwater mound:
• Option 1: Lost Creek/North Dry Creek Cutoff located south of Kearney in
Sections 9 and 16, Township 7 North, Range 16 West.
• Option 2: Lost Creek/Ft. Kearny Cutoff located south of Kearney in Sections 1
and 12 of Township 7 North, Range 16 West.
The projects would be operated to return existing flows in Lost Creek or releases from
the Funk Lagoon to the Platte River. These cutoffs could also be operated similar to
active pumping from the groundwater mound. This project consists of the construction of
a ¾ mile long canal connecting Lost Creek to the Fort Kearny Improvement Project Area
(IPA), allowing increased flow through approximately 20 miles of the critical habitat. A
pump station located along Crooked Creek may be necessary to expand this project in the
vicinity of Lost Creek.
The potential yields from active pumping were not included for these two cutoff projects
since the yields were included under the groundwater management option. If active
pumping were included with the cutoff projects, well(s) could be installed in high
groundwater areas to pump water into Lost Creek during periods of target flow shortage.
4.6 Dawson and Gothenburg Canal Groundwater Recharge
The Dawson and Gothenburg Canals are both located on the north side of the Platte River
primarily in Dawson County. The Gothenburg Canal headgate is located approximately
eight miles upstream of Gothenburg, Nebraska. The Dawson Canal headgate is located
near Cozad, Nebraska.
Recharge projects under the Dawson and Gothenburg Canals would involve diverting
surface water directly from the Platte River into these canals during the non-irrigation

Page 53 of 68 April 8, 2008
PRRIP - Water Management Study, Phase I
season. Canal seepage would percolate into the alluvium and recharge the groundwater
aquifer. Excess water that is not recharged would be returned to the river via spillways
within the same month. Return flows that result from canal seepage would accrue to the
river for some duration after the recharge event. Diversions should be possible
throughout the non-irrigation season if there is enough hydraulic head in the canals to
maintain flow velocities that prevent freezing; however, the potential of winter diversions
will require additional analysis.
Another option is to check-up the canals to enhance recharge. This would create a
recharge basin along the canal, which may help achieve the same recharge with less
diversion. Wells and/or drains could also be used to enhance recharge by lowering areas
of high groundwater in the vicinity of the canal. Yields could also be realized sooner if
these projects are operated as conjunctive use projects. During late fall and winter, flows
that exceed target flows could be diverted into the Gothenburg and Dawson Canals for
recharge to the local aquifer. During spring and summer months, an equivalent amount of
water could be pumped for irrigation. Pumping during the irrigation season would replace
irrigation releases from Lake McConaughy.
The total potential yield associated with these projects is estimated to be 2,600 ac-ft/yr.
Nebraska is reserving 800 ac-ft of that yield to offset future depletions; therefore,
approximately 1,800 ac-ft/yr is available to the Program (Jim Cook, Nebraska Natural
Resources Commission, June 28, 2000 memo).
4.7 Central Platte Power Interference
A power interference project would operate primarily at CNPPID’s Kingsley Dam
Hydro, the two Johnson Hydros and Jeffrey Hydro in conjunction with the Lake
McConaughy EA. The NPPD Sutherland System and North Platte Hydro facility would
also be involved as NPPD and CNPPID power generation operations are closely related.
In general, Lake McConaughy releases would be scaled back during times of excess at
the critical habitat. The “excess” flow could be stored in the EA to be released at a later
time when planned releases and downstream river gains do not meet instream flow
recommendations. When the water is subsequently released, it may or may not be
Page 54 of 68 April 8, 2008
PRRIP - Water Management Study, Phase I
available for diversion and routing through the district’s hydro facilities.
Nebraska intends to reserve as much of the yield of this project as necessary to offset new
depletions in that state; however, they estimate that 1,400 ac-ft/yr of the yield of this
project could be made available to the Program. A power interference project entails
monetary payment to a hydroelectric generator in order to modify the release of water
through the hydropower turbines. This might include a change in the timing of generation
or a bypass of the turbines to reduce target flow shortages at the critical habitat. The two
Johnson and Jeffrey units are owned by CNPPID, which has expressed an interest in a
power interference compensation program. Any change to CNPPID operation also affects
NPPD operations.
4.8 Net Controllable Conserved Water by CNPPID
Net controllable conserved water resulted from actions taken by CNPPID to comply with
the agreement with the National Wildlife Federation to provide reductions in average
annual diversions of surface water. The net controllable conserved water resulting from a
grant from the Bureau of Reclamation will be added to the EA at no cost to the Program;
however that water not attributed to a grant will be provided to the Program at the
average cost of the conservation activities.
Three categories of water conservation measures were implemented to reduce losses in
the system and irrigation efficiencies:
• Reservoirs – Water conservation alternative developed for Elwood Reservoir that
revised the fill/release operations to minimize seepage.
• Canal distribution and delivery system – Installation of pipelines, earth
compaction, membrane lining, canal structures, structure automation and turnout
relocation.
• On-farm irrigation – System improvements, such as installation of center pivots,
gated pipes, flow meters, and surge valves, or management improvements, such as
irrigation scheduling, adjustments to irrigation set times, and alternate furrow irrigation.
CNPPID revised the estimate of net controllable conserved water in 2003 (CNPPID,
Page 55 of 68 April 8, 2008
PRRIP - Water Management Study, Phase I
2003). The results of the revised analysis estimate a total savings of approximately
10,900 ac-ft/yr. Of the total conserved water, 314 ac-ft/yr is attributable to USBR funds
and will be directly contributed to the EA. The balance of the net controllable conserved
water will be made available to the Program at the average total cost to achieve the
conservation savings (CNPPID, 2003). If the State of Nebraska chooses to retain one half
of the yield to offset future depletions (consistent with the Water Action Plan) the yield
available would be one half of 10,900 ac-ft, or 5,450 ac-ft.
4.9 Pathfinder Modification Municipal Account (Wyoming)
Pathfinder Dam is located on the North Platte River about three miles below the
confluence with the Sweetwater River and about 47 miles southwest of Casper,
Wyoming.
The Pathfinder Modification Stipulation increased the capacity of the existing Pathfinder
Reservoir by approximately 54,000 ac-ft. The Pathfinder Modification Project will serve
both environmental and municipal uses. An environmental account of 34,000 ac-ft will be
operated for the endangered species and habitat in Central Nebraska in accordance with
certain conditions. A municipal account of 20,000 ac-ft will provide municipal water to
North Platte communities in Wyoming, operated by the Bureau of Reclamation,
providing an annual estimated firm yield of 9,600 ac-ft. The remaining balance is
available to Wyoming for the benefit of the endangered species in the critical habitat in
any year that the municipal demand is low. The delivery of water contributed from the
municipal account would be considered in addition to the storage and delivery of water
from the Pathfinder environmental account.
The amount of water available to the Program is dependent on the amount needed to
supplement municipal water rights and/or mitigate excess depletions and cannot exceed
the firm yield in any year. Wyoming anticipates that 4,800 ac-ft of storage water from the
municipal account could be available for lease to the Program on an average annual basis
(Wyoming’s December 16, 1999 proposal). The amount available to the Program will
vary on a year-to-year basis depending on Wyoming’s needs. In some years no water
from this account will be available to the Program, whereas, in other years, up to 9,600
Page 56 of 68 April 8, 2008
PRRIP - Water Management Study, Phase I
ac-ft could be available to the Program.
4.10 Glendo Storage (Wyoming)
Glendo Dam is located on the North Platte River about 4.5 miles southeast of the town of
Glendo, Wyoming upstream of Guernsey Reservoir.
The 1953 Order Modifying and Supplementing the North Platte Decree (1953 Order)
provides for the storage of 40,000 ac-ft in Glendo Reservoir during any water year for the
irrigation of lands in western Nebraska and in southeastern Wyoming below Guernsey
Reservoir. Of the 40,000 ac-ft available for irrigation, 25,000 ac-ft is allocated for the
irrigation of lands in western Nebraska and 15,000 ac-ft of storage is for the irrigation of
lands in southeastern Wyoming.
A recent amendment of the 1953 Order, the Glendo Stipulation, relaxes the conditional
use of Glendo storage water. Significant changes include:
• Use expanded to municipal, industrial, and other.
• The service area expanded from the North Platte River basin to the Platte River
basin.
• Use expanded to fish and wildlife downstream of Glendo Reservoir.
Of the 15,000 ac-ft of Glendo storage water allocated to Wyoming, there are permanent
contracts for 4,400 ac-ft. The remaining 10,600 ac-ft is leased by the Bureau of
Reclamation under temporary water service contracts for up to one year. Wyoming is
considering negotiating a permanent contract with the Bureau of Reclamation for all of
the remaining 10,600 ac-ft of storage. Water in excess of that needed to meet Wyoming’s
contracted demands and replace their potential excess depletions would be available to
the Program at an estimated 2,650 ac-ft on an average annual basis (Wyoming’s
December 16, 1999 proposal). Because the average annual amount that would be moved
from Glendo Reservoir to the Lake McConaughy EA is relatively small, the EA manager
may choose to move all of the water downstream during the month of September to
minimize conveyance losses.
Page 57 of 68 April 8, 2008
PRRIP - Water Management Study, Phase I
4.11 Temporary Water Leasing in Wyoming
A temporary water leasing program was evaluated for Reaches 1 through 4 and Reach 6.
It is assumed that leasing projects are located at the mid-point of each reach because
specific irrigation districts and landowners willing to participate in the Program are not
yet known. The reaches are:
• Reach 1: Northgate, CO gage to Sinclair, WY gage
• Reach 2: Sinclair, WY gage to Alcova, WY gage
• Reach 3: Alcova, WY gage to Orin, WY gage
• Reach 4: Orin, WY gage to Passing Whalen Diversion Dam gage
• Reach 6: Laramie River below Grayrocks Reservoir gage to Fort Laramie,
WY gage
A voluntary temporary water leasing program would provide incentives to farmers to
annually lease water supplies that would otherwise have been used in irrigation. The
irrigation districts or farmers would not relinquish ownership of their water rights. The
amount of water available to the Program consists of the reduction in consumptive use,
which is reviewed and approved by the State Engineer or Board of Control, as provided
by Wyoming law. The program evaluated assumes that leased water rights are dependent
on storage rights. Although it may be feasible to lease natural flow water rights, it will be
more difficult to insure protection from downstream water users. To provide maximum
flexibility, the mix of farms participating in the leasing program would be allowed to
change over time and the length of the temporary lease allowed to vary based on the
needs of the irrigation district or farmer.
The leasing program that has been analyzed considers leasing approximately 22,700 ac-ft
of water supplies annually, which corresponds to about 16,400 ac-ft delivered on farm
and 8,200 ac-ft of historic consumptive use.
Page 58 of 68 April 8, 2008
PRRIP - Water Management Study, Phase I
4.12 La Prele Reservoir (Wyoming)
La Prele Reservoir is an existing irrigation and industrial supply reservoir in Wyoming
located on La Prele Creek approximately 13 miles upstream of the confluence with the
North Platte River. The confluence of La Prele Creek and the North Platte River is
approximately 115 miles downstream of the Alcova gage.
The current capacity of the La Prele Reservoir is 20,000 ac-ft and is permitted for
irrigation, domestic and industrial uses. In 1974 an agreement was made between the
Douglas Water Users Association (Association) and the Panhandle Eastern Pipeline
Company (PEPL) to rehabilitate the reservoir. The terms of the agreement provided that
PEPL buy 5,000 ac-ft of storage space at the price equivalent to the principal and interest
of a loan which was used to rehabilitate the reservoir and associated ditches.
This analysis assumes that PEPL’s 5,000 ac-ft storage right in La Prele Reservoir is
available for lease by the Program. PEPL’s share of space in La Prele Reservoir is limited
by the yield of its share and the conditions under which it may be put to beneficial use in
the context of the Program.
4.13 Groundwater Management – Tamarack III
An expanded Tamarack project (Tamarack Phase III) will likely be located along the
south side of the South Platte River in the Tamarack Ranch State Wildlife Area (SWA)
and the Pony Express SWA, which is 40 miles upstream from the Colorado/Nebraska
state line. Expanded recharge is also being considered for the Peterson and South
Reservation Ditches, which divert from the South Platte River just downstream of
Sedgwick, Colorado.
Colorado has proposed Tamarack Phase III in order to provide water to the Program. An
expanded Tamarack project involves diverting surface water directly from the South
Platte River via canals or wells located adjacent to the river. Water that is diverted or
pumped is conveyed to recharge sites at various distances from the river where it is
allowed to percolate into the alluvium for recharge of the groundwater aquifer. Return
Page 59 of 68 April 8, 2008
PRRIP - Water Management Study, Phase I
flows that result from such recharge accrue to the river for some duration after the
recharge event depending on the hydrogeologic conditions and the distance from the site
to the river. Colorado is considering sites with SDF factors ranging from 60 days to 300
days.
The Beebe Draw project was removed from the analysis. As a replacement, the yield
associated with the Beebe Draw project will be provided by further expansion of
Tamarack Phase III. The expanded Tamarack project is expected to reduce target flow
shortages by an average of 17,000 ac-ft/yr. The facilities required for an expanded
Tamarack Project include wells located adjacent to the South Platte River and existing
canals that divert water from the South Platte River, including the Peterson and South
Reservation Canals. Excess accretion credits associated with current ditch recharge
programs that are not needed for well augmentation will also be targeted for Tamarack
Phase I and Phase III.
4.14 Cost Effectiveness
The 13 projects described above are reviewed in relation to their abilities, individually
and in combinations, to contribute to the flow objectives of: 1) 5,000 cfs of Program
water for three days at the Overton gage when river channel and irrigation system
capacity is generally high and 2) a steady 800 cfs flow of Program water at the Overton
gage during the irrigation season (May 1 through September 30).
Under the first objective, consideration was given to supplementing existing flows to
achieve at least 6,000 cfs in total flow (Program and non-Program water) at Overton in
two out of three years. A project’s contributions to achieving the flow targets are affected
by: 1) the ability to control flows on a daily basis and thereby compliment flows of non-
Program and other EA releases from Lake McConaughy and 2) the daily-varying
remaining capacities at key points in the Platte River channels and in the irrigation
systems upstream of the Overton gage.
Table 4-1 entitled “ Project Summary”, presents the 13 previously identified projects,
their estimated yield (average annual reductions to target flow shortages at the critical
habitat), and the estimated unit cost of that yield in 1999 price levels (from Table VI-1 of
Page 60 of 68 April 8, 2008
PRRIP - Water Management Study, Phase I
the Water Action Plan). The table also shows the maximum one-day and three-day
contributions that each Project could make toward the 5,000 cfs flow target if the Project
could be operated such that the entire annual yield could be delivered to the Overton gage
instantaneously, without transit losses, and without conveyance capacity or ramping
constraints. The maximum flow rate that could result if all these Projects were on-line
simultaneously and operating under these perfect conditions is about 10,000 cfs or
approximately double the target rate of 5,000 cfs. Table 4-1 also shows whether the
Projects are capable of controlling releases on a daily basis to contribute to the pulse
flows, where the Projects would potentially deliver water to the river and irrigation
systems or to storage and the travel times for the flows to reach the Overton gage. Of the
13 Projects identified previously, up to 11 could provide flows manageable on a daily
basis, if suitable arrangements can be made to deliver the project yield into either the EA
or into new or existing storage along the CNPPID’s system. Table 4-1 also shows the
limited capability of the Projects to meet the 800 cfs irrigation season targets. If all 13
Projects are used solely to meet this objective and there are no transit losses or flow
constraints the entire yield of the projects could contribute only about 210 cfs of the 800
cfs target. The precise timing needed to provide Program water to compliment other
flows is discussed in the previous section. A 5,000 cfs flow for a three-day duration is
equivalent to a volume of 29,800 ac-ft almost half of the total average annual storage
reduction identified in the Water Action Plan. An 800 cfs flow for the irrigation season
(153 days) is about 243,000 ac-ft or 3.8 times the average annual shortage reduction
identified in the Water Action Plan. The Water Action Plan states, “As more in-depth
analyses of the project yields and costs are completed, the Governance Committee may
choose to replace projects in the Water Action Plan with alternative projects. Each state
has expressed its desire to reserve the right to add or remove projects from consideration
in the future if an issue arises that cannot be resolved. Circumstances that might result in
a project being added to the Water Action Plan include insufficient yield to meet the
water goals of the program. A project can be removed from the Water Action Plan if the
project is not implementable within the first increment (13 years), generates significantly
less yield than was anticipated, is too expensive, is unacceptable to the Governance
Page 61 of 68 April 8, 2008
PRRIP - Water Management Study, Phase I
Committee for other reasons, or if an agreement cannot be negotiated with the project
sponsor. New projects may or may not require a supplement to the Programmatic FEIS.
Elements of the Water Action Plan will be subject to site specific National Environmental
Policy Act (NEPA) and ESA review as appropriate.” (PPRCA 2000).
Modeling results show that for these projects to be effective in meeting the timing of the
pulse flow, the water will need to be managed on a daily basis. Work in Phase II will
refine the ability to move water into the EA and also to provide water closer to the
Critical Habitat.
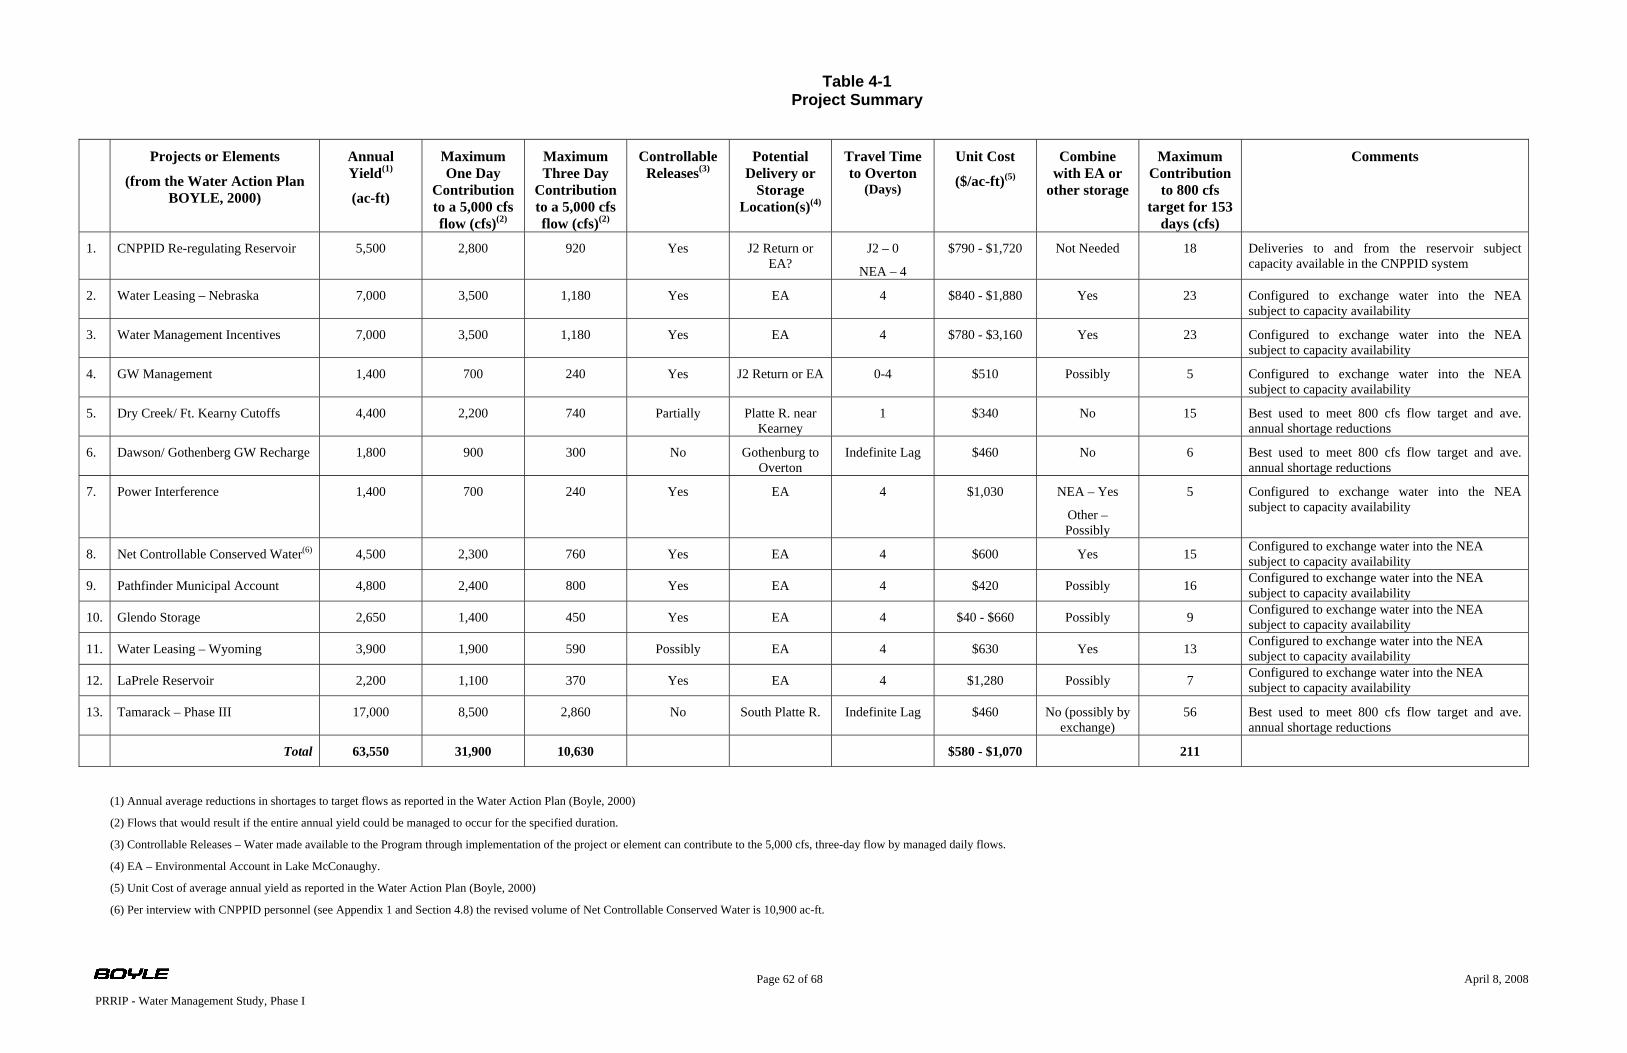
Page 62 of 68 April 8, 2008
PRRIP - Water Management Study, Phase I
Table 4-1 Project Summary
(1) Annual average reductions in shortages to target flows as reported in the Water Action Plan (Boyle, 2000)
(2) Flows that would result if the entire annual yield could be managed to occur for the specified duration.
(3) Controllable Releases – Water made available to the Program through implementation of the project or element can contribute to the 5,000 cfs, three-day flow by managed daily flows.
(4) EA – Environmental Account in Lake McConaughy.
(5) Unit Cost of average annual yield as reported in the Water Action Plan (Boyle, 2000)
(6) Per interview with CNPPID personnel (see Appendix 1 and Section 4.8) the revised volume of Net Controllable Conserved Water is 10,900 ac-ft.
Projects or Elements
(from the Water Action Plan BOYLE, 2000)
Annual Yield(1)
(ac-ft)
Maximum One Day
Contribution to a 5,000 cfs flow (cfs)(2)
Maximum Three Day
Contribution to a 5,000 cfs flow (cfs)(2)
Controllable Releases(3)
Potential Delivery or
Storage Location(s)(4)
Travel Time to Overton
(Days)
Unit Cost
($/ac-ft)(5)
Combine with EA or
other storage
Maximum Contribution
to 800 cfs target for 153
days (cfs)
Comments
1. CNPPID Re-regulating Reservoir 5,500 2,800 920 Yes J2 Return or EA?
J2 – 0
NEA – 4
$790 - $1,720 Not Needed 18 Deliveries to and from the reservoir subject capacity available in the CNPPID system
2. Water Leasing – Nebraska 7,000 3,500 1,180 Yes EA 4 $840 - $1,880 Yes 23 Configured to exchange water into the NEA subject to capacity availability
3. Water Management Incentives 7,000 3,500 1,180 Yes EA 4 $780 - $3,160 Yes 23 Configured to exchange water into the NEA subject to capacity availability
4. GW Management 1,400 700 240 Yes J2 Return or EA 0-4 $510 Possibly 5 Configured to exchange water into the NEA subject to capacity availability
5. Dry Creek/ Ft. Kearny Cutoffs 4,400 2,200 740 Partially Platte R. near Kearney
1 $340 No 15 Best used to meet 800 cfs flow target and ave. annual shortage reductions
6. Dawson/ Gothenberg GW Recharge 1,800 900 300 No Gothenburg to Overton
Indefinite Lag $460 No 6 Best used to meet 800 cfs flow target and ave. annual shortage reductions
7. Power Interference 1,400 700 240 Yes EA 4 $1,030 NEA – Yes
Other – Possibly
5 Configured to exchange water into the NEA subject to capacity availability
8. Net Controllable Conserved Water(6) 4,500 2,300 760 Yes EA 4 $600 Yes 15 Configured to exchange water into the NEA subject to capacity availability
9. Pathfinder Municipal Account 4,800 2,400 800 Yes EA 4 $420 Possibly 16 Configured to exchange water into the NEA subject to capacity availability
10. Glendo Storage 2,650 1,400 450 Yes EA 4 $40 - $660 Possibly 9 Configured to exchange water into the NEA subject to capacity availability
11. Water Leasing – Wyoming 3,900 1,900 590 Possibly EA 4 $630 Yes 13 Configured to exchange water into the NEA subject to capacity availability
12. LaPrele Reservoir 2,200 1,100 370 Yes EA 4 $1,280 Possibly 7 Configured to exchange water into the NEA subject to capacity availability
13. Tamarack – Phase III 17,000 8,500 2,860 No South Platte R. Indefinite Lag $460 No (possibly by exchange)
56 Best used to meet 800 cfs flow target and ave. annual shortage reductions
Total 63,550 31,900 10,630 $580 - $1,070 211
Page 63 of 68 April 8, 2008
PRRIP - Water Management Study, Phase I
5.0 CONCLUSIONS AND RECOMMENDATIONS
Phase I of the WMS evaluated the ability to provide pulse flows of 5,000 cfs of Program
water (during low-use periods) and deliveries of 800 cfs of Program water (during the
irrigation season) on the Platte River to the gage at Overton, NE. The occurrences of total
flow greater than 6,000 cfs were also evaluated. Environmental Account (EA) releases from
Lake McConaughy and managed return flows from the Tamarack I Project on the South
Platte River in Colorado comprised the sources of Program water. Flow capacities of the
Districts’ systems and in the North Platte River constrain the delivery of Program water to
achieve the target flows. The 5,000 cfs target for Program water is met in some years for a
single day, but not for the preferred three day duration. The 800 cfs target flow could be met
on most days, but would require a significant volume of Program water (more than 200,000
to 240,000 ac-ft at Overton depending on the definition of the target period).
The thirteen projects identified in the Water Action Plan and the potential of each to
contribute to the flow targets were also characterized as part of Phase I. Results from the
routing analyses demonstrate that to be effective in meeting the pulse flow targets, the water
from these projects will need to be managed either in Lake McConaughy or with other
existing or new storage facilities near the Critical Habitat.
The following expands on the main conclusions and presents recommendations for
consideration by the Governance Committee for Phase II of the Water Management Study or
other future efforts.
5.1 Conclusions
• 5,000 cfs Program water - Case I (Districts divert Program water):
o Pulse flows of 5,000 cfs of Program water can be achieved about every 1 in 3
years, but only for one day of the three day target duration. The 5,000 cfs is
not achieved in any of the Wet years of the study period.
o The required volume of EA water necessary to be released from Lake
McConaughy (from the current and potential projects) is significant for each
water year classification in Case I. The average release of EA water is
Page 64 of 68 April 8, 2008
PRRIP - Water Management Study, Phase I
approximately 72,000 ac-ft in Wet years to nearly 100,000 ac-ft in Dry years
to achieve average peak Program water flows ranging from 3,800 cfs to 5,200
cfs for one day.
o Shortages to the 5,000 cfs target flow occur for various reasons for Case I,
including:
North Platte River capacity at North Platte
Capacity and ramping rates of the Keystone Diversion, capacity in
Sutherland Canal, and capacity and ramping rates at the North Platte
Hydro Return
Regulating capacity in Johnson Lake, both volume and time of year per
the “Bypass Agreement”
• 5,000 cfs Program water - Case II (Districts Bypass):
o The average peak flow of Program water reaching Overton is 2,500 cfs for
Average, Wet, and Dry years. The average volume for the 3 day pulse flow is
approximately 14,500 ac-ft, approximately half of the target three-day
volume.
o The required volume of EA releases range from 41,000 ac-ft in average years
to 46,300 ac-ft in wet years.
o The constraint to target flows in Case II is the choke point capacity on the
North Platte River at North Platte.
• 6,000 cfs for 3 days at Overton:
Flows in excess of 6,000 cfs occur for durations of 3 days or more
approximately 1 in 3 years, in contrast to the goal of 2 in 3 years.
On occasion, EA water contributes to the flow in excess of 6,000 cfs.
However, the flow is never entirely EA water. Most occurrences of these
target flows are a result of historical flows.
Page 65 of 68 April 8, 2008
PRRIP - Water Management Study, Phase I
• 800 cfs Program water - Cases I and II:
o The 800 cfs of Program water for May-September is achievable on most days
for each year type assuming there were to be adequate EA water in storage at
the start of each year. The 800 cfs flow target equates to a volume of Program
water of about 200,000 to 240,000 ac-ft per season, depending on the duration
(given either a May 1 or May 11 start date through September 15 or
September 30). Releases from Lake McConaughy, in an attempt to meet this
target, range from about 280,000 ac-ft in Wet years (Case II), to about
580,000 ac-ft in Dry years (Case II), when losses are highest. Part of the flow
target is met by yields of the Tamarack I project on the South Platte, but these
are small compared to the required release from Lake McConaughy.
o Shortages occur on individual days due to system capacity constraints.
Shortages are typically a result of:
North Platte River capacity at North Platte
North Platte River below Keystone ramping limitation
Capacity and ramping rates of the Keystone Diversion, capacity in
Sutherland Canal, and capacity and ramping rates at the North Platte
Hydro Return
• Assessment of the 13 Water Action Plan Projects:
o The maximum flow rate that could result if all thirteen of these Projects were
on-line simultaneously and operating under perfect conditions is about 10,000
cfs or approximately double the target rate of 5,000 cfs.
o If all thirteen Projects are used solely to meet the 800 cfs objective and there
are no transit losses or flow constraints, the entire yield of the projects could
contribute only about 210 cfs of the 800 cfs target (250 cfs if the effective
period is May 11 to September 15).
o Of the 13 Projects identified previously, up to 11 could provide flows
Page 66 of 68 April 8, 2008
PRRIP - Water Management Study, Phase I
manageable on a daily basis, if suitable arrangements can be made to deliver
or exchange the project yield into either the EA or into new or existing storage
along the CNPPID’s system. Modeling results show that for these projects to
be effective in meeting the timing of the pulse flow, the water will need to be
managed either in Lake McConaughy or by other managed capacities to allow
for a timed release.
5.2 Recommendations and Key Issues for Further Analysis
• The routing tool was developed with the ability to adjust system constraints and
for sensitivity analyses. With input from the Governance Committee on which
constraints to evaluate, the ability to meet flow targets and the estimated volume
of EA water required to meet the flow targets in the WMS should be refined. It is
recommended the following limitations be evaluated in the sensitivity analysis:
the capacity at the North Platte choke point, Johnson Lake reregulation capacity,
and ramping rates for the North Platte River, Keystone Diversion, and North
Platte Hydro Return.
• The routing tool was developed to facilitate the evaluation of 60 years of data for
four different scenarios while minimizing user input and reporting essential values
for this study. Further refinement in the input, output, and flexibility of operations
will benefit Phase II of the WMS.
• The development on the daily loss rates and travel times were developed on an
empirical basis from historic events. These estimates should be refined based on
monitoring planned releases at strategic points in the system.
• The routing tool is currently based on losses and travel times in canals being equal
to those of the river channel. If the potential for water savings or shorter travel
times exists, further investigation of the differences of the two systems should be
considered.
• Flood stages for the Platte River reaches were estimated based on readily
available information from the National Weather Service, and the most recent
Page 67 of 68 April 8, 2008
PRRIP - Water Management Study, Phase I
rating curve available for individual gage locations. Areas of greater uncertainty,
or of more significant impact, should be refined in determining the limitations to a
pulse flow. The presence of development, vegetation, or debris build up in areas
of potential flooding warrant further analysis. The capacities at Brady, Cozad, and
Overton should be evaluated further. If the current estimates of flood stage are
overstated these locations could potentially be choke points to the goal of the
pulse flow.
• The additional evaluation of the thirteen alternatives and additional alternatives in
Phase II are likely to focus on how to place water in the EA in Lake McConaughy
or other management opportunities in addition to projects closer to the Critical
Habitat.
• There is a potential for use of District(s) deliveries to increase flows during short-
duration rainfall events instead of curtailing irrigation deliveries during low
demand periods. If District water is used in this fashion, the volume of water
used to enhance the pulse flow would need to be determined, and a like amount
from the EA would be assigned to the District(s) shortly thereafter. This type of
exchange could help with the routing issue and enhance pulse flows. This
potential operation requires further analysis in Phase II.
6.0 REFERENCES
Boyle Engineering Corporation, Water Conservation/Supply Reconnaissance Study,
Governance Committee of the Cooperative Agreement for Platte River Research,
December 1999
Boyle Engineering Corporation, Reconnaissance-Level Water Action Plan, Governance
Committee of the Cooperative Agreement for Platte River Research, 2000
CNPPID, Supplement, Estimate of Net Controllable Conserved Water, July 14, 2003
Cook, Jim, Nebraska Natural Resource's Commission memo, June 28, 2000
HDR Engineering, Inc., Depletion Mitigation Study Phase I, March 20, 2000
Page 68 of 68 April 8, 2008
PRRIP - Water Management Study, Phase I
National Oceanic and Atmospheric Administration, National Weather Service, Advanced
Hydrologic Prediction Service, www.crh.noaa.gov/crh, September 20, 2007
Platte River Recovery Implementation Program (PRRIP) Program Document, October 24,
2006
U.S. Department of Interior (USDOI), Platte River Recovery Implementation Program Final
Environmental Impact Statement, April 2006
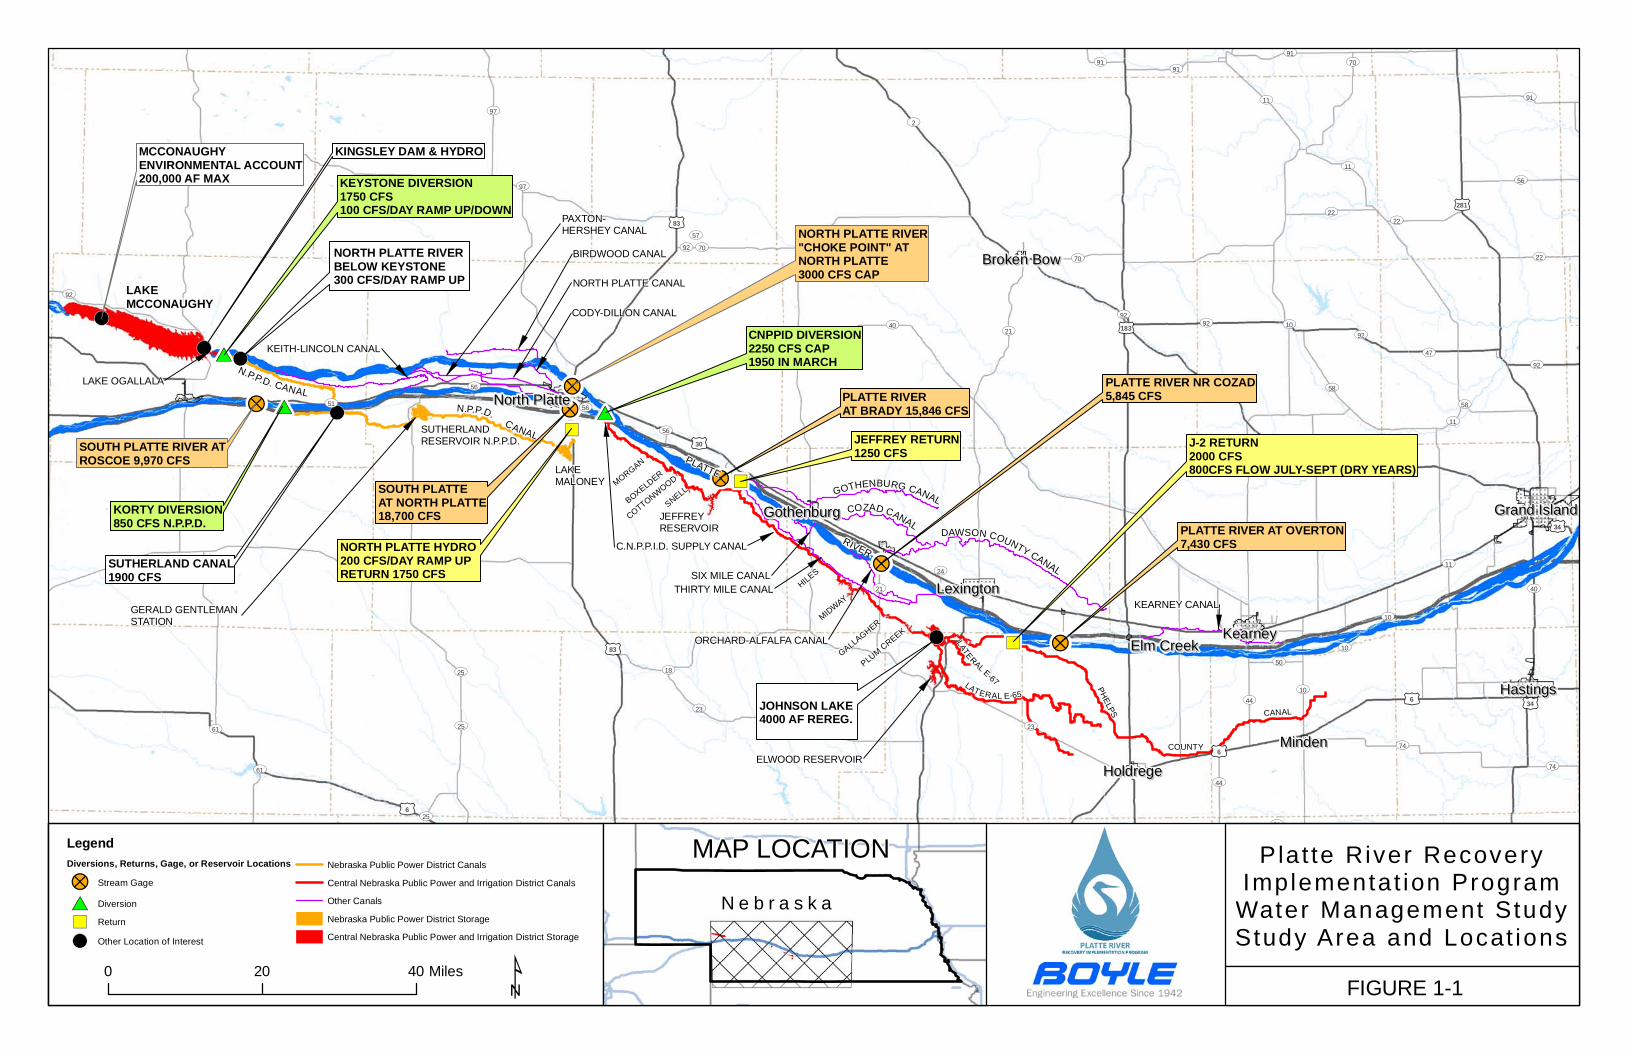
#*!(
!(
!(
!? #* !(
!?
!(")#*
!? ")
!?
!( ") !?
!?
LAKEMCCONAUGHY
KINGSLEY DAM & HYDRO
LAKE OGALLALA
KEYSTONE DIVERSION1750 CFS100 CFS/DAY RAMP UP/DOWN
KORTY DIVERSION850 CFS N.P.P.D.
N.P.P.D. CANAL
KEITH-LINCOLN CANAL
SUTHERLAND CANAL1900 CFS
SUTHERLANDRESERVOIR N.P.P.D.
LAKEMALONEY
GERALD GENTLEMANSTATION
NORTH PLATTE HYDRO200 CFS/DAY RAMP UPRETURN 1750 CFS
NORTH PLATTE RIVER"CHOKE POINT" ATNORTH PLATTE3000 CFS CAP
NORTH PLATTE CANAL
CODY-DILLON CANAL
BIRDWOOD CANALNORTH PLATTE RIVERBELOW KEYSTONE300 CFS/DAY RAMP UP
MORGAN
BOXELDER
COTTONWOOD
JEFFREYRESERVOIR
SNELL
C.N.P.P.I.D. SUPPLY CANAL
HILES
MIDWAY
GALLAGHER
PLUMCREEK
GOTHENBURG CANALCOZAD CANAL
PLATTE
RIVER
JOHNSON LAKE4000 AF REREG.
ELWOOD RESERVOIR
PAXTON-HERSHEY CANAL
N.P.P.D.CANAL
SIX MILE CANAL
ORCHARD-ALFALFA CANAL
THIRTY MILE CANAL
LATERAL E-67LATERAL E-65
PLATTE RIVER AT OVERTON7,430 CFS
PHELPS CANAL
COUNTY
KEARNEY CANAL
CNPPID DIVERSION2250 CFS CAP1950 IN MARCH
JEFFREY RETURN1250 CFS
DAWSON COUNTY CANAL
MCCONAUGHYENVIRONMENTAL ACCOUNT200,000 AF MAX
SOUTH PLATTE RIVER ATROSCOE 9,970 CFS
PLATTE RIVERAT BRADY 15,846 CFS
PLATTE RIVER NR COZAD5,845 CFS
J-2 RETURN2000 CFS800CFS FLOW JULY-SEPT (DRY YEARS)
SOUTH PLATTEAT NORTH PLATTE18,700 CFS Grand IslandGrand Island
HastingsHastings
KearneyKearney
North PlatteNorth Platte
LexingtonLexington
McCookMcCook
HoldregeHoldrege
MindenMinden
Broken BowBroken Bow
GothenburgGothenburg
Elm CreekElm Creek£¤83
£¤6
£¤183
£¤281
£¤30
£¤34
£¤136
£¤283
£¤6
£¤6
£¤34
£¤83
£¤183
£¤6
£¤34
£¤281
UV92
UV89
UV4
UV25
UV40 UV10
UV2
UV61
UV70
UV23
UV97
UV18
UV47
UV21
UV58
UV17
UV91
UV11
UV56
UV78
UV22
UV44
UV74
UV46
UV50
UV42
UV28
UV57
UV24
UV31
UV27 UV128UV161 UV8
UV51
UV117
UV29UV31
UV40
UV92
UV47
UV10
UV91
UV10
UV58
UV91
UV4
UV97
UV10
UV23
UV11
UV21
UV22
UV91
UV31
UV92
UV25
UV27
UV11
UV56
UV46
UV70
UV22
UV92
UV92
UV92
UV44
UV74
UV89
UV11
UV25
UV25
UV70
UV56
UV61
UV56
P la t te River RecoveryImplementat ion Program
Water Management StudyStudy Area and Locat ions
¹
LegendDiversions, Returns, Gage, or Reservoir Locations
!? Stream Gage
#* Diversion
") Return
!( Other Location of Interest
Nebraska Public Power District Canals
Central Nebraska Public Power and Irrigation District Canals
Other Canals
Nebraska Public Power District Storage
Central Nebraska Public Power and Irrigation District Storage
0 20 40 MilesFIGURE 1-1
MAP LOCATION
N e b r a s k a

WATER MANAGEMENT STUDY, PHASE I EVALUATION OF PULSE FLOWS FOR THE PLATTE RIVER
RECOVERY IMPLEMENTATION PROGRAM
Phase I Report April 8, 2008
APPENDIX 1
WMS Interview Meeting Notes
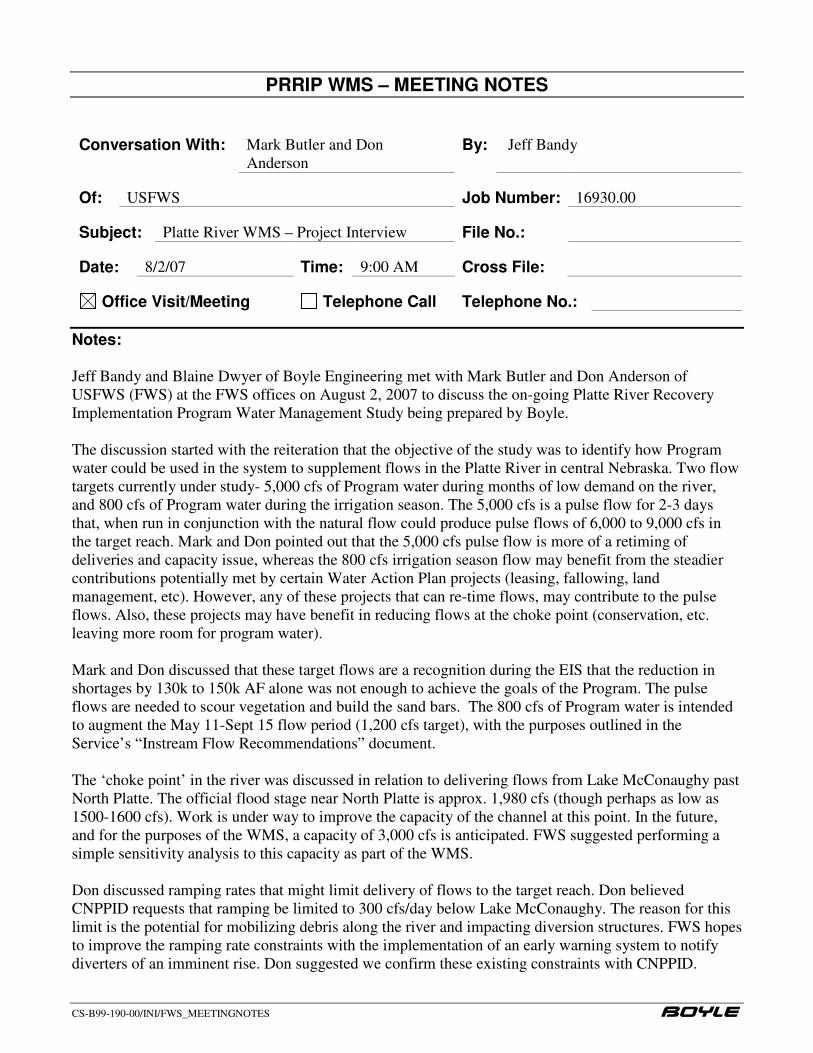
PRRIP WMS – MEETING NOTES
CS-B99-190-00/INI/FWS_MEETINGNOTES
Conversation With: Mark Butler and Don
Anderson By: Jeff Bandy
Of: USFWS Job Number: 16930.00
Subject: Platte River WMS – Project Interview File No.:
Date: 8/2/07 Time: 9:00 AM Cross File:
Office Visit/Meeting Telephone Call Telephone No.:
Notes:
Jeff Bandy and Blaine Dwyer of Boyle Engineering met with Mark Butler and Don Anderson of
USFWS (FWS) at the FWS offices on August 2, 2007 to discuss the on-going Platte River Recovery
Implementation Program Water Management Study being prepared by Boyle.
The discussion started with the reiteration that the objective of the study was to identify how Program
water could be used in the system to supplement flows in the Platte River in central Nebraska. Two flow
targets currently under study- 5,000 cfs of Program water during months of low demand on the river,
and 800 cfs of Program water during the irrigation season. The 5,000 cfs is a pulse flow for 2-3 days
that, when run in conjunction with the natural flow could produce pulse flows of 6,000 to 9,000 cfs in
the target reach. Mark and Don pointed out that the 5,000 cfs pulse flow is more of a retiming of
deliveries and capacity issue, whereas the 800 cfs irrigation season flow may benefit from the steadier
contributions potentially met by certain Water Action Plan projects (leasing, fallowing, land
management, etc). However, any of these projects that can re-time flows, may contribute to the pulse
flows. Also, these projects may have benefit in reducing flows at the choke point (conservation, etc.
leaving more room for program water).
Mark and Don discussed that these target flows are a recognition during the EIS that the reduction in
shortages by 130k to 150k AF alone was not enough to achieve the goals of the Program. The pulse
flows are needed to scour vegetation and build the sand bars. The 800 cfs of Program water is intended
to augment the May 11-Sept 15 flow period (1,200 cfs target), with the purposes outlined in the
Service’s “Instream Flow Recommendations” document.
The ‘choke point’ in the river was discussed in relation to delivering flows from Lake McConaughy past
North Platte. The official flood stage near North Platte is approx. 1,980 cfs (though perhaps as low as
1500-1600 cfs). Work is under way to improve the capacity of the channel at this point. In the future,
and for the purposes of the WMS, a capacity of 3,000 cfs is anticipated. FWS suggested performing a
simple sensitivity analysis to this capacity as part of the WMS.
Don discussed ramping rates that might limit delivery of flows to the target reach. Don believed
CNPPID requests that ramping be limited to 300 cfs/day below Lake McConaughy. The reason for this
limit is the potential for mobilizing debris along the river and impacting diversion structures. FWS hopes
to improve the ramping rate constraints with the implementation of an early warning system to notify
diverters of an imminent rise. Don suggested we confirm these existing constraints with CNPPID.
Conversation With: Mark Butler and Don Anderson
Page 2
CS-B99-190-00/INI/FWS_MEETINGNOTES
Ramping concerns of NPPD are on the order of 100 cfs/day at the Keystone Diversion. Ramping rates
are not as much of a concern below the confluence areas; they may exist, but haven’t been fully
discussed.
The choke point and ramping rates factor in to the total volume and timing of releases from the
Environmental Account (EA) in Lake McConaughy. Quantifying this total volume of water is part of the
WMS scope.
Mark and Don discussed the suggestion by the Districts of reregulation of flow on the systems and also
bypassing the flows in accordance with Case I and II in the RFP and WMS Scope. Don suggested that
previous analyses show that a combined approach of reregulation and bypassing may be required in
drier years. Central is considering the possibility of 4,000 AF of regulating capacity in Johnson
Reservoir with the potential to go as high as 12,000 AF in the system. (Reference to the Bypass
Agreement in Attachment 5, Section 1.) NPPD may have up to 2,000 AF of reregulating capacity.
Don provided Boyle the Illustrative Case Summary memo that was prepared by FWS, CNPPID, and
NPPD dated 8/29/05. This analysis looked at likely pulse flow magnitudes and durations achievable
under different scenarios of EA water deliveries. Boyle will review this document for reference in
developing the loss and routing spreadsheets. As a note, in previous modeling, the EA in McConaughy
maxed out at about 130-135KAF.
FWS suggested looking at interruptible supplies to farmers as another management option to be
considered. Perhaps scheduled interruptions for 1 or 2 days.
Mark reiterated that the current WMS is to focus more on the ‘plumbing’; that is, how Program water
flows through the system.
Action: Yes No
Boyle to touch base with Jeff Runge of FWS Field Office in Grand Island. Jeff Bandy will contact him
to interview on NE trip.
Don offered to supply Boyle with the Vol. 3 CD and the Cost memo developed by Jeff Runge. – Done.
PRRIP WMS – MEETING NOTES
CS-B99-190-00/INI/MEETINGNOTES_W_JEFFRUNGE
Conversation With: Jeff Runge By: Jeff Bandy
Of: US Fish and Wildlife Service, Grand Island, NE Job Number: 16930.00
Subject: Platte River Recovery Program Water
Management Study File No.:
Date: 9/5/07 Time: 3:30 PM Cross File:
Office Visit/Meeting Telephone Call Telephone No.:
Notes:
At the suggestion of Mark Butler and Don Anderson, Jeff Bandy and Blaine Dwyer of Boyle
Engineering, with Becky Mitchell of Headwaters Corp., met with Jeff Runge of the US Fish and
Wildlife Service on September 5, 2007 to discuss the on-going Platte River Recovery Implementation
Program Water Management Study being prepared by Boyle.
The meeting started with Jeff Runge walking through his November, 2006 memo on “Associated
Costs”. Jeff explained the types of costs and the highlights of each. The framework for his analysis was
looking at constraints in the system and exceedances of those constraints and how they might impact the
Program, Program Participants, and Good Neighbors. “Associated Costs” refers to impacts to NPPD and
CNPPID. “Good Neighbor Impacts” are those impacts incurred by private citizens or organizations.
For purposes of the associated costs analysis, Jeff looked at providing 5,000 cfs of total flow to the
habitat downstream.
o Associated Cost #1 – 100 cfs ramp rate at NPPD Keystone
The potential impacts of ramping higher than the 100 cfs rate are canal wall collapse and bank
sloughing in Lake Maloney. Canal wall collapse and bank sloughing could also lead to more
significant impacts such as power interference and lost irrigation deliveries. According to NPPD
officials, the higher exceedeances of this rate in the record are likely due to errors in the gage.
Jeff agreed that NPPD would not attempt to exceed the ramp rate by a significant amount
because of the potential impacts.
o Associated Cost #2 – Johnson Reservoir Re-Regulation
The potential impact to Johnson Reservoir is bank sloughing due to too rapid of drawdown. The
drawdown limitation is 4,000 AF in 3 days. This appears to have been exceeded in the past
without known impacts. The average historic re-regulation is 4,922 AF. Historically, Johnson
Reservoir has not been used for irrigation, but has been recently due to drought.
o Associated Cost #3 – Cavitation damage, tailrace damage if exceed normal capacity canal flow
at Johnson and Maloney reservoirs.
Flows cycling from 0-1750 cfs have occurred in the past.
Conversation With: Jeff Runge
Page 2
CS-B99-190-00/INI/MEETINGNOTES_W_JEFFRUNGE
o Associated Cost #4 – Transmission Costs, lost hydro generation if water is not passed through
system.
o Associated Cost #5 – damage to private diversion structures/ sand dams
This cost is the concern that high flows may damage diversion structures and sand dams on the
river, for which the Program might be liable. Jeff pointed to a recent rainfall event resulting with
corresponding flows of 1300 and 3200 cfs at Brady and Cozad, respectively. (Values to be
verified). Observed damage associated with the Orchard-Alfalfa canal was likely due to localized
rainfall and not from upstream river flows because the Platte River Sand Dam restricts inflows to
the Orchard-Alfalfa diversion.
Jeff discussed the known breach at Cozad that was fixed in 2004, and that this was not impacted
by the peak flow in 2007. Examples of sand dams on the river are at 30-mile and Gothenburg
Canals.
o Associated Cost #6 – Damage to Tern/Plover nesting islands
Maintenance of certain tern and plover nesting areas are a condition of the Districts’ FERC
licensing.
Erosion is constantly occurring at these sites, so there is the need to separate and distinguish
from a 1-time event in terms of cost.
o Good Neighbor Impact #1: 300 cfs ramp rate on North Platte River
The 300 cfs ramp rate on the North Platte is in place to prevent damages due to debris buildup.
The ramp down is not a concern, and therefore not limited. The at-risk canals for debris damage
are the Paxton-Hensley and the North Platte canals whose potential for debris accumulation is
relatively minor because of their close proximity to the Keith –Lincoln Canal diversion.
o Good Neighbor Impact #2: Private diversion structure damage.
Opinion that the structure most “at risk” of damage is Orchard Alfalfa which is protected from
low level peak flows by the upstream Platte River Sand Dam.
o Good Neighbor Impact #3: Risk of wind erosion / wave erosion of Johnson Reservoir
The 4,000 AF of regulation corresponds to approximately 1.7 – 1.8 feet of elevation change.
Fluctuations on the order of 4-5 feet have occurred, with as much as 12 feet in the last few years
as a result of water conservation actions implemented by CNPPID.
o Good Neighbor Impact #4: Improving lower lake access in Johnson Reservoir.
By lowering the lake, it may limit access to the boat ramps. Currently the boat ramp access has
been lowered to 2,610 ft.
o Good Neighbor Impact #5, Reservoir fisheries in Johnson Reservoir.
The impact of concern is primarily the young of year fish. There is not really a way to avoid this,
therefore restocking is the likely solution.
Given these costs and impacts, Jeff suggested looking at the following possible strategies:
o Increasing the ramp rate on the North Platte
Conversation With: Jeff Runge
Page 3
CS-B99-190-00/INI/MEETINGNOTES_W_JEFFRUNGE
o Improving the choke point capacity beyond the historic 3,000 cfs safe channel capacity if
possible.
o Combine pulse flows from McConaughy with high water events from the South Platte
o Possibility of getting EA water into South Platte channel if an economical method exists
o Continue to look at re-regulation possibilities with the Districts
There is the potential for a choke point in upper reach of the Platte River; likely a result of phragmites.
Service would like to test (in 2008 or so):
o May use 300 cfs ramp rate on North Platte
o Use 4,000 AF of Johnson Reservoir
The plan depends on the outcomes of the WMS and weighing the benefits with associated costs.
Jeff discussed general issues or constraints on the system to be considered:
o During wetter conditions, the canals are likely full, so Program will need to rely more on
river capacity to move water downstream.
o The Keystone Canal System is inefficient in conveying large volumes of EA water efficiently
because of the restricted ramp rate. Testing exceedances of the ramp rate may be difficult
due to the potential impacts.
o Currently under existing drought conditions, it would be difficult to make releases out of
Johnson and Jeffrey in September as they are typically drawn down as a result of water
conservation actions implemented by CNPPID. It would be difficult to convey EA water
through the system when the above conditions exist.
o Currently under existing drought conditions, Maloney Reservoir is cut off after the irrigation
season, and fills again in late May. It incurs evaporation losses over the winter. Maloney is
currently not storing over the winter due to drought conditions. It would be difficult to
convey EA water through this system when the above conditions exist.
o Drought years in general are difficult to move EA pulse water through the system due to
large losses.
Current management of the Environmental Account in Lake McConaughy:
o Currently at 130,000-140,000 AF
o 50,000 AF of releases were made in 2007 to prevent zero flow conditions in the river. The
target in 2007 was to get 500 cfs to Grand Island, with a release of 800 cfs.
o The EA gets 10% of storable inflow during the non-irrigation season.
o Maybe fill back up to 110,000 to 120,000 AF next year, the maximum is 200,000 AF
Jeff mentioned there was a good event in 2005 that resulted in approximately 6,000 cfs at Grand Island.
Moving forward, Jeff is interested in refining the costs estimates for each of the Associated Cost and
Good Neighbor Impacts. The refined cost estimates will assist Boyle Engineering and the Platte River
Recovery Implementation Program in identifying system constraints that can be “tested” with minimal
risk of incurred financial impact. This will help when looking at the benefits and costs and the best way
to move forward.

PRRIP WMS – MEETING NOTES
CS-B99-190-00/INI/MEETINGNOTES_W_JEFFRUNGE
Action: Yes No
Jeff provided his cost memo electronically and later followed up with an email containing meeting notes
from the pulse flow sub-committee.

PRRIP WMS – MEETING NOTES
CS-B99-190-00/INI/MEETINGNOTES_W_CNPPID_FINAL
Conversation With: Don Kraus, Mike Drain, and
Cory Steinke By: Jeff Bandy
Of: Central Nebraska Public Power and Irrigation
District Job Number: 16930.00
Subject: Platte River Recovery Program Water
Management Study File No.:
Date: 9/6/07 Time: 8:30-2:00 Cross File:
Office Visit/Meeting Telephone Call Telephone No.:
Notes:
Jeff Bandy and Blaine Dwyer of Boyle Engineering, with Becky Mitchell of Headwaters Corp., met
with Don Kraus, Mike Drain, and Cory Steinke of Central Nebraska Public Power and Irrigation District
(CNPPID) on September 6, 2007 to discuss the on-going Platte River Recovery Implementation
Program Water Management Study being prepared by Boyle.
Mike expressed concern that a monthly spreadsheet model is not useful in analyzing a 5,000 cfs pulse
flow. He suggested that looking at historic events and timing for development of the routing.
Mike and Cory discussed historic and recent conditions on the river, highlighting specific events
that would be beneficial to consider in relation to the WMS:
Two or three ‘good’ pulse flows occurred naturally during the winter of 2007. One of which was a result
of an ice melt event near North Platte in February or March. Flows from this event made it as far
downstream as the Central Platte area. Suggested to look at records for North Platte and Overton gages.
Around June 1, 2007 flow at Overton was approximately 5,000 cfs.
Also around June 15, 2007 flow in the Platte was approximately 3,900 cfs at Central’s diversion.
In July 2006 a breach occurred on the supply canal, approximately 1.6 miles from the diversion. The
diversion was shut down, resulting in a bypass of 2,200 cfs at North Platte. The corresponding peak flow
at Brady was approximately 300 cfs. (To be confirmed.)
The Korty flood occurred on July 5, in either 2001 or 2002. This was the result of a rain event with a
peak flow of 11,000 cfs on the South Platte at Roscoe. The Western Canal breached at either the ramp or
bridge on Interstate. This event should be looked at to gage the high level of attenuation.
The summer of 2006 saw some of the highest losses in the river.
Summer of 2007 levels were close to flood stage at Cozad (June 1, 2). North Platte was also close.
The North Platte diversion can divert 2250 cfs, passing nearly zero flow downstream.
Conversation With: CNPPID
Page 2
CS-B99-190-00/INI/MEETINGNOTES_W_CNPPID_FINAL
PWAP model calculates loss by assessing evaporation per river reach and assigning the remaining loss
based on the difference in gage values. The model is an accounting model rather than having predictive
capabilities for determining losses. It also assumes travel time between gages is 1 day, which is not
always the case.
The growth of phragmites on the river are increasing the travel time and therefore affecting ‘watering
up’ of the system. The prevalence of phragmites started around 2002 and this should be captured in the
gage records for this period and later.
Mike and Cory walked through the CNPPID (and part NPPD) system and operations. The
operations and comments are not in any particular stream or system order:
The travel time from McConaughy to Central’s diversion is approximately 2 days. This will affect the
timeliness of setting pulse flows downstream. Confirmed the ramp rate of 300 cfs on the North Platte.
McConaughy can release to either NPPD or to the North Platte. CNPPID can then pick up at North
Platte. CNPPIDs diversion can pick up anything in the Platte up to 2250 cfs.
CNPPID can return water back to the river at Jeffrey, downstream of Brady at a maximum rate of 1250
cfs. If this release is made here, the water leaves the system and does not make it to Johnson Reservoir
and reduces the potential quantity or duration that water could be returned at the J2 Return.
The J-2 return, just downstream of Lexington, and above Overton, may be the best place to return to the
river. The capacity of the J-2 is 2,000 cfs. During the irrigation season, J-2 may be able to return about
1200 cfs.
From an operational point of view, the smaller reservoirs on the Supply Canal should not be considered.
These reservoirs do not have controls on them.
Travel time through the system is essentially the same as in the river.
Running water through the system instead of the river allows for the opportunity of 2 different return
locations.
The District generally does not bypass around the hydros except for maintenance. At one time in the past
they have run a bypass for about four months, and needed to repair the apron afterwards. Jeffrey hydro
does not have a bypass.
Diversions to Jeffrey Reservoir lose about 250 cfs when run at full capacity. Losses between Jeffrey and
Johnson are about 150-200 cfs. However, for accounting purposes, losses are assigned equivalent to
what would have been calculated with PWAP.
Elwood Reservoir begins filling in mid March and continues until about June 10 or 15. Water is diverted
from the Supply Canal into the E65 Canal upstream from Johnson Lake to fill Elwood. Releases from
Elwood are made for irrigation.
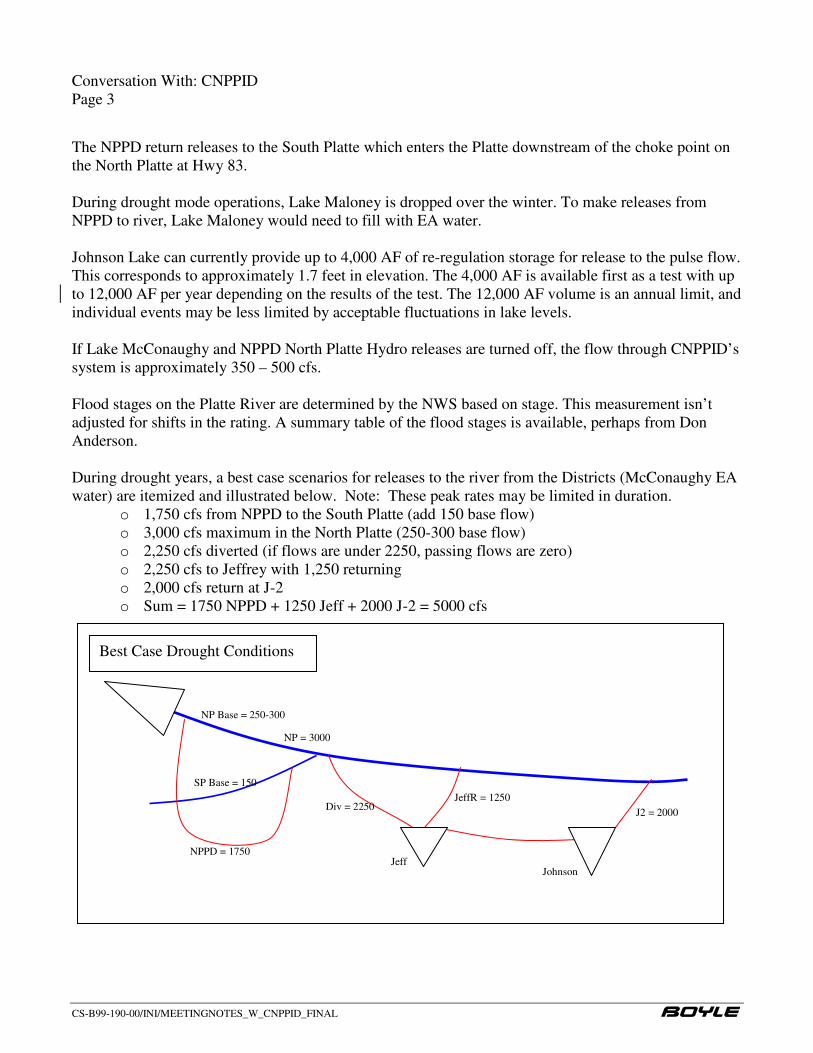
Conversation With: CNPPID
Page 3
CS-B99-190-00/INI/MEETINGNOTES_W_CNPPID_FINAL
The NPPD return releases to the South Platte which enters the Platte downstream of the choke point on
the North Platte at Hwy 83.
During drought mode operations, Lake Maloney is dropped over the winter. To make releases from
NPPD to river, Lake Maloney would need to fill with EA water.
Johnson Lake can currently provide up to 4,000 AF of re-regulation storage for release to the pulse flow.
This corresponds to approximately 1.7 feet in elevation. The 4,000 AF is available first as a test with up
to 12,000 AF per year depending on the results of the test. The 12,000 AF volume is an annual limit, and
individual events may be less limited by acceptable fluctuations in lake levels.
If Lake McConaughy and NPPD North Platte Hydro releases are turned off, the flow through CNPPID’s
system is approximately 350 – 500 cfs.
Flood stages on the Platte River are determined by the NWS based on stage. This measurement isn’t
adjusted for shifts in the rating. A summary table of the flood stages is available, perhaps from Don
Anderson.
During drought years, a best case scenarios for releases to the river from the Districts (McConaughy EA
water) are itemized and illustrated below. Note: These peak rates may be limited in duration.
o 1,750 cfs from NPPD to the South Platte (add 150 base flow)
o 3,000 cfs maximum in the North Platte (250-300 base flow)
o 2,250 cfs diverted (if flows are under 2250, passing flows are zero)
o 2,250 cfs to Jeffrey with 1,250 returning
o 2,000 cfs return at J-2
o Sum = 1750 NPPD + 1250 Jeff + 2000 J-2 = 5000 cfs
Best Case Drought Conditions
Jeff Johnson
NP = 3000
NPPD = 1750
J2 = 2000
SP Base = 150
JeffR = 1250 Div = 2250
NP Base = 250-300
Conversation With: CNPPID
Page 4
CS-B99-190-00/INI/MEETINGNOTES_W_CNPPID_FINAL
CNPPID does not have ramping rates with the exception of on the North Platte. The 300 cfs ramping
rate limit is in place to protect sand dams. The district calls structure owners with changes in flows.
FWS has new agreements on the operations of the J-2 return as related to hydrocycling, but these should
not be a limitation in this study.
Discussion of Water Action Plan Solutions and ‘other solutions’:
Power Interference: The primary concept is for the Program to pay the Districts not to release from
McConaughy, and build the EA. This does not do much to solve the plumbing issue of the pulse flow.
Another power interference concept is to pay the Districts not to divert the EA water through their
systems.
Timing of Pulse Flow mid summer if demands low:
There is potential to make a pulse flow delivery during the irrigation season given the right hydrologic
events. During a rain event, rather than holding water back in canals and local storage, release on top of
the natural flow and replace with EA water in subsequent days. This concept is described on pg. 3-41 of
the DEIS. It has also been discussed at the pulse flow committee meetings. June of 2007 may have been
the best chance to accomplish this year. This concept may not be preferred by FWS because the pulse is
not in the spring period that they prefer.
Re-regulating Reservoirs:
Re-regulation reservoirs have the greatest ability to meet the pulse flow targets. The reservoirs identified
in the HDR report might be reconsidered with larger outlet works capacities sized to meet the pulse
flows. The previous studies considered smaller flows.
In addition to the reservoir sites in the WAP and HDR study, other sites are under consideration by the
District and are discussed here:
Elwood Reservoir:
o Existing reservoir that Central does not use all of the time
o Currently the reservoir is filled outside of irrigation season and release during irrigation
o If used for Program, will need to modify for release to river via Plum Creek
o Large operating costs resulting from the required pumping
o Three operating scenarios are possible:
o Scenario 1: Probably fill twice – fill in fall for program release, and in early spring 2nd
fill for irrigation use
o Scenario 2: Use when so low that not being used for irrigation season (for example, next
year and last 3 years) – only used in full delivery years
o Scenario 3: Eliminate need for Elwood for irrigation use. Combined canal and reservoir
outflow around 500 cfs. The need below Elwood is greater than upstream canal capacity,
therefore by increasing the canal capacity to meet irrigation demand; this would negate
the need for the reservoir.
o The attraction is the benefit of dam and reservoir for the cost of choke point improvements;
However, would need to replace/improve/parallel 3 large diameter (6 ½’, 7’or 7 ½’) siphons
o Flows downstream to Plum Creek would be a potential issue.
Conversation With: CNPPID
Page 5
CS-B99-190-00/INI/MEETINGNOTES_W_CNPPID_FINAL
o Dam is in OK shape, built in late 70s; pumps working OK
o 3 constant speed pumps
o Existing outlet tube sized for 350 cfs
o Current annual pump costs $50 - $70 K
o Existing cap ≈ 25,700 AF, but pump up to 40,000 AF.
o Could fill with natural flow or EA water. Natural flow would require permit.
o Central has looked for a feasible gravity feed, but have not yet found it.
o Also other interest in Elwood as recharge supply
Phelps 9.8 Reservoir (aka “Kirkman” or “9.8 Reservoir”)
o Not Developed
o Feed off of Phelps canal
o Gravity fill, release to Platte
o Pros:
o Close to river with a high release rate
o Multi-purpose Reservoir- share with District to buffer irrigation demand, and dampen
outflows to benefit limits on J-2 return (eliminates hydrocycling).
o Cons:
o Moves placement of water farther downstream – past Overton bridge.
o Requires road and bridge work
o Capacity is estimated at 3,000 AF
o Located 9.8 miles along Phelps canal from J-2 return
o Maybe supplement releases from Johnson Lake
J-2 Return Pool Reservoir:
o Not Developed
o Located near J-2 return, bounded by Supply Canal, Phelps Canal, RD 435, and RD 749.
o A section of the canal is a fill section, and this would act as part of the embankment; the
remaining embankment is cut and fill.
o Gravity in and gravity out
o Pros:
o Located near river
o Perhaps add outlet to river
o Current use is corn land (known cost $3000/ac)
o Potential to re-route road or make into a cellular structure
o Cons:
o Need to modify canal structures
Robb Lake (Jeffrey Island Reservoir):
o Not Developed
o Located near Jeffrey Island, on south channel
o Concept: Dam South Channel
o J-2 returns to South channel
o Jeffrey Island is 7 miles long, providing several possible sites
o Potential clear water return issue that might move degradation area downstream
o But, perhaps move sand introduction downstream (needs to be placed anyway)
Conversation With: CNPPID
Page 6
CS-B99-190-00/INI/MEETINGNOTES_W_CNPPID_FINAL
o Drainage area is small
o Empty channel is a result of u/s dike crossing south channel
J-2 Forebay Lake Reservoir
o Take water off of a finger of the existing reservoir
o Outlet would require modifications of canal
o See HDR Report, 5380 AF in HDR report vs. 3436 AF in WAP
Water Leasing:
o If leased enough water, could help with the 800 cfs target by moving deliveries to the river
o Doesn’t do much for 5000 cfs, except as if stored
o Can shift used channel capacity from irrigation to program flows
o Likely a lease would cover both natural flow and storage water
o If 3,000 cfs can pass choke point, likely can get 800 cfs downstream
Water Management Incentives:
o Similar to Water Leasing
Groundwater Management:
o To meet pulse – only if actual active pumping (say 2-3 cfs per well)
o Could help with the 800 cfs
o Other options are viable, but limited in yield
o Mound has declined somewhat due to the drought (up a small amount this last year, but down
overall for drought period)
Dry Creek/Fort Kearney Cutoff:
o Tributary flows in previous study are now dried up (for past 4 or 5 years)
o Idea in Water Action Plan was to return water to river via canal and to add pumped water.
o Possibility/Interest in using waste water from an Ethanol plant south of Kearney
o Concept is to run P/L with effluent up to river
o Piggy back pumped water in P/L
o Tri-Basin NRD mentioned to Mike Drain (John Thorburn)
o Currently applying water with pivot sprinklers
Gothenburg
o No benefit to 5,000 cfs
o Retiming of high flow water
Power Interference
o Produces storage water in EA, but not the 5,000 cfs
o Does not work in dry years - dry years are not running water for power
Net Conserved Controllable Water:
o Creates water in EA from past conservation efforts
o 2003 analysis identified 314 AFY to reclaim versus 500 AFY in WAP
o Central estimated ‘controllable’ amount to total 10,900 AF, assuming regular irrigation use
Conversation With: CNPPID
Page 7
CS-B99-190-00/INI/MEETINGNOTES_W_CNPPID_FINAL
o Provided “Supplemental Estimate of Net Controllable Conserved Water”, 7/14/03
The WAP projects would likely have been configured differently, or have been different projects if
structured to provide pulse flows.
Phase II ideas:
o Dam on Plum Creek, downstream of J-2 Return
o 100 – 300 kaf capacity
o Reclamation has studied area
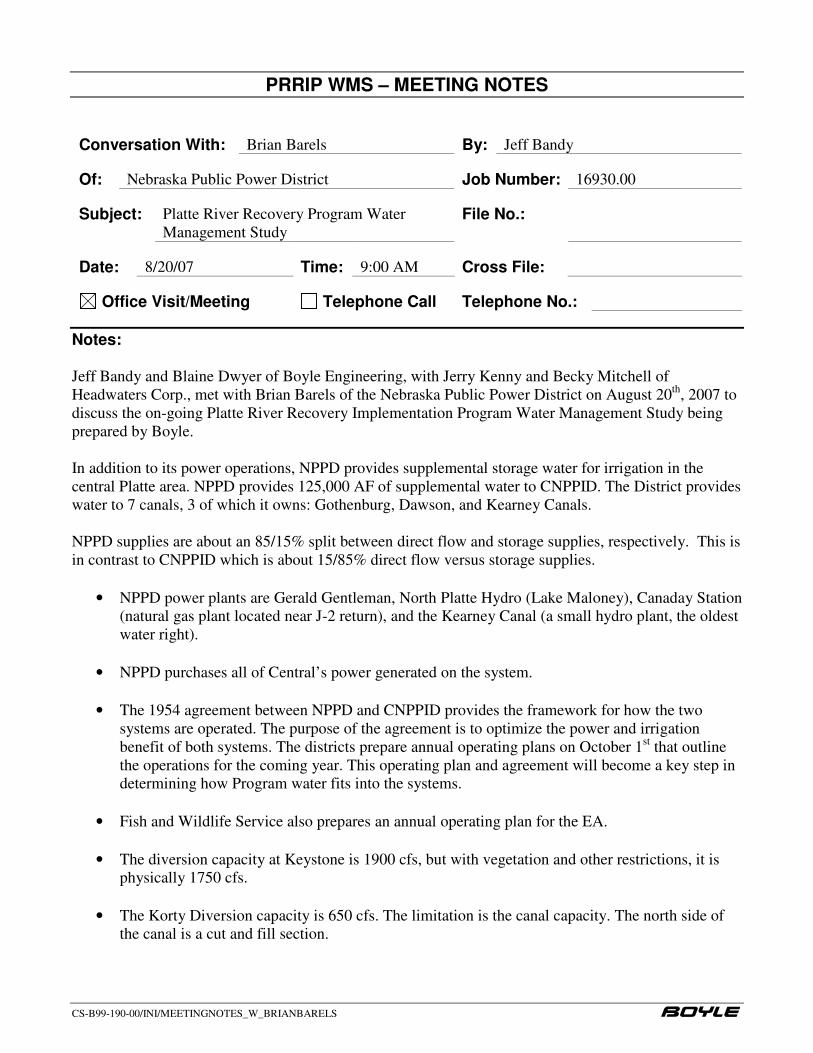
PRRIP WMS – MEETING NOTES
CS-B99-190-00/INI/MEETINGNOTES_W_BRIANBARELS
Conversation With: Brian Barels By: Jeff Bandy
Of: Nebraska Public Power District Job Number: 16930.00
Subject: Platte River Recovery Program Water
Management Study File No.:
Date: 8/20/07 Time: 9:00 AM Cross File:
Office Visit/Meeting Telephone Call Telephone No.:
Notes:
Jeff Bandy and Blaine Dwyer of Boyle Engineering, with Jerry Kenny and Becky Mitchell of
Headwaters Corp., met with Brian Barels of the Nebraska Public Power District on August 20th
, 2007 to
discuss the on-going Platte River Recovery Implementation Program Water Management Study being
prepared by Boyle.
In addition to its power operations, NPPD provides supplemental storage water for irrigation in the
central Platte area. NPPD provides 125,000 AF of supplemental water to CNPPID. The District provides
water to 7 canals, 3 of which it owns: Gothenburg, Dawson, and Kearney Canals.
NPPD supplies are about an 85/15% split between direct flow and storage supplies, respectively. This is
in contrast to CNPPID which is about 15/85% direct flow versus storage supplies.
• NPPD power plants are Gerald Gentleman, North Platte Hydro (Lake Maloney), Canaday Station
(natural gas plant located near J-2 return), and the Kearney Canal (a small hydro plant, the oldest
water right).
• NPPD purchases all of Central’s power generated on the system.
• The 1954 agreement between NPPD and CNPPID provides the framework for how the two
systems are operated. The purpose of the agreement is to optimize the power and irrigation
benefit of both systems. The districts prepare annual operating plans on October 1st that outline
the operations for the coming year. This operating plan and agreement will become a key step in
determining how Program water fits into the systems.
• Fish and Wildlife Service also prepares an annual operating plan for the EA.
• The diversion capacity at Keystone is 1900 cfs, but with vegetation and other restrictions, it is
physically 1750 cfs.
• The Korty Diversion capacity is 650 cfs. The limitation is the canal capacity. The north side of
the canal is a cut and fill section.

Conversation With: Brian Barels
Page 2
CS-B99-190-00/INI/MEETINGNOTES_W_BRIANBARELS
• Ramping rates for the NPPD system are consistent with what is published in the Program
documents. The system can ramp up faster than it can down based on concerns of subsidence in
the fill areas.
• Lake Maloney operations can ramp up the hydro at 200 cfs per day, and shut down immediately.
A surge tank is on the system at North Platte.
• In general, system operations can be limited by reservoir and lake levels.
• Lake Maloney has a capacity of 34,000 AF; currently only approximately 10,000 AF is usable.
This storage capacity needs to be replaced..
• Hydro is the only way to get water out of system. There are no bypasses on the system except via
a canal outlet.
Program Re-regulation on the NPPD system, if done, would likely occur in Sutherland Reservoir. There
is flexibility in the operations of the reservoir. Could serve the purpose of reregulating South Platte
water, but this would be a significant accounting issue. Sutherland Reservoir does not have a solid
bottom and seeps at higer rates as water level increases. If a cost effective lining could be constructed,
that would increase the possibility as a reregulation reservoir. The seepage from the reservoir returns to
both the North Platte and South Platte.
• A detailed model of Sutherland Reservoir is being developed by Clint Kearney for NPPD, CO-
HYST.
• Another possibility for reregulation storage is Sutherland East, an undeveloped reservoir site
with approximately 13,000-14,000 AF of capacity.
• NPPD has developed 24 wells around Sutherland Reservoir as a contingency supply if Lake
McConaughy were to go dry. This water would be used to run the plant. The wells discharge to
cooling water blended with warmer water to comply with NPDES permits. NPPD has developed
mitigation plans for nearby irrigation wells. If water levels drop 10 ft, a check is made of the
neighboring yields, and irrigators are compensated for injury. In addition irrigators are paid not
to irrigate the following year.
• Gerald Gentleman power station uses 1200 cfs for cooling.
• The biggest issue with the pulse flows is the timing. Both NPPD and CNPPID are running full
for July, August and sometimes into September.
• It may be possible in the springtime to move water into Maloney or Sutherland for release.
Maloney is about 2 days travel time upstream of Overton.
• Johnson Reservoir is closer to the habitat and therefore may work better for a release.
• Bottom line is that it will take both the river and Program water to make the target flows.
• The flows for the 800 cfs flows will likely need to run through the river. Perhaps with the use of
exchanges.
• Central would tend to divert more EA water than NPPD.
Power Interference affects both Districts due to the agreement to maximize power generation. The
concept of Power Interference for Program water came out of the 1975-1995 period, where excesses
were available.
Conversation With: Brian Barels
Page 3
CS-B99-190-00/INI/MEETINGNOTES_W_BRIANBARELS
o After 2000, this is not a possibility due to lower flows.
o Currently in drought mode where they shut McConaughy down, and dewater the canal and
Lake Maloney during the winter.
o Concept was not to generate in winter
o During drought mode, McConaughy is shut down in September and kept high enough to
form an ice cap.
o Slowly fill Sutherland during Nov-Dec-Jan.
o Turn McConaughy back on for irrigation in June.
o Non-irrigation diversion at Keystone is 250-750 cfs. This has been difficult in drought mode.
o These are min flows set by Game & Parks, FWS, and FERC.
Water Leasing as Program water supply:
o How senior of rights could be leased, and how much of these are surface rights?
o What happens to storage water for leased lands?
o New statutes in 2004 were passed for leasing in Nebraska; Leases up to 30 years.
o Storage water would be leased from NPPD/Central.
o Question as to whether this affects “maximize beneficial use” agreement between Districts
(1954).
o Accounting is required to get water into Lake McConaughy
o In 2003-2004 CREP started (Conservation Reserve and Enhancement Program)
o This was set up to pay the difference in lease rates between irrigated and dryland.
o The concept is to use a low consumptive cover.
Dawson/Gothenberg ground water recharge:
o COHYST will be able to provide more information on this concept.
o State protected flows (non-species flows) could be diverted in winter to seep back into
ground over time.
o The canals are owned by NPPD.
Ground water management:
o NPPD is working with Twin Platte NRD, Central Platte NRD and DNR on CO-HYST
project.
o HDR is developing a surface water model connected with the CO-HYST model.
o Surface water model will extend from Lewellen & Julesburg to Duncan.
o This work is an 18 month timeframe.
Other ground water management issues:
o Where should pumping take place and how will it get to the river.
o The mound under Central’s System on the north side is 6-40 ft deep.
o The Central Platte study will look at maximizing uses and how to offset depletions.
Elm Creek Reservoir:
o Originally for flood protection with recreation, and depletions.
• Under Nebraska Depletions Plan any additional return flows need to go to species flows.

Conversation With: Brian Barels
Page 4
CS-B99-190-00/INI/MEETINGNOTES_W_BRIANBARELS
• Kearney canal is the senior irrigation & hydro right.
• In the years of 2000 and 2002, surface flow was 40%, therefore there was little supplemental
supply.
• All 7 NPPD canals are river diversions. These use major screening systems to filter debris.
• Cutoffs are a Tri-basin NRD project with out any connection to NPPD.
• Regarding ground water management concepts, need to know what are the effects on ground
water levels and return flows.
• Any change to the system will cause additional change. We need to look at the net effect.
• There is the concept that dry land areas are what need to come under management. Only 5% of
Nebraska water goes to irrigation.
• Net Controllable Conserved Water: CNPPID and Bureau conservation program. This included
Federal money.
WY/CO projects:
o These projects would help pulse flows if they could get water into the Lake McConaughy
EA.
o Tamarack retiming might move water into EA or Sutherland, and add to base flows.
The main difference now from the previous studies is more competition for water.
o The Republican basin (pump from GW to Republican River), groundwater mitigation, etc.
o Hydrology is drier now.
o More development since 1997 has competed for water.
PRRIP WMS – MEETING NOTES
CS-B99-190-00/INI/MEETINGNOTES_W_JONALTENHOFEN
Conversation With: Jon Altenhofen By: Jeff Bandy
Of: Northern Colorado Water Conservancy District Job Number: 16930.00
Subject: Platte River Recovery Program Water
Management Study File No.:
Date: 9/18/07 Time: 1:00 PM Cross File:
Office Visit/Meeting Telephone Call Telephone No.:
Notes:
Jeff Bandy and Blaine Dwyer of Boyle Engineering, with Becky Mitchell of Headwaters Corp., met
with Jon Altenhofen of Northern Colorado Water Conservancy District on September 18, 2007 to
discuss the on-going Platte River Recovery Implementation Program Water Management Study being
prepared by Boyle.
The discussion focused primarily on the Tamarack projects on the South Platte and how they relate to
the Program and specifically to the WMS. In addition, we discussed the Program objectives as well as
the South Platte in general. These notes generally follow the order of the conversation and summarize
the main points.
The current operating procedures for Tamarack I were developed to limit deliveries during the summer
months and to time the majority of delivery to February and March in times of shortages. This
reoperation is intended minimize the deliveries during the irrigation season to prevent the water from
being diverted by non-program uses. This difference in timing limits the benefit the Tamarack Project
will have in meeting the 5,000 cfs pulse flows or the 800 cfs irrigation season targets. By default, a small
amount of water from the project will benefit these goals, but the amount is minor and not the intent of
Tamarack.
Tamarack I starts on the South Platte River 40 miles upstream of the Colorado state line. The project is
credited flows below the Western Diversion. Administration of this water to the critical habitat is carried
out by Nebraska DNR.
The timing and average volume of delivery are illustrated on a graph Jon provided. The graph is a
representation of the same data presented in Attachment 5, Section 3 of the Water Plan. The target
reduction in shortages of Tamarack I is 10,000 AF per year as measured below the Western Canal
diversion. The average reduction to shortages as shown on the graph is 12,300 AF per year. Evaporation
losses are assessed to the deliveries, but are practically negligible to the total flow. (The original
operational goal of Tamarack I was to supply 16,000 AF of reductions, with no consideration of losses.
This operation also delivered water on a more uniform basis over the year, and was subsequently
modified to its current operation.)
Tamarack I timing for deliveries in February and March is a good match with other augmentation plans
because these are targeting other months for return.
Conversation With: Jon Altenhofen
Page 2
CS-B99-190-00/INI/MEETINGNOTES_W_JONALTENHOFEN
Tamarack I gets credit for increased flows in the river below Western Canal in months it is bypassing.
This credit is reduced for evaporative losses.
Studies performed to data considered gross losses only and did not consider deep percolation and return
flows to the river. Deep percolation on a basin wide scale may need to be studied as the Program moves
forward.
There are no identified ‘choke’ points on the South Platte River near the Tamarack area. There may be
areas with over bank flooding, but there is limited development in the area.
Tamarack III vs. Tamarack I:
The Tamarack III project is the similar concept to Tamarack I. The primary hurdle appears to be a
changing river regime, when fewer excess flows are available to be diverted. Shortage reductions from
Tamarack III were estimated as an additional 17,000 AF, based on the hydrology 1975-1995 which was
a good period for excess flows. There hasn’t been a discussion as to whether credit would be given with
or without canal interception. Refer to p. 87 of WAP.
Tamarack III probably won’t help to meet pulse flow of 5,000 cfs. Its intent was to reduce the 130,000-
150,000 AF annual shortage.
o As a note, much of the excess is from periods when McConaughy is spilling.
o Regarding the 800 cfs target- if Program is needing to meet 800 cfs flow in near future, then
leasing senior rights may be part of the solution. However, if this is a longer term goal, with use
of recharge projects, then system is starting from scratch and it will take time to get going.
o Tamarack II – project identified to meet Colorado’s depletions. This analysis used State
Engineer’s Office depletion factors. Little competition with other augmentation plans, so a good
match on timing. Tamarack II will retime 10 months of excess for delivery during 2 months of
shortages.
o There has been discussion of developing an SDF model for the South Platte, but currently no
work going on.
o Ovid Reservoir is possible source of supply to the South Platte, but issues of exporting water
remain.
o Current lease rates for recharge water is $40 per AF per year.
o Currently, electrical costs for wells are $10 per acre foot pumped.
o The South Platte Water Related Activities Program (SPWRAP) is maintaining a future
depletions spreadsheet. The model is housed at NCWCD. It was originally developed by
Hydrosphere.

Conversation With: Jon Altenhofen
Page 3
CS-B99-190-00/INI/MEETINGNOTES_W_JONALTENHOFEN
o Jon did not know what the Tamarack I average values reported in the RFP reflected. He
suggested looking into these numbers and comparing to values presented in the WAP tables.
PRRIP WMS – MEETING NOTES
Z:\_CURRENT_PROJECTS\PRRIP\16930.00\0001\Docs\Interviews\compiled\Purcell_WWDC_MeetingNotes.doc
Conversation With: Mike Purcell By: Jeff Bandy
Of: Wyoming Water Development Commission Job Number: 16930.00
Subject: Platte River WMS – Project Interview File No.:
Date: 8/9/07 Time: 9:00 AM Cross File:
Office Visit/Meeting Telephone Call Telephone No.:
Notes:
Jeff Bandy and Blaine Dwyer of Boyle Engineering Corp. and Becky Mitchell (Headwaters) met with
Mike Purcell of the Wyoming Water Development Commission (WWDC) at his office on August 9,
2007 to discuss the on-going Platte River Recovery Implementation Program Water Management Study
being prepared by Boyle.
Mike opened the discussion by reiterating the main focus of this study is to look at the capacity issue
associated with moving Program water down to the critical habitat. Capacity constraints are also one of
the big unknowns along the system. Associated with the capacity issue are the limitations on ramping
rates and reregulation storage. Boyle’s modeling and analysis should help to quantify these limitations
on operations and help to quantify the total ‘cost’ in terms of Program water.
As Mike was the primary author of the RFP, much of the discussion focused on the intent of the project
and scope.
The modeling should start with the assumptions as outlined in the RFP regarding system capacities.
Interviews and discussions with the Districts may provide more information on these flow capacities,
ramping rates, and reregulation capacities. It will be helpful if the model is set up to allow for a
sensitivity analysis and adjustment of these capacities. This will help quantify the amount of Program
water required to achieve a given result, and also which assumptions and constraints are most limiting.
The problem statement in the RFP describes the goal of the Program to be evaluated in this study. The
goals as stated are to deliver 5,000 cfs of Program water to the Overton gage for 3 days each year during
the low use period, and pulse flows up to 6,000 cfs in two of every three years. During the irrigation
season, the target is 800 cfs of Program water from May 1 through September 30.
It is likely that the best timing to achieve the pulse flows is in the spring months of March-May when
runoff is highest and demands are low.
Pathfinder Modification Project:
The Pathfinder Modification Project will provide an additional 54,000 AF (approx.) of storage. The
Environmental Account will receive 33,493 AF of storage, and the Wyoming account will have 20,000
AF. These accounts are filled based on pro-rata inflow under the existing storage right. The water right

Conversation With: Mike Purcell
Page 2
Z:\_CURRENT_PROJECTS\PRRIP\16930.00\0001\Docs\Interviews\compiled\Purcell_WWDC_MeetingNotes.doc
will undergo a partial change of use to allow for the Wyoming account water to be used as municipal
supply. This process is ongoing.
It is anticipated that releases from the Pathfinder EA to Lake McConaughy will occur in September of
each year. This is to minimize the conveyance loss between the two reservoirs. The gates at Guernsey
are typically closed in late September or early October. The EA manager can call for the water at
anytime the gates at Guernsey are open. The gates at Guernsey will not be opened to accommodate EA
water. Generally it is more beneficial to keep the water in Pathfinder rather than McConaughy for
reasons of lower evaporative losses. Mike provided Boyle with the loss schedule downstream of
Pathfinder as defined in Exhibit 9 of the Decree.
Design of the Modification Project and the work to authorize are running concurrently. Reclamation is
currently modeling the project, with results available in about 2 months. Mike directed Boyle to follow
up with John Lawson of Reclamation on the project.
Timing for the completion of the modification is by 2011 for delivery of EA water to the Program.
Glendo Reservoir:
Wyoming has a 15,000 AF account in Glendo Reservoir. Municipal contracts account for 4,400 AF of
the storage. The balance, 10,600 AF, is earmarked to replace groundwater depletions. The yield of the
10,600 AF is projected to be 40%. The remaining groundwater depletions may be replaced by deliveries
out of the Pathfinder account.
WAP Projects:
Mike provided a brief summary of a few of the 13 projects identified in the WAP. He indicated that no
additional work has been performed regarding these projects. He did indicate that some have been
identified as more likely to provide benefit to the target flows than others.
Central Platte Power Interference – Power interference costs relate to the reason for modeling Cases I
and II in the RFP and scope. Per the FERC license agreement, the Districts are allowed to run Program
water through their systems when capacity is available. The full use of Program water limited to
capacity is Case I in the analysis. If the Districts bypass water, they are compensated for the power
interference. This relates to Case II and the desire to quantify the cost associated with bypassing the
Districts’ systems. The program has approximately $3M set aside for power interference charges. Mike
directed Boyle to the Program Document for more information on power interference charges.
Reregulation Reservoir – regulation is definitely needed.
Water Leasing – Likely a significant contribution will be made via water leasing. However, participants
are unknown at this time. In Wyoming, the water supplied via temporary leases will need storage in
Glendo Reservoir via 1 yr leases. The limit of storage capacity in Glendo Reservoir available for leasing
is set by USBR. There exists at least 10,000 AF of storage capacity that may be available for this
purpose. This leasing of storage will result in higher costs for the temporary leasing.
PRRIP WMS – MEETING NOTES
CS-B99-190-00/INI/MEETINGNOTES_W_USBR
Conversation With: John Lawson, Lyle Myler By: Jeff Bandy
Of: Bureau of Reclamation Job Number: 16930.00
Subject: Platte River Recovery Program Water
Management Study File No.:
Date: 8/17/07 Time: 8:30 AM Cross File:
Office Visit/Meeting Telephone Call Telephone No.:
Notes:
Jeff Bandy and Blaine Dwyer of Boyle Engineering, with Jerry Kenny and Becky Mitchell of
Headwaters Corp., met with John Lawson and Lyle Myler of the Bureau of Reclamation on August 17,
2007 to discuss the on-going Platte River Recovery Implementation Program Water Management Study
being prepared by Boyle.
John and Lyle discussed the Pathfinder Project and Modification, operations on the North Platte River in
Wyoming, and how these fit in with the Program and the current Water Management Study.
The Pathfinder Dam and water right are the property of the Bureau of Reclamation. Reclamation owns
the facilities and operates them to meet contract obligations for water delivery.
The Pathfinder Dam and Reservoir project was authorized in 1903.
o The authorization was only for irrigation use of the water. Irrigation use has paid for the total
cost of the dam. No other party has paid any costs.
o The Pathfinder Modification Project is a raise of the existing dam to recapture 54,000 AF of
original storage space lost to sedimentation since the original construction. The water right is
not being enlarged, only recovering storage.
o The 54,000 AF will need to go through a change of use to municipal & fish and wildlife
purposes. This requires Board of Control & Wyoming State Engineer’s Office approval for
change of use for 54,000 AF.
o 34,000 AF of the new storage will go to the Environmental Account.
o 20,000 AF will be contracted to the State of Wyoming. The State can then subcontract to
other purposes including back to Program. The standard contract is for 40 years.
If the Program folds, a reconsultation will be performed by Reclamation to allow other uses.
Reclamation’s continued involvement in the Program requires authorization by Congress via House Bill
1462 and Senate Document 752. It is expected that the full Senate Committee will move the
authorization forward. If the legislation does not pass, the Secretary of Interior is limited in its
participation in the Program.
Conversation With: John Lawson
Page 2
CS-B99-190-00/INI/MEETINGNOTES_W_USBR
Reclamation is still operating under the first authorization budget. Construction activities and
maintenance cannot occur until a specific authorization is passed. Title 1 authorizes participation in the
Program. Title 2 authorizes the Pathfinder Modification Project (Project).
Wyoming is funding 100% of the Project. The work is executed by Reclamation with Wyoming
funding it. URS has been selected for the design and construction management of the project. The total
Project involves 7 phases, the last two are design and construction.
Construction of the Modification Project is anticipated to be accomplished in one season. The
contractor with mobilize in August and construct through April. If this is not possible, then a phased
construction will be necessary. The contract will be awarded next year at the earliest, mobilize in
August of 2008, and finish in 2009.
The final Project will be owned and operated by Reclamation and contracted to the Program.
The Programmatic EIS addressed hydrologic effects of the Modification Project and was presented to
USACE. The impacts to the area at the dam site were not included.
• The following assumptions of how EA would be operated were considered in the modeling:
o To maximize water for program
o 1 fill rule – no 2nd
fill – beginning October 1st and ending September 30
th
o Water in account as of October 1 counts against space for the upcoming year
o Made assumption that account would empty every year by Sept. 30th
(to McConaughy) -
move water in August and September (Best chance to get water to McConaughy without
additional losses from diversions.)
• Losses through Wyoming and Nebraska were established by agreement and incorporated by
decree.
• EA manager cannot move water earlier than about August or September, based on assumptions
in the EIS because power plants are maxed out and more water cannot be moved without
bypassing. Operations are fully reimbursable, therefore need to ensure maximum power is
generated. The water released from Pathfinder runs through the following facilities: Pathfinder,
Fremont, Alcova, Glendo, and Guernsey.
• Water in the Glendo account is delivered in a similar manner as Pathfinder, that is using a deficit
accounting and replacing later in the year (September).
• BBA developed the initial loss estimates for diversions and evaporation.
• No irrigation deliveries are made prior to May 1 or after September 30. There is ability to move
or relocate water, but not as a delivery to an end user.
• Delivery capacity is limited by power generation at Alcova (2300 – 2500 cfs depending on
Casper/Alcova demand).
• System runs flushing flows of 500 – 4000 - 500 cfs in 24 hour period for five days in a row. This
is to re-establish the trout fishery between Casper and Grey Reef Dam.
• 4,800 cfs delivered out of Guernsey, up to 5000 cfs for irrigatin demand.
• The amount of water delivered to the stateline is a big issue. Reclamation gets calls even over
very minor flow issues.
Conversation With: John Lawson
Page 3
CS-B99-190-00/INI/MEETINGNOTES_W_USBR
Comments on 13 Projects in WAP
La Prele Reservoir – This may likely be taken off the table. The concept was to contract with the owner
of a private reservoir for Program water. It is likely to stay with an oil company or irrigation.
Glendo Storage – 1953 stipulation to 1945 decree
o Reclamation could store water for irrigation of no more than 45,000 AFY, with 25,000 AF
contracted to Nebraska and 15,000 to Wyoming
o Cannot contract or release more in any year
o 100,000 AF storage capacity
o The 25,000 AF for Nebraska is fully allocated
o 5,000 AF of the15,000 AF is contracted in Wyoming, the other 10,000 AF is not under short-
term contract.
o One concept is to contract 10,000 AF to the Program. However, under the current renewal
processes, Wyoming is likely to want to contract this water.
o There is uncertainty as to the amount of water available for the Program, especially in
drought years.
o Wyoming is currently looking for water to offset well pumping, and the standing Glendo
account is the first supply.
o Bottom line regarding Glendo storage is that in a drought year, there is no water available to
the Program, at least not in the amounts previously thought.
o Also, Glendo water cannot be submarketed, therefore leasing of water is problematic. If an
entity wants to give up water offered to other uses, this would need to be discussed and
worked out. Or, Wyoming could release water for the Program but could not be reimbursed
for it; this would be marketing.
o If details could be worked out, and the Program could buy water from Reclamation (not
free water), it might work on a temporary basis, but would be hard to contract long term.
Wyoming water is supposed to be used in Wyoming and this might pose export issues.
Reclamation cannot market Wyoming account to Nebraska uses, but may be able to
contract with the Program.
o If the program did have Glendo water, it would likely be released to and delivered by
CNPPID.
Water Leasing:
o Through the EIS process, it was determined that leased water would need to be stored water
for release. Storage releases are protected, whereas natural flow is subject to the next
appropriator diversion and use
o Wyoming law currently limits leasing to 2 years
o Therefore, the EIS tied leasing to storage with approximately 8,000 AF from Casper/Alcova
project
o For example, if a smaller project of 3,000 AF were diverted, assume 50% is consumed,
and 50% is return flow.
o Divided 75%/25%, NE/WYO, if water is below Guernsey (about 50% total efficiency
rule of thumb)
o Say the 3,000 AF corresponds to 1000 acres rested, and 1500 AF consumed, 1500 AF
required to be released to match timing of historic returns.

Conversation With: John Lawson
Page 4
CS-B99-190-00/INI/MEETINGNOTES_W_USBR
o The 1500 AF is shepherded through system, probably in September
o This results in Program buying 3000 AF but only get 1500 AF, and the rest would be
released as natural flow to river.
o The 1500 AF of natural flow cannot make it to Nebraska unless diverted above Tri-State
Dam (except in flood situation)
o This would require an agreement with Reclamation and the diverter.
o An example is Casper/Alcova Irrigation District where Casper benefits from
improvements on system.
o The Contractee cannot market water, this is solely done by Reclamation.
o Another example is Kendrick Storage, a tri-party contract
o 7000 AF, based on what Alcova District would save in a year (no carryover)
o Available between May 1st – September 30th
o City of Casper has not exercised due to the operations cost required by Reclamation.
o The Alcova District contract is a 20 year contract; A leasing contract is likely to be 2-3 years
because at 5 years it may open the right up to abandonment.
o Likely participants:
o Kendrick Project
o Perhaps La Prele users
o No possibility for leasing in Pathfinder because water for sale would go to other accounts
o EIS looked at depletions to reaches (La Prele or Kendrick)
Pathfinder Modification Municipal Account:
o Use of this water for the Program is up to Wyoming. Wyoming could market this water to
Program (the exception). This is spelled out in a stipulation (drafted in 1999 to 2001 when
stipulation was approved).
o However, if Wyoming had the account in place now, it would likely be using it offset ground
water depletions, so might not be available to Program.
o Great uncertainty in terms of yield given hydrologic conditions
o WMS needs to look at it in terms of Wet, Dry, Average conditions
Nebraska Projects:
o Water leasing depends on where you lease the water and how to protect it. Lake
McConaughy may be one possibility. If leased near the habitat, there is a better chance of
being successful of getting water to habitat (w/fewer diversions between).
o Re-Reg reservoirs – The idea is that CNPPID might build, operate, and market storage. Or,
the Program builds a dam but this will be difficult for Program to do.
o There is discussion of an Elm Creek reservoir. This will be discussed at the Governance
Committee. 7,500 AF of storage in addition to flood control, located in a good location
for the Program. Dependent on PMF; issues are big, can drive cost out of control.
o Locating storage near habitat would act as faucet, earlier pulse flows to send slug down
river.
o What about and inflatable dam on the river to create pulse flows as a reregulation
concept?
• Providing the pulse flows will be difficult. Phragmites might pose additional constraint since
they act as a dam to the flow. In addition, flood flow may help dispersion of seeds and plants.

Conversation With: John Lawson
Page 5
CS-B99-190-00/INI/MEETINGNOTES_W_USBR
• Sand Dams – if adversely affected by Program operations, the Program might be held liable;
natural occurrence is different and there is no liability to the Program.
• Program needs to start experimenting with solutions to see what works.
• Modeling on the North Platte system had the following progression:
o Pathfinder model – OPSTUDY format
o Western Water modeled Deer Creek
o Reclamation modified Deer Creek model for Seminoe Dam Requirements
o Added on segments to get to Lewellen
o Any alternative had to be coded in
o The NPRWUM model was modified to produce the NPR-EIS model which was used to
model alternatives on a monthly time step.
o This model gain/loss by reach but does not model return flows.

PRRIP WMS – MEETING NOTES
CS-B99-190-00/INI/MEETINGNOTES_W_ANNBLEED
Conversation With: Ann Bleed By: Jeff Bandy
Of: Nebraska Department of Natural Resources Job Number: 16930.00
Subject: Platte River Recovery Program Water
Management Study File No.:
Date: 9/5/07 Time: 9:00 AM Cross File:
Office Visit/Meeting Telephone Call Telephone No.:
Notes:
Jeff Bandy and Blaine Dwyer of Boyle Engineering, with Becky Mitchell of Headwaters Corp., met
with Ann Bleed of Nebraska Department of Natural Resources on September 5, 2007 to discuss the on-
going Platte River Recovery Implementation Program Water Management Study being prepared by
Boyle.
Ann discussed the role of the Department of Natural Resources (DNR) is to protect streamflow from
unauthorized diversions. As part of this protection, DNR tracks storage releases, including EA water,
downstream to the permitted user. Losses are assessed to storage water in the same manner as natural
flows.
The Natural Resource Districts (NRDs) regulate and manage ground water appropriations in the State.
Legislation in 2004 defined portions of the aquifers to be “hydrologically’ connected with the surface
waters. The 10/50 line defines whether an aquifer is hydrologically connected. From the “Integrated
Water Management Planning Process” publication: “A well located along this line that pumps, for
example 100 acre feet a year for 50 years will cause a depletion to the river equal to 10% of what was
pumped during that 50 years or, in this example, an average per year of 10 acre feet.”. Based on the
10/50 line, the NRDs produce an annual report for each basin and make a determination of whether a
basin is fully appropriated. Once a basin is declared Fully Appropriated, no new uses are permitted, as
these take water away from existing uses. Once a basin is determined to be over appropriated, it remains
so unless evidence exists that the conditions have changed.
Once a basin is deemed to be over appropriated, DNR works with the NRDs and others to develop
integrated management plans. This puts in place a “Depletions Plan” for each basin. The current 3-year
deadline for the integrated development plans expires this September 15. This deadline will likely be
extended 8 months.
Ann mentioned that the Upper Big Blue NRD is involved in a lawsuit to define the groundwater basin
equivalent to the surface water basin boundaries.
Ann provided several pamphlet publications describing the levels of appropriation, surface water and
groundwater basin delineations, and related legislation.
Conversation With:
Page 2
CS-B99-190-00/INI/MEETINGNOTES_W_ANNBLEED
Though basins may be fully appropriated, there is the possibility that some water is available on more of
a piece-meal basis. Planning for the WAP projects needs to move forward since it is likely that the
Program will be competing for other uses of the water supplies remaining. DNR is working with the
NRDs and Districts to determine which projects are viable.
Ann said that there are no new permits for surface water on the Platte since 1993. (Above the confluence
with the Loup Rivers).
Administration of Program Water/ PWAP Model:
The State maintains the accounting of storage releases and natural flows with the use of the Platte Water
Accounting Program (PWAP). PWAP tracks water downstream from gage to gage and assigns losses
and gains as appropriate. Natural flow is tracked separately from storage water. Both types of water are
assigned losses; however, only the natural flow water benefits from any gains. EA water would be
tracked the same as any other storage water. The program starts on the North Platte above Pathfinder
Reservoir and extends downstream on the Platte to Grand Island. The South Platte River is not included
in the model. However, generally speaking the South Platte has a losing reach east of the Colorado State
line and then gains based on return flows from NPPD.
The general operation of the PWAP model is that it tracks water from gage to gage from upstream to
downstream. If a diversion is made, that flow is subtracted from the flow in the river. Conveyance losses
are applied based on the month, not the year type or amount of water. As mentioned above, storage
water only loses water, it does not gain unless there is an additional release. Losses are assigned on a
pro-rata basis to each class of water, based on the upstream gage. If water is diverted through the NPPD
or CNPPID systems, the same loss is applied as if the water were to remain in the river. The calculations
are made on a cfs basis at each gage. Errors in gage readings could be as high as ± 20% on the Platte
due to the movable beds.
PWAP is run daily with out put generated on the order of 28 pages. The model is executed in the
Bridgeport office. Ann provided Tom Hayden’s name and phone number to discuss the model in relation
to operations and Jim Ostiek to discuss programming of the model.
Ann thought the PWAP model may have been reviewed by others on the GC, but wasn’t certain. The
North Platte segments in Wyoming use the same conveyance loss factors as in the North Platte Decree.
Ann suggested PWAP as a possible tool in developing the loss and routing models.
A “Conduct Water Permit” would be required to shepherd Program water downstream to the habitat.
This type of permit protects water not normally in the stream. It will be assessed applicable carriage
losses and cannot be protected from ground water pumping. Each project would likely be assigned its
own permit to protect its water to the point of use.
Related to the losing influence of the ground water pumping, the State is working on offsetting
depletions for diversions after 1997. Otherwise moving water downstream through the system is not a
problem.
Conversation With:
Page 3
CS-B99-190-00/INI/MEETINGNOTES_W_ANNBLEED
The agreement between NPPD/CNPPID in 1954 determines the amount of water returned at the end of
the system based on operations of the Districts.
Nebraska has taken over some of the gaging stations from USGS and makes as many as three
measurements a week depending on the site. Tom Hayden has information on specific sites.
Work on the choke point appears to be proceeding well. However, development is still occurring in the
flood zone. The State does not have jurisdiction over this issue; it is a County zoning issue.
The State is working with the Districts to develop an MOU addressing some of the institutional issues
associated with the Water Action Plan. The primary concern is where to get water for the alternatives.
An issue with ground water management is that for wells prior to 1983, well users cannot be charged for
ground water originating as seepage water. For example the seepage from the Dawson and Gothenburg
canals could be pumped without any ability to charge the well owner.
Legislation allows for “Temporary” water leasing for 20-50 years. The lease can be renewed, but not
obligated for longer terms.
The State and the NRDs will share the cost of the ground water offsets. Payment will be made with
either augmentation or reduced pumping. The solutions will likely require restrictions which will be
painful. If parties cannot agree on the approach, then the issue goes before the “Interrelated Water
Review Board”. The board consists of 5 Governor appointees, and has yet to be used.
Action: Yes No
Ann will send Boyle a fax of a day’s PWAP accounting output. – received.

PRRIP WMS – MEETING NOTES
CS-B99-190-00/INI/MEETINGNOTES_W_DUANEWOODWARD
Conversation With: Duane Woodward By: Jeff Bandy
Of: Central Platte Natural Resource District Job Number: 16930.00
Subject: Platte River Recovery Program Water
Management Study File No.:
Date: 9/5/07 Time: 1:00 PM Cross File:
Office Visit/Meeting Telephone Call Telephone No.:
Notes:
Jeff Bandy and Blaine Dwyer of Boyle Engineering, with Becky Mitchell of Headwaters Corp., met
with Duane Woodward of the Central Platte Natural Resource District on September 5, 2007 to discuss
the on-going Platte River Recovery Implementation Program Water Management Study being prepared
by Boyle.
The Central Platte NRD encompasses 890,000 irrigated acres, with approximately 2,000 to 2,500
landowners. This acreage is supplied by 17,000 wells. In Dawson County, 20,000 to 25,000 acres are
subirrigated lands.
Since 2004 there has been a moratorium on new development of groundwater resources. The CPNRD is
currently finishing up the acreage certification from 2004. The certification is based on imagery from
August 2004. In addition to this imagery, they are also using FSA mapping records and are able to
access data from the last 10 years.
Related to routing Program water through the Central Platte reach (CPNRD), ramping rates are not
likely to be a large concern, but may impact some diverters during the irrigation season. Most irrigation
starts in May of each year, but the Kearney Canal begins diverting in April. A potential constriction
exists near the Gothenburg Canal, but this is currently not defined. It is in the vicinity of the KOA
campground. Constrictions are more likely from Gothenburg upstream to North Platte. There are likely
no constrictions downstream of the J-2 return.
Glen Sanders of the Bureau of Reclamation performed loss work in 1998. He made several transects
near Elm Creek, Overton, Kearney, since about 1996. This work was included in the EIS work as part
of the Technical Report Appendices, Ground Water and River Flow Analysis, May 2001, revised June
2001. This worked showed a strong interaction between river stage and monitoring well levels. The
monitoring wells were located at the river transects. Might be able to calculate bank storage estimate
from stage, with K= 100-200, and S = 0.2.
Duane mentioned that with the high rains around 1998 and 1999, ground water levels were up. During
the drought, levels dropped and are now beginning to recover.
Generally, the river loses water to the alluvium during pumping and high rains, but at other times the
gradient shifts back to the river. CPNRD performs water level mapping in April and Fall of each year.
Conversation With: Duane Woodward
Page 2
CS-B99-190-00/INI/MEETINGNOTES_W_DUANEWOODWARD
Duane has been looking at local storm events and the river’s response. For example, a storm flow at
Grand Island of about 10-11,000 cfs may correspond to flows of 2,000 cfs upstream at Lexington. (Cited
a storm in Spring 2007). This was also seen in a previous analysis where little correlation was shown
between high flows downstream with high flows upstream, due to local storm events.
There is approximately a 3 day travel time from McConaughy to Grand Island area.
A significant rainfall can raise the groundwater elevation 1 foot or so.
Regarding the Program, if releases are made when bank storage is high, this is the best bet to get water
downstream. (By minimizing losses). The majority of pumping begins after June 20th
. Systems in
Dawson County are filling in May – June, so delivery at this time might minimize losses due to
pumping. Once in to July and August, pumping downstream is increasing. Also would be beneficial to
time the release with a rainfall event.
During normal years, the Districts continue to run hydropower (1000 cfs) into the fall, though irrigation
is off.
Based on LB962, Dawson County area is determined to be over appropriated, so CPNRD is undertaking
a surface water modeling effort tied to the COHYST model. The CROPSIM model will be used to
match up stream flows and precipitation and this will feed the surface water model. The linked model
will be useful in analyzing different Offset projects such as the Gothenburg Canal recharge option.
However, the project is not set up to address the Program’s pulse flow concept. HDR is about to start
the project with a duration of about 18 months.
COHYST Project:
The study period in the COHYST model is 1997 to 2048. The study started by reducing acreage, and
then the impact on baseflows. The 2nd
report study period was 1997 to 2005 and looked at surface water
to groundwater conversion. COHYST is also being used to prepare depletion factors based on distance
from the river. This is a result of LB962 and the change from the 10/50 line to 28/40 line. Additional
use of the conjuctive model will be to evaluate recharge pits and the amount of offset they provide.
• Over-appropriated area is upstream of Elm Creek/ Highway 183.
• Initial estimates are that about 50,000 AF need to be offset. This is considered on the high end
and additional study will refine this number.
• COHYST is analyzed by reach, and therefore does not route flows.
• Website: cohyst.dnr.ne.gov
Water Supply Alternatives:
Elm Creek Dam and Reservoir is currently being studied by Olsson and Associates. The reservoir is
being considered for both flood control and water supply purposes. Supply for the reservoir would
come from the end of Dawson County Canal supplied by NPPD. The capacity of the Dawson County
Canal starts at 300 cfs and ends at 5 cfs, therefore the canal would require enlarging. The reservoir is
being considered possibly for meeting offsets, or for Program water. Another possibility is the use of
the reservoir as part of a pump/storage project.
Conversation With: Duane Woodward
Page 3
CS-B99-190-00/INI/MEETINGNOTES_W_DUANEWOODWARD
The current incentive for taking acreage out of production is $2,500 per acre for buyout. Offered by the
District (CPNRD).
There are possible savings through crop conversion. Currently Dawson County produces a lot of alfalfa.
The potential is to convert to corn or another crop with a lower ET. (ET for alfalfa is approximately 36”
vs. 27” for corn.)
Rich Halloway of Tri-Basin NRD, Holdrege can provide more information on groundwater management
and allocation reduction.
WATER MANAGEMENT STUDY, PHASE I EVALUATION OF PULSE FLOWS FOR THE PLATTE RIVER
RECOVERY IMPLEMENTATION PROGRAM
Phase I Report April 8, 2008
APPENDIX 2
WMS Loss Model Update Technical Memorandum and Tables
1
Engineering Excellence Since 1942
215 Union Blvd., Suite 500 Lakewood, CO 80228 TEL: (303)987-3443 FAX: (303)987-3908 www.boyleengineering.com
Employee Owned
Technical Memorandum
To: File
From: Heather Thompson, Jacqueline Arcaris
Project: Platte River Recovery Implementation Program
Re: Water Budget Spreadsheet Model Extension (1995-2006)
Boyle Engineering (Boyle) and Ecological Resource Consultants, Inc. (ERC) has completed an
extension of the Boyle/Water Management Committee (WMC) water budget spreadsheet model
(loss model or model) to include hydrology for the water years (WY) 1995 through 2006. The
original water budget spreadsheet study spanned 20 water years from 1975 through 1994. The model
study period has been extended through WY 2006 to provide for a more comprehensive analysis by
inclusion of the 2002-2006 drought years, some of the driest on record. The following memo
summarizes the data and approach used to extend the model.
Water Budget Spreadsheet Model Overview
A water budget spreadsheet model was developed in 1999 by the WMC and Boyle to route local net
hydrologic effects associated with a water conservation/supply alternative to the critical habitat to
determine the potential reductions to target flow shortages. The water budget spreadsheet model
includes loss factors for 19 study reaches from the headwaters of the North Platte River in Wyoming
and South Platte River in Colorado downstream to Grand Island, Nebraska, as shown in Figure 1
and Table 1. The upstream and downstream ends of each reach are defined by United States
Geologic Survey (USGS) streamflow gages. For each reach, monthly loss factors attributed to
seepage, diversion and evaporation were developed by the WMC for the period from WY 1975
through 1994 from historical records as described in the memorandum, Determination of Monthly
Loss Factors for the Platte River for the Historical 1975-1994 Water Year Period and Addendums 1
through 6 (WMC, January 1999).
Baseline conditions in the model reflect historical inflows and outflows from each reach (USGS
gage data), diversions, evaporation, and other measured inflows from tributaries, canals, reservoir
releases, and wastewater treatment plant returns.
2
Monthly loss factors are developed for diversions, evaporation and seepage. Diversion losses include
the major diversion structures in each reach for which there are records. Diversion losses represent
the gross amount diverted from the stream and do not account for return flows to the river. However,
four hydropower returns (NPPD return, Jeffrey return, J-2 return and Kearney return) are included in
the model as discussed in the Diversion Loss section. Diversion losses can be turned off in any reach
to simulate the protection of water from existing diversions as it is routed to the critical habitat.
Diversion losses are not applied to additional water in reaches for which diversion losses have been
turned off.
Evaporation losses are calculated from estimated river surface evaporation as a function of river
channel width and length, and monthly pan evaporation values from weather stations along the Platte
River. The Modified Blaney-Criddle equation was used when pan evaporation data was not
available.
A water balance is calculated for the flowing river channel to determine the monthly gains and losses
within each reach, as illustrated in Figure 2. Return flows from diversions are included in the
gain/loss term. Seepage losses equal the estimated loss calculated in the water balance analysis.
Seepage losses are zero during months the river is gaining.
The diversion, evaporation and seepage losses are expressed as a percent loss per mile within a given
reach. Percent loss factors are applied to water contributions as they are routed downstream to the
critical habitat. An underlying assumption is that losses are shared by and prorated among all inflows
regardless of where they occur in the reach. After the additional water is routed downstream, the
additions to the streamflow at Grand Island, Nebraska are compared to historical target flow
shortages and excesses to determine reductions to target flow shortages associated with an
alternative.
Available Data and Sources
Boyle and ERC staff collected and reviewed available stream flow, evaporation and diversion
records from WY 1995 through 2006. Data used to develop the loss factors is from:
� USGS
� Northern Colorado Water Conservancy District (NCWCD)
� U.S. Bureau of Reclamation (USBR)
� Colorado Division of Water Resources
� High Plains Regional Climate Center
� Nebraska Department of Natural Resources (NDNR)
� Wyoming State Engineers Office (SEO)
� National Weather Service
� Water Commissioners from various reaches
The same methodology and procedures that are used to develop loss factors for the earlier period
from WY 1975 through 1994 are applied to develop loss factors for the extension period from WY
1995 through 2006. Slight modifications are made where data is limited or missing. The following is
3
a more detailed description of the methodology used to calculate the percent loss factors and any
modifications made to the approach used for the earlier period.
Evaporation Loss
The model uses monthly gross pan evaporation data from several weather stations. The weather
stations in Wyoming along the North Platte River are located at Seminoe Reservoir, Pathfinder
Reservoir, and Whalen Diversion Dam. Due to the lack of weather stations with pan evaporation
data in Colorado along the South Platte River, temperature data from the Greeley, Brighton,
Longmont, Fort Collins, Fort Morgan, Sterling and Julesburg weather stations are used to compute
an open water surface gross evaporation estimate based on the Modified Blaney-Criddle equation.
The weather stations used for analysis in Nebraska are Bridgeport, NE, Kingsley Dam, North Platte
Experimental Farm and Grand Island Airport.
The following modifications are made when pan evaporation data was not available in Nebraska:
� Reaches 14-19 use average evaporation data from the Kingsley, North Platte, and Grand
Island stations for the WY 1975-1995 summer months
� Reach 12 uses the Bridgeport station evaporation data
� Reach 13 uses the average evaporation data from the Kingsley and Bridgeport stations
� All Nebraska reaches use the winter month evaporation data from the Bridgeport station
� Due to the lack of available data for the model extension period, monthly averages for the
period from WY 1975 through 1994 are used for the extension period (evaporation data
deviation from the average is approximately less than 1 inch)
Average monthly evaporation values for Reaches 12, 13, and 14 through 19 are shown below in
Table 2.
The following modifications are made when pan evaporation data was not available in Colorado:
� Reaches 7, 8, 9, and 11 use the Modified Blaney-Criddle equation for the earlier period
� Temperature data from NOAA-NWS weather stations is used to compute an open water
surface gross evaporation
� Reaches 7, 8, 9, and 11 use the Modified Blaney-Criddle equation for the extension period;
however, temperature data is missing for several months or years
� Sterling and Brighton stations use average monthly temperatures for missing data
� Julesburg, Fort Morgan and Longmont stations use monthly temperature data correlated with
the closest station for the overlapping period from WY 1975-2006. Average correlation
factors are developed for each month and are multiplied by the monthly temperature at the
nearest station to fill missing months of data.
Evaporation estimates for Reach 10 in the original study period are an average of:
� Calibrated open water Blaney-Criddle value at Julesburg
� Pan evaporation data from the North Platte weather station
� Summer months values are multiplied by a factor of 0.7
4
� Bridgeport, Nebraska pan evaporation data is used for the winter months because North
Platte did not record winter pan evaporation data
Pan evaporation data is not available for the model extension period after WY 1991 for the North
Platte and Bridgeport stations. Other weather station data from Nebraska were reviewed to
determine whether pan evaporation data is available from a nearby station. However, data from WY
1995 and later at the Kingsley Dam and Grand Island stations is limited because of several days of
missing data each month. Due to the lack of available pan evaporation data, North Platte pan data is
estimated for the period from WY 1995 through 2006 based on a correlation with the modified
Blaney-Criddle value at Julesburg for the overlapping period from WY 1975 through 1991. Average
correlation factors are developed for each month and multiplied by the monthly Blaney-Criddle
values at Julesburg to estimate pan evaporation at the North Platte station. The summer months use
the average calibrated open water Blaney-Criddle value at Julesburg and the estimated pan
evaporation data for the North Platte weather station multiplied by 0.7. The winter months use the
calibrated Blaney-Criddle value at Julesburg.
The monthly gross evaporation, measured in inches, is determined for each reach. The monthly
reach losses due to gross evaporation from the river water surface are calculated using the same
approach for WY 1975-1994. River surface evaporation is calculated as a function of river channel
length and width, and monthly gross evaporation values.
Diversion Loss
Table 3 lists the measured diversions which are included in the water balance calculations and the %
diversion loss factor computations for each reach. Boyle and ERC staff collected and reviewed
available diversion data for the model extension period. Diversions in Colorado are from Colorado’s
Decision Support Systems (CDSS) Hydrobase unless otherwise noted below. Diversions in
Wyoming are from Wyoming SEO. Diversions in Nebraska were obtained from NDNR.
Wyoming and Nebraska monthly diversion data for the extension period is available for all ditches
included in Table 3. Colorado monthly diversion data for the extension period is available for the
majority of ditches included in Table 3. Diversion data was not available for:
� Reach 7 – Buckers Ditch was abandoned
� Reach 9 – Davis Brothers Canal, Sterling No. 2 Canal, Lone Tree Canal, Chambers Ditch,
Tamarack Ditch, and Red Lion Canal for the entire model extension period, because these
ditches are either abandoned or the ditch was transferred to municipal use
� Reach 11 – Ideal Cement, Josh Ames Ditch and Chaffee Ditch because these ditches are
abandoned or data is not recorded
Boyle contacted Brent Schantz, the water commissioner for Districts 1 and 64, who confirmed that
diversions associated with the ditches listed above have been discontinued. He also provided WY
2006 data for Empire Reservoir Inlet Canal in Reach 8.
Mr. Schantz referred Boyle to James Yahn, manager for both the North Sterling and Prewitt
irrigation companies, regarding WY 1995 missing data for Reach 9 Prewitt Reservoir Inlet Canal.
5
Mr. Yahn provided data for the model extension period for both the North Sterling and Prewitt
Reservoirs, which also includes the missing WY 1995 data.
Data for the Fossil Creek Reservoir inlet is from the NCWCD as opposed to the CDSS Hydrobase.
The diversion losses calculated for each reach are gross values and do not account for lagged
groundwater and surface water returns to the river that may result from water being diverted. An
exception to this rule is direct returns to the river from hydropower diversions. The water diverted by
the Korty Canal in Reach 10 is combined with water diverted by NPPD’s Keystone Canal and
returned to the river at their North Platte Hydroplant Return in Reach 15. Table 4 lists the monthly
percent of diverted water returned to the river through NPPD’s North Platte Hydroplant Return from
their Korty and Keystone diversions. Similarly, a portion of the diversion by CNPPID’s Canal in
Reach 15 is returned to the river through the Jeffrey River Return in Reach 16, and a portion is
returned through the Johnson River Return (J-2 Return) in Reach 17. Table 5 lists the monthly
percent of diverted water returned to the river from CNPPID’s diversion. A portion of the water
diverted by the Kearney Canal in Reach 18 is returned to the river in Reach 19. Table 6 lists the
monthly percent of diverted water returned to the river from the Kearney diversion.
Seepage Loss
A monthly water balance is calculated for the river channel within each reach. Net gains/losses are
computed as the sum of measured outflows minus the sum of measured inflows. The gain/loss term
for each reach is as follows:
Gain/Loss = Outflows – Inflows
Where:
Outflows = Downstream Measured Gage Outflow + Evaporation + Diversions
Inflows = Upstream Measured Gage Inflow + Other Measured Inflows
Outflows are the gauged flow at the downstream end of the reach, plus all measured diversions, plus
monthly gross evaporation. Inflows are the gauged flow at the upstream end of the reach plus other
measured inflows such as tributary inflows, hydropower/canal returns, reservoir releases, and
wastewater treatment plant returns.
Gage data is from USGS and NDNR. The Wyoming Alcova gage (downstream gage in Reach 2)
was discontinued in WY 1998 because it was inundated by Grey Reef Reservoir. Alcova Reservoir
releases, provided by the USBR, are used in place of gage data for the extension period. Evaporation
and total diversions for each reach are calculated as discussed in the previous sections. Other
measured inflows for each reach are listed in Table 7 and are not available for the model extension
period, so they are not included in the water balance calculation. Data is not available for the
Lodgepole Creek near Ralton, Nebraska gage after WY 1979. Release data for Bijou Reservoir is not
available after WY 1992 and Bijou Creek gage data is not available after WY 1987. The Birdwood
Creek gage switched to summer month operation only from WY 1995 through 1999. There was no
6
flow in September 2002 for all diversion canals in Reach 16. The Kearney Power Return gage was
only operational in the summer months from WY 1989 through 2004.
Development of Loss Factors
The evaporation, diversion and seepage loss factors are calculated by dividing the monthly reach
loss (evaporation, diversion and seepage) by the sum of all inflows in each reach where:
Sum of All Inflows = Upstream Measured Gage Inflow + Other Measured Inflows + Positive
Net Gains Computed in River Water Balance
For example, the monthly loss factor due to diversions is calculated as the ratio of total measured
diversions divided by the “Sum of All Inflows” for each reach. Months with negative value water
balance calculation (i.e. a loss) has a percent loss factor due to seepage. Seepage loss factors are zero
during months the river is gaining. The loss factors are divided by the number of miles in each reach
and multiplied by 100 to develop the percent loss factors per mile for each reach. These percent loss
factors are incorporated in the water budget spreadsheet model. Tables of the percent loss factors per
mile (Percent Evaporation, Seep, and Diversion) are attached in Addendum 1 for the 19 Reaches.
Changes Made to Loss Factors for the Earlier Period (1975 through 1994)
Earlier period data was checked to a limited degree and corrected if errors were found. The
following changes made to loss factors for the earlier period were incorporated in the updated water
budget spreadsheet.
� Henderson gage data for Reach 7 in the Colorado loss factor spreadsheet (SPloss.xls) was
incorrect for months November and December in years 1982 through 1994. The correct data
was obtained from USGS.
� Diversion data for Reach 7 in the Colorado loss factor spreadsheet (SPloss.xls) was incorrect
for months November and December in years 1982 through 1994. This data was replaced
with the correct Evans No. 2 diversion data from CDSS Hydrobase.
� Korty Canal, Keystone, CNPPID Canal, Western Canal diversions and Kearney, Jeffrey,
Southerland, and Johnson return data in the Nebraska loss factor spreadsheet (PRNEloss.xls)
were incorrect in the online database in several months for the earlier period. The loss and
return flow factors in the affected reaches (10, 16 and 17) were changed based on hard-copy
annual report data provided by NDNR.
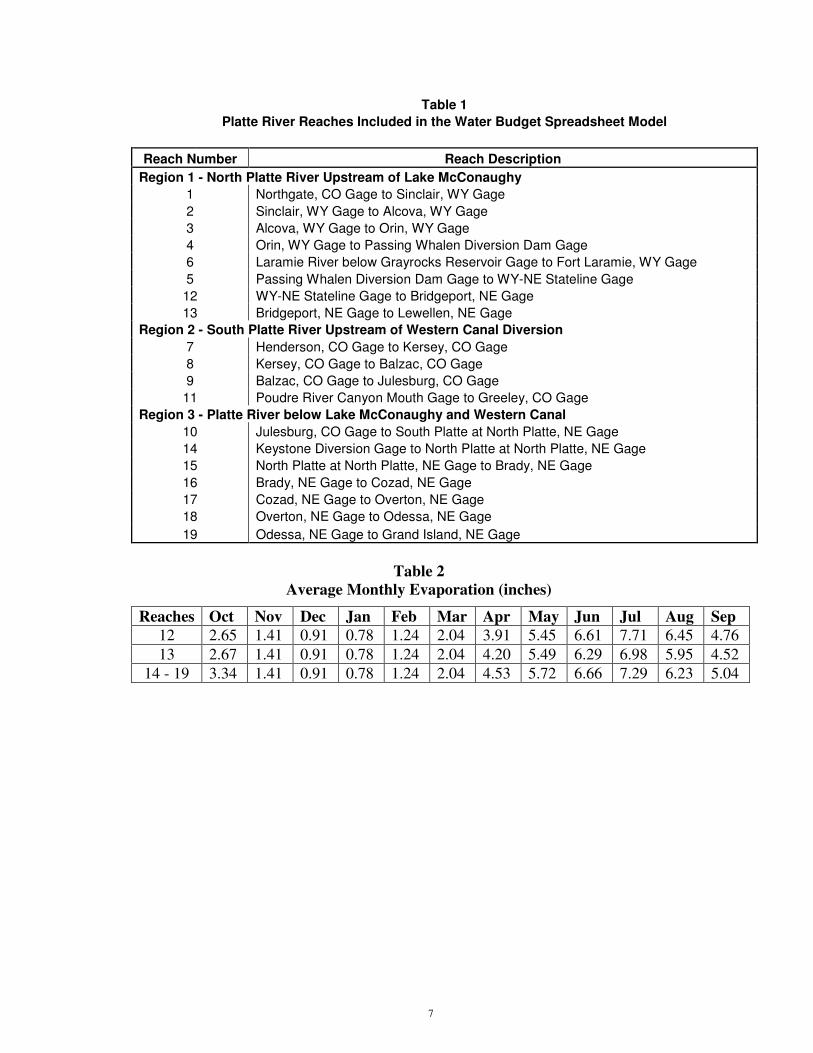
7
Table 1
Platte River Reaches Included in the Water Budget Spreadsheet Model
Reach Number Reach Description
Region 1 - North Platte River Upstream of Lake McConaughy
1 Northgate, CO Gage to Sinclair, WY Gage
2 Sinclair, WY Gage to Alcova, WY Gage
3 Alcova, WY Gage to Orin, WY Gage
4 Orin, WY Gage to Passing Whalen Diversion Dam Gage
6 Laramie River below Grayrocks Reservoir Gage to Fort Laramie, WY Gage
5 Passing Whalen Diversion Dam Gage to WY-NE Stateline Gage
12 WY-NE Stateline Gage to Bridgeport, NE Gage
13 Bridgeport, NE Gage to Lewellen, NE Gage
Region 2 - South Platte River Upstream of Western Canal Diversion
7 Henderson, CO Gage to Kersey, CO Gage
8 Kersey, CO Gage to Balzac, CO Gage
9 Balzac, CO Gage to Julesburg, CO Gage
11 Poudre River Canyon Mouth Gage to Greeley, CO Gage
Region 3 - Platte River below Lake McConaughy and Western Canal
10 Julesburg, CO Gage to South Platte at North Platte, NE Gage
14 Keystone Diversion Gage to North Platte at North Platte, NE Gage
15 North Platte at North Platte, NE Gage to Brady, NE Gage
16 Brady, NE Gage to Cozad, NE Gage
17 Cozad, NE Gage to Overton, NE Gage
18 Overton, NE Gage to Odessa, NE Gage
19 Odessa, NE Gage to Grand Island, NE Gage
Table 2
Average Monthly Evaporation (inches)
Reaches Oct Nov Dec Jan Feb Mar Apr May Jun Jul Aug Sep
12 2.65 1.41 0.91 0.78 1.24 2.04 3.91 5.45 6.61 7.71 6.45 4.76
13 2.67 1.41 0.91 0.78 1.24 2.04 4.20 5.49 6.29 6.98 5.95 4.52
14 - 19 3.34 1.41 0.91 0.78 1.24 2.04 4.53 5.72 6.66 7.29 6.23 5.04
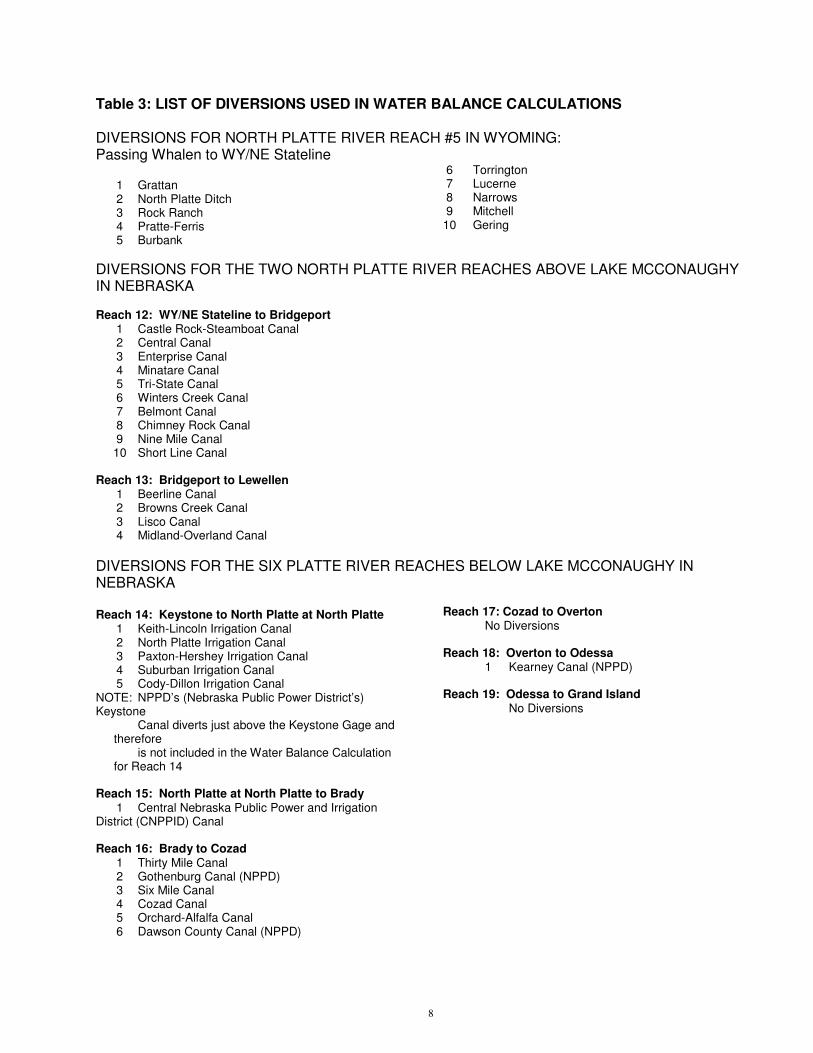
8
Table 3: LIST OF DIVERSIONS USED IN WATER BALANCE CALCULATIONS DIVERSIONS FOR NORTH PLATTE RIVER REACH #5 IN WYOMING: Passing Whalen to WY/NE Stateline 1 Grattan 2 North Platte Ditch 3 Rock Ranch 4 Pratte-Ferris 5 Burbank
6 Torrington 7 Lucerne 8 Narrows 9 Mitchell 10 Gering
DIVERSIONS FOR THE TWO NORTH PLATTE RIVER REACHES ABOVE LAKE MCCONAUGHY IN NEBRASKA
Reach 12: WY/NE Stateline to Bridgeport 1 Castle Rock-Steamboat Canal 2 Central Canal 3 Enterprise Canal 4 Minatare Canal 5 Tri-State Canal 6 Winters Creek Canal 7 Belmont Canal 8 Chimney Rock Canal 9 Nine Mile Canal 10 Short Line Canal
Reach 13: Bridgeport to Lewellen 1 Beerline Canal 2 Browns Creek Canal 3 Lisco Canal 4 Midland-Overland Canal
DIVERSIONS FOR THE SIX PLATTE RIVER REACHES BELOW LAKE MCCONAUGHY IN NEBRASKA Reach 14: Keystone to North Platte at North Platte 1 Keith-Lincoln Irrigation Canal 2 North Platte Irrigation Canal 3 Paxton-Hershey Irrigation Canal 4 Suburban Irrigation Canal 5 Cody-Dillon Irrigation Canal NOTE: NPPD’s (Nebraska Public Power District’s) Keystone
Canal diverts just above the Keystone Gage and therefore is not included in the Water Balance Calculation for Reach 14
Reach 15: North Platte at North Platte to Brady 1 Central Nebraska Public Power and Irrigation District (CNPPID) Canal
Reach 16: Brady to Cozad 1 Thirty Mile Canal 2 Gothenburg Canal (NPPD) 3 Six Mile Canal 4 Cozad Canal 5 Orchard-Alfalfa Canal 6 Dawson County Canal (NPPD)
Reach 17: Cozad to Overton No Diversions Reach 18: Overton to Odessa 1 Kearney Canal (NPPD) Reach 19: Odessa to Grand Island
No Diversions

9
TABLE 3: LIST OF DIVERSIONS (Continued) DIVERSIONS FOR THE FIVE SOUTH PLATTE RIVER REACHES
Reach 7: Henderson to Kersey, Colorado 1 Brighton Canal 2 Lupton Bottom Canal 3 Platteville Irrigation 4 Side Hill / Meadow Island 1 5 Platte Valley System 6 Mutual / Beeman-Meadow Island 2 7 Buckers Canal 8 Farmers Independent Canal 9 Western Canal 10 Jay Thomas Canal 11 Union Ditch 12 Godfrey Canal 13 Lower Latham Canal 14 Patterson Canal 15 Highland / Plumb Canal
Reach 8: Kersey to Balzac, Colorado 1 Empire Reservoir Inlet Canal 2 Riverside System 3 Illinois Canal 4 Bijou System (includes Corona Ranch / Putnam) 5 Jackson Lake Inlet Canal 6 Weldon Valley Canal 7 Fort Morgan Canal 8 Deuel and Snyder Canal 9 Upper Platte and Beaver Canal 10 Tremont / Smith-Snyder Canal 11 Lower Platte and Beaver Canal 12 North Sterling Reservoir Inlet Canal 13 Union Canal 14 Tetsel Canal 15 Prewitt Reservoir Inlet Canal 16 Johnson-Edwards Canal NOTE: Balzac Gage was moved upstream 6 miles in
Oct 1987 which resulted in the Tetsel, Prewitt Res Inlet, and Johnson-Edwards being downstream of the Gage since Oct. 1987. This is accounted for in the Reach Water Balance Calculations
Reach 9: Balzac to Julesburg, Colorado 1 South Platte Canal 2 Farmers-Pawnee Canal 3 Davis Brothers Canal 4 Schneider Canal 5 Springdale Canal 6 Sterling No 1 Irrigation Co Canal 7 Sterling No 2 Canal 8 Henderson Smith 9 Lowline Canal 10 Bravo Canal 11 Farmers Canal 12 Iliff and Platte Valley Canal 13 Lone Tree Canal 14 Powell Canal 15 Ramsey Canal 16 Chambers Ditch 17 Harmony No 1 Canal / Julesburg Reservoir Inlet 18 Tamarack Ditch 19 Red Lion Canal
20 Peterson Canal 21 South Reservation Canal 22 Liddle Ditch 23 Carlson Canal Reach 10: Julesburg, Colorado to South Platte at North Platte, Nebraska 1 Western Canal 2 Korty Canal (NPPD; Nebraska Public Power District)
Reach 11: Cache la Poudre River Canyon Mouth to Greeley, Colorado 1 Greeley Pipeline 2 Pleasant Valley and Lake Canal 3 Larimer County Canal 4 Jackson Ditch 5 Little Cache Ditch 6 Taylor and Gill 7 New Mercer 8 Larimer No 2 9 Ideal Cement 10 Arthur Ditch 11 Larimer and Weld Canal 12 Josh Ames 13 Lake Canal 14 Coy Ditch 15 Timnath Reservoir Inlet Canal 16 Chaffee Ditch 17 Boxelder Ditch 18 Fossil Creek Reservoir Inlet 19 Greeley No 2 Canal 20 Whitney Ditch 21 B.H. Eaton Ditch 22 Jones Ditch 23 Greeley No 3 Canal 24 Boyd-Freeman Ditch 25 Ogilvy Ditch

10
Table 4
NPPD Percent of Water Returned through the North Platte Hydro Return
Water Yr Oct Nov Dec Jan Feb Mar Apr May Jun Jul Aug Sep
1975 104% 117% 53% 66% 71% 107% 65% 91% 58% 94% 100% 59%
1976 95% 106% 50% 60% 82% 88% 92% 92% 46% 86% 377% 0%
1977 0% 30% 70% 74% 82% 53% 56% 50% 58% 88% 106% 84%
1978 60% 74% 73% 71% 60% 83% 106% 63% 60% 91% 101% 89%
1979 68% 69% 71% 67% 54% 54% 72% 85% 49% 90% 87% 120%
1980 52% 34% 83% 102% 80% 67% 101% 93% 69% 92% 104% 109%
1981 65% 59% 69% 81% 96% 89% 66% 67% 61% 90% 131% 59%
1982 109% 51% 88% 87% 95% 89% 66% 45% 45% 86% 93% 65%
1983 230% 87% 81% 71% 80% 78% 94% 96% 83% 74% 88% 85%
1984 0% 84% 73% 68% 82% 86% 92% 74% 67% 89% 94% 85%
1985 85% 90% 94% 99% 75% 81% 87% 66% 81% 86% 99% 71%
1986 88% 90% 82% 80% 91% 77% 83% 87% 72% 88% 93% 90%
1987 63% 81% 85% 97% 95% 72% 86% 87% 81% 93% 100% 95%
1988 79% 74% 94% 68% 67% 83% 85% 80% 77% 81% 103% 81%
1989 57% 70% 59% 78% 83% 75% 58% 66% 68% 95% 94% 60%
1990 70% 54% 55% 63% 70% 71% 83% 75% 72% 85% 99% 81%
1991 84% 52% 54% 47% 50% 69% 57% 57% 70% 82% 88% 60%
1992 208% 35% 41% 53% 64% 80% 72% 69% 68% 80% 82% 77%
1993 42% 75% 69% 65% 76% 97% 51% 53% 38% 75% 96% 71%
1994 86% 85% 82% 82% 83% 78% 53% 84% 63% 85% 94% 66%
1995 83% 62% 63% 63% 58% 64% 55% 69% 82% 86% 90% 93%
1996 90% 88% 76% 72% 73% 83% 82% 76% 78% 84% 97% 91%
1997 82% 90% 72% 71% 87% 98% 83% 82% 76% 83% 81% 82%
1998 121% 82% 82% 75% 92% 81% 80% 88% 89% 87% 95% 82%
1999 93% 90% 76% 76% 95% 86% 79% 78% 80% 88% 84% 95%
2000 88% 91% 93% 91% 86% 89% 87% 82% 81% 84% 92% 79%
2001 90% 86% 76% 79% 77% 88% 75% 73% 77% 94% 83% 78%
2002 111% 57% 90% 76% 79% 71% 66% 61% 75% 93% 80% 58%
2003 161% 14% 47% 45% 39% 52% 56% 57% 54% 88% 89% 23%
2004 0% 0% 0% 43% 29% 295% 37% 76% 62% 87% 94% 17%
2005 0% 0% 0% 5% 0% 0% 0% 30% 51% 89% 84% 22%
2006 0% 0% 0% 0% 0% 0% 0% 40% 66% 89% 86% 4%
Max 230% 117% 94% 102% 96% 295% 106% 96% 89% 95% 377% 120%
Min 0% 0% 0% 0% 0% 0% 0% 30% 38% 74% 80% 0%
Avg 80% 65% 66% 68% 70% 81% 69% 72% 67% 87% 103% 70%
Note: Percent of NPPD diversions returned through the North Platte Hydro Return = NPPD Return/(Korty Diversion + Keystone Diversion) * 100
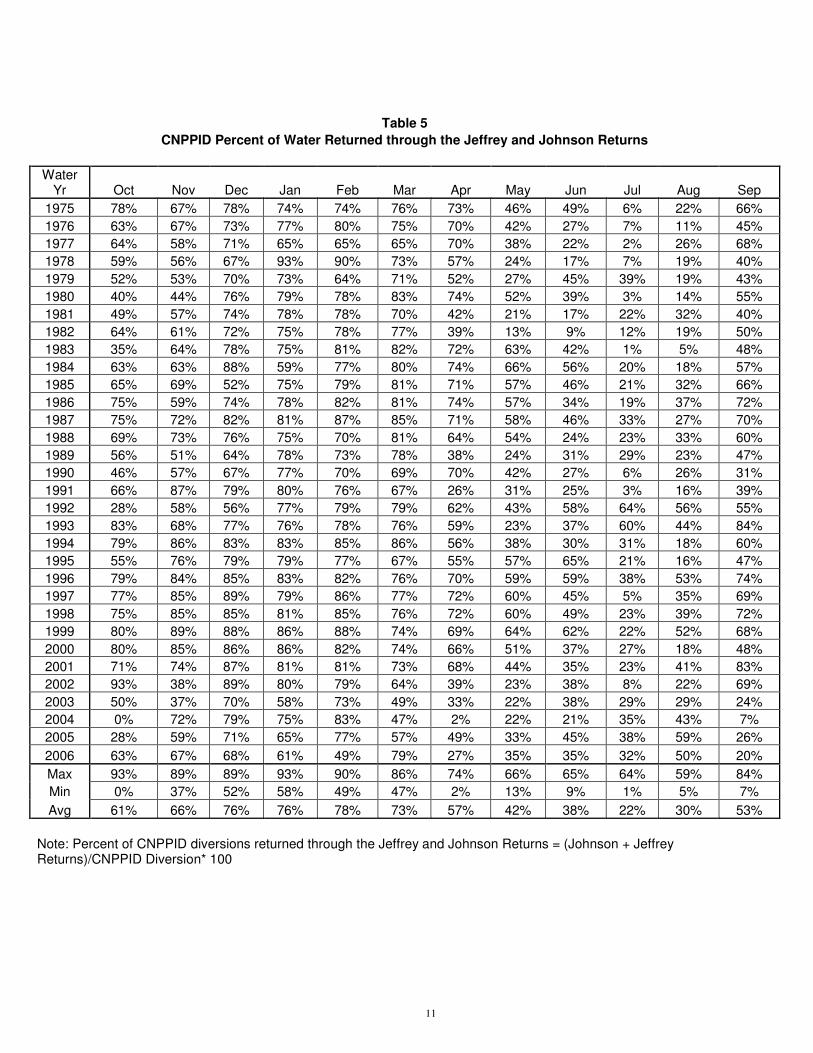
11
Table 5
CNPPID Percent of Water Returned through the Jeffrey and Johnson Returns
Water Yr Oct Nov Dec Jan Feb Mar Apr May Jun Jul Aug Sep
1975 78% 67% 78% 74% 74% 76% 73% 46% 49% 6% 22% 66%
1976 63% 67% 73% 77% 80% 75% 70% 42% 27% 7% 11% 45%
1977 64% 58% 71% 65% 65% 65% 70% 38% 22% 2% 26% 68%
1978 59% 56% 67% 93% 90% 73% 57% 24% 17% 7% 19% 40%
1979 52% 53% 70% 73% 64% 71% 52% 27% 45% 39% 19% 43%
1980 40% 44% 76% 79% 78% 83% 74% 52% 39% 3% 14% 55%
1981 49% 57% 74% 78% 78% 70% 42% 21% 17% 22% 32% 40%
1982 64% 61% 72% 75% 78% 77% 39% 13% 9% 12% 19% 50%
1983 35% 64% 78% 75% 81% 82% 72% 63% 42% 1% 5% 48%
1984 63% 63% 88% 59% 77% 80% 74% 66% 56% 20% 18% 57%
1985 65% 69% 52% 75% 79% 81% 71% 57% 46% 21% 32% 66%
1986 75% 59% 74% 78% 82% 81% 74% 57% 34% 19% 37% 72%
1987 75% 72% 82% 81% 87% 85% 71% 58% 46% 33% 27% 70%
1988 69% 73% 76% 75% 70% 81% 64% 54% 24% 23% 33% 60%
1989 56% 51% 64% 78% 73% 78% 38% 24% 31% 29% 23% 47%
1990 46% 57% 67% 77% 70% 69% 70% 42% 27% 6% 26% 31%
1991 66% 87% 79% 80% 76% 67% 26% 31% 25% 3% 16% 39%
1992 28% 58% 56% 77% 79% 79% 62% 43% 58% 64% 56% 55%
1993 83% 68% 77% 76% 78% 76% 59% 23% 37% 60% 44% 84%
1994 79% 86% 83% 83% 85% 86% 56% 38% 30% 31% 18% 60%
1995 55% 76% 79% 79% 77% 67% 55% 57% 65% 21% 16% 47%
1996 79% 84% 85% 83% 82% 76% 70% 59% 59% 38% 53% 74%
1997 77% 85% 89% 79% 86% 77% 72% 60% 45% 5% 35% 69%
1998 75% 85% 85% 81% 85% 76% 72% 60% 49% 23% 39% 72%
1999 80% 89% 88% 86% 88% 74% 69% 64% 62% 22% 52% 68%
2000 80% 85% 86% 86% 82% 74% 66% 51% 37% 27% 18% 48%
2001 71% 74% 87% 81% 81% 73% 68% 44% 35% 23% 41% 83%
2002 93% 38% 89% 80% 79% 64% 39% 23% 38% 8% 22% 69%
2003 50% 37% 70% 58% 73% 49% 33% 22% 38% 29% 29% 24%
2004 0% 72% 79% 75% 83% 47% 2% 22% 21% 35% 43% 7%
2005 28% 59% 71% 65% 77% 57% 49% 33% 45% 38% 59% 26%
2006 63% 67% 68% 61% 49% 79% 27% 35% 35% 32% 50% 20%
Max 93% 89% 89% 93% 90% 86% 74% 66% 65% 64% 59% 84%
Min 0% 37% 52% 58% 49% 47% 2% 13% 9% 1% 5% 7%
Avg 61% 66% 76% 76% 78% 73% 57% 42% 38% 22% 30% 53%
Note: Percent of CNPPID diversions returned through the Jeffrey and Johnson Returns = (Johnson + Jeffrey Returns)/CNPPID Diversion* 100
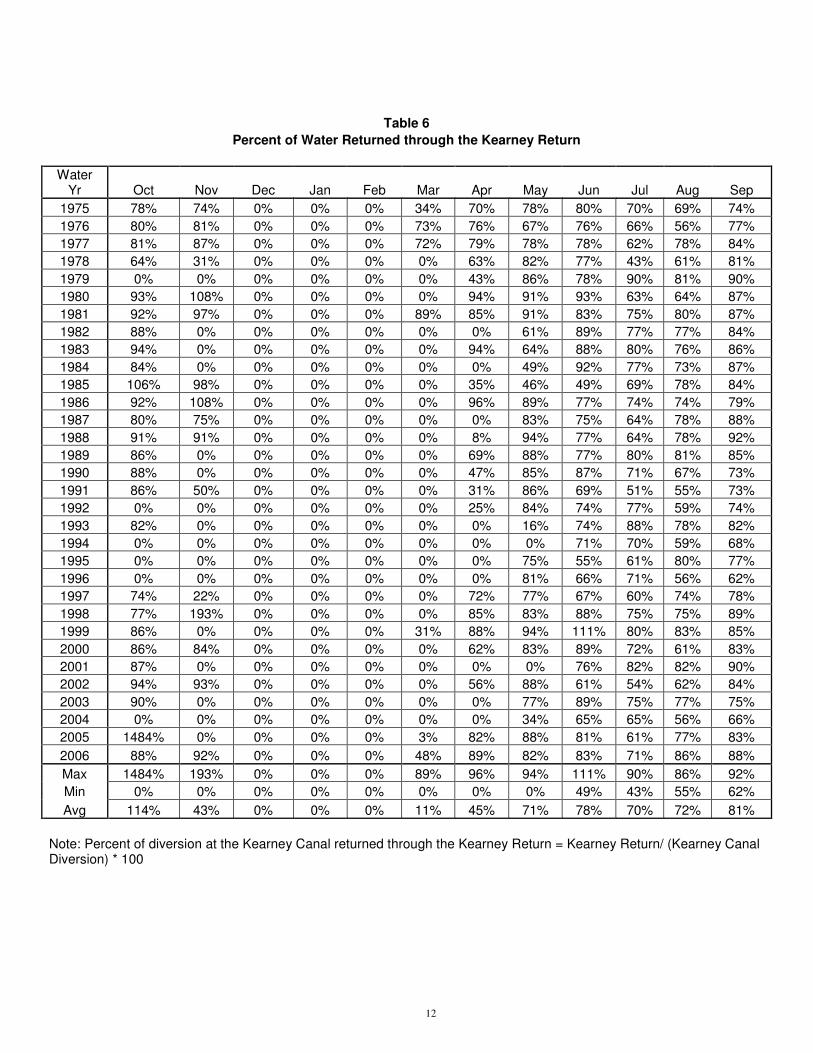
12
Table 6
Percent of Water Returned through the Kearney Return
Water Yr Oct Nov Dec Jan Feb Mar Apr May Jun Jul Aug Sep
1975 78% 74% 0% 0% 0% 34% 70% 78% 80% 70% 69% 74%
1976 80% 81% 0% 0% 0% 73% 76% 67% 76% 66% 56% 77%
1977 81% 87% 0% 0% 0% 72% 79% 78% 78% 62% 78% 84%
1978 64% 31% 0% 0% 0% 0% 63% 82% 77% 43% 61% 81%
1979 0% 0% 0% 0% 0% 0% 43% 86% 78% 90% 81% 90%
1980 93% 108% 0% 0% 0% 0% 94% 91% 93% 63% 64% 87%
1981 92% 97% 0% 0% 0% 89% 85% 91% 83% 75% 80% 87%
1982 88% 0% 0% 0% 0% 0% 0% 61% 89% 77% 77% 84%
1983 94% 0% 0% 0% 0% 0% 94% 64% 88% 80% 76% 86%
1984 84% 0% 0% 0% 0% 0% 0% 49% 92% 77% 73% 87%
1985 106% 98% 0% 0% 0% 0% 35% 46% 49% 69% 78% 84%
1986 92% 108% 0% 0% 0% 0% 96% 89% 77% 74% 74% 79%
1987 80% 75% 0% 0% 0% 0% 0% 83% 75% 64% 78% 88%
1988 91% 91% 0% 0% 0% 0% 8% 94% 77% 64% 78% 92%
1989 86% 0% 0% 0% 0% 0% 69% 88% 77% 80% 81% 85%
1990 88% 0% 0% 0% 0% 0% 47% 85% 87% 71% 67% 73%
1991 86% 50% 0% 0% 0% 0% 31% 86% 69% 51% 55% 73%
1992 0% 0% 0% 0% 0% 0% 25% 84% 74% 77% 59% 74%
1993 82% 0% 0% 0% 0% 0% 0% 16% 74% 88% 78% 82%
1994 0% 0% 0% 0% 0% 0% 0% 0% 71% 70% 59% 68%
1995 0% 0% 0% 0% 0% 0% 0% 75% 55% 61% 80% 77%
1996 0% 0% 0% 0% 0% 0% 0% 81% 66% 71% 56% 62%
1997 74% 22% 0% 0% 0% 0% 72% 77% 67% 60% 74% 78%
1998 77% 193% 0% 0% 0% 0% 85% 83% 88% 75% 75% 89%
1999 86% 0% 0% 0% 0% 31% 88% 94% 111% 80% 83% 85%
2000 86% 84% 0% 0% 0% 0% 62% 83% 89% 72% 61% 83%
2001 87% 0% 0% 0% 0% 0% 0% 0% 76% 82% 82% 90%
2002 94% 93% 0% 0% 0% 0% 56% 88% 61% 54% 62% 84%
2003 90% 0% 0% 0% 0% 0% 0% 77% 89% 75% 77% 75%
2004 0% 0% 0% 0% 0% 0% 0% 34% 65% 65% 56% 66%
2005 1484% 0% 0% 0% 0% 3% 82% 88% 81% 61% 77% 83%
2006 88% 92% 0% 0% 0% 48% 89% 82% 83% 71% 86% 88%
Max 1484% 193% 0% 0% 0% 89% 96% 94% 111% 90% 86% 92%
Min 0% 0% 0% 0% 0% 0% 0% 0% 49% 43% 55% 62%
Avg 114% 43% 0% 0% 0% 11% 45% 71% 78% 70% 72% 81%
Note: Percent of diversion at the Kearney Canal returned through the Kearney Return = Kearney Return/ (Kearney Canal Diversion) * 100

13
Table 7
Other Measured Inflows Included in the Water Balance Calculation
Reach Number Other Measured Inflows
Region 1 - North Platte River Upstream of Lake McConaughy
1 None
2 None
3 None
4 None
6 None
5 None
12 Horse Creek
Sheep Creek
Dry Spottedtail Creek
Tub Springs
Winters Creek
Gering Creek
Ninemile Creek
Bayard Sugar Facotry Creek
Red Willow Creek
13 Pumpkin Creek
Blue Creek
Region 2 - South Platte River Upstream of Western Canal Diversion
7 C-BT South Platte Supply Canal
St. Vrain Creek
Big Thompson River
Cache La Poudre River
8 Riverside Outlet Canal1
Jackson Lake Outlet Canal
Bijou Creek and Bijou No. 2 Outlet Canal
9 Prewitt Reservoir Outlet Canal
Lodgepole Creek at Ralton, NE2
11 C-BT Charles Hansen Supply Canal
Claymore Lake
Seeley Lake
Fossil Creek Reservoir
Canal #3 Returns
Ft. Collins, Greeley, Box Elder, Kodak and Windsor WWTP Returns
Region 3 - Platte River below Lake McConaughy and Western Canal
10 None
14 Birdwood Creek
15 NPPD North Platte Hydro Return and South Platte River
16 Jeffrey Return
17 Johnson River Return
18 None
19 Kearney Return
Notes: 1) The Riverside Reservoir Outlet Canal releases water to Jackson Lake and Bijou Reservoirs, which then
release water to the South Platte River. These releases are included in Jackson Lake and Bijou Reservoir releases.
2) Lodgepole Creek at Ralton, NE was …
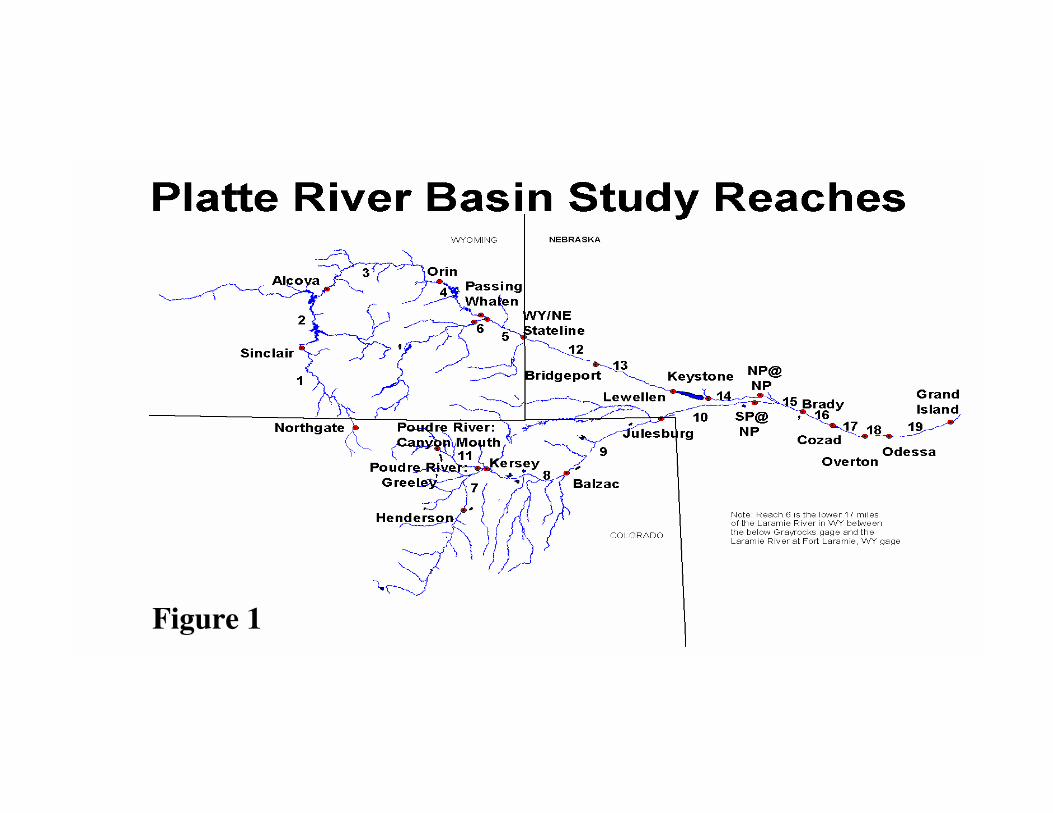
Figure 1
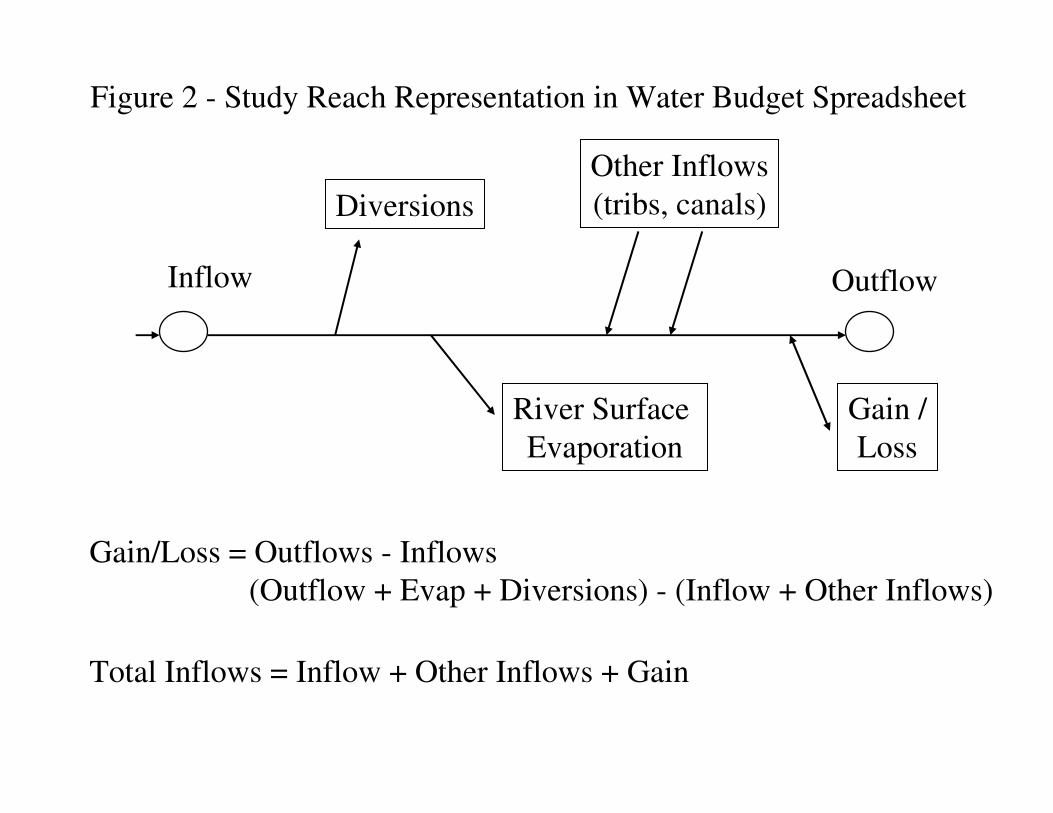
Inflow Outflow
Diversions
River Surface
Evaporation
Other Inflows
(tribs, canals)
Gain /
Loss
Gain/Loss = Outflows - Inflows
(Outflow + Evap + Diversions) - (Inflow + Other Inflows)
Total Inflows = Inflow + Other Inflows + Gain
Figure 2 - Study Reach Representation in Water Budget Spreadsheet

% EVAP PER MILEReach 1 Northgate (Co/WY Stateline) Gage to Sinclair Gage Length 100 miles% Evap = Evap divided by Total Inflow to the Reach multiplied by 100
Wtr Yr Oct Nov Dec Jan Feb Mar Apr May Jun Jul Aug Sep1975 0.0242 0.0105 0.0066 0.0047 0.0062 0.0120 0.0087 0.0039 0.0038 0.0072 0.0284 0.04161976 0.0321 0.0141 0.0115 0.0046 0.0069 0.0171 0.0107 0.0052 0.0062 0.0180 0.0316 0.04111977 0.0315 0.0162 0.0094 0.0095 0.0172 0.0149 0.0139 0.0096 0.0174 0.0716 0.0606 0.07181978 0.0493 0.0170 0.0109 0.0052 0.0062 0.0150 0.0109 0.0048 0.0035 0.0088 0.0280 0.04961979 0.0345 0.0123 0.0068 0.0053 0.0066 0.0097 0.0087 0.0028 0.0038 0.0112 0.0199 0.04411980 0.0316 0.0155 0.0081 0.0048 0.0068 0.0076 0.0066 0.0018 0.0052 0.0160 0.0472 0.04451981 0.0244 0.0150 0.0092 0.0104 0.0159 0.0206 0.0239 0.0077 0.0107 0.0306 0.0535 0.05661982 0.0207 0.0200 0.0150 0.0113 0.0108 0.0124 0.0116 0.0038 0.0030 0.0058 0.0164 0.01451983 0.0094 0.0061 0.0030 0.0046 0.0072 0.0086 0.0052 0.0032 0.0016 0.0040 0.0115 0.02391984 0.0149 0.0089 0.0035 0.0045 0.0037 0.0041 0.0047 0.0020 0.0025 0.0061 0.0116 0.01281985 0.0071 0.0080 0.0041 0.0035 0.0031 0.0064 0.0052 0.0039 0.0061 0.0168 0.0340 0.03281986 0.0144 0.0054 0.0075 0.0089 0.0044 0.0080 0.0049 0.0032 0.0027 0.0084 0.0223 0.01921987 0.0078 0.0051 0.0077 0.0120 0.0096 0.0068 0.0096 0.0062 0.0207 0.0390 0.0458 0.05611988 0.0337 0.0103 0.0045 0.0051 0.0066 0.0027 0.0059 0.0039 0.0055 0.0248 0.0615 0.05781989 0.0335 0.0135 0.0063 0.0117 0.0053 0.0062 0.0096 0.0104 0.0114 0.0431 0.0406 0.04411990 0.0339 0.0167 0.0053 0.0123 0.0105 0.0082 0.0075 0.0082 0.0062 0.0151 0.0368 0.03841991 0.0285 0.0111 0.0035 0.0144 0.0126 0.0117 0.0093 0.0058 0.0075 0.0272 0.0366 0.03931992 0.0359 0.0057 0.0098 0.0083 0.0111 0.0102 0.0157 0.0099 0.0105 0.0224 0.0453 0.05611993 0.0282 0.0143 0.0098 0.0044 0.0045 0.0080 0.0056 0.0035 0.0025 0.0105 0.0215 0.02541994 0.0118 0.0046 0.0027 0.0078 0.0029 0.0071 0.0083 0.0057 0.0134 0.0448 0.0657 0.07311995 0.0205 0.0186 0.0092 0.0056 0.0039 0.0081 0.0104 0.0027 0.0023 0.0043 0.0208 0.02131996 0.0112 0.0059 0.0044 0.0092 0.0084 0.0045 0.0032 0.0025 0.0036 0.0116 0.0286 0.03101997 0.0124 0.0046 0.0058 0.0041 0.0049 0.0074 0.0059 0.0026 0.0023 0.0118 0.0150 0.00971998 0.0046 0.0018 0.0031 0.0033 0.0049 0.0026 0.0072 0.0054 0.0036 0.0091 0.0156 0.02811999 0.0098 0.0108 0.0069 0.0068 0.0060 0.0115 0.0052 0.0047 0.0031 0.0131 0.0255 0.02082000 0.0180 0.0147 0.0114 0.0086 0.0051 0.0071 0.0067 0.0049 0.0089 0.0442 0.0831 0.04552001 0.0153 0.0055 0.0035 0.0038 0.0035 0.0051 0.0092 0.0053 0.0150 0.0475 0.0662 0.04902002 0.0258 0.0118 0.0082 0.0101 0.0142 0.0070 0.0109 0.0341 0.0370 0.1299 0.1584 0.10432003 0.0265 0.0049 0.0076 0.0076 0.0043 0.0027 0.0106 0.0066 0.0035 0.0333 0.0607 0.03852004 0.0265 0.0046 0.0070 0.0089 0.0143 0.0087 0.0106 0.0085 0.0085 0.0154 0.0445 0.02322005 0.0074 0.0052 0.0054 0.0055 0.0039 0.0121 0.0037 0.0038 0.0039 0.0157 0.0279 0.05072006 0.0104 0.0140 0.0049 0.0067 0.0030 0.0071 0.0074 0.0031 0.0058 0.0253 0.0485 0.0213Avg 0.0217 0.0104 0.0070 0.0073 0.0073 0.0088 0.0087 0.0059 0.0075 0.0248 0.0410 0.0402Max 0.0493 0.0200 0.0150 0.0144 0.0172 0.0206 0.0239 0.0341 0.0370 0.1299 0.1584 0.1043Min 0.0046 0.0018 0.0027 0.0033 0.0029 0.0026 0.0032 0.0018 0.0016 0.0040 0.0115 0.0097Std 0.0109 0.0049 0.0029 0.0030 0.0039 0.0041 0.0040 0.0056 0.0071 0.0245 0.0277 0.0198
% SEEP PER MILEReach 1 Northgate (Co/WY Stateline) Gage to Sinclair Gage Length 100 miles% Seep = Seep divided by Total Inflow to the Reach multiplied by 100
Wtr Yr Oct Nov Dec Jan Feb Mar Apr May Jun Jul Aug Sep19751976197719781979198019811982198319841985198619871988198919901991199219931994199519961997199819992000200120022003200420052006

% DIVERSION PER MILEReach 1 Northgate (Co/WY Stateline) Gage to Sinclair Gage Length 100 miles% Div = Diversions divided by Total Inflow to the Reach multiplied by 100
Wtr Yr Oct Nov Dec Jan Feb Mar Apr May Jun Jul Aug Sep19751976197719781979198019811982198319841985198619871988198919901991199219931994199519961997199819992000200120022003200420052006AvgMaxMinStd
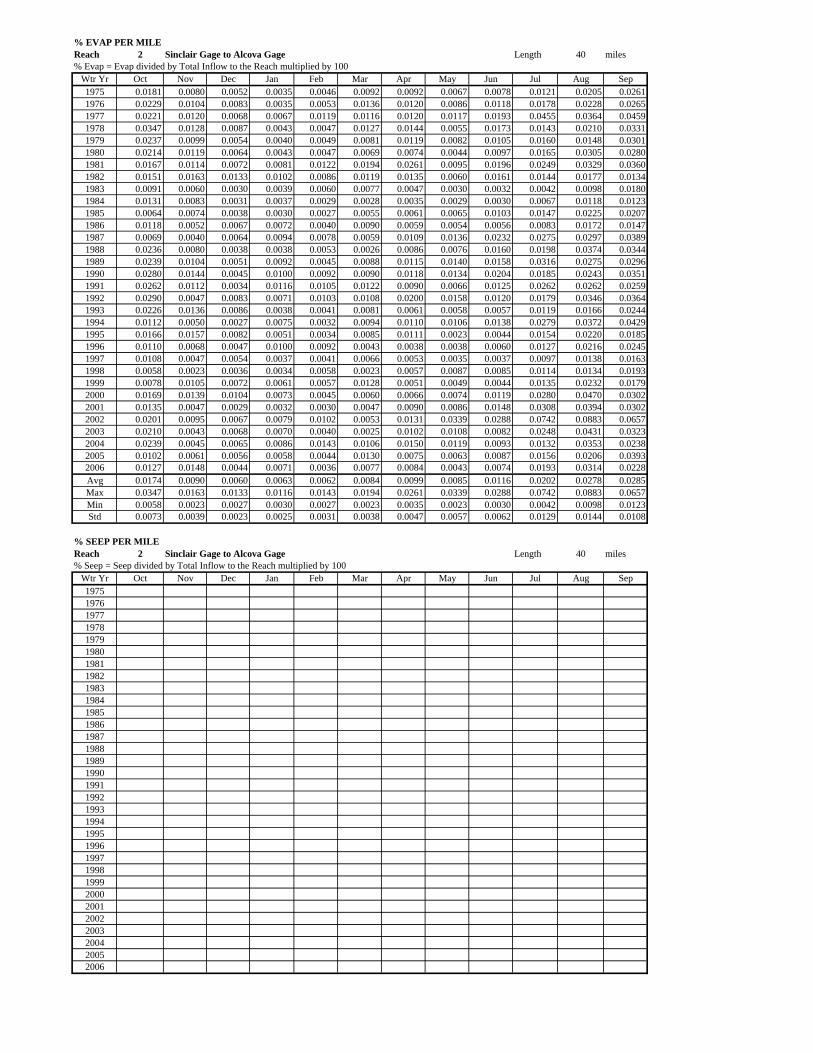
% EVAP PER MILEReach 2 Sinclair Gage to Alcova Gage Length 40 miles% Evap = Evap divided by Total Inflow to the Reach multiplied by 100
Wtr Yr Oct Nov Dec Jan Feb Mar Apr May Jun Jul Aug Sep1975 0.0181 0.0080 0.0052 0.0035 0.0046 0.0092 0.0092 0.0067 0.0078 0.0121 0.0205 0.02611976 0.0229 0.0104 0.0083 0.0035 0.0053 0.0136 0.0120 0.0086 0.0118 0.0178 0.0228 0.02651977 0.0221 0.0120 0.0068 0.0067 0.0119 0.0116 0.0120 0.0117 0.0193 0.0455 0.0364 0.04591978 0.0347 0.0128 0.0087 0.0043 0.0047 0.0127 0.0144 0.0055 0.0173 0.0143 0.0210 0.03311979 0.0237 0.0099 0.0054 0.0040 0.0049 0.0081 0.0119 0.0082 0.0105 0.0160 0.0148 0.03011980 0.0214 0.0119 0.0064 0.0043 0.0047 0.0069 0.0074 0.0044 0.0097 0.0165 0.0305 0.02801981 0.0167 0.0114 0.0072 0.0081 0.0122 0.0194 0.0261 0.0095 0.0196 0.0249 0.0329 0.03601982 0.0151 0.0163 0.0133 0.0102 0.0086 0.0119 0.0135 0.0060 0.0161 0.0144 0.0177 0.01341983 0.0091 0.0060 0.0030 0.0039 0.0060 0.0077 0.0047 0.0030 0.0032 0.0042 0.0098 0.01801984 0.0131 0.0083 0.0031 0.0037 0.0029 0.0028 0.0035 0.0029 0.0030 0.0067 0.0118 0.01231985 0.0064 0.0074 0.0038 0.0030 0.0027 0.0055 0.0061 0.0065 0.0103 0.0147 0.0225 0.02071986 0.0118 0.0052 0.0067 0.0072 0.0040 0.0090 0.0059 0.0054 0.0056 0.0083 0.0172 0.01471987 0.0069 0.0040 0.0064 0.0094 0.0078 0.0059 0.0109 0.0136 0.0232 0.0275 0.0297 0.03891988 0.0236 0.0080 0.0038 0.0038 0.0053 0.0026 0.0086 0.0076 0.0160 0.0198 0.0374 0.03441989 0.0239 0.0104 0.0051 0.0092 0.0045 0.0088 0.0115 0.0140 0.0158 0.0316 0.0275 0.02961990 0.0280 0.0144 0.0045 0.0100 0.0092 0.0090 0.0118 0.0134 0.0204 0.0185 0.0243 0.03511991 0.0262 0.0112 0.0034 0.0116 0.0105 0.0122 0.0090 0.0066 0.0125 0.0262 0.0262 0.02591992 0.0290 0.0047 0.0083 0.0071 0.0103 0.0108 0.0200 0.0158 0.0120 0.0179 0.0346 0.03641993 0.0226 0.0136 0.0086 0.0038 0.0041 0.0081 0.0061 0.0058 0.0057 0.0119 0.0166 0.02441994 0.0112 0.0050 0.0027 0.0075 0.0032 0.0094 0.0110 0.0106 0.0138 0.0279 0.0372 0.04291995 0.0166 0.0157 0.0082 0.0051 0.0034 0.0085 0.0111 0.0023 0.0044 0.0154 0.0220 0.01851996 0.0110 0.0068 0.0047 0.0100 0.0092 0.0043 0.0038 0.0038 0.0060 0.0127 0.0216 0.02451997 0.0108 0.0047 0.0054 0.0037 0.0041 0.0066 0.0053 0.0035 0.0037 0.0097 0.0138 0.01631998 0.0058 0.0023 0.0036 0.0034 0.0058 0.0023 0.0057 0.0087 0.0085 0.0114 0.0134 0.01931999 0.0078 0.0105 0.0072 0.0061 0.0057 0.0128 0.0051 0.0049 0.0044 0.0135 0.0232 0.01792000 0.0169 0.0139 0.0104 0.0073 0.0045 0.0060 0.0066 0.0074 0.0119 0.0280 0.0470 0.03022001 0.0135 0.0047 0.0029 0.0032 0.0030 0.0047 0.0090 0.0086 0.0148 0.0308 0.0394 0.03022002 0.0201 0.0095 0.0067 0.0079 0.0102 0.0053 0.0131 0.0339 0.0288 0.0742 0.0883 0.06572003 0.0210 0.0043 0.0068 0.0070 0.0040 0.0025 0.0102 0.0108 0.0082 0.0248 0.0431 0.03232004 0.0239 0.0045 0.0065 0.0086 0.0143 0.0106 0.0150 0.0119 0.0093 0.0132 0.0353 0.02382005 0.0102 0.0061 0.0056 0.0058 0.0044 0.0130 0.0075 0.0063 0.0087 0.0156 0.0206 0.03932006 0.0127 0.0148 0.0044 0.0071 0.0036 0.0077 0.0084 0.0043 0.0074 0.0193 0.0314 0.0228Avg 0.0174 0.0090 0.0060 0.0063 0.0062 0.0084 0.0099 0.0085 0.0116 0.0202 0.0278 0.0285Max 0.0347 0.0163 0.0133 0.0116 0.0143 0.0194 0.0261 0.0339 0.0288 0.0742 0.0883 0.0657Min 0.0058 0.0023 0.0027 0.0030 0.0027 0.0023 0.0035 0.0023 0.0030 0.0042 0.0098 0.0123Std 0.0073 0.0039 0.0023 0.0025 0.0031 0.0038 0.0047 0.0057 0.0062 0.0129 0.0144 0.0108
% SEEP PER MILEReach 2 Sinclair Gage to Alcova Gage Length 40 miles% Seep = Seep divided by Total Inflow to the Reach multiplied by 100
Wtr Yr Oct Nov Dec Jan Feb Mar Apr May Jun Jul Aug Sep19751976197719781979198019811982198319841985198619871988198919901991199219931994199519961997199819992000200120022003200420052006

% DIVERSION PER MILEReach 2 Sinclair Gage to Alcova Gage Length 40 miles% Div = Diversions divided by Total Inflow to the Reach multiplied by 100
Wtr Yr Oct Nov Dec Jan Feb Mar Apr May Jun Jul Aug Sep19751976197719781979198019811982198319841985198619871988198919901991199219931994199519961997199819992000200120022003200420052006AvgMaxMinStd
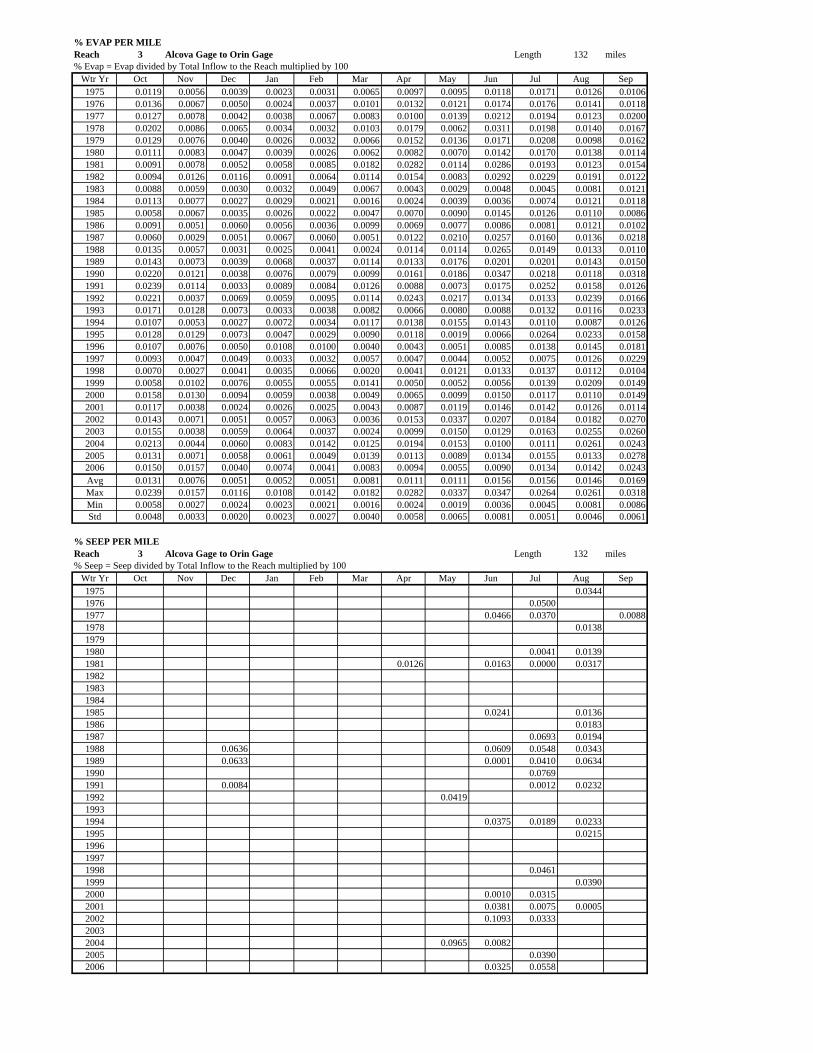
% EVAP PER MILEReach 3 Alcova Gage to Orin Gage Length 132 miles% Evap = Evap divided by Total Inflow to the Reach multiplied by 100
Wtr Yr Oct Nov Dec Jan Feb Mar Apr May Jun Jul Aug Sep1975 0.0119 0.0056 0.0039 0.0023 0.0031 0.0065 0.0097 0.0095 0.0118 0.0171 0.0126 0.01061976 0.0136 0.0067 0.0050 0.0024 0.0037 0.0101 0.0132 0.0121 0.0174 0.0176 0.0141 0.01181977 0.0127 0.0078 0.0042 0.0038 0.0067 0.0083 0.0100 0.0139 0.0212 0.0194 0.0123 0.02001978 0.0202 0.0086 0.0065 0.0034 0.0032 0.0103 0.0179 0.0062 0.0311 0.0198 0.0140 0.01671979 0.0129 0.0076 0.0040 0.0026 0.0032 0.0066 0.0152 0.0136 0.0171 0.0208 0.0098 0.01621980 0.0111 0.0083 0.0047 0.0039 0.0026 0.0062 0.0082 0.0070 0.0142 0.0170 0.0138 0.01141981 0.0091 0.0078 0.0052 0.0058 0.0085 0.0182 0.0282 0.0114 0.0286 0.0193 0.0123 0.01541982 0.0094 0.0126 0.0116 0.0091 0.0064 0.0114 0.0154 0.0083 0.0292 0.0229 0.0191 0.01221983 0.0088 0.0059 0.0030 0.0032 0.0049 0.0067 0.0043 0.0029 0.0048 0.0045 0.0081 0.01211984 0.0113 0.0077 0.0027 0.0029 0.0021 0.0016 0.0024 0.0039 0.0036 0.0074 0.0121 0.01181985 0.0058 0.0067 0.0035 0.0026 0.0022 0.0047 0.0070 0.0090 0.0145 0.0126 0.0110 0.00861986 0.0091 0.0051 0.0060 0.0056 0.0036 0.0099 0.0069 0.0077 0.0086 0.0081 0.0121 0.01021987 0.0060 0.0029 0.0051 0.0067 0.0060 0.0051 0.0122 0.0210 0.0257 0.0160 0.0136 0.02181988 0.0135 0.0057 0.0031 0.0025 0.0041 0.0024 0.0114 0.0114 0.0265 0.0149 0.0133 0.01101989 0.0143 0.0073 0.0039 0.0068 0.0037 0.0114 0.0133 0.0176 0.0201 0.0201 0.0143 0.01501990 0.0220 0.0121 0.0038 0.0076 0.0079 0.0099 0.0161 0.0186 0.0347 0.0218 0.0118 0.03181991 0.0239 0.0114 0.0033 0.0089 0.0084 0.0126 0.0088 0.0073 0.0175 0.0252 0.0158 0.01261992 0.0221 0.0037 0.0069 0.0059 0.0095 0.0114 0.0243 0.0217 0.0134 0.0133 0.0239 0.01661993 0.0171 0.0128 0.0073 0.0033 0.0038 0.0082 0.0066 0.0080 0.0088 0.0132 0.0116 0.02331994 0.0107 0.0053 0.0027 0.0072 0.0034 0.0117 0.0138 0.0155 0.0143 0.0110 0.0087 0.01261995 0.0128 0.0129 0.0073 0.0047 0.0029 0.0090 0.0118 0.0019 0.0066 0.0264 0.0233 0.01581996 0.0107 0.0076 0.0050 0.0108 0.0100 0.0040 0.0043 0.0051 0.0085 0.0138 0.0145 0.01811997 0.0093 0.0047 0.0049 0.0033 0.0032 0.0057 0.0047 0.0044 0.0052 0.0075 0.0126 0.02291998 0.0070 0.0027 0.0041 0.0035 0.0066 0.0020 0.0041 0.0121 0.0133 0.0137 0.0112 0.01041999 0.0058 0.0102 0.0076 0.0055 0.0055 0.0141 0.0050 0.0052 0.0056 0.0139 0.0209 0.01492000 0.0158 0.0130 0.0094 0.0059 0.0038 0.0049 0.0065 0.0099 0.0150 0.0117 0.0110 0.01492001 0.0117 0.0038 0.0024 0.0026 0.0025 0.0043 0.0087 0.0119 0.0146 0.0142 0.0126 0.01142002 0.0143 0.0071 0.0051 0.0057 0.0063 0.0036 0.0153 0.0337 0.0207 0.0184 0.0182 0.02702003 0.0155 0.0038 0.0059 0.0064 0.0037 0.0024 0.0099 0.0150 0.0129 0.0163 0.0255 0.02602004 0.0213 0.0044 0.0060 0.0083 0.0142 0.0125 0.0194 0.0153 0.0100 0.0111 0.0261 0.02432005 0.0131 0.0071 0.0058 0.0061 0.0049 0.0139 0.0113 0.0089 0.0134 0.0155 0.0133 0.02782006 0.0150 0.0157 0.0040 0.0074 0.0041 0.0083 0.0094 0.0055 0.0090 0.0134 0.0142 0.0243Avg 0.0131 0.0076 0.0051 0.0052 0.0051 0.0081 0.0111 0.0111 0.0156 0.0156 0.0146 0.0169Max 0.0239 0.0157 0.0116 0.0108 0.0142 0.0182 0.0282 0.0337 0.0347 0.0264 0.0261 0.0318Min 0.0058 0.0027 0.0024 0.0023 0.0021 0.0016 0.0024 0.0019 0.0036 0.0045 0.0081 0.0086Std 0.0048 0.0033 0.0020 0.0023 0.0027 0.0040 0.0058 0.0065 0.0081 0.0051 0.0046 0.0061
% SEEP PER MILEReach 3 Alcova Gage to Orin Gage Length 132 miles% Seep = Seep divided by Total Inflow to the Reach multiplied by 100
Wtr Yr Oct Nov Dec Jan Feb Mar Apr May Jun Jul Aug Sep1975 0.03441976 0.05001977 0.0466 0.0370 0.00881978 0.013819791980 0.0041 0.01391981 0.0126 0.0163 0.0000 0.03171982198319841985 0.0241 0.01361986 0.01831987 0.0693 0.01941988 0.0636 0.0609 0.0548 0.03431989 0.0633 0.0001 0.0410 0.06341990 0.07691991 0.0084 0.0012 0.02321992 0.041919931994 0.0375 0.0189 0.02331995 0.0215199619971998 0.04611999 0.03902000 0.0010 0.03152001 0.0381 0.0075 0.00052002 0.1093 0.033320032004 0.0965 0.00822005 0.03902006 0.0325 0.0558

% DIVERSION PER MILEReach 3 Alcova Gage to Orin Gage Length 132 miles% Div = Diversions divided by Total Inflow to the Reach multiplied by 100
Wtr Yr Oct Nov Dec Jan Feb Mar Apr May Jun Jul Aug Sep19751976197719781979198019811982198319841985198619871988198919901991199219931994199519961997199819992000200120022003200420052006AvgMaxMinStd
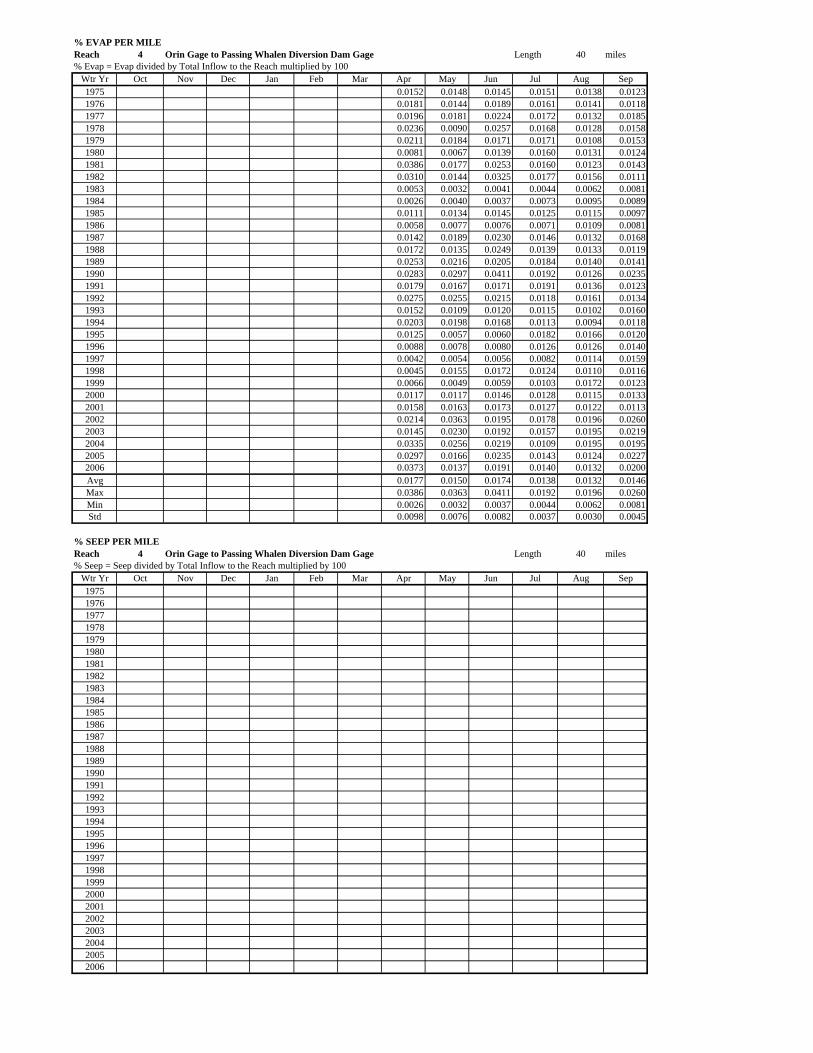
% EVAP PER MILEReach 4 Orin Gage to Passing Whalen Diversion Dam Gage Length 40 miles% Evap = Evap divided by Total Inflow to the Reach multiplied by 100
Wtr Yr Oct Nov Dec Jan Feb Mar Apr May Jun Jul Aug Sep1975 0.0152 0.0148 0.0145 0.0151 0.0138 0.01231976 0.0181 0.0144 0.0189 0.0161 0.0141 0.01181977 0.0196 0.0181 0.0224 0.0172 0.0132 0.01851978 0.0236 0.0090 0.0257 0.0168 0.0128 0.01581979 0.0211 0.0184 0.0171 0.0171 0.0108 0.01531980 0.0081 0.0067 0.0139 0.0160 0.0131 0.01241981 0.0386 0.0177 0.0253 0.0160 0.0123 0.01431982 0.0310 0.0144 0.0325 0.0177 0.0156 0.01111983 0.0053 0.0032 0.0041 0.0044 0.0062 0.00811984 0.0026 0.0040 0.0037 0.0073 0.0095 0.00891985 0.0111 0.0134 0.0145 0.0125 0.0115 0.00971986 0.0058 0.0077 0.0076 0.0071 0.0109 0.00811987 0.0142 0.0189 0.0230 0.0146 0.0132 0.01681988 0.0172 0.0135 0.0249 0.0139 0.0133 0.01191989 0.0253 0.0216 0.0205 0.0184 0.0140 0.01411990 0.0283 0.0297 0.0411 0.0192 0.0126 0.02351991 0.0179 0.0167 0.0171 0.0191 0.0136 0.01231992 0.0275 0.0255 0.0215 0.0118 0.0161 0.01341993 0.0152 0.0109 0.0120 0.0115 0.0102 0.01601994 0.0203 0.0198 0.0168 0.0113 0.0094 0.01181995 0.0125 0.0057 0.0060 0.0182 0.0166 0.01201996 0.0088 0.0078 0.0080 0.0126 0.0126 0.01401997 0.0042 0.0054 0.0056 0.0082 0.0114 0.01591998 0.0045 0.0155 0.0172 0.0124 0.0110 0.01161999 0.0066 0.0049 0.0059 0.0103 0.0172 0.01232000 0.0117 0.0117 0.0146 0.0128 0.0115 0.01332001 0.0158 0.0163 0.0173 0.0127 0.0122 0.01132002 0.0214 0.0363 0.0195 0.0178 0.0196 0.02602003 0.0145 0.0230 0.0192 0.0157 0.0195 0.02192004 0.0335 0.0256 0.0219 0.0109 0.0195 0.01952005 0.0297 0.0166 0.0235 0.0143 0.0124 0.02272006 0.0373 0.0137 0.0191 0.0140 0.0132 0.0200Avg 0.0177 0.0150 0.0174 0.0138 0.0132 0.0146Max 0.0386 0.0363 0.0411 0.0192 0.0196 0.0260Min 0.0026 0.0032 0.0037 0.0044 0.0062 0.0081Std 0.0098 0.0076 0.0082 0.0037 0.0030 0.0045
% SEEP PER MILEReach 4 Orin Gage to Passing Whalen Diversion Dam Gage Length 40 miles% Seep = Seep divided by Total Inflow to the Reach multiplied by 100
Wtr Yr Oct Nov Dec Jan Feb Mar Apr May Jun Jul Aug Sep19751976197719781979198019811982198319841985198619871988198919901991199219931994199519961997199819992000200120022003200420052006
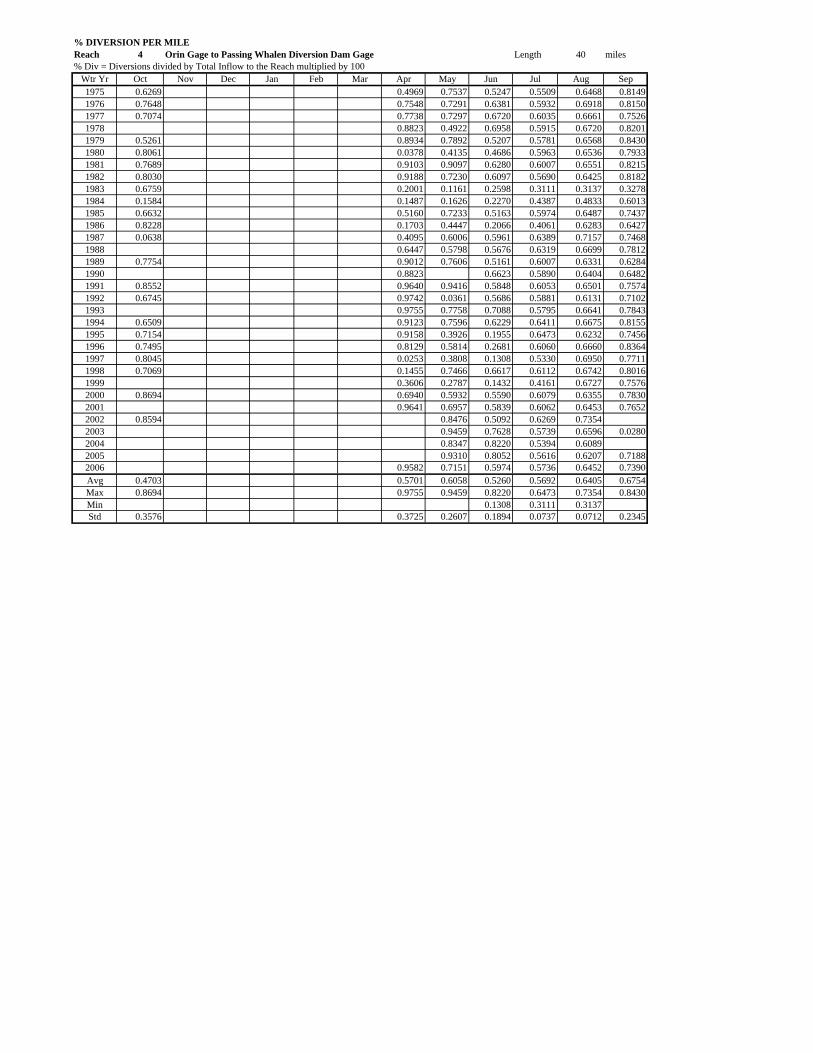
% DIVERSION PER MILEReach 4 Orin Gage to Passing Whalen Diversion Dam Gage Length 40 miles% Div = Diversions divided by Total Inflow to the Reach multiplied by 100
Wtr Yr Oct Nov Dec Jan Feb Mar Apr May Jun Jul Aug Sep1975 0.6269 0.4969 0.7537 0.5247 0.5509 0.6468 0.81491976 0.7648 0.7548 0.7291 0.6381 0.5932 0.6918 0.81501977 0.7074 0.7738 0.7297 0.6720 0.6035 0.6661 0.75261978 0.8823 0.4922 0.6958 0.5915 0.6720 0.82011979 0.5261 0.8934 0.7892 0.5207 0.5781 0.6568 0.84301980 0.8061 0.0378 0.4135 0.4686 0.5963 0.6536 0.79331981 0.7689 0.9103 0.9097 0.6280 0.6007 0.6551 0.82151982 0.8030 0.9188 0.7230 0.6097 0.5690 0.6425 0.81821983 0.6759 0.2001 0.1161 0.2598 0.3111 0.3137 0.32781984 0.1584 0.1487 0.1626 0.2270 0.4387 0.4833 0.60131985 0.6632 0.5160 0.7233 0.5163 0.5974 0.6487 0.74371986 0.8228 0.1703 0.4447 0.2066 0.4061 0.6283 0.64271987 0.0638 0.4095 0.6006 0.5961 0.6389 0.7157 0.74681988 0.6447 0.5798 0.5676 0.6319 0.6699 0.78121989 0.7754 0.9012 0.7606 0.5161 0.6007 0.6331 0.62841990 0.8823 0.6623 0.5890 0.6404 0.64821991 0.8552 0.9640 0.9416 0.5848 0.6053 0.6501 0.75741992 0.6745 0.9742 0.0361 0.5686 0.5881 0.6131 0.71021993 0.9755 0.7758 0.7088 0.5795 0.6641 0.78431994 0.6509 0.9123 0.7596 0.6229 0.6411 0.6675 0.81551995 0.7154 0.9158 0.3926 0.1955 0.6473 0.6232 0.74561996 0.7495 0.8129 0.5814 0.2681 0.6060 0.6660 0.83641997 0.8045 0.0253 0.3808 0.1308 0.5330 0.6950 0.77111998 0.7069 0.1455 0.7466 0.6617 0.6112 0.6742 0.80161999 0.3606 0.2787 0.1432 0.4161 0.6727 0.75762000 0.8694 0.6940 0.5932 0.5590 0.6079 0.6355 0.78302001 0.9641 0.6957 0.5839 0.6062 0.6453 0.76522002 0.8594 0.8476 0.5092 0.6269 0.73542003 0.9459 0.7628 0.5739 0.6596 0.02802004 0.8347 0.8220 0.5394 0.60892005 0.9310 0.8052 0.5616 0.6207 0.71882006 0.9582 0.7151 0.5974 0.5736 0.6452 0.7390Avg 0.4703 0.5701 0.6058 0.5260 0.5692 0.6405 0.6754Max 0.8694 0.9755 0.9459 0.8220 0.6473 0.7354 0.8430Min 0.1308 0.3111 0.3137Std 0.3576 0.3725 0.2607 0.1894 0.0737 0.0712 0.2345

% EVAP PER MILEReach 5 Passing Whalen Diversion Dam Gage to WY/NE Stateline Gage Length 47 miles% Evap = Evap divided by Total Inflow to the Reach multiplied by 100
Wtr Yr Oct Nov Dec Jan Feb Mar Apr May Jun Jul Aug Sep1975 0.0154 0.0064 0.0048 0.0070 0.0069 0.0109 0.0206 0.0202 0.0172 0.0130 0.0151 0.01401976 0.0155 0.0083 0.0065 0.0033 0.0078 0.0143 0.0231 0.0168 0.0203 0.0147 0.0142 0.01191977 0.0132 0.0071 0.0050 0.0059 0.0084 0.0137 0.0292 0.0223 0.0237 0.0150 0.0142 0.01701978 0.0170 0.0112 0.0098 0.0071 0.0056 0.0159 0.0293 0.0119 0.0202 0.0137 0.0116 0.01491979 0.0151 0.0063 0.0059 0.0039 0.0078 0.0094 0.0270 0.0231 0.0172 0.0134 0.0118 0.01441980 0.0180 0.0055 0.0069 0.0041 0.0047 0.0068 0.0080 0.0064 0.0136 0.0150 0.0124 0.01351981 0.0163 0.0098 0.0058 0.0057 0.0072 0.0157 0.0491 0.0240 0.0220 0.0127 0.0124 0.01311982 0.0127 0.0092 0.0073 0.0054 0.0114 0.0210 0.0467 0.0206 0.0359 0.0125 0.0121 0.01001983 0.0100 0.0055 0.0036 0.0081 0.0113 0.0132 0.0062 0.0036 0.0034 0.0043 0.0044 0.00411984 0.0069 0.0045 0.0030 0.0049 0.0037 0.0019 0.0027 0.0041 0.0038 0.0073 0.0068 0.00601985 0.0054 0.0048 0.0034 0.0019 0.0031 0.0047 0.0153 0.0178 0.0145 0.0124 0.0120 0.01071986 0.0107 0.0042 0.0062 0.0018 0.0060 0.0135 0.0046 0.0077 0.0067 0.0062 0.0097 0.00601987 0.0033 0.0031 0.0105 0.0087 0.0078 0.0106 0.0162 0.0167 0.0203 0.0133 0.0127 0.01191988 0.0149 0.0066 0.0067 0.0036 0.0061 0.0136 0.0229 0.0157 0.0233 0.0130 0.0132 0.01291989 0.0147 0.0099 0.0034 0.0167 0.0038 0.0093 0.0372 0.0255 0.0209 0.0166 0.0136 0.01311990 0.0186 0.0089 0.0025 0.0085 0.0094 0.0178 0.0405 0.0409 0.0475 0.0165 0.0135 0.01531991 0.0172 0.0125 0.0072 0.0045 0.0104 0.0147 0.0270 0.0260 0.0167 0.0130 0.0115 0.01201992 0.0171 0.0044 0.0041 0.0047 0.0089 0.0173 0.0306 0.0293 0.0297 0.0102 0.0083 0.01021993 0.0100 0.0068 0.0055 0.0031 0.0050 0.0083 0.0238 0.0138 0.0152 0.0099 0.0088 0.00871994 0.0094 0.0044 0.0037 0.0059 0.0078 0.0184 0.0269 0.0242 0.0194 0.0117 0.0102 0.01091995 0.0102 0.0049 0.0040 0.0085 0.0079 0.0130 0.0133 0.0096 0.0055 0.0099 0.0099 0.00831996 0.0097 0.0053 0.0051 0.0044 0.0074 0.0056 0.0133 0.0105 0.0076 0.0113 0.0108 0.00981997 0.0112 0.0026 0.0066 0.0069 0.0075 0.0102 0.0036 0.0065 0.0059 0.0089 0.0102 0.00891998 0.0151 0.0056 0.0041 0.0041 0.0039 0.0020 0.0048 0.0190 0.0211 0.0112 0.0109 0.01281999 0.0080 0.0061 0.0057 0.0032 0.0090 0.0151 0.0083 0.0047 0.0063 0.0068 0.0134 0.00972000 0.0125 0.0086 0.0038 0.0059 0.0067 0.0107 0.0169 0.0136 0.0142 0.0140 0.0120 0.01182001 0.0089 0.0044 0.0032 0.0034 0.0041 0.0099 0.0230 0.0206 0.0200 0.0113 0.0118 0.01122002 0.0110 0.0035 0.0050 0.0078 0.0089 0.0078 0.0275 0.0389 0.0183 0.0173 0.0211 0.02502003 0.0235 0.0118 0.0043 0.0076 0.0122 0.0109 0.0191 0.0311 0.0255 0.0151 0.0135 0.01782004 0.0193 0.0091 0.0034 0.0053 0.0119 0.0277 0.0476 0.0360 0.0339 0.0107 0.0128 0.01462005 0.0112 0.0050 0.0042 0.0085 0.0087 0.0285 0.0482 0.0244 0.0337 0.0130 0.0116 0.01762006 0.0151 0.0090 0.0035 0.0123 0.0115 0.0097 0.0653 0.0219 0.0293 0.0146 0.0122 0.0157Avg 0.0130 0.0067 0.0051 0.0060 0.0076 0.0126 0.0243 0.0190 0.0191 0.0121 0.0118 0.0123Max 0.0235 0.0125 0.0105 0.0167 0.0122 0.0285 0.0653 0.0409 0.0475 0.0173 0.0211 0.0250Min 0.0033 0.0026 0.0025 0.0018 0.0031 0.0019 0.0027 0.0036 0.0034 0.0043 0.0044 0.0041Std 0.0043 0.0026 0.0019 0.0030 0.0025 0.0060 0.0153 0.0097 0.0100 0.0030 0.0027 0.0040
% SEEP PER MILEReach 5 Passing Whalen Diversion Dam Gage to WY/NE Stateline Gage Length 47 miles% Seep = Seep divided by Total Inflow to the Reach multiplied by 100
Wtr Yr Oct Nov Dec Jan Feb Mar Apr May Jun Jul Aug Sep1975197619771978 0.085019791980 0.19511981 0.114519821983 0.32651984 0.022019851986 0.06531987 0.1028198819891990 0.3732199119921993 0.002419941995 0.176519961997 0.2759 0.01981998 0.20491999 0.0740200020012002 0.27812003 0.42752004 0.0702 0.18182005 0.2983 0.03162006
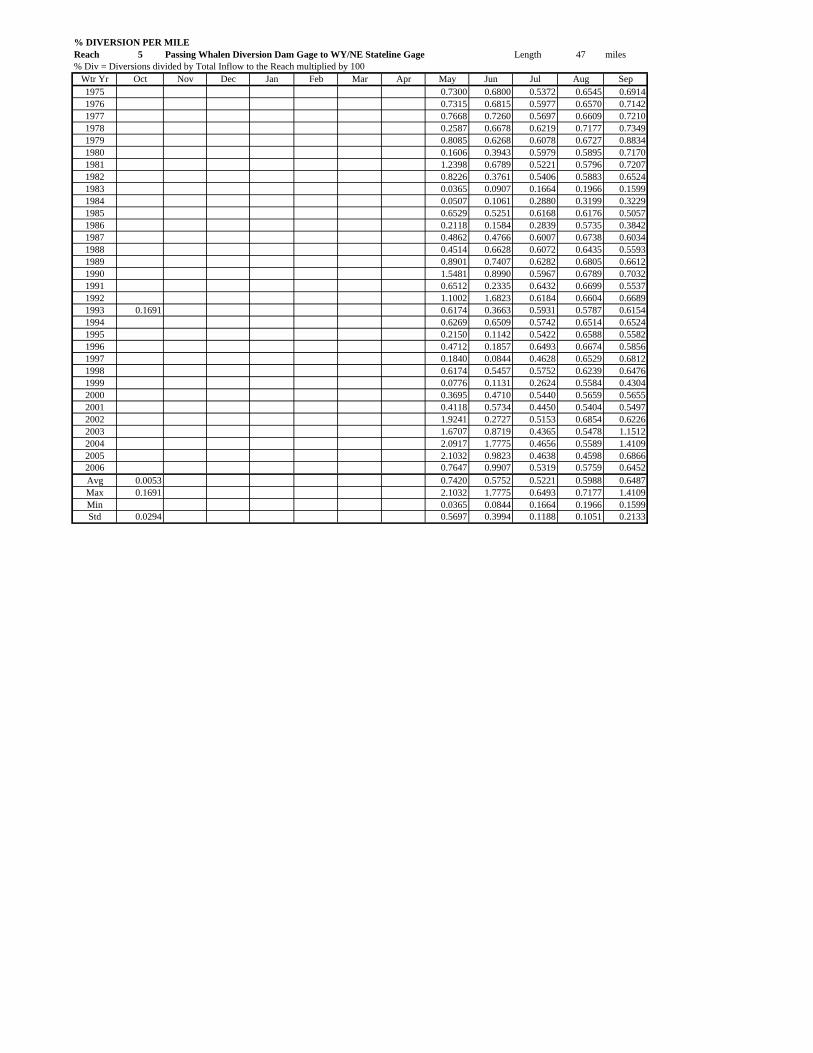
% DIVERSION PER MILEReach 5 Passing Whalen Diversion Dam Gage to WY/NE Stateline Gage Length 47 miles% Div = Diversions divided by Total Inflow to the Reach multiplied by 100
Wtr Yr Oct Nov Dec Jan Feb Mar Apr May Jun Jul Aug Sep1975 0.7300 0.6800 0.5372 0.6545 0.69141976 0.7315 0.6815 0.5977 0.6570 0.71421977 0.7668 0.7260 0.5697 0.6609 0.72101978 0.2587 0.6678 0.6219 0.7177 0.73491979 0.8085 0.6268 0.6078 0.6727 0.88341980 0.1606 0.3943 0.5979 0.5895 0.71701981 1.2398 0.6789 0.5221 0.5796 0.72071982 0.8226 0.3761 0.5406 0.5883 0.65241983 0.0365 0.0907 0.1664 0.1966 0.15991984 0.0507 0.1061 0.2880 0.3199 0.32291985 0.6529 0.5251 0.6168 0.6176 0.50571986 0.2118 0.1584 0.2839 0.5735 0.38421987 0.4862 0.4766 0.6007 0.6738 0.60341988 0.4514 0.6628 0.6072 0.6435 0.55931989 0.8901 0.7407 0.6282 0.6805 0.66121990 1.5481 0.8990 0.5967 0.6789 0.70321991 0.6512 0.2335 0.6432 0.6699 0.55371992 1.1002 1.6823 0.6184 0.6604 0.66891993 0.1691 0.6174 0.3663 0.5931 0.5787 0.61541994 0.6269 0.6509 0.5742 0.6514 0.65241995 0.2150 0.1142 0.5422 0.6588 0.55821996 0.4712 0.1857 0.6493 0.6674 0.58561997 0.1840 0.0844 0.4628 0.6529 0.68121998 0.6174 0.5457 0.5752 0.6239 0.64761999 0.0776 0.1131 0.2624 0.5584 0.43042000 0.3695 0.4710 0.5440 0.5659 0.56552001 0.4118 0.5734 0.4450 0.5404 0.54972002 1.9241 0.2727 0.5153 0.6854 0.62262003 1.6707 0.8719 0.4365 0.5478 1.15122004 2.0917 1.7775 0.4656 0.5589 1.41092005 2.1032 0.9823 0.4638 0.4598 0.68662006 0.7647 0.9907 0.5319 0.5759 0.6452Avg 0.0053 0.7420 0.5752 0.5221 0.5988 0.6487Max 0.1691 2.1032 1.7775 0.6493 0.7177 1.4109Min 0.0365 0.0844 0.1664 0.1966 0.1599Std 0.0294 0.5697 0.3994 0.1188 0.1051 0.2133
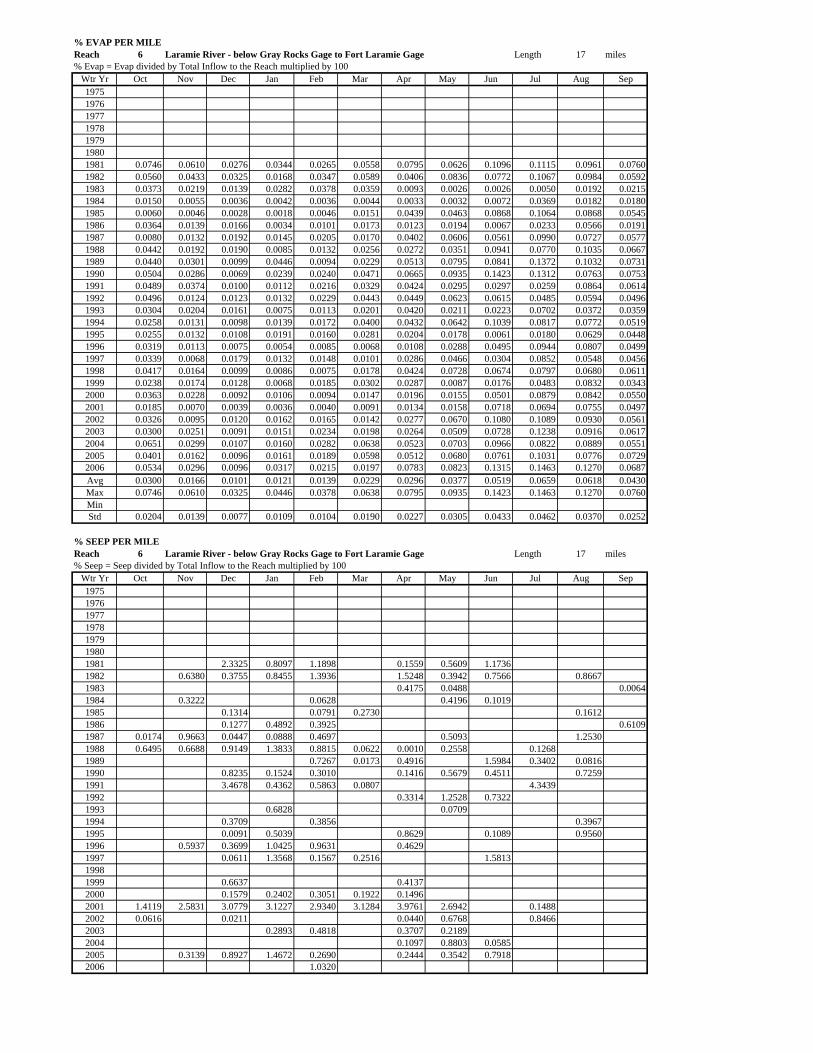
% EVAP PER MILEReach 6 Laramie River - below Gray Rocks Gage to Fort Laramie Gage Length 17 miles% Evap = Evap divided by Total Inflow to the Reach multiplied by 100
Wtr Yr Oct Nov Dec Jan Feb Mar Apr May Jun Jul Aug Sep1975197619771978197919801981 0.0746 0.0610 0.0276 0.0344 0.0265 0.0558 0.0795 0.0626 0.1096 0.1115 0.0961 0.07601982 0.0560 0.0433 0.0325 0.0168 0.0347 0.0589 0.0406 0.0836 0.0772 0.1067 0.0984 0.05921983 0.0373 0.0219 0.0139 0.0282 0.0378 0.0359 0.0093 0.0026 0.0026 0.0050 0.0192 0.02151984 0.0150 0.0055 0.0036 0.0042 0.0036 0.0044 0.0033 0.0032 0.0072 0.0369 0.0182 0.01801985 0.0060 0.0046 0.0028 0.0018 0.0046 0.0151 0.0439 0.0463 0.0868 0.1064 0.0868 0.05451986 0.0364 0.0139 0.0166 0.0034 0.0101 0.0173 0.0123 0.0194 0.0067 0.0233 0.0566 0.01911987 0.0080 0.0132 0.0192 0.0145 0.0205 0.0170 0.0402 0.0606 0.0561 0.0990 0.0727 0.05771988 0.0442 0.0192 0.0190 0.0085 0.0132 0.0256 0.0272 0.0351 0.0941 0.0770 0.1035 0.06671989 0.0440 0.0301 0.0099 0.0446 0.0094 0.0229 0.0513 0.0795 0.0841 0.1372 0.1032 0.07311990 0.0504 0.0286 0.0069 0.0239 0.0240 0.0471 0.0665 0.0935 0.1423 0.1312 0.0763 0.07531991 0.0489 0.0374 0.0100 0.0112 0.0216 0.0329 0.0424 0.0295 0.0297 0.0259 0.0864 0.06141992 0.0496 0.0124 0.0123 0.0132 0.0229 0.0443 0.0449 0.0623 0.0615 0.0485 0.0594 0.04961993 0.0304 0.0204 0.0161 0.0075 0.0113 0.0201 0.0420 0.0211 0.0223 0.0702 0.0372 0.03591994 0.0258 0.0131 0.0098 0.0139 0.0172 0.0400 0.0432 0.0642 0.1039 0.0817 0.0772 0.05191995 0.0255 0.0132 0.0108 0.0191 0.0160 0.0281 0.0204 0.0178 0.0061 0.0180 0.0629 0.04481996 0.0319 0.0113 0.0075 0.0054 0.0085 0.0068 0.0108 0.0288 0.0495 0.0944 0.0807 0.04991997 0.0339 0.0068 0.0179 0.0132 0.0148 0.0101 0.0286 0.0466 0.0304 0.0852 0.0548 0.04561998 0.0417 0.0164 0.0099 0.0086 0.0075 0.0178 0.0424 0.0728 0.0674 0.0797 0.0680 0.06111999 0.0238 0.0174 0.0128 0.0068 0.0185 0.0302 0.0287 0.0087 0.0176 0.0483 0.0832 0.03432000 0.0363 0.0228 0.0092 0.0106 0.0094 0.0147 0.0196 0.0155 0.0501 0.0879 0.0842 0.05502001 0.0185 0.0070 0.0039 0.0036 0.0040 0.0091 0.0134 0.0158 0.0718 0.0694 0.0755 0.04972002 0.0326 0.0095 0.0120 0.0162 0.0165 0.0142 0.0277 0.0670 0.1080 0.1089 0.0930 0.05612003 0.0300 0.0251 0.0091 0.0151 0.0234 0.0198 0.0264 0.0509 0.0728 0.1238 0.0916 0.06172004 0.0651 0.0299 0.0107 0.0160 0.0282 0.0638 0.0523 0.0703 0.0966 0.0822 0.0889 0.05512005 0.0401 0.0162 0.0096 0.0161 0.0189 0.0598 0.0512 0.0680 0.0761 0.1031 0.0776 0.07292006 0.0534 0.0296 0.0096 0.0317 0.0215 0.0197 0.0783 0.0823 0.1315 0.1463 0.1270 0.0687Avg 0.0300 0.0166 0.0101 0.0121 0.0139 0.0229 0.0296 0.0377 0.0519 0.0659 0.0618 0.0430Max 0.0746 0.0610 0.0325 0.0446 0.0378 0.0638 0.0795 0.0935 0.1423 0.1463 0.1270 0.0760MinStd 0.0204 0.0139 0.0077 0.0109 0.0104 0.0190 0.0227 0.0305 0.0433 0.0462 0.0370 0.0252
% SEEP PER MILEReach 6 Laramie River - below Gray Rocks Gage to Fort Laramie Gage Length 17 miles% Seep = Seep divided by Total Inflow to the Reach multiplied by 100
Wtr Yr Oct Nov Dec Jan Feb Mar Apr May Jun Jul Aug Sep1975197619771978197919801981 2.3325 0.8097 1.1898 0.1559 0.5609 1.17361982 0.6380 0.3755 0.8455 1.3936 1.5248 0.3942 0.7566 0.86671983 0.4175 0.0488 0.00641984 0.3222 0.0628 0.4196 0.10191985 0.1314 0.0791 0.2730 0.16121986 0.1277 0.4892 0.3925 0.61091987 0.0174 0.9663 0.0447 0.0888 0.4697 0.5093 1.25301988 0.6495 0.6688 0.9149 1.3833 0.8815 0.0622 0.0010 0.2558 0.12681989 0.7267 0.0173 0.4916 1.5984 0.3402 0.08161990 0.8235 0.1524 0.3010 0.1416 0.5679 0.4511 0.72591991 3.4678 0.4362 0.5863 0.0807 4.34391992 0.3314 1.2528 0.73221993 0.6828 0.07091994 0.3709 0.3856 0.39671995 0.0091 0.5039 0.8629 0.1089 0.95601996 0.5937 0.3699 1.0425 0.9631 0.46291997 0.0611 1.3568 0.1567 0.2516 1.581319981999 0.6637 0.41372000 0.1579 0.2402 0.3051 0.1922 0.14962001 1.4119 2.5831 3.0779 3.1227 2.9340 3.1284 3.9761 2.6942 0.14882002 0.0616 0.0211 0.0440 0.6768 0.84662003 0.2893 0.4818 0.3707 0.21892004 0.1097 0.8803 0.05852005 0.3139 0.8927 1.4672 0.2690 0.2444 0.3542 0.79182006 1.0320

% DIVERSION PER MILEReach 6 Laramie River - below Gray Rocks Gage to Fort Laramie Gage Length 17 miles% Div = Diversions divided by Total Inflow to the Reach multiplied by 100
Wtr Yr Oct Nov Dec Jan Feb Mar Apr May Jun Jul Aug Sep19751976197719781979198019811982198319841985198619871988198919901991199219931994199519961997199819992000200120022003200420052006AvgMaxMinStd

% EVAP PER MILEReach 7 Henderson Gage to Kersey Gage Length 54.9 miles% Evap = Evap divided by Total Inflow to the Reach multiplied by 100
Wtr Yr Oct Nov Dec Jan Feb Mar Apr May Jun Jul Aug Sep1975 0.0065 0.0029 0.0014 0.0017 0.0020 0.0045 0.0074 0.0073 0.0059 0.0079 0.0069 0.00671976 0.0065 0.0024 0.0020 0.0012 0.0036 0.0038 0.0109 0.0089 0.0092 0.0102 0.0066 0.00681977 0.0055 0.0028 0.0022 0.0010 0.0035 0.0047 0.0104 0.0112 0.0124 0.0120 0.0085 0.01041978 0.0075 0.0034 0.0022 0.0005 0.0014 0.0063 0.0121 0.0063 0.0063 0.0091 0.0074 0.00821979 0.0061 0.0031 0.0004 0.0020 0.0044 0.0094 0.0045 0.0038 0.0081 0.0063 0.00841980 0.0064 0.0014 0.0013 0.0004 0.0011 0.0020 0.0042 0.0028 0.0047 0.0081 0.0069 0.00751981 0.0058 0.0032 0.0031 0.0022 0.0026 0.0044 0.0134 0.0081 0.0097 0.0106 0.0079 0.00901982 0.0054 0.0046 0.0020 0.0014 0.0022 0.0061 0.0121 0.0086 0.0065 0.0071 0.0071 0.00591983 0.0055 0.0020 0.0012 0.0017 0.0029 0.0023 0.0028 0.0025 0.0033 0.0050 0.0060 0.00671984 0.0061 0.0023 0.0000 0.0003 0.0014 0.0025 0.0031 0.0039 0.0047 0.0070 0.0053 0.00471985 0.0024 0.0017 0.0011 0.0005 0.0007 0.0041 0.0082 0.0056 0.0059 0.0077 0.0067 0.00581986 0.0057 0.0010 0.0006 0.0021 0.0024 0.0055 0.0056 0.0063 0.0053 0.0072 0.0066 0.00621987 0.0051 0.0023 0.0011 0.0013 0.0025 0.0027 0.0072 0.0044 0.0065 0.0085 0.0070 0.00741988 0.0069 0.0031 0.0010 0.0003 0.0015 0.0035 0.0081 0.0073 0.0085 0.0084 0.0071 0.00701989 0.0068 0.0038 0.0009 0.0015 0.0002 0.0045 0.0099 0.0088 0.0077 0.0097 0.0071 0.00741990 0.0064 0.0039 0.0008 0.0021 0.0019 0.0026 0.0071 0.0071 0.0083 0.0081 0.0068 0.00761991 0.0060 0.0037 0.0005 0.0008 0.0035 0.0054 0.0100 0.0093 0.0061 0.0083 0.0067 0.00701992 0.0065 0.0020 0.0016 0.0013 0.0034 0.0035 0.0096 0.0081 0.0069 0.0076 0.0060 0.00761993 0.0068 0.0019 0.0004 0.0004 0.0010 0.0044 0.0081 0.0086 0.0065 0.0078 0.0065 0.00601994 0.0049 0.0016 0.0015 0.0018 0.0012 0.0049 0.0085 0.0084 0.0084 0.0099 0.0085 0.00851995 0.0062 0.0024 0.0022 0.0018 0.0035 0.0052 0.0077 0.0031 0.0033 0.0051 0.0072 0.00611996 0.0057 0.0034 0.0018 0.0009 0.0020 0.0034 0.0086 0.0062 0.0058 0.0077 0.0070 0.00621997 0.0063 0.0024 0.0018 0.0007 0.0018 0.0055 0.0052 0.0060 0.0038 0.0077 0.0055 0.00661998 0.0045 0.0017 0.0011 0.0015 0.0022 0.0029 0.0045 0.0057 0.0059 0.0079 0.0067 0.00801999 0.0056 0.0034 0.0009 0.0019 0.0034 0.0055 0.0052 0.0034 0.0044 0.0082 0.0058 0.00582000 0.0052 0.0037 0.0020 0.0016 0.0029 0.0045 0.0095 0.0079 0.0081 0.0106 0.0084 0.00772001 0.0062 0.0016 0.0010 0.0014 0.0013 0.0042 0.0097 0.0073 0.0096 0.0099 0.0079 0.00832002 0.0059 0.0041 0.0019 0.0017 0.0024 0.0030 0.0132 0.0101 0.0152 0.0195 0.0158 0.01232003 0.0056 0.0038 0.0030 0.0037 0.0020 0.0051 0.0086 0.0074 0.0061 0.0120 0.0104 0.00762004 0.0080 0.0030 0.0022 0.0021 0.0021 0.0073 0.0082 0.0093 0.0082 0.0088 0.0069 0.00772005 0.0050 0.0029 0.0021 0.0021 0.0034 0.0052 0.0071 0.0065 0.0057 0.0112 0.0072 0.00912006 0.0056 0.0041 0.0013 0.0034 0.0021 0.0038 0.0118 0.0098 0.0104 0.0105 0.0085 0.0067Avg 0.0059 0.0028 0.0015 0.0014 0.0022 0.0043 0.0084 0.0069 0.0070 0.0090 0.0073 0.0074Max 0.0080 0.0046 0.0031 0.0037 0.0036 0.0073 0.0134 0.0112 0.0152 0.0195 0.0158 0.0123Min 0.0024 0.0010 0.0000 0.0002 0.0020 0.0028 0.0025 0.0033 0.0050 0.0053 0.0047Std 0.0010 0.0009 0.0007 0.0008 0.0009 0.0012 0.0027 0.0022 0.0026 0.0025 0.0018 0.0015
% SEEP PER MILEReach 7 Henderson Gage to Kersey Gage Length 54.9 miles% Seep = Seep divided by Total Inflow to the Reach multiplied by 100
Wtr Yr Oct Nov Dec Jan Feb Mar Apr May Jun Jul Aug Sep19751976197719781979198019811982198319841985198619871988198919901991199219931994199519961997199819992000200120022003200420052006
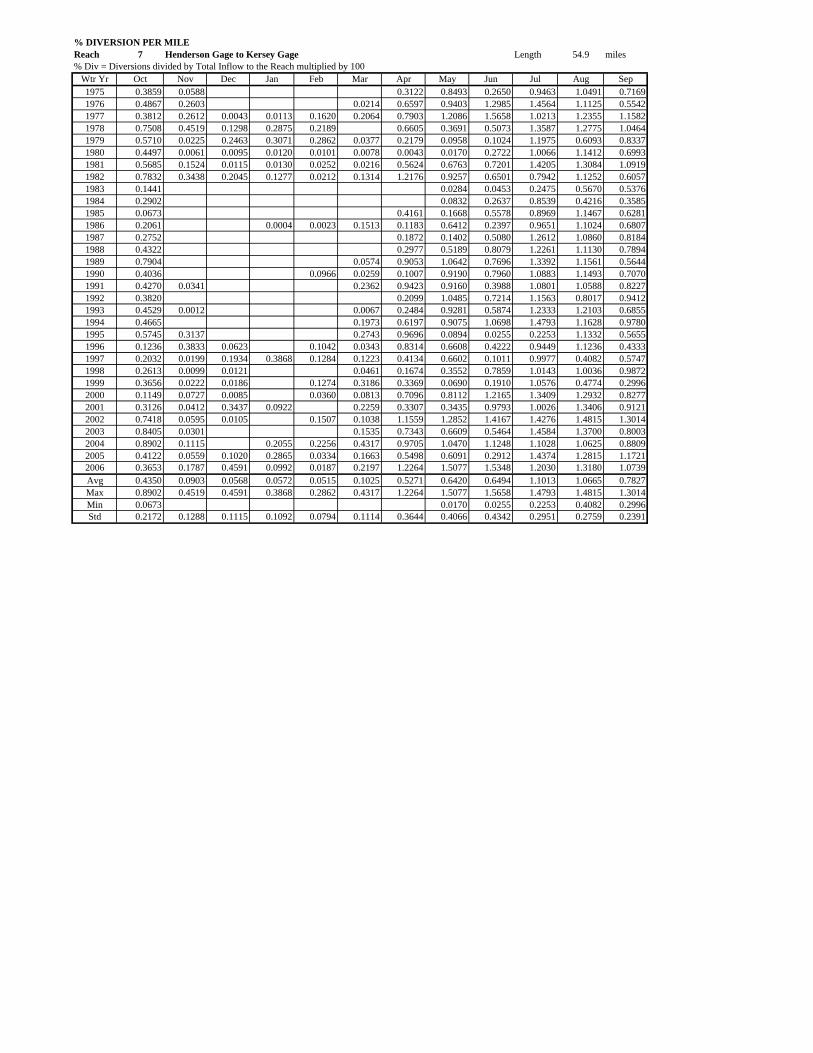
% DIVERSION PER MILEReach 7 Henderson Gage to Kersey Gage Length 54.9 miles% Div = Diversions divided by Total Inflow to the Reach multiplied by 100
Wtr Yr Oct Nov Dec Jan Feb Mar Apr May Jun Jul Aug Sep1975 0.3859 0.0588 0.3122 0.8493 0.2650 0.9463 1.0491 0.71691976 0.4867 0.2603 0.0214 0.6597 0.9403 1.2985 1.4564 1.1125 0.55421977 0.3812 0.2612 0.0043 0.0113 0.1620 0.2064 0.7903 1.2086 1.5658 1.0213 1.2355 1.15821978 0.7508 0.4519 0.1298 0.2875 0.2189 0.6605 0.3691 0.5073 1.3587 1.2775 1.04641979 0.5710 0.0225 0.2463 0.3071 0.2862 0.0377 0.2179 0.0958 0.1024 1.1975 0.6093 0.83371980 0.4497 0.0061 0.0095 0.0120 0.0101 0.0078 0.0043 0.0170 0.2722 1.0066 1.1412 0.69931981 0.5685 0.1524 0.0115 0.0130 0.0252 0.0216 0.5624 0.6763 0.7201 1.4205 1.3084 1.09191982 0.7832 0.3438 0.2045 0.1277 0.0212 0.1314 1.2176 0.9257 0.6501 0.7942 1.1252 0.60571983 0.1441 0.0284 0.0453 0.2475 0.5670 0.53761984 0.2902 0.0832 0.2637 0.8539 0.4216 0.35851985 0.0673 0.4161 0.1668 0.5578 0.8969 1.1467 0.62811986 0.2061 0.0004 0.0023 0.1513 0.1183 0.6412 0.2397 0.9651 1.1024 0.68071987 0.2752 0.1872 0.1402 0.5080 1.2612 1.0860 0.81841988 0.4322 0.2977 0.5189 0.8079 1.2261 1.1130 0.78941989 0.7904 0.0574 0.9053 1.0642 0.7696 1.3392 1.1561 0.56441990 0.4036 0.0966 0.0259 0.1007 0.9190 0.7960 1.0883 1.1493 0.70701991 0.4270 0.0341 0.2362 0.9423 0.9160 0.3988 1.0801 1.0588 0.82271992 0.3820 0.2099 1.0485 0.7214 1.1563 0.8017 0.94121993 0.4529 0.0012 0.0067 0.2484 0.9281 0.5874 1.2333 1.2103 0.68551994 0.4665 0.1973 0.6197 0.9075 1.0698 1.4793 1.1628 0.97801995 0.5745 0.3137 0.2743 0.9696 0.0894 0.0255 0.2253 1.1332 0.56551996 0.1236 0.3833 0.0623 0.1042 0.0343 0.8314 0.6608 0.4222 0.9449 1.1236 0.43331997 0.2032 0.0199 0.1934 0.3868 0.1284 0.1223 0.4134 0.6602 0.1011 0.9977 0.4082 0.57471998 0.2613 0.0099 0.0121 0.0461 0.1674 0.3552 0.7859 1.0143 1.0036 0.98721999 0.3656 0.0222 0.0186 0.1274 0.3186 0.3369 0.0690 0.1910 1.0576 0.4774 0.29962000 0.1149 0.0727 0.0085 0.0360 0.0813 0.7096 0.8112 1.2165 1.3409 1.2932 0.82772001 0.3126 0.0412 0.3437 0.0922 0.2259 0.3307 0.3435 0.9793 1.0026 1.3406 0.91212002 0.7418 0.0595 0.0105 0.1507 0.1038 1.1559 1.2852 1.4167 1.4276 1.4815 1.30142003 0.8405 0.0301 0.1535 0.7343 0.6609 0.5464 1.4584 1.3700 0.80032004 0.8902 0.1115 0.2055 0.2256 0.4317 0.9705 1.0470 1.1248 1.1028 1.0625 0.88092005 0.4122 0.0559 0.1020 0.2865 0.0334 0.1663 0.5498 0.6091 0.2912 1.4374 1.2815 1.17212006 0.3653 0.1787 0.4591 0.0992 0.0187 0.2197 1.2264 1.5077 1.5348 1.2030 1.3180 1.0739Avg 0.4350 0.0903 0.0568 0.0572 0.0515 0.1025 0.5271 0.6420 0.6494 1.1013 1.0665 0.7827Max 0.8902 0.4519 0.4591 0.3868 0.2862 0.4317 1.2264 1.5077 1.5658 1.4793 1.4815 1.3014Min 0.0673 0.0170 0.0255 0.2253 0.4082 0.2996Std 0.2172 0.1288 0.1115 0.1092 0.0794 0.1114 0.3644 0.4066 0.4342 0.2951 0.2759 0.2391
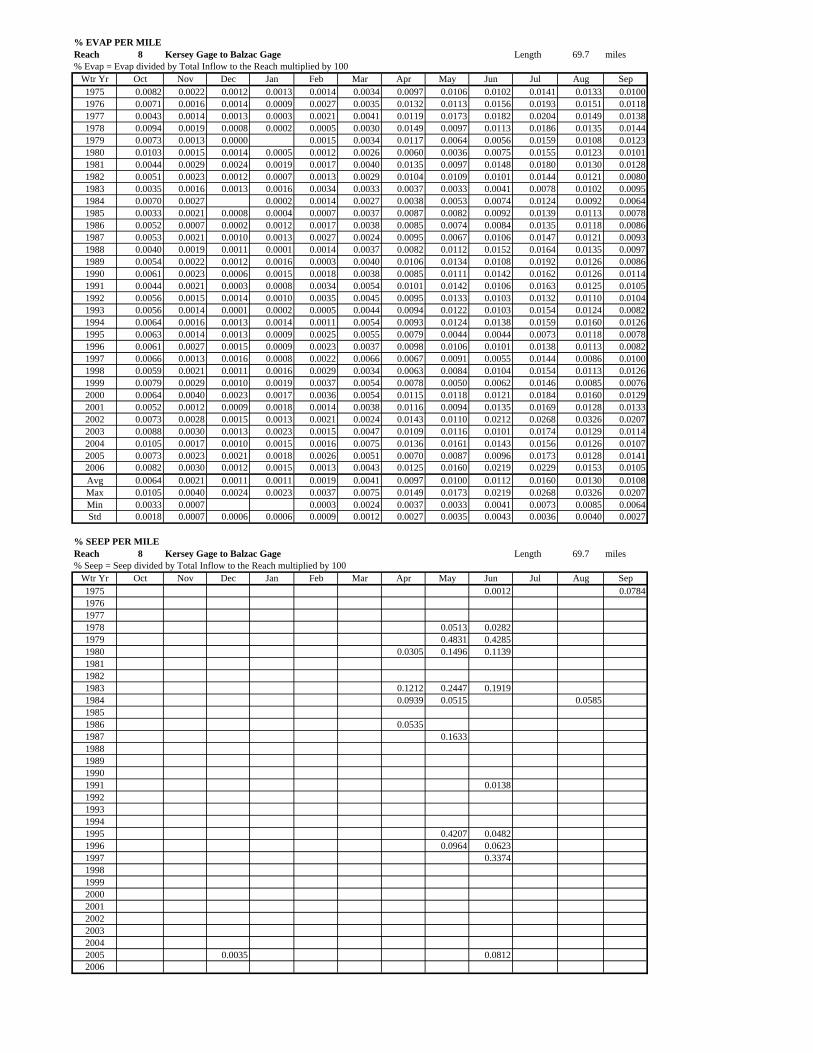
% EVAP PER MILEReach 8 Kersey Gage to Balzac Gage Length 69.7 miles% Evap = Evap divided by Total Inflow to the Reach multiplied by 100
Wtr Yr Oct Nov Dec Jan Feb Mar Apr May Jun Jul Aug Sep1975 0.0082 0.0022 0.0012 0.0013 0.0014 0.0034 0.0097 0.0106 0.0102 0.0141 0.0133 0.01001976 0.0071 0.0016 0.0014 0.0009 0.0027 0.0035 0.0132 0.0113 0.0156 0.0193 0.0151 0.01181977 0.0043 0.0014 0.0013 0.0003 0.0021 0.0041 0.0119 0.0173 0.0182 0.0204 0.0149 0.01381978 0.0094 0.0019 0.0008 0.0002 0.0005 0.0030 0.0149 0.0097 0.0113 0.0186 0.0135 0.01441979 0.0073 0.0013 0.0000 0.0015 0.0034 0.0117 0.0064 0.0056 0.0159 0.0108 0.01231980 0.0103 0.0015 0.0014 0.0005 0.0012 0.0026 0.0060 0.0036 0.0075 0.0155 0.0123 0.01011981 0.0044 0.0029 0.0024 0.0019 0.0017 0.0040 0.0135 0.0097 0.0148 0.0180 0.0130 0.01281982 0.0051 0.0023 0.0012 0.0007 0.0013 0.0029 0.0104 0.0109 0.0101 0.0144 0.0121 0.00801983 0.0035 0.0016 0.0013 0.0016 0.0034 0.0033 0.0037 0.0033 0.0041 0.0078 0.0102 0.00951984 0.0070 0.0027 0.0002 0.0014 0.0027 0.0038 0.0053 0.0074 0.0124 0.0092 0.00641985 0.0033 0.0021 0.0008 0.0004 0.0007 0.0037 0.0087 0.0082 0.0092 0.0139 0.0113 0.00781986 0.0052 0.0007 0.0002 0.0012 0.0017 0.0038 0.0085 0.0074 0.0084 0.0135 0.0118 0.00861987 0.0053 0.0021 0.0010 0.0013 0.0027 0.0024 0.0095 0.0067 0.0106 0.0147 0.0121 0.00931988 0.0040 0.0019 0.0011 0.0001 0.0014 0.0037 0.0082 0.0112 0.0152 0.0164 0.0135 0.00971989 0.0054 0.0022 0.0012 0.0016 0.0003 0.0040 0.0106 0.0134 0.0108 0.0192 0.0126 0.00861990 0.0061 0.0023 0.0006 0.0015 0.0018 0.0038 0.0085 0.0111 0.0142 0.0162 0.0126 0.01141991 0.0044 0.0021 0.0003 0.0008 0.0034 0.0054 0.0101 0.0142 0.0106 0.0163 0.0125 0.01051992 0.0056 0.0015 0.0014 0.0010 0.0035 0.0045 0.0095 0.0133 0.0103 0.0132 0.0110 0.01041993 0.0056 0.0014 0.0001 0.0002 0.0005 0.0044 0.0094 0.0122 0.0103 0.0154 0.0124 0.00821994 0.0064 0.0016 0.0013 0.0014 0.0011 0.0054 0.0093 0.0124 0.0138 0.0159 0.0160 0.01261995 0.0063 0.0014 0.0013 0.0009 0.0025 0.0055 0.0079 0.0044 0.0044 0.0073 0.0118 0.00781996 0.0061 0.0027 0.0015 0.0009 0.0023 0.0037 0.0098 0.0106 0.0101 0.0138 0.0113 0.00821997 0.0066 0.0013 0.0016 0.0008 0.0022 0.0066 0.0067 0.0091 0.0055 0.0144 0.0086 0.01001998 0.0059 0.0021 0.0011 0.0016 0.0029 0.0034 0.0063 0.0084 0.0104 0.0154 0.0113 0.01261999 0.0079 0.0029 0.0010 0.0019 0.0037 0.0054 0.0078 0.0050 0.0062 0.0146 0.0085 0.00762000 0.0064 0.0040 0.0023 0.0017 0.0036 0.0054 0.0115 0.0118 0.0121 0.0184 0.0160 0.01292001 0.0052 0.0012 0.0009 0.0018 0.0014 0.0038 0.0116 0.0094 0.0135 0.0169 0.0128 0.01332002 0.0073 0.0028 0.0015 0.0013 0.0021 0.0024 0.0143 0.0110 0.0212 0.0268 0.0326 0.02072003 0.0088 0.0030 0.0013 0.0023 0.0015 0.0047 0.0109 0.0116 0.0101 0.0174 0.0129 0.01142004 0.0105 0.0017 0.0010 0.0015 0.0016 0.0075 0.0136 0.0161 0.0143 0.0156 0.0126 0.01072005 0.0073 0.0023 0.0021 0.0018 0.0026 0.0051 0.0070 0.0087 0.0096 0.0173 0.0128 0.01412006 0.0082 0.0030 0.0012 0.0015 0.0013 0.0043 0.0125 0.0160 0.0219 0.0229 0.0153 0.0105Avg 0.0064 0.0021 0.0011 0.0011 0.0019 0.0041 0.0097 0.0100 0.0112 0.0160 0.0130 0.0108Max 0.0105 0.0040 0.0024 0.0023 0.0037 0.0075 0.0149 0.0173 0.0219 0.0268 0.0326 0.0207Min 0.0033 0.0007 0.0003 0.0024 0.0037 0.0033 0.0041 0.0073 0.0085 0.0064Std 0.0018 0.0007 0.0006 0.0006 0.0009 0.0012 0.0027 0.0035 0.0043 0.0036 0.0040 0.0027
% SEEP PER MILEReach 8 Kersey Gage to Balzac Gage Length 69.7 miles% Seep = Seep divided by Total Inflow to the Reach multiplied by 100
Wtr Yr Oct Nov Dec Jan Feb Mar Apr May Jun Jul Aug Sep1975 0.0012 0.0784197619771978 0.0513 0.02821979 0.4831 0.42851980 0.0305 0.1496 0.1139198119821983 0.1212 0.2447 0.19191984 0.0939 0.0515 0.058519851986 0.05351987 0.16331988198919901991 0.01381992199319941995 0.4207 0.04821996 0.0964 0.06231997 0.337419981999200020012002200320042005 0.0035 0.08122006

% DIVERSION PER MILEReach 8 Kersey Gage to Balzac Gage Length 69.7 miles% Div = Diversions divided by Total Inflow to the Reach multiplied by 100
Wtr Yr Oct Nov Dec Jan Feb Mar Apr May Jun Jul Aug Sep1975 1.2329 1.3495 1.1986 0.9814 0.9390 1.1976 0.8966 0.9312 0.6577 0.9233 0.9153 0.85781976 1.2894 1.3728 1.1225 0.9145 1.2181 0.9082 1.0357 1.1067 1.0997 1.1338 1.0314 1.08931977 1.4030 1.4063 1.3374 1.2642 1.3623 1.0753 1.2376 1.0797 1.2633 1.0880 1.0584 1.27831978 1.3017 1.4076 1.4072 1.3399 1.3806 1.3991 0.9537 1.1605 1.1182 1.0830 1.0526 1.04911979 1.2429 1.4012 1.3488 1.1358 0.8950 1.3485 1.1466 0.4061 0.1373 0.9656 0.4886 0.97741980 1.1530 1.0308 0.5018 0.3902 0.3639 0.4410 0.2404 0.1306 0.3618 1.0319 1.1121 0.97451981 1.3745 1.1446 1.0175 0.6745 1.2530 1.1965 0.9381 1.1091 0.6835 1.1713 1.0855 1.09591982 1.3674 1.4146 1.3697 1.1954 1.1888 1.3902 1.1948 1.1764 1.2437 1.0016 1.0476 1.15681983 1.3883 1.3372 0.4632 0.2043 0.2587 0.3633 0.1129 0.0985 0.0773 0.3477 0.4967 0.47661984 0.8189 0.7209 0.3217 0.2374 0.3233 0.7546 0.2660 0.2320 0.4577 1.0895 0.5064 0.41771985 0.3357 0.4275 0.6096 0.3363 0.3335 1.2725 1.1602 0.4011 0.5899 0.9291 0.9094 0.73521986 0.9206 0.9921 0.3656 0.4191 0.9027 1.3872 0.3412 1.1749 0.3311 0.9087 1.0478 0.59841987 1.1117 1.0282 0.6987 0.6331 0.8320 0.3588 0.7293 0.2851 0.4756 1.0587 0.9324 0.90291988 1.3835 1.2978 0.7898 0.1860 0.1838 0.7679 1.0665 0.8242 0.8258 1.0485 1.0556 1.00881989 1.3652 1.3921 0.8401 0.6347 0.5789 1.1153 1.2424 0.9443 1.0960 1.1421 1.0195 1.13051990 1.3419 1.3911 1.0269 0.8383 0.7096 0.6287 0.6656 1.0918 1.0156 0.9737 0.9508 1.02981991 1.3706 1.3997 1.1191 0.6352 0.8345 1.0133 1.1695 1.0088 0.7973 0.9871 1.0114 0.96281992 1.2947 1.3319 1.3109 0.5371 0.5662 0.4639 0.9826 0.9478 1.1010 1.1730 0.8580 0.93531993 1.2878 1.3249 0.6042 0.4624 0.6042 0.5913 0.8794 1.0162 1.1429 0.9849 1.0522 0.57661994 1.2024 1.1368 1.1186 0.8681 0.5161 0.8399 1.1316 1.0005 1.1730 1.0941 0.9553 0.93421995 1.3318 1.4021 1.3518 1.2280 1.2643 0.9555 1.1623 0.3512 0.0720 0.2908 1.0838 0.72721996 0.7402 1.3406 1.1353 0.4743 0.4828 0.7971 1.1723 0.9177 0.9253 1.0694 1.0637 0.45231997 0.8814 1.4095 0.9313 0.4586 0.6165 0.7787 1.1199 1.0488 0.1614 0.9747 0.5967 0.62561998 0.7560 0.6528 0.5836 0.1543 0.3165 0.5779 0.5241 0.6670 0.6920 0.8877 1.0576 0.73831999 0.5388 1.1892 0.8761 0.6016 0.7436 1.1088 1.1025 0.2470 0.3117 1.0186 0.4926 0.45362000 0.9311 1.0445 0.3131 0.5319 0.3337 0.5647 0.9739 1.1200 1.2054 1.0716 0.9782 0.88512001 1.3867 1.2504 1.0782 0.8005 0.8812 1.2903 0.9463 0.8577 1.0207 0.9419 1.0052 0.92082002 1.2310 1.3497 1.2782 1.0861 1.1988 1.2552 1.1013 1.1517 1.0844 1.0764 0.8791 1.06972003 0.8319 1.1454 1.3902 1.2847 1.1980 1.2684 1.2392 1.1445 1.1264 1.1226 1.1553 1.01602004 1.1843 1.3950 1.3943 1.2775 1.3287 1.2740 1.0274 0.9122 1.0693 1.0909 1.0603 1.15052005 1.1436 1.3492 1.2037 1.0471 1.3243 1.1965 1.3722 1.1797 0.6596 1.1046 1.1390 1.07402006 1.0393 1.3660 1.0838 1.4026 1.2346 1.2814 1.2706 1.0422 1.0738 0.9940 1.0510 1.0905Avg 1.1307 1.2251 0.9747 0.7573 0.8177 0.9644 0.9501 0.8364 0.7828 0.9931 0.9422 0.8872Max 1.4030 1.4146 1.4072 1.4026 1.3806 1.3991 1.3722 1.1797 1.2633 1.1730 1.1553 1.2783Min 0.3357 0.4275 0.3131 0.1543 0.1838 0.3588 0.1129 0.0985 0.0720 0.2908 0.4886 0.4177Std 0.2708 0.2409 0.3452 0.3763 0.3802 0.3292 0.3219 0.3500 0.3758 0.1897 0.1963 0.2332
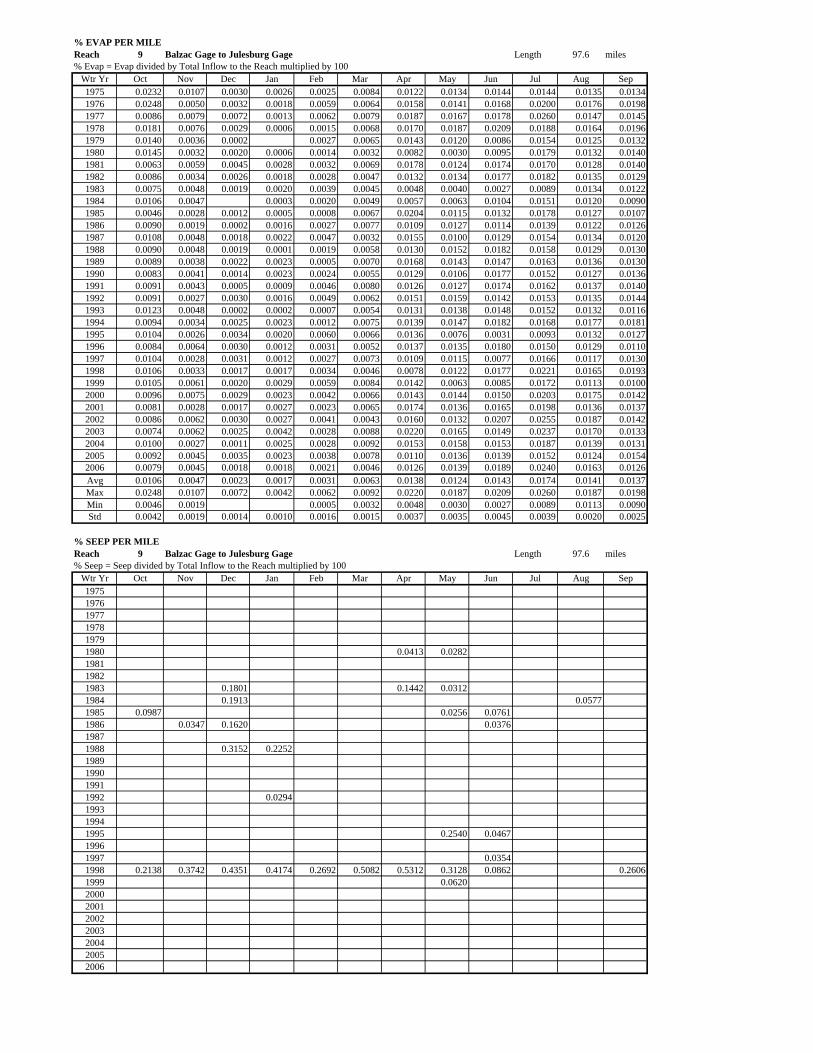
% EVAP PER MILEReach 9 Balzac Gage to Julesburg Gage Length 97.6 miles% Evap = Evap divided by Total Inflow to the Reach multiplied by 100
Wtr Yr Oct Nov Dec Jan Feb Mar Apr May Jun Jul Aug Sep1975 0.0232 0.0107 0.0030 0.0026 0.0025 0.0084 0.0122 0.0134 0.0144 0.0144 0.0135 0.01341976 0.0248 0.0050 0.0032 0.0018 0.0059 0.0064 0.0158 0.0141 0.0168 0.0200 0.0176 0.01981977 0.0086 0.0079 0.0072 0.0013 0.0062 0.0079 0.0187 0.0167 0.0178 0.0260 0.0147 0.01451978 0.0181 0.0076 0.0029 0.0006 0.0015 0.0068 0.0170 0.0187 0.0209 0.0188 0.0164 0.01961979 0.0140 0.0036 0.0002 0.0027 0.0065 0.0143 0.0120 0.0086 0.0154 0.0125 0.01321980 0.0145 0.0032 0.0020 0.0006 0.0014 0.0032 0.0082 0.0030 0.0095 0.0179 0.0132 0.01401981 0.0063 0.0059 0.0045 0.0028 0.0032 0.0069 0.0178 0.0124 0.0174 0.0170 0.0128 0.01401982 0.0086 0.0034 0.0026 0.0018 0.0028 0.0047 0.0132 0.0134 0.0177 0.0182 0.0135 0.01291983 0.0075 0.0048 0.0019 0.0020 0.0039 0.0045 0.0048 0.0040 0.0027 0.0089 0.0134 0.01221984 0.0106 0.0047 0.0003 0.0020 0.0049 0.0057 0.0063 0.0104 0.0151 0.0120 0.00901985 0.0046 0.0028 0.0012 0.0005 0.0008 0.0067 0.0204 0.0115 0.0132 0.0178 0.0127 0.01071986 0.0090 0.0019 0.0002 0.0016 0.0027 0.0077 0.0109 0.0127 0.0114 0.0139 0.0122 0.01261987 0.0108 0.0048 0.0018 0.0022 0.0047 0.0032 0.0155 0.0100 0.0129 0.0154 0.0134 0.01201988 0.0090 0.0048 0.0019 0.0001 0.0019 0.0058 0.0130 0.0152 0.0182 0.0158 0.0129 0.01301989 0.0089 0.0038 0.0022 0.0023 0.0005 0.0070 0.0168 0.0143 0.0147 0.0163 0.0136 0.01301990 0.0083 0.0041 0.0014 0.0023 0.0024 0.0055 0.0129 0.0106 0.0177 0.0152 0.0127 0.01361991 0.0091 0.0043 0.0005 0.0009 0.0046 0.0080 0.0126 0.0127 0.0174 0.0162 0.0137 0.01401992 0.0091 0.0027 0.0030 0.0016 0.0049 0.0062 0.0151 0.0159 0.0142 0.0153 0.0135 0.01441993 0.0123 0.0048 0.0002 0.0002 0.0007 0.0054 0.0131 0.0138 0.0148 0.0152 0.0132 0.01161994 0.0094 0.0034 0.0025 0.0023 0.0012 0.0075 0.0139 0.0147 0.0182 0.0168 0.0177 0.01811995 0.0104 0.0026 0.0034 0.0020 0.0060 0.0066 0.0136 0.0076 0.0031 0.0093 0.0132 0.01271996 0.0084 0.0064 0.0030 0.0012 0.0031 0.0052 0.0137 0.0135 0.0180 0.0150 0.0129 0.01101997 0.0104 0.0028 0.0031 0.0012 0.0027 0.0073 0.0109 0.0115 0.0077 0.0166 0.0117 0.01301998 0.0106 0.0033 0.0017 0.0017 0.0034 0.0046 0.0078 0.0122 0.0177 0.0221 0.0165 0.01931999 0.0105 0.0061 0.0020 0.0029 0.0059 0.0084 0.0142 0.0063 0.0085 0.0172 0.0113 0.01002000 0.0096 0.0075 0.0029 0.0023 0.0042 0.0066 0.0143 0.0144 0.0150 0.0203 0.0175 0.01422001 0.0081 0.0028 0.0017 0.0027 0.0023 0.0065 0.0174 0.0136 0.0165 0.0198 0.0136 0.01372002 0.0086 0.0062 0.0030 0.0027 0.0041 0.0043 0.0160 0.0132 0.0207 0.0255 0.0187 0.01422003 0.0074 0.0062 0.0025 0.0042 0.0028 0.0088 0.0220 0.0165 0.0149 0.0237 0.0170 0.01332004 0.0100 0.0027 0.0011 0.0025 0.0028 0.0092 0.0153 0.0158 0.0153 0.0187 0.0139 0.01312005 0.0092 0.0045 0.0035 0.0023 0.0038 0.0078 0.0110 0.0136 0.0139 0.0152 0.0124 0.01542006 0.0079 0.0045 0.0018 0.0018 0.0021 0.0046 0.0126 0.0139 0.0189 0.0240 0.0163 0.0126Avg 0.0106 0.0047 0.0023 0.0017 0.0031 0.0063 0.0138 0.0124 0.0143 0.0174 0.0141 0.0137Max 0.0248 0.0107 0.0072 0.0042 0.0062 0.0092 0.0220 0.0187 0.0209 0.0260 0.0187 0.0198Min 0.0046 0.0019 0.0005 0.0032 0.0048 0.0030 0.0027 0.0089 0.0113 0.0090Std 0.0042 0.0019 0.0014 0.0010 0.0016 0.0015 0.0037 0.0035 0.0045 0.0039 0.0020 0.0025
% SEEP PER MILEReach 9 Balzac Gage to Julesburg Gage Length 97.6 miles% Seep = Seep divided by Total Inflow to the Reach multiplied by 100
Wtr Yr Oct Nov Dec Jan Feb Mar Apr May Jun Jul Aug Sep197519761977197819791980 0.0413 0.0282198119821983 0.1801 0.1442 0.03121984 0.1913 0.05771985 0.0987 0.0256 0.07611986 0.0347 0.1620 0.037619871988 0.3152 0.22521989199019911992 0.0294199319941995 0.2540 0.046719961997 0.03541998 0.2138 0.3742 0.4351 0.4174 0.2692 0.5082 0.5312 0.3128 0.0862 0.26061999 0.06202000200120022003200420052006
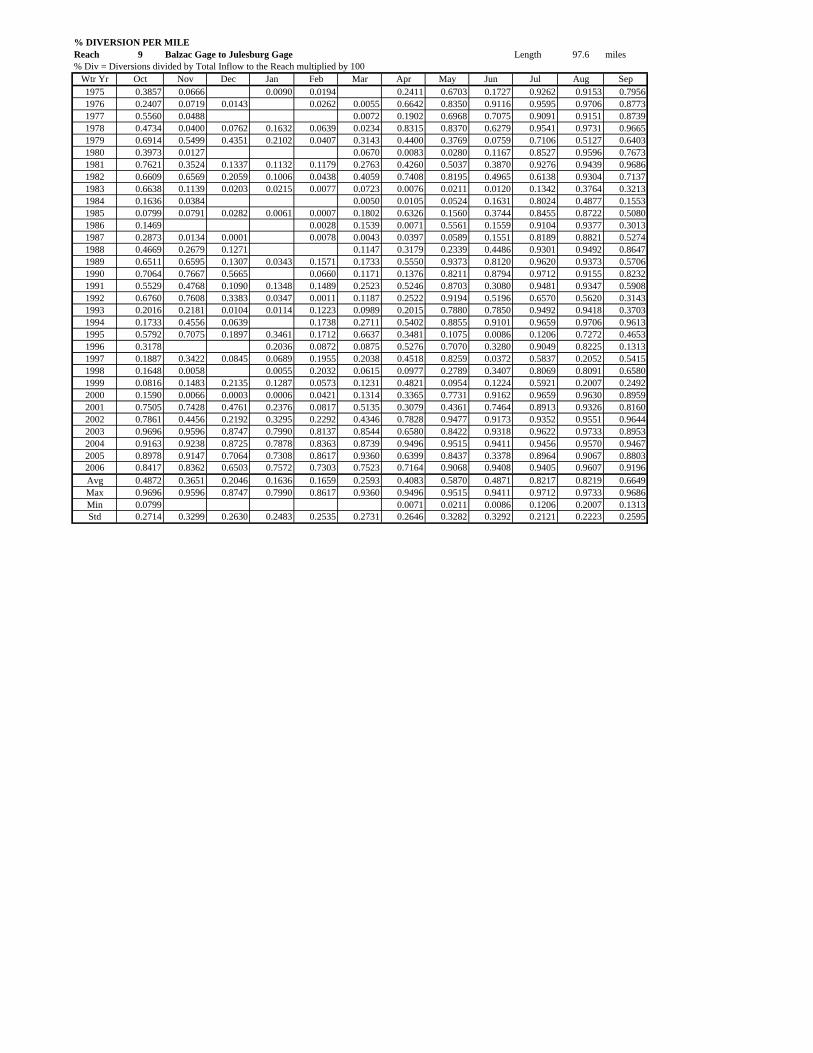
% DIVERSION PER MILEReach 9 Balzac Gage to Julesburg Gage Length 97.6 miles% Div = Diversions divided by Total Inflow to the Reach multiplied by 100
Wtr Yr Oct Nov Dec Jan Feb Mar Apr May Jun Jul Aug Sep1975 0.3857 0.0666 0.0090 0.0194 0.2411 0.6703 0.1727 0.9262 0.9153 0.79561976 0.2407 0.0719 0.0143 0.0262 0.0055 0.6642 0.8350 0.9116 0.9595 0.9706 0.87731977 0.5560 0.0488 0.0072 0.1902 0.6968 0.7075 0.9091 0.9151 0.87391978 0.4734 0.0400 0.0762 0.1632 0.0639 0.0234 0.8315 0.8370 0.6279 0.9541 0.9731 0.96651979 0.6914 0.5499 0.4351 0.2102 0.0407 0.3143 0.4400 0.3769 0.0759 0.7106 0.5127 0.64031980 0.3973 0.0127 0.0670 0.0083 0.0280 0.1167 0.8527 0.9596 0.76731981 0.7621 0.3524 0.1337 0.1132 0.1179 0.2763 0.4260 0.5037 0.3870 0.9276 0.9439 0.96861982 0.6609 0.6569 0.2059 0.1006 0.0438 0.4059 0.7408 0.8195 0.4965 0.6138 0.9304 0.71371983 0.6638 0.1139 0.0203 0.0215 0.0077 0.0723 0.0076 0.0211 0.0120 0.1342 0.3764 0.32131984 0.1636 0.0384 0.0050 0.0105 0.0524 0.1631 0.8024 0.4877 0.15531985 0.0799 0.0791 0.0282 0.0061 0.0007 0.1802 0.6326 0.1560 0.3744 0.8455 0.8722 0.50801986 0.1469 0.0028 0.1539 0.0071 0.5561 0.1559 0.9104 0.9377 0.30131987 0.2873 0.0134 0.0001 0.0078 0.0043 0.0397 0.0589 0.1551 0.8189 0.8821 0.52741988 0.4669 0.2679 0.1271 0.1147 0.3179 0.2339 0.4486 0.9301 0.9492 0.86471989 0.6511 0.6595 0.1307 0.0343 0.1571 0.1733 0.5550 0.9373 0.8120 0.9620 0.9373 0.57061990 0.7064 0.7667 0.5665 0.0660 0.1171 0.1376 0.8211 0.8794 0.9712 0.9155 0.82321991 0.5529 0.4768 0.1090 0.1348 0.1489 0.2523 0.5246 0.8703 0.3080 0.9481 0.9347 0.59081992 0.6760 0.7608 0.3383 0.0347 0.0011 0.1187 0.2522 0.9194 0.5196 0.6570 0.5620 0.31431993 0.2016 0.2181 0.0104 0.0114 0.1223 0.0989 0.2015 0.7880 0.7850 0.9492 0.9418 0.37031994 0.1733 0.4556 0.0639 0.1738 0.2711 0.5402 0.8855 0.9101 0.9659 0.9706 0.96131995 0.5792 0.7075 0.1897 0.3461 0.1712 0.6637 0.3481 0.1075 0.0086 0.1206 0.7272 0.46531996 0.3178 0.2036 0.0872 0.0875 0.5276 0.7070 0.3280 0.9049 0.8225 0.13131997 0.1887 0.3422 0.0845 0.0689 0.1955 0.2038 0.4518 0.8259 0.0372 0.5837 0.2052 0.54151998 0.1648 0.0058 0.0055 0.2032 0.0615 0.0977 0.2789 0.3407 0.8069 0.8091 0.65801999 0.0816 0.1483 0.2135 0.1287 0.0573 0.1231 0.4821 0.0954 0.1224 0.5921 0.2007 0.24922000 0.1590 0.0066 0.0003 0.0006 0.0421 0.1314 0.3365 0.7731 0.9162 0.9659 0.9630 0.89592001 0.7505 0.7428 0.4761 0.2376 0.0817 0.5135 0.3079 0.4361 0.7464 0.8913 0.9326 0.81602002 0.7861 0.4456 0.2192 0.3295 0.2292 0.4346 0.7828 0.9477 0.9173 0.9352 0.9551 0.96442003 0.9696 0.9596 0.8747 0.7990 0.8137 0.8544 0.6580 0.8422 0.9318 0.9622 0.9733 0.89532004 0.9163 0.9238 0.8725 0.7878 0.8363 0.8739 0.9496 0.9515 0.9411 0.9456 0.9570 0.94672005 0.8978 0.9147 0.7064 0.7308 0.8617 0.9360 0.6399 0.8437 0.3378 0.8964 0.9067 0.88032006 0.8417 0.8362 0.6503 0.7572 0.7303 0.7523 0.7164 0.9068 0.9408 0.9405 0.9607 0.9196Avg 0.4872 0.3651 0.2046 0.1636 0.1659 0.2593 0.4083 0.5870 0.4871 0.8217 0.8219 0.6649Max 0.9696 0.9596 0.8747 0.7990 0.8617 0.9360 0.9496 0.9515 0.9411 0.9712 0.9733 0.9686Min 0.0799 0.0071 0.0211 0.0086 0.1206 0.2007 0.1313Std 0.2714 0.3299 0.2630 0.2483 0.2535 0.2731 0.2646 0.3282 0.3292 0.2121 0.2223 0.2595
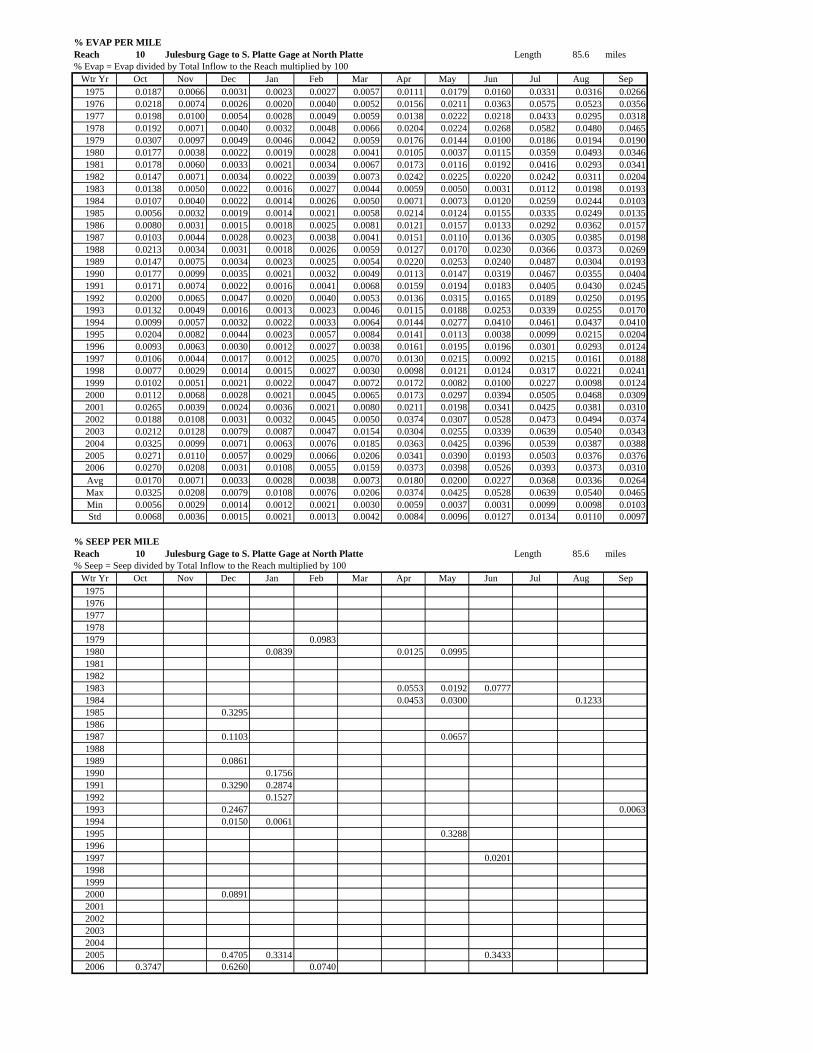
% EVAP PER MILEReach 10 Julesburg Gage to S. Platte Gage at North Platte Length 85.6 miles% Evap = Evap divided by Total Inflow to the Reach multiplied by 100
Wtr Yr Oct Nov Dec Jan Feb Mar Apr May Jun Jul Aug Sep1975 0.0187 0.0066 0.0031 0.0023 0.0027 0.0057 0.0111 0.0179 0.0160 0.0331 0.0316 0.02661976 0.0218 0.0074 0.0026 0.0020 0.0040 0.0052 0.0156 0.0211 0.0363 0.0575 0.0523 0.03561977 0.0198 0.0100 0.0054 0.0028 0.0049 0.0059 0.0138 0.0222 0.0218 0.0433 0.0295 0.03181978 0.0192 0.0071 0.0040 0.0032 0.0048 0.0066 0.0204 0.0224 0.0268 0.0582 0.0480 0.04651979 0.0307 0.0097 0.0049 0.0046 0.0042 0.0059 0.0176 0.0144 0.0100 0.0186 0.0194 0.01901980 0.0177 0.0038 0.0022 0.0019 0.0028 0.0041 0.0105 0.0037 0.0115 0.0359 0.0493 0.03461981 0.0178 0.0060 0.0033 0.0021 0.0034 0.0067 0.0173 0.0116 0.0192 0.0416 0.0293 0.03411982 0.0147 0.0071 0.0034 0.0022 0.0039 0.0073 0.0242 0.0225 0.0220 0.0242 0.0311 0.02041983 0.0138 0.0050 0.0022 0.0016 0.0027 0.0044 0.0059 0.0050 0.0031 0.0112 0.0198 0.01931984 0.0107 0.0040 0.0022 0.0014 0.0026 0.0050 0.0071 0.0073 0.0120 0.0259 0.0244 0.01031985 0.0056 0.0032 0.0019 0.0014 0.0021 0.0058 0.0214 0.0124 0.0155 0.0335 0.0249 0.01351986 0.0080 0.0031 0.0015 0.0018 0.0025 0.0081 0.0121 0.0157 0.0133 0.0292 0.0362 0.01571987 0.0103 0.0044 0.0028 0.0023 0.0038 0.0041 0.0151 0.0110 0.0136 0.0305 0.0385 0.01981988 0.0213 0.0034 0.0031 0.0018 0.0026 0.0059 0.0127 0.0170 0.0230 0.0366 0.0373 0.02691989 0.0147 0.0075 0.0034 0.0023 0.0025 0.0054 0.0220 0.0253 0.0240 0.0487 0.0304 0.01931990 0.0177 0.0099 0.0035 0.0021 0.0032 0.0049 0.0113 0.0147 0.0319 0.0467 0.0355 0.04041991 0.0171 0.0074 0.0022 0.0016 0.0041 0.0068 0.0159 0.0194 0.0183 0.0405 0.0430 0.02451992 0.0200 0.0065 0.0047 0.0020 0.0040 0.0053 0.0136 0.0315 0.0165 0.0189 0.0250 0.01951993 0.0132 0.0049 0.0016 0.0013 0.0023 0.0046 0.0115 0.0188 0.0253 0.0339 0.0255 0.01701994 0.0099 0.0057 0.0032 0.0022 0.0033 0.0064 0.0144 0.0277 0.0410 0.0461 0.0437 0.04101995 0.0204 0.0082 0.0044 0.0023 0.0057 0.0084 0.0141 0.0113 0.0038 0.0099 0.0215 0.02041996 0.0093 0.0063 0.0030 0.0012 0.0027 0.0038 0.0161 0.0195 0.0196 0.0301 0.0293 0.01241997 0.0106 0.0044 0.0017 0.0012 0.0025 0.0070 0.0130 0.0215 0.0092 0.0215 0.0161 0.01881998 0.0077 0.0029 0.0014 0.0015 0.0027 0.0030 0.0098 0.0121 0.0124 0.0317 0.0221 0.02411999 0.0102 0.0051 0.0021 0.0022 0.0047 0.0072 0.0172 0.0082 0.0100 0.0227 0.0098 0.01242000 0.0112 0.0068 0.0028 0.0021 0.0045 0.0065 0.0173 0.0297 0.0394 0.0505 0.0468 0.03092001 0.0265 0.0039 0.0024 0.0036 0.0021 0.0080 0.0211 0.0198 0.0341 0.0425 0.0381 0.03102002 0.0188 0.0108 0.0031 0.0032 0.0045 0.0050 0.0374 0.0307 0.0528 0.0473 0.0494 0.03742003 0.0212 0.0128 0.0079 0.0087 0.0047 0.0154 0.0304 0.0255 0.0339 0.0639 0.0540 0.03432004 0.0325 0.0099 0.0071 0.0063 0.0076 0.0185 0.0363 0.0425 0.0396 0.0539 0.0387 0.03882005 0.0271 0.0110 0.0057 0.0029 0.0066 0.0206 0.0341 0.0390 0.0193 0.0503 0.0376 0.03762006 0.0270 0.0208 0.0031 0.0108 0.0055 0.0159 0.0373 0.0398 0.0526 0.0393 0.0373 0.0310Avg 0.0170 0.0071 0.0033 0.0028 0.0038 0.0073 0.0180 0.0200 0.0227 0.0368 0.0336 0.0264Max 0.0325 0.0208 0.0079 0.0108 0.0076 0.0206 0.0374 0.0425 0.0528 0.0639 0.0540 0.0465Min 0.0056 0.0029 0.0014 0.0012 0.0021 0.0030 0.0059 0.0037 0.0031 0.0099 0.0098 0.0103Std 0.0068 0.0036 0.0015 0.0021 0.0013 0.0042 0.0084 0.0096 0.0127 0.0134 0.0110 0.0097
% SEEP PER MILEReach 10 Julesburg Gage to S. Platte Gage at North Platte Length 85.6 miles% Seep = Seep divided by Total Inflow to the Reach multiplied by 100
Wtr Yr Oct Nov Dec Jan Feb Mar Apr May Jun Jul Aug Sep19751976197719781979 0.09831980 0.0839 0.0125 0.0995198119821983 0.0553 0.0192 0.07771984 0.0453 0.0300 0.12331985 0.329519861987 0.1103 0.065719881989 0.08611990 0.17561991 0.3290 0.28741992 0.15271993 0.2467 0.00631994 0.0150 0.00611995 0.328819961997 0.0201199819992000 0.089120012002200320042005 0.4705 0.3314 0.34332006 0.3747 0.6260 0.0740
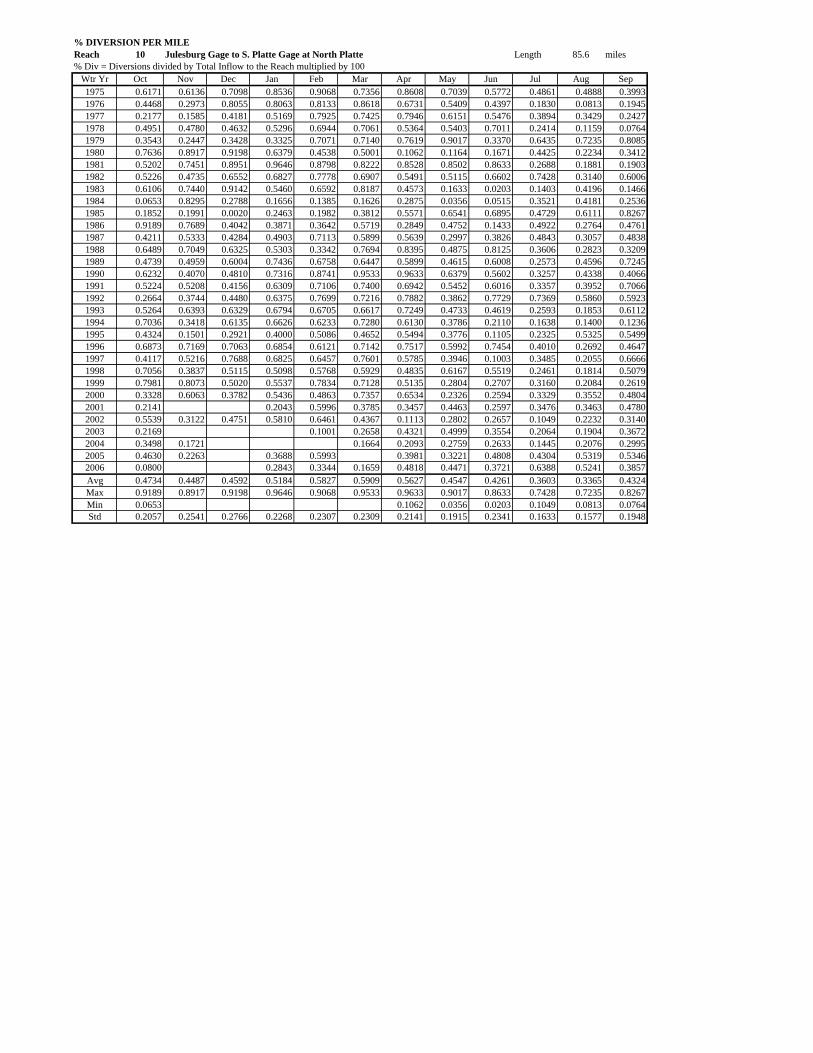
% DIVERSION PER MILEReach 10 Julesburg Gage to S. Platte Gage at North Platte Length 85.6 miles% Div = Diversions divided by Total Inflow to the Reach multiplied by 100
Wtr Yr Oct Nov Dec Jan Feb Mar Apr May Jun Jul Aug Sep1975 0.6171 0.6136 0.7098 0.8536 0.9068 0.7356 0.8608 0.7039 0.5772 0.4861 0.4888 0.39931976 0.4468 0.2973 0.8055 0.8063 0.8133 0.8618 0.6731 0.5409 0.4397 0.1830 0.0813 0.19451977 0.2177 0.1585 0.4181 0.5169 0.7925 0.7425 0.7946 0.6151 0.5476 0.3894 0.3429 0.24271978 0.4951 0.4780 0.4632 0.5296 0.6944 0.7061 0.5364 0.5403 0.7011 0.2414 0.1159 0.07641979 0.3543 0.2447 0.3428 0.3325 0.7071 0.7140 0.7619 0.9017 0.3370 0.6435 0.7235 0.80851980 0.7636 0.8917 0.9198 0.6379 0.4538 0.5001 0.1062 0.1164 0.1671 0.4425 0.2234 0.34121981 0.5202 0.7451 0.8951 0.9646 0.8798 0.8222 0.8528 0.8502 0.8633 0.2688 0.1881 0.19031982 0.5226 0.4735 0.6552 0.6827 0.7778 0.6907 0.5491 0.5115 0.6602 0.7428 0.3140 0.60061983 0.6106 0.7440 0.9142 0.5460 0.6592 0.8187 0.4573 0.1633 0.0203 0.1403 0.4196 0.14661984 0.0653 0.8295 0.2788 0.1656 0.1385 0.1626 0.2875 0.0356 0.0515 0.3521 0.4181 0.25361985 0.1852 0.1991 0.0020 0.2463 0.1982 0.3812 0.5571 0.6541 0.6895 0.4729 0.6111 0.82671986 0.9189 0.7689 0.4042 0.3871 0.3642 0.5719 0.2849 0.4752 0.1433 0.4922 0.2764 0.47611987 0.4211 0.5333 0.4284 0.4903 0.7113 0.5899 0.5639 0.2997 0.3826 0.4843 0.3057 0.48381988 0.6489 0.7049 0.6325 0.5303 0.3342 0.7694 0.8395 0.4875 0.8125 0.3606 0.2823 0.32091989 0.4739 0.4959 0.6004 0.7436 0.6758 0.6447 0.5899 0.4615 0.6008 0.2573 0.4596 0.72451990 0.6232 0.4070 0.4810 0.7316 0.8741 0.9533 0.9633 0.6379 0.5602 0.3257 0.4338 0.40661991 0.5224 0.5208 0.4156 0.6309 0.7106 0.7400 0.6942 0.5452 0.6016 0.3357 0.3952 0.70661992 0.2664 0.3744 0.4480 0.6375 0.7699 0.7216 0.7882 0.3862 0.7729 0.7369 0.5860 0.59231993 0.5264 0.6393 0.6329 0.6794 0.6705 0.6617 0.7249 0.4733 0.4619 0.2593 0.1853 0.61121994 0.7036 0.3418 0.6135 0.6626 0.6233 0.7280 0.6130 0.3786 0.2110 0.1638 0.1400 0.12361995 0.4324 0.1501 0.2921 0.4000 0.5086 0.4652 0.5494 0.3776 0.1105 0.2325 0.5325 0.54991996 0.6873 0.7169 0.7063 0.6854 0.6121 0.7142 0.7517 0.5992 0.7454 0.4010 0.2692 0.46471997 0.4117 0.5216 0.7688 0.6825 0.6457 0.7601 0.5785 0.3946 0.1003 0.3485 0.2055 0.66661998 0.7056 0.3837 0.5115 0.5098 0.5768 0.5929 0.4835 0.6167 0.5519 0.2461 0.1814 0.50791999 0.7981 0.8073 0.5020 0.5537 0.7834 0.7128 0.5135 0.2804 0.2707 0.3160 0.2084 0.26192000 0.3328 0.6063 0.3782 0.5436 0.4863 0.7357 0.6534 0.2326 0.2594 0.3329 0.3552 0.48042001 0.2141 0.2043 0.5996 0.3785 0.3457 0.4463 0.2597 0.3476 0.3463 0.47802002 0.5539 0.3122 0.4751 0.5810 0.6461 0.4367 0.1113 0.2802 0.2657 0.1049 0.2232 0.31402003 0.2169 0.1001 0.2658 0.4321 0.4999 0.3554 0.2064 0.1904 0.36722004 0.3498 0.1721 0.1664 0.2093 0.2759 0.2633 0.1445 0.2076 0.29952005 0.4630 0.2263 0.3688 0.5993 0.3981 0.3221 0.4808 0.4304 0.5319 0.53462006 0.0800 0.2843 0.3344 0.1659 0.4818 0.4471 0.3721 0.6388 0.5241 0.3857Avg 0.4734 0.4487 0.4592 0.5184 0.5827 0.5909 0.5627 0.4547 0.4261 0.3603 0.3365 0.4324Max 0.9189 0.8917 0.9198 0.9646 0.9068 0.9533 0.9633 0.9017 0.8633 0.7428 0.7235 0.8267Min 0.0653 0.1062 0.0356 0.0203 0.1049 0.0813 0.0764Std 0.2057 0.2541 0.2766 0.2268 0.2307 0.2309 0.2141 0.1915 0.2341 0.1633 0.1577 0.1948
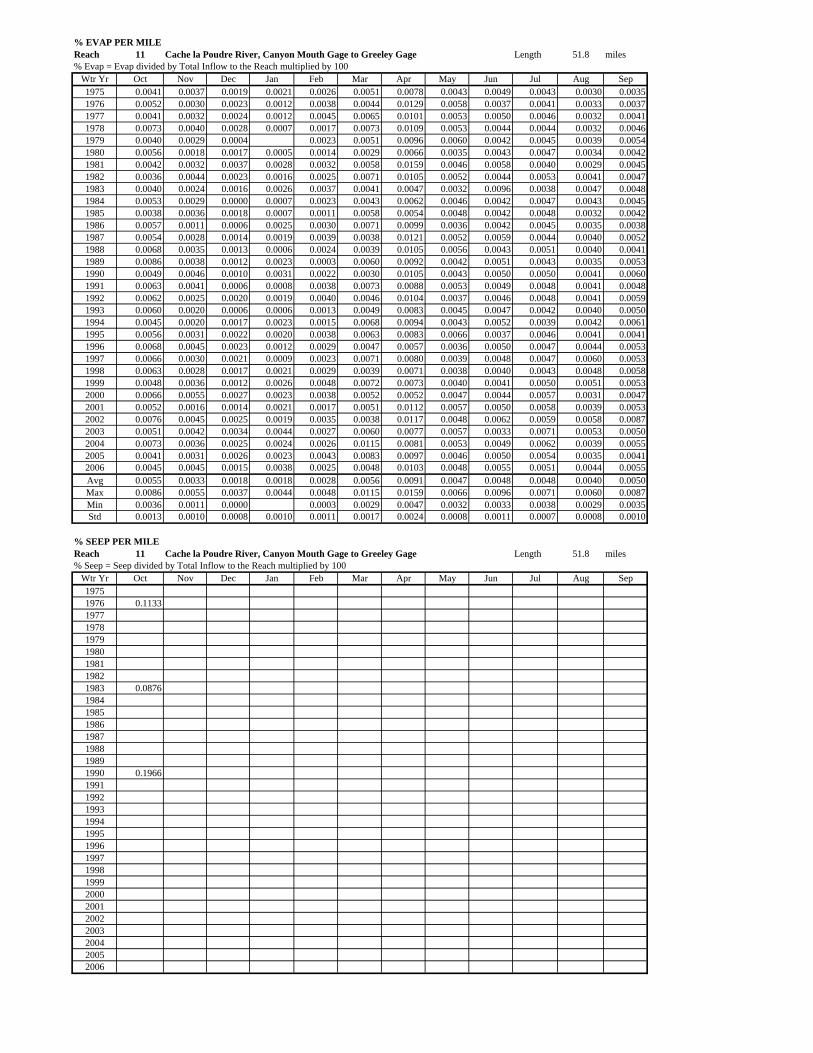
% EVAP PER MILEReach 11 Cache la Poudre River, Canyon Mouth Gage to Greeley Gage Length 51.8 miles% Evap = Evap divided by Total Inflow to the Reach multiplied by 100
Wtr Yr Oct Nov Dec Jan Feb Mar Apr May Jun Jul Aug Sep1975 0.0041 0.0037 0.0019 0.0021 0.0026 0.0051 0.0078 0.0043 0.0049 0.0043 0.0030 0.00351976 0.0052 0.0030 0.0023 0.0012 0.0038 0.0044 0.0129 0.0058 0.0037 0.0041 0.0033 0.00371977 0.0041 0.0032 0.0024 0.0012 0.0045 0.0065 0.0101 0.0053 0.0050 0.0046 0.0032 0.00411978 0.0073 0.0040 0.0028 0.0007 0.0017 0.0073 0.0109 0.0053 0.0044 0.0044 0.0032 0.00461979 0.0040 0.0029 0.0004 0.0023 0.0051 0.0096 0.0060 0.0042 0.0045 0.0039 0.00541980 0.0056 0.0018 0.0017 0.0005 0.0014 0.0029 0.0066 0.0035 0.0043 0.0047 0.0034 0.00421981 0.0042 0.0032 0.0037 0.0028 0.0032 0.0058 0.0159 0.0046 0.0058 0.0040 0.0029 0.00451982 0.0036 0.0044 0.0023 0.0016 0.0025 0.0071 0.0105 0.0052 0.0044 0.0053 0.0041 0.00471983 0.0040 0.0024 0.0016 0.0026 0.0037 0.0041 0.0047 0.0032 0.0096 0.0038 0.0047 0.00481984 0.0053 0.0029 0.0000 0.0007 0.0023 0.0043 0.0062 0.0046 0.0042 0.0047 0.0043 0.00451985 0.0038 0.0036 0.0018 0.0007 0.0011 0.0058 0.0054 0.0048 0.0042 0.0048 0.0032 0.00421986 0.0057 0.0011 0.0006 0.0025 0.0030 0.0071 0.0099 0.0036 0.0042 0.0045 0.0035 0.00381987 0.0054 0.0028 0.0014 0.0019 0.0039 0.0038 0.0121 0.0052 0.0059 0.0044 0.0040 0.00521988 0.0068 0.0035 0.0013 0.0006 0.0024 0.0039 0.0105 0.0056 0.0043 0.0051 0.0040 0.00411989 0.0086 0.0038 0.0012 0.0023 0.0003 0.0060 0.0092 0.0042 0.0051 0.0043 0.0035 0.00531990 0.0049 0.0046 0.0010 0.0031 0.0022 0.0030 0.0105 0.0043 0.0050 0.0050 0.0041 0.00601991 0.0063 0.0041 0.0006 0.0008 0.0038 0.0073 0.0088 0.0053 0.0049 0.0048 0.0041 0.00481992 0.0062 0.0025 0.0020 0.0019 0.0040 0.0046 0.0104 0.0037 0.0046 0.0048 0.0041 0.00591993 0.0060 0.0020 0.0006 0.0006 0.0013 0.0049 0.0083 0.0045 0.0047 0.0042 0.0040 0.00501994 0.0045 0.0020 0.0017 0.0023 0.0015 0.0068 0.0094 0.0043 0.0052 0.0039 0.0042 0.00611995 0.0056 0.0031 0.0022 0.0020 0.0038 0.0063 0.0083 0.0066 0.0037 0.0046 0.0041 0.00411996 0.0068 0.0045 0.0023 0.0012 0.0029 0.0047 0.0057 0.0036 0.0050 0.0047 0.0044 0.00531997 0.0066 0.0030 0.0021 0.0009 0.0023 0.0071 0.0080 0.0039 0.0048 0.0047 0.0060 0.00531998 0.0063 0.0028 0.0017 0.0021 0.0029 0.0039 0.0071 0.0038 0.0040 0.0043 0.0048 0.00581999 0.0048 0.0036 0.0012 0.0026 0.0048 0.0072 0.0073 0.0040 0.0041 0.0050 0.0051 0.00532000 0.0066 0.0055 0.0027 0.0023 0.0038 0.0052 0.0052 0.0047 0.0044 0.0057 0.0031 0.00472001 0.0052 0.0016 0.0014 0.0021 0.0017 0.0051 0.0112 0.0057 0.0050 0.0058 0.0039 0.00532002 0.0076 0.0045 0.0025 0.0019 0.0035 0.0038 0.0117 0.0048 0.0062 0.0059 0.0058 0.00872003 0.0051 0.0042 0.0034 0.0044 0.0027 0.0060 0.0077 0.0057 0.0033 0.0071 0.0053 0.00502004 0.0073 0.0036 0.0025 0.0024 0.0026 0.0115 0.0081 0.0053 0.0049 0.0062 0.0039 0.00552005 0.0041 0.0031 0.0026 0.0023 0.0043 0.0083 0.0097 0.0046 0.0050 0.0054 0.0035 0.00412006 0.0045 0.0045 0.0015 0.0038 0.0025 0.0048 0.0103 0.0048 0.0055 0.0051 0.0044 0.0055Avg 0.0055 0.0033 0.0018 0.0018 0.0028 0.0056 0.0091 0.0047 0.0048 0.0048 0.0040 0.0050Max 0.0086 0.0055 0.0037 0.0044 0.0048 0.0115 0.0159 0.0066 0.0096 0.0071 0.0060 0.0087Min 0.0036 0.0011 0.0000 0.0003 0.0029 0.0047 0.0032 0.0033 0.0038 0.0029 0.0035Std 0.0013 0.0010 0.0008 0.0010 0.0011 0.0017 0.0024 0.0008 0.0011 0.0007 0.0008 0.0010
% SEEP PER MILEReach 11 Cache la Poudre River, Canyon Mouth Gage to Greeley Gage Length 51.8 miles% Seep = Seep divided by Total Inflow to the Reach multiplied by 100
Wtr Yr Oct Nov Dec Jan Feb Mar Apr May Jun Jul Aug Sep19751976 0.11331977197819791980198119821983 0.08761984198519861987198819891990 0.19661991199219931994199519961997199819992000200120022003200420052006
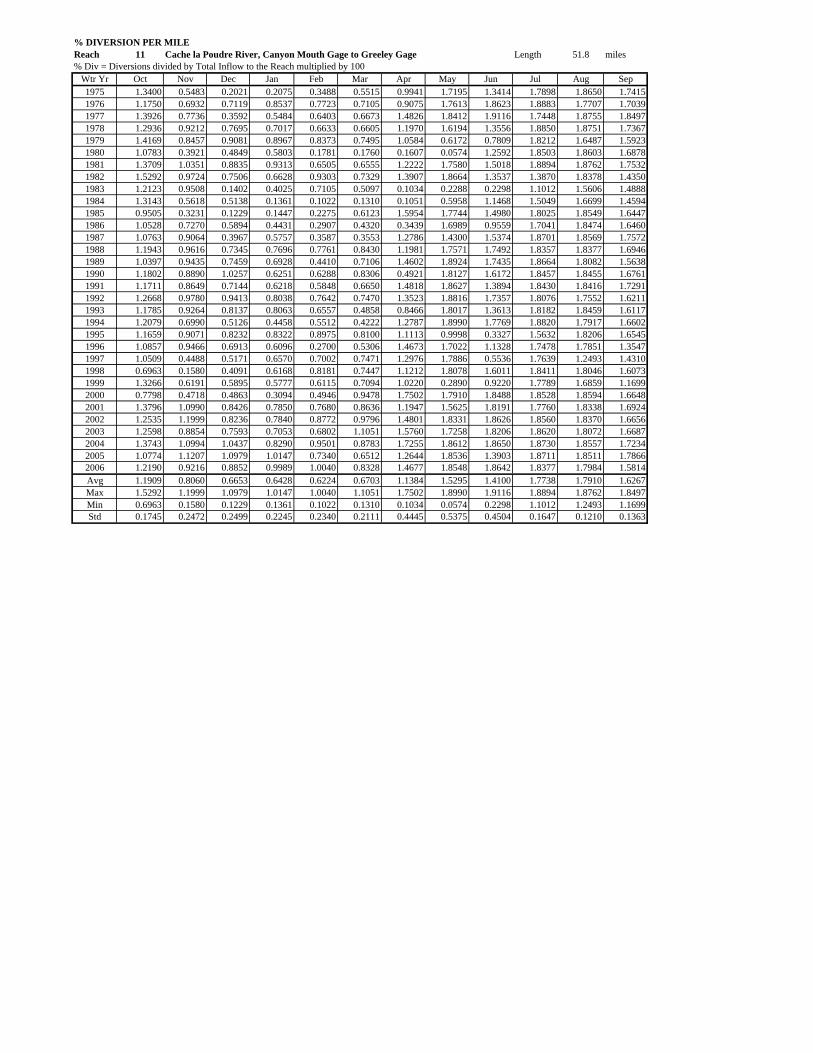
% DIVERSION PER MILEReach 11 Cache la Poudre River, Canyon Mouth Gage to Greeley Gage Length 51.8 miles% Div = Diversions divided by Total Inflow to the Reach multiplied by 100
Wtr Yr Oct Nov Dec Jan Feb Mar Apr May Jun Jul Aug Sep1975 1.3400 0.5483 0.2021 0.2075 0.3488 0.5515 0.9941 1.7195 1.3414 1.7898 1.8650 1.74151976 1.1750 0.6932 0.7119 0.8537 0.7723 0.7105 0.9075 1.7613 1.8623 1.8883 1.7707 1.70391977 1.3926 0.7736 0.3592 0.5484 0.6403 0.6673 1.4826 1.8412 1.9116 1.7448 1.8755 1.84971978 1.2936 0.9212 0.7695 0.7017 0.6633 0.6605 1.1970 1.6194 1.3556 1.8850 1.8751 1.73671979 1.4169 0.8457 0.9081 0.8967 0.8373 0.7495 1.0584 0.6172 0.7809 1.8212 1.6487 1.59231980 1.0783 0.3921 0.4849 0.5803 0.1781 0.1760 0.1607 0.0574 1.2592 1.8503 1.8603 1.68781981 1.3709 1.0351 0.8835 0.9313 0.6505 0.6555 1.2222 1.7580 1.5018 1.8894 1.8762 1.75321982 1.5292 0.9724 0.7506 0.6628 0.9303 0.7329 1.3907 1.8664 1.3537 1.3870 1.8378 1.43501983 1.2123 0.9508 0.1402 0.4025 0.7105 0.5097 0.1034 0.2288 0.2298 1.1012 1.5606 1.48881984 1.3143 0.5618 0.5138 0.1361 0.1022 0.1310 0.1051 0.5958 1.1468 1.5049 1.6699 1.45941985 0.9505 0.3231 0.1229 0.1447 0.2275 0.6123 1.5954 1.7744 1.4980 1.8025 1.8549 1.64471986 1.0528 0.7270 0.5894 0.4431 0.2907 0.4320 0.3439 1.6989 0.9559 1.7041 1.8474 1.64601987 1.0763 0.9064 0.3967 0.5757 0.3587 0.3553 1.2786 1.4300 1.5374 1.8701 1.8569 1.75721988 1.1943 0.9616 0.7345 0.7696 0.7761 0.8430 1.1981 1.7571 1.7492 1.8357 1.8377 1.69461989 1.0397 0.9435 0.7459 0.6928 0.4410 0.7106 1.4602 1.8924 1.7435 1.8664 1.8082 1.56381990 1.1802 0.8890 1.0257 0.6251 0.6288 0.8306 0.4921 1.8127 1.6172 1.8457 1.8455 1.67611991 1.1711 0.8649 0.7144 0.6218 0.5848 0.6650 1.4818 1.8627 1.3894 1.8430 1.8416 1.72911992 1.2668 0.9780 0.9413 0.8038 0.7642 0.7470 1.3523 1.8816 1.7357 1.8076 1.7552 1.62111993 1.1785 0.9264 0.8137 0.8063 0.6557 0.4858 0.8466 1.8017 1.3613 1.8182 1.8459 1.61171994 1.2079 0.6990 0.5126 0.4458 0.5512 0.4222 1.2787 1.8990 1.7769 1.8820 1.7917 1.66021995 1.1659 0.9071 0.8232 0.8322 0.8975 0.8100 1.1113 0.9998 0.3327 1.5632 1.8206 1.65451996 1.0857 0.9466 0.6913 0.6096 0.2700 0.5306 1.4673 1.7022 1.1328 1.7478 1.7851 1.35471997 1.0509 0.4488 0.5171 0.6570 0.7002 0.7471 1.2976 1.7886 0.5536 1.7639 1.2493 1.43101998 0.6963 0.1580 0.4091 0.6168 0.8181 0.7447 1.1212 1.8078 1.6011 1.8411 1.8046 1.60731999 1.3266 0.6191 0.5895 0.5777 0.6115 0.7094 1.0220 0.2890 0.9220 1.7789 1.6859 1.16992000 0.7798 0.4718 0.4863 0.3094 0.4946 0.9478 1.7502 1.7910 1.8488 1.8528 1.8594 1.66482001 1.3796 1.0990 0.8426 0.7850 0.7680 0.8636 1.1947 1.5625 1.8191 1.7760 1.8338 1.69242002 1.2535 1.1999 0.8236 0.7840 0.8772 0.9796 1.4801 1.8331 1.8626 1.8560 1.8370 1.66562003 1.2598 0.8854 0.7593 0.7053 0.6802 1.1051 1.5760 1.7258 1.8206 1.8620 1.8072 1.66872004 1.3743 1.0994 1.0437 0.8290 0.9501 0.8783 1.7255 1.8612 1.8650 1.8730 1.8557 1.72342005 1.0774 1.1207 1.0979 1.0147 0.7340 0.6512 1.2644 1.8536 1.3903 1.8711 1.8511 1.78662006 1.2190 0.9216 0.8852 0.9989 1.0040 0.8328 1.4677 1.8548 1.8642 1.8377 1.7984 1.5814Avg 1.1909 0.8060 0.6653 0.6428 0.6224 0.6703 1.1384 1.5295 1.4100 1.7738 1.7910 1.6267Max 1.5292 1.1999 1.0979 1.0147 1.0040 1.1051 1.7502 1.8990 1.9116 1.8894 1.8762 1.8497Min 0.6963 0.1580 0.1229 0.1361 0.1022 0.1310 0.1034 0.0574 0.2298 1.1012 1.2493 1.1699Std 0.1745 0.2472 0.2499 0.2245 0.2340 0.2111 0.4445 0.5375 0.4504 0.1647 0.1210 0.1363
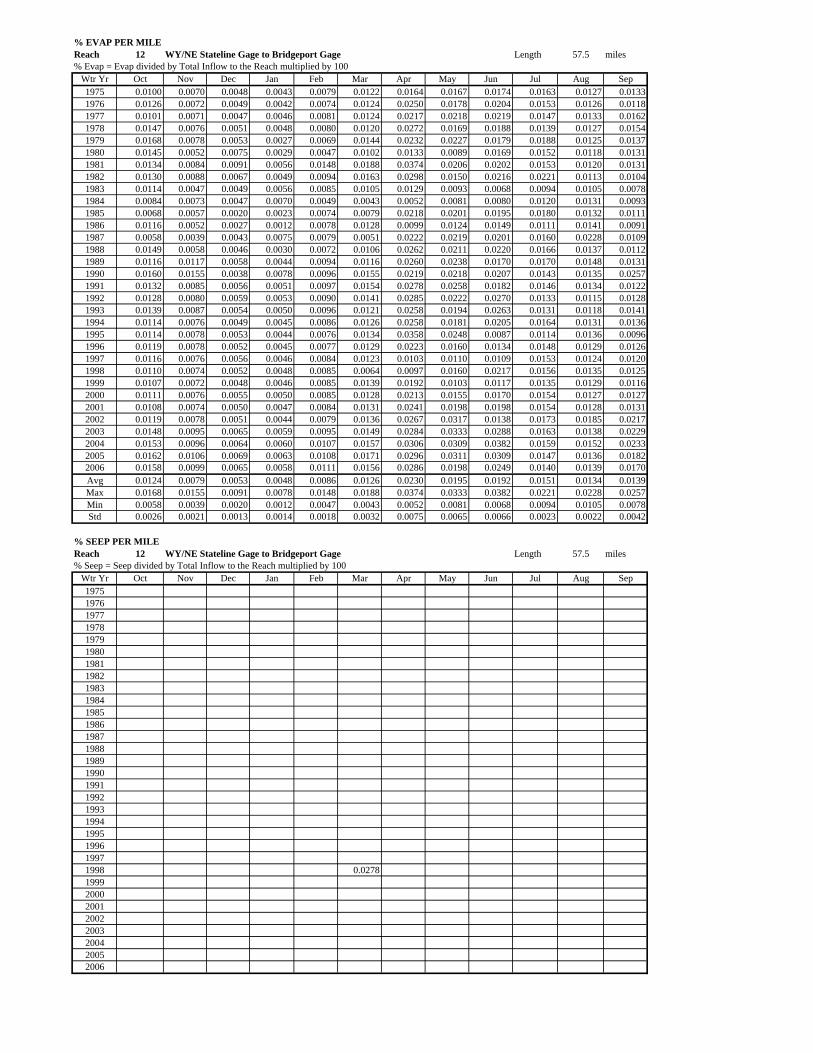
% EVAP PER MILEReach 12 WY/NE Stateline Gage to Bridgeport Gage Length 57.5 miles% Evap = Evap divided by Total Inflow to the Reach multiplied by 100
Wtr Yr Oct Nov Dec Jan Feb Mar Apr May Jun Jul Aug Sep1975 0.0100 0.0070 0.0048 0.0043 0.0079 0.0122 0.0164 0.0167 0.0174 0.0163 0.0127 0.01331976 0.0126 0.0072 0.0049 0.0042 0.0074 0.0124 0.0250 0.0178 0.0204 0.0153 0.0126 0.01181977 0.0101 0.0071 0.0047 0.0046 0.0081 0.0124 0.0217 0.0218 0.0219 0.0147 0.0133 0.01621978 0.0147 0.0076 0.0051 0.0048 0.0080 0.0120 0.0272 0.0169 0.0188 0.0139 0.0127 0.01541979 0.0168 0.0078 0.0053 0.0027 0.0069 0.0144 0.0232 0.0227 0.0179 0.0188 0.0125 0.01371980 0.0145 0.0052 0.0075 0.0029 0.0047 0.0102 0.0133 0.0089 0.0169 0.0152 0.0118 0.01311981 0.0134 0.0084 0.0091 0.0056 0.0148 0.0188 0.0374 0.0206 0.0202 0.0153 0.0120 0.01311982 0.0130 0.0088 0.0067 0.0049 0.0094 0.0163 0.0298 0.0150 0.0216 0.0221 0.0113 0.01041983 0.0114 0.0047 0.0049 0.0056 0.0085 0.0105 0.0129 0.0093 0.0068 0.0094 0.0105 0.00781984 0.0084 0.0073 0.0047 0.0070 0.0049 0.0043 0.0052 0.0081 0.0080 0.0120 0.0131 0.00931985 0.0068 0.0057 0.0020 0.0023 0.0074 0.0079 0.0218 0.0201 0.0195 0.0180 0.0132 0.01111986 0.0116 0.0052 0.0027 0.0012 0.0078 0.0128 0.0099 0.0124 0.0149 0.0111 0.0141 0.00911987 0.0058 0.0039 0.0043 0.0075 0.0079 0.0051 0.0222 0.0219 0.0201 0.0160 0.0228 0.01091988 0.0149 0.0058 0.0046 0.0030 0.0072 0.0106 0.0262 0.0211 0.0220 0.0166 0.0137 0.01121989 0.0116 0.0117 0.0058 0.0044 0.0094 0.0116 0.0260 0.0238 0.0170 0.0170 0.0148 0.01311990 0.0160 0.0155 0.0038 0.0078 0.0096 0.0155 0.0219 0.0218 0.0207 0.0143 0.0135 0.02571991 0.0132 0.0085 0.0056 0.0051 0.0097 0.0154 0.0278 0.0258 0.0182 0.0146 0.0134 0.01221992 0.0128 0.0080 0.0059 0.0053 0.0090 0.0141 0.0285 0.0222 0.0270 0.0133 0.0115 0.01281993 0.0139 0.0087 0.0054 0.0050 0.0096 0.0121 0.0258 0.0194 0.0263 0.0131 0.0118 0.01411994 0.0114 0.0076 0.0049 0.0045 0.0086 0.0126 0.0258 0.0181 0.0205 0.0164 0.0131 0.01361995 0.0114 0.0078 0.0053 0.0044 0.0076 0.0134 0.0358 0.0248 0.0087 0.0114 0.0136 0.00961996 0.0119 0.0078 0.0052 0.0045 0.0077 0.0129 0.0223 0.0160 0.0134 0.0148 0.0129 0.01261997 0.0116 0.0076 0.0056 0.0046 0.0084 0.0123 0.0103 0.0110 0.0109 0.0153 0.0124 0.01201998 0.0110 0.0074 0.0052 0.0048 0.0085 0.0064 0.0097 0.0160 0.0217 0.0156 0.0135 0.01251999 0.0107 0.0072 0.0048 0.0046 0.0085 0.0139 0.0192 0.0103 0.0117 0.0135 0.0129 0.01162000 0.0111 0.0076 0.0055 0.0050 0.0085 0.0128 0.0213 0.0155 0.0170 0.0154 0.0127 0.01272001 0.0108 0.0074 0.0050 0.0047 0.0084 0.0131 0.0241 0.0198 0.0198 0.0154 0.0128 0.01312002 0.0119 0.0078 0.0051 0.0044 0.0079 0.0136 0.0267 0.0317 0.0138 0.0173 0.0185 0.02172003 0.0148 0.0095 0.0065 0.0059 0.0095 0.0149 0.0284 0.0333 0.0288 0.0163 0.0138 0.02292004 0.0153 0.0096 0.0064 0.0060 0.0107 0.0157 0.0306 0.0309 0.0382 0.0159 0.0152 0.02332005 0.0162 0.0106 0.0069 0.0063 0.0108 0.0171 0.0296 0.0311 0.0309 0.0147 0.0136 0.01822006 0.0158 0.0099 0.0065 0.0058 0.0111 0.0156 0.0286 0.0198 0.0249 0.0140 0.0139 0.0170Avg 0.0124 0.0079 0.0053 0.0048 0.0086 0.0126 0.0230 0.0195 0.0192 0.0151 0.0134 0.0139Max 0.0168 0.0155 0.0091 0.0078 0.0148 0.0188 0.0374 0.0333 0.0382 0.0221 0.0228 0.0257Min 0.0058 0.0039 0.0020 0.0012 0.0047 0.0043 0.0052 0.0081 0.0068 0.0094 0.0105 0.0078Std 0.0026 0.0021 0.0013 0.0014 0.0018 0.0032 0.0075 0.0065 0.0066 0.0023 0.0022 0.0042
% SEEP PER MILEReach 12 WY/NE Stateline Gage to Bridgeport Gage Length 57.5 miles% Seep = Seep divided by Total Inflow to the Reach multiplied by 100
Wtr Yr Oct Nov Dec Jan Feb Mar Apr May Jun Jul Aug Sep197519761977197819791980198119821983198419851986198719881989199019911992199319941995199619971998 0.027819992000200120022003200420052006
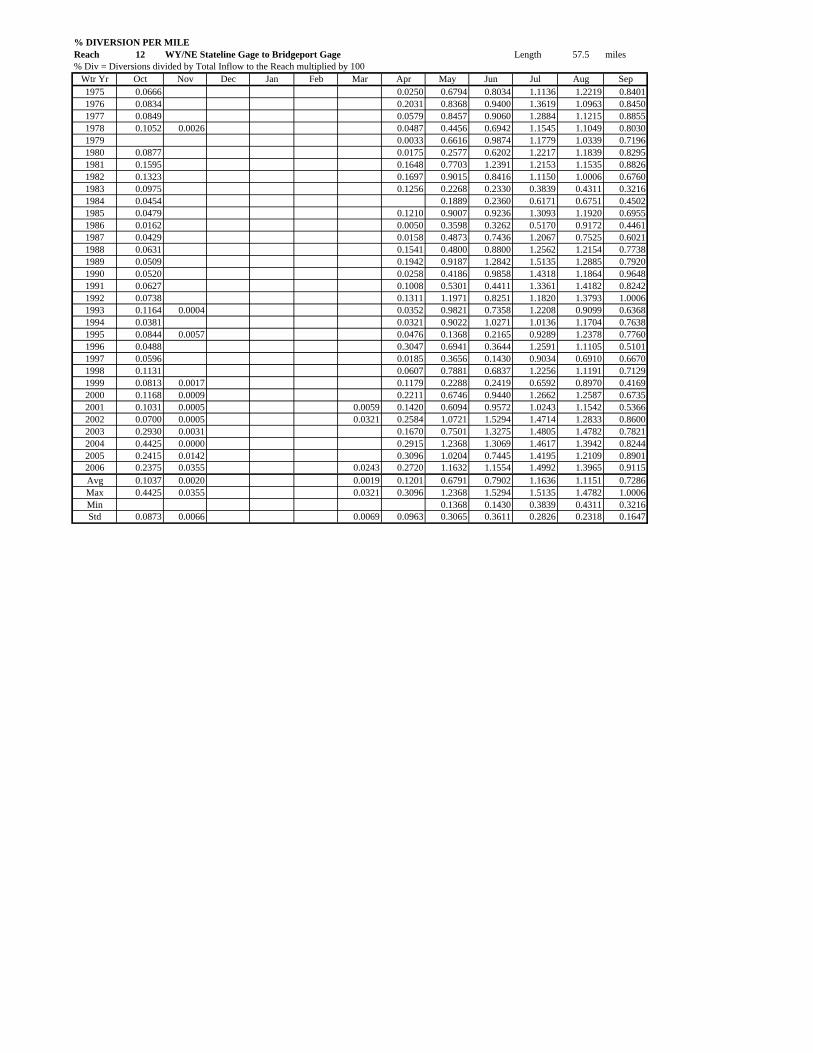
% DIVERSION PER MILEReach 12 WY/NE Stateline Gage to Bridgeport Gage Length 57.5 miles% Div = Diversions divided by Total Inflow to the Reach multiplied by 100
Wtr Yr Oct Nov Dec Jan Feb Mar Apr May Jun Jul Aug Sep1975 0.0666 0.0250 0.6794 0.8034 1.1136 1.2219 0.84011976 0.0834 0.2031 0.8368 0.9400 1.3619 1.0963 0.84501977 0.0849 0.0579 0.8457 0.9060 1.2884 1.1215 0.88551978 0.1052 0.0026 0.0487 0.4456 0.6942 1.1545 1.1049 0.80301979 0.0033 0.6616 0.9874 1.1779 1.0339 0.71961980 0.0877 0.0175 0.2577 0.6202 1.2217 1.1839 0.82951981 0.1595 0.1648 0.7703 1.2391 1.2153 1.1535 0.88261982 0.1323 0.1697 0.9015 0.8416 1.1150 1.0006 0.67601983 0.0975 0.1256 0.2268 0.2330 0.3839 0.4311 0.32161984 0.0454 0.1889 0.2360 0.6171 0.6751 0.45021985 0.0479 0.1210 0.9007 0.9236 1.3093 1.1920 0.69551986 0.0162 0.0050 0.3598 0.3262 0.5170 0.9172 0.44611987 0.0429 0.0158 0.4873 0.7436 1.2067 0.7525 0.60211988 0.0631 0.1541 0.4800 0.8800 1.2562 1.2154 0.77381989 0.0509 0.1942 0.9187 1.2842 1.5135 1.2885 0.79201990 0.0520 0.0258 0.4186 0.9858 1.4318 1.1864 0.96481991 0.0627 0.1008 0.5301 0.4411 1.3361 1.4182 0.82421992 0.0738 0.1311 1.1971 0.8251 1.1820 1.3793 1.00061993 0.1164 0.0004 0.0352 0.9821 0.7358 1.2208 0.9099 0.63681994 0.0381 0.0321 0.9022 1.0271 1.0136 1.1704 0.76381995 0.0844 0.0057 0.0476 0.1368 0.2165 0.9289 1.2378 0.77601996 0.0488 0.3047 0.6941 0.3644 1.2591 1.1105 0.51011997 0.0596 0.0185 0.3656 0.1430 0.9034 0.6910 0.66701998 0.1131 0.0607 0.7881 0.6837 1.2256 1.1191 0.71291999 0.0813 0.0017 0.1179 0.2288 0.2419 0.6592 0.8970 0.41692000 0.1168 0.0009 0.2211 0.6746 0.9440 1.2662 1.2587 0.67352001 0.1031 0.0005 0.0059 0.1420 0.6094 0.9572 1.0243 1.1542 0.53662002 0.0700 0.0005 0.0321 0.2584 1.0721 1.5294 1.4714 1.2833 0.86002003 0.2930 0.0031 0.1670 0.7501 1.3275 1.4805 1.4782 0.78212004 0.4425 0.0000 0.2915 1.2368 1.3069 1.4617 1.3942 0.82442005 0.2415 0.0142 0.3096 1.0204 0.7445 1.4195 1.2109 0.89012006 0.2375 0.0355 0.0243 0.2720 1.1632 1.1554 1.4992 1.3965 0.9115Avg 0.1037 0.0020 0.0019 0.1201 0.6791 0.7902 1.1636 1.1151 0.7286Max 0.4425 0.0355 0.0321 0.3096 1.2368 1.5294 1.5135 1.4782 1.0006Min 0.1368 0.1430 0.3839 0.4311 0.3216Std 0.0873 0.0066 0.0069 0.0963 0.3065 0.3611 0.2826 0.2318 0.1647
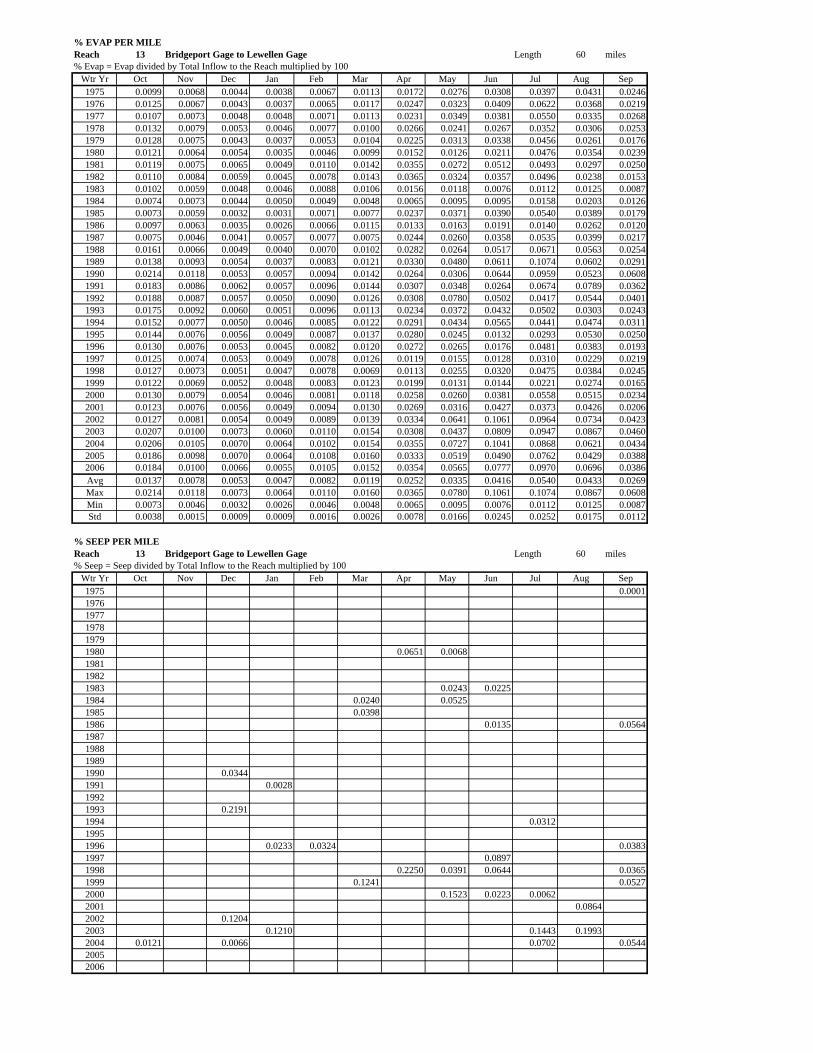
% EVAP PER MILEReach 13 Bridgeport Gage to Lewellen Gage Length 60 miles% Evap = Evap divided by Total Inflow to the Reach multiplied by 100
Wtr Yr Oct Nov Dec Jan Feb Mar Apr May Jun Jul Aug Sep1975 0.0099 0.0068 0.0044 0.0038 0.0067 0.0113 0.0172 0.0276 0.0308 0.0397 0.0431 0.02461976 0.0125 0.0067 0.0043 0.0037 0.0065 0.0117 0.0247 0.0323 0.0409 0.0622 0.0368 0.02191977 0.0107 0.0073 0.0048 0.0048 0.0071 0.0113 0.0231 0.0349 0.0381 0.0550 0.0335 0.02681978 0.0132 0.0079 0.0053 0.0046 0.0077 0.0100 0.0266 0.0241 0.0267 0.0352 0.0306 0.02531979 0.0128 0.0075 0.0043 0.0037 0.0053 0.0104 0.0225 0.0313 0.0338 0.0456 0.0261 0.01761980 0.0121 0.0064 0.0054 0.0035 0.0046 0.0099 0.0152 0.0126 0.0211 0.0476 0.0354 0.02391981 0.0119 0.0075 0.0065 0.0049 0.0110 0.0142 0.0355 0.0272 0.0512 0.0493 0.0297 0.02501982 0.0110 0.0084 0.0059 0.0045 0.0078 0.0143 0.0365 0.0324 0.0357 0.0496 0.0238 0.01531983 0.0102 0.0059 0.0048 0.0046 0.0088 0.0106 0.0156 0.0118 0.0076 0.0112 0.0125 0.00871984 0.0074 0.0073 0.0044 0.0050 0.0049 0.0048 0.0065 0.0095 0.0095 0.0158 0.0203 0.01261985 0.0073 0.0059 0.0032 0.0031 0.0071 0.0077 0.0237 0.0371 0.0390 0.0540 0.0389 0.01791986 0.0097 0.0063 0.0035 0.0026 0.0066 0.0115 0.0133 0.0163 0.0191 0.0140 0.0262 0.01201987 0.0075 0.0046 0.0041 0.0057 0.0077 0.0075 0.0244 0.0260 0.0358 0.0535 0.0399 0.02171988 0.0161 0.0066 0.0049 0.0040 0.0070 0.0102 0.0282 0.0264 0.0517 0.0671 0.0563 0.02541989 0.0138 0.0093 0.0054 0.0037 0.0083 0.0121 0.0330 0.0480 0.0611 0.1074 0.0602 0.02911990 0.0214 0.0118 0.0053 0.0057 0.0094 0.0142 0.0264 0.0306 0.0644 0.0959 0.0523 0.06081991 0.0183 0.0086 0.0062 0.0057 0.0096 0.0144 0.0307 0.0348 0.0264 0.0674 0.0789 0.03621992 0.0188 0.0087 0.0057 0.0050 0.0090 0.0126 0.0308 0.0780 0.0502 0.0417 0.0544 0.04011993 0.0175 0.0092 0.0060 0.0051 0.0096 0.0113 0.0234 0.0372 0.0432 0.0502 0.0303 0.02431994 0.0152 0.0077 0.0050 0.0046 0.0085 0.0122 0.0291 0.0434 0.0565 0.0441 0.0474 0.03111995 0.0144 0.0076 0.0056 0.0049 0.0087 0.0137 0.0280 0.0245 0.0132 0.0293 0.0530 0.02501996 0.0130 0.0076 0.0053 0.0045 0.0082 0.0120 0.0272 0.0265 0.0176 0.0481 0.0383 0.01931997 0.0125 0.0074 0.0053 0.0049 0.0078 0.0126 0.0119 0.0155 0.0128 0.0310 0.0229 0.02191998 0.0127 0.0073 0.0051 0.0047 0.0078 0.0069 0.0113 0.0255 0.0320 0.0475 0.0384 0.02451999 0.0122 0.0069 0.0052 0.0048 0.0083 0.0123 0.0199 0.0131 0.0144 0.0221 0.0274 0.01652000 0.0130 0.0079 0.0054 0.0046 0.0081 0.0118 0.0258 0.0260 0.0381 0.0558 0.0515 0.02342001 0.0123 0.0076 0.0056 0.0049 0.0094 0.0130 0.0269 0.0316 0.0427 0.0373 0.0426 0.02062002 0.0127 0.0081 0.0054 0.0049 0.0089 0.0139 0.0334 0.0641 0.1061 0.0964 0.0734 0.04232003 0.0207 0.0100 0.0073 0.0060 0.0110 0.0154 0.0308 0.0437 0.0809 0.0947 0.0867 0.04602004 0.0206 0.0105 0.0070 0.0064 0.0102 0.0154 0.0355 0.0727 0.1041 0.0868 0.0621 0.04342005 0.0186 0.0098 0.0070 0.0064 0.0108 0.0160 0.0333 0.0519 0.0490 0.0762 0.0429 0.03882006 0.0184 0.0100 0.0066 0.0055 0.0105 0.0152 0.0354 0.0565 0.0777 0.0970 0.0696 0.0386Avg 0.0137 0.0078 0.0053 0.0047 0.0082 0.0119 0.0252 0.0335 0.0416 0.0540 0.0433 0.0269Max 0.0214 0.0118 0.0073 0.0064 0.0110 0.0160 0.0365 0.0780 0.1061 0.1074 0.0867 0.0608Min 0.0073 0.0046 0.0032 0.0026 0.0046 0.0048 0.0065 0.0095 0.0076 0.0112 0.0125 0.0087Std 0.0038 0.0015 0.0009 0.0009 0.0016 0.0026 0.0078 0.0166 0.0245 0.0252 0.0175 0.0112
% SEEP PER MILEReach 13 Bridgeport Gage to Lewellen Gage Length 60 miles% Seep = Seep divided by Total Inflow to the Reach multiplied by 100
Wtr Yr Oct Nov Dec Jan Feb Mar Apr May Jun Jul Aug Sep1975 0.000119761977197819791980 0.0651 0.0068198119821983 0.0243 0.02251984 0.0240 0.05251985 0.03981986 0.0135 0.05641987198819891990 0.03441991 0.002819921993 0.21911994 0.031219951996 0.0233 0.0324 0.03831997 0.08971998 0.2250 0.0391 0.0644 0.03651999 0.1241 0.05272000 0.1523 0.0223 0.00622001 0.08642002 0.12042003 0.1210 0.1443 0.19932004 0.0121 0.0066 0.0702 0.054420052006
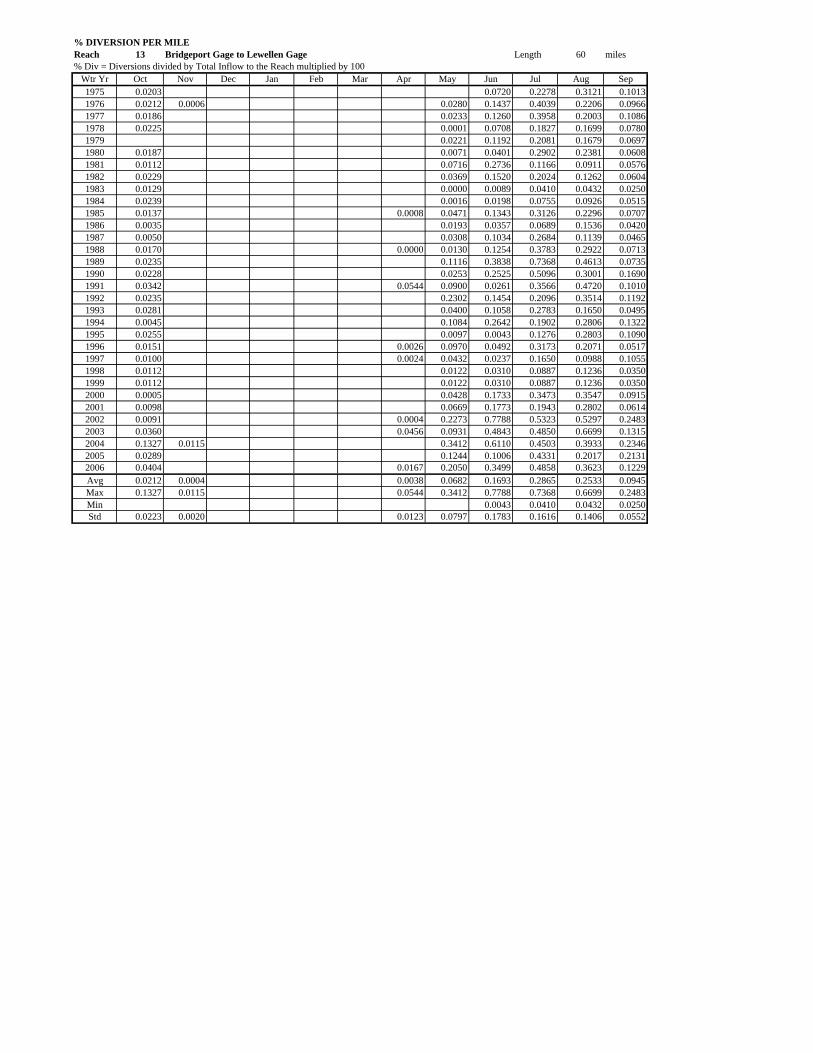
% DIVERSION PER MILEReach 13 Bridgeport Gage to Lewellen Gage Length 60 miles% Div = Diversions divided by Total Inflow to the Reach multiplied by 100
Wtr Yr Oct Nov Dec Jan Feb Mar Apr May Jun Jul Aug Sep1975 0.0203 0.0720 0.2278 0.3121 0.10131976 0.0212 0.0006 0.0280 0.1437 0.4039 0.2206 0.09661977 0.0186 0.0233 0.1260 0.3958 0.2003 0.10861978 0.0225 0.0001 0.0708 0.1827 0.1699 0.07801979 0.0221 0.1192 0.2081 0.1679 0.06971980 0.0187 0.0071 0.0401 0.2902 0.2381 0.06081981 0.0112 0.0716 0.2736 0.1166 0.0911 0.05761982 0.0229 0.0369 0.1520 0.2024 0.1262 0.06041983 0.0129 0.0000 0.0089 0.0410 0.0432 0.02501984 0.0239 0.0016 0.0198 0.0755 0.0926 0.05151985 0.0137 0.0008 0.0471 0.1343 0.3126 0.2296 0.07071986 0.0035 0.0193 0.0357 0.0689 0.1536 0.04201987 0.0050 0.0308 0.1034 0.2684 0.1139 0.04651988 0.0170 0.0000 0.0130 0.1254 0.3783 0.2922 0.07131989 0.0235 0.1116 0.3838 0.7368 0.4613 0.07351990 0.0228 0.0253 0.2525 0.5096 0.3001 0.16901991 0.0342 0.0544 0.0900 0.0261 0.3566 0.4720 0.10101992 0.0235 0.2302 0.1454 0.2096 0.3514 0.11921993 0.0281 0.0400 0.1058 0.2783 0.1650 0.04951994 0.0045 0.1084 0.2642 0.1902 0.2806 0.13221995 0.0255 0.0097 0.0043 0.1276 0.2803 0.10901996 0.0151 0.0026 0.0970 0.0492 0.3173 0.2071 0.05171997 0.0100 0.0024 0.0432 0.0237 0.1650 0.0988 0.10551998 0.0112 0.0122 0.0310 0.0887 0.1236 0.03501999 0.0112 0.0122 0.0310 0.0887 0.1236 0.03502000 0.0005 0.0428 0.1733 0.3473 0.3547 0.09152001 0.0098 0.0669 0.1773 0.1943 0.2802 0.06142002 0.0091 0.0004 0.2273 0.7788 0.5323 0.5297 0.24832003 0.0360 0.0456 0.0931 0.4843 0.4850 0.6699 0.13152004 0.1327 0.0115 0.3412 0.6110 0.4503 0.3933 0.23462005 0.0289 0.1244 0.1006 0.4331 0.2017 0.21312006 0.0404 0.0167 0.2050 0.3499 0.4858 0.3623 0.1229Avg 0.0212 0.0004 0.0038 0.0682 0.1693 0.2865 0.2533 0.0945Max 0.1327 0.0115 0.0544 0.3412 0.7788 0.7368 0.6699 0.2483Min 0.0043 0.0410 0.0432 0.0250Std 0.0223 0.0020 0.0123 0.0797 0.1783 0.1616 0.1406 0.0552

% EVAP PER MILEReach 14 Keystone Gage to N. Platte Gage at North Platte Length 51.5 miles% Evap = Evap divided by Total Inflow to the Reach multiplied by 100
Wtr Yr Oct Nov Dec Jan Feb Mar Apr May Jun Jul Aug Sep1975 0.0355 0.0103 0.0065 0.0055 0.0098 0.0139 0.0254 0.0348 0.0313 0.0185 0.0167 0.02021976 0.0200 0.0097 0.0055 0.0054 0.0083 0.0139 0.0250 0.0348 0.0273 0.0156 0.0156 0.01291977 0.0137 0.0071 0.0063 0.0058 0.0090 0.0118 0.0221 0.0373 0.0330 0.0163 0.0175 0.02501978 0.0260 0.0108 0.0068 0.0058 0.0100 0.0119 0.0309 0.0360 0.0319 0.0171 0.0203 0.03101979 0.0204 0.0099 0.0064 0.0060 0.0102 0.0108 0.0308 0.0391 0.0361 0.0206 0.0181 0.02771980 0.0250 0.0109 0.0061 0.0055 0.0090 0.0151 0.0201 0.0184 0.0291 0.0170 0.0185 0.02831981 0.0182 0.0101 0.0068 0.0060 0.0116 0.0148 0.0373 0.0252 0.0361 0.0172 0.0236 0.02531982 0.0159 0.0109 0.0064 0.0058 0.0100 0.0140 0.0378 0.0271 0.0366 0.0167 0.0143 0.01581983 0.0164 0.0094 0.0064 0.0066 0.0102 0.0138 0.0206 0.0313 0.0052 0.0084 0.0067 0.00531984 0.0123 0.0100 0.0026 0.0024 0.0032 0.0035 0.0045 0.0069 0.0086 0.0144 0.0151 0.01411985 0.0172 0.0048 0.0027 0.0031 0.0072 0.0064 0.0342 0.0309 0.0324 0.0166 0.0207 0.02111986 0.0176 0.0103 0.0063 0.0053 0.0088 0.0133 0.0177 0.0216 0.0258 0.0131 0.0093 0.00721987 0.0085 0.0059 0.0064 0.0063 0.0097 0.0118 0.0399 0.0333 0.0376 0.0276 0.0174 0.03511988 0.0208 0.0090 0.0060 0.0054 0.0084 0.0124 0.0374 0.0351 0.0296 0.0205 0.0236 0.03011989 0.0298 0.0109 0.0066 0.0053 0.0104 0.0142 0.0497 0.0362 0.0330 0.0224 0.0172 0.03511990 0.0348 0.0111 0.0070 0.0054 0.0102 0.0139 0.0357 0.0269 0.0395 0.0177 0.0226 0.03531991 0.0375 0.0120 0.0077 0.0060 0.0111 0.0164 0.0369 0.0340 0.0363 0.0164 0.0223 0.04201992 0.0234 0.0097 0.0063 0.0053 0.0089 0.0108 0.0342 0.0509 0.0349 0.0218 0.0253 0.03891993 0.0304 0.0118 0.0070 0.0056 0.0105 0.0119 0.0241 0.0362 0.0434 0.0310 0.0264 0.03271994 0.0283 0.0103 0.0065 0.0057 0.0108 0.0145 0.0308 0.0450 0.0433 0.0205 0.0196 0.03721995 0.0279 0.0118 0.0074 0.0064 0.0121 0.0166 0.0335 0.0366 0.0336 0.0169 0.0160 0.02111996 0.0266 0.0125 0.0082 0.0074 0.0120 0.0177 0.0413 0.0331 0.0421 0.0191 0.0241 0.02671997 0.0241 0.0119 0.0078 0.0058 0.0091 0.0153 0.0336 0.0346 0.0265 0.0184 0.0208 0.02041998 0.0129 0.0100 0.0071 0.0063 0.0103 0.0100 0.0157 0.0332 0.0347 0.0166 0.0206 0.03061999 0.0261 0.0109 0.0062 0.0059 0.0099 0.0151 0.0323 0.0391 0.0410 0.0177 0.0208 0.02092000 0.0251 0.0122 0.0081 0.0066 0.0120 0.0164 0.0323 0.0290 0.0172 0.0168 0.0164 0.03452001 0.0263 0.0108 0.0067 0.0062 0.0101 0.0162 0.0307 0.0423 0.0315 0.0155 0.0165 0.03432002 0.0343 0.0144 0.0084 0.0063 0.0120 0.0160 0.0415 0.0372 0.0325 0.0134 0.0223 0.03882003 0.0277 0.0123 0.0078 0.0064 0.0106 0.0149 0.0352 0.0389 0.0482 0.0232 0.0247 0.04162004 0.0277 0.0120 0.0076 0.0062 0.0106 0.0157 0.0337 0.0459 0.0481 0.0330 0.0343 0.03652005 0.0264 0.0110 0.0072 0.0060 0.0112 0.0164 0.0361 0.0393 0.0427 0.0317 0.0328 0.04042006 0.0263 0.0124 0.0074 0.0059 0.0109 0.0157 0.0374 0.0398 0.0399 0.0261 0.0304 0.0383Avg 0.0239 0.0105 0.0066 0.0057 0.0099 0.0136 0.0312 0.0341 0.0334 0.0193 0.0203 0.0283Max 0.0375 0.0144 0.0084 0.0074 0.0121 0.0177 0.0497 0.0509 0.0482 0.0330 0.0343 0.0420Min 0.0085 0.0048 0.0026 0.0024 0.0032 0.0035 0.0045 0.0069 0.0052 0.0084 0.0067 0.0053Std 0.0071 0.0019 0.0012 0.0009 0.0017 0.0029 0.0088 0.0082 0.0094 0.0054 0.0058 0.0099
% SEEP PER MILEReach 14 Keystone Gage to N. Platte Gage at North Platte Length 51.5 miles% Seep = Seep divided by Total Inflow to the Reach multiplied by 100
Wtr Yr Oct Nov Dec Jan Feb Mar Apr May Jun Jul Aug Sep19751976197719781979198019811982198319841985198619871988198919901991 0.046319921993199419951996199719981999 0.11602000 0.19712001 0.21212002 0.3150 0.13392003 0.2168200420052006
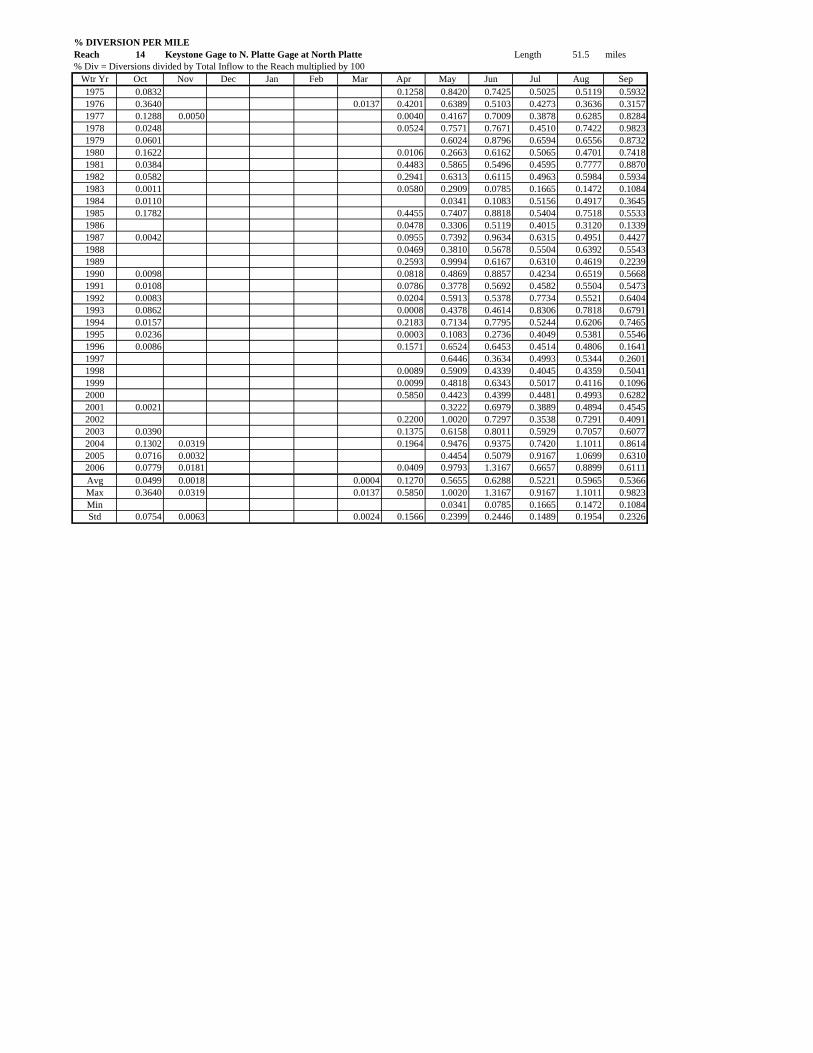
% DIVERSION PER MILEReach 14 Keystone Gage to N. Platte Gage at North Platte Length 51.5 miles% Div = Diversions divided by Total Inflow to the Reach multiplied by 100
Wtr Yr Oct Nov Dec Jan Feb Mar Apr May Jun Jul Aug Sep1975 0.0832 0.1258 0.8420 0.7425 0.5025 0.5119 0.59321976 0.3640 0.0137 0.4201 0.6389 0.5103 0.4273 0.3636 0.31571977 0.1288 0.0050 0.0040 0.4167 0.7009 0.3878 0.6285 0.82841978 0.0248 0.0524 0.7571 0.7671 0.4510 0.7422 0.98231979 0.0601 0.6024 0.8796 0.6594 0.6556 0.87321980 0.1622 0.0106 0.2663 0.6162 0.5065 0.4701 0.74181981 0.0384 0.4483 0.5865 0.5496 0.4595 0.7777 0.88701982 0.0582 0.2941 0.6313 0.6115 0.4963 0.5984 0.59341983 0.0011 0.0580 0.2909 0.0785 0.1665 0.1472 0.10841984 0.0110 0.0341 0.1083 0.5156 0.4917 0.36451985 0.1782 0.4455 0.7407 0.8818 0.5404 0.7518 0.55331986 0.0478 0.3306 0.5119 0.4015 0.3120 0.13391987 0.0042 0.0955 0.7392 0.9634 0.6315 0.4951 0.44271988 0.0469 0.3810 0.5678 0.5504 0.6392 0.55431989 0.2593 0.9994 0.6167 0.6310 0.4619 0.22391990 0.0098 0.0818 0.4869 0.8857 0.4234 0.6519 0.56681991 0.0108 0.0786 0.3778 0.5692 0.4582 0.5504 0.54731992 0.0083 0.0204 0.5913 0.5378 0.7734 0.5521 0.64041993 0.0862 0.0008 0.4378 0.4614 0.8306 0.7818 0.67911994 0.0157 0.2183 0.7134 0.7795 0.5244 0.6206 0.74651995 0.0236 0.0003 0.1083 0.2736 0.4049 0.5381 0.55461996 0.0086 0.1571 0.6524 0.6453 0.4514 0.4806 0.16411997 0.6446 0.3634 0.4993 0.5344 0.26011998 0.0089 0.5909 0.4339 0.4045 0.4359 0.50411999 0.0099 0.4818 0.6343 0.5017 0.4116 0.10962000 0.5850 0.4423 0.4399 0.4481 0.4993 0.62822001 0.0021 0.3222 0.6979 0.3889 0.4894 0.45452002 0.2200 1.0020 0.7297 0.3538 0.7291 0.40912003 0.0390 0.1375 0.6158 0.8011 0.5929 0.7057 0.60772004 0.1302 0.0319 0.1964 0.9476 0.9375 0.7420 1.1011 0.86142005 0.0716 0.0032 0.4454 0.5079 0.9167 1.0699 0.63102006 0.0779 0.0181 0.0409 0.9793 1.3167 0.6657 0.8899 0.6111Avg 0.0499 0.0018 0.0004 0.1270 0.5655 0.6288 0.5221 0.5965 0.5366Max 0.3640 0.0319 0.0137 0.5850 1.0020 1.3167 0.9167 1.1011 0.9823Min 0.0341 0.0785 0.1665 0.1472 0.1084Std 0.0754 0.0063 0.0024 0.1566 0.2399 0.2446 0.1489 0.1954 0.2326

% EVAP PER MILEReach 15 N. Platte Gage at North Platte to Brady Gage Length 23.8 miles% Evap = Evap divided by Total Inflow to the Reach multiplied by 100
Wtr Yr Oct Nov Dec Jan Feb Mar Apr May Jun Jul Aug Sep1975 0.0163 0.0055 0.0032 0.0026 0.0044 0.0064 0.0122 0.0170 0.0167 0.0194 0.0173 0.01481976 0.0092 0.0050 0.0032 0.0023 0.0041 0.0064 0.0136 0.0193 0.0253 0.0192 0.0203 0.01811977 0.0131 0.0061 0.0034 0.0026 0.0049 0.0072 0.0158 0.0211 0.0186 0.0183 0.0141 0.01551978 0.0173 0.0053 0.0036 0.0035 0.0062 0.0074 0.0171 0.0164 0.0224 0.0185 0.0155 0.01841979 0.0148 0.0051 0.0032 0.0029 0.0048 0.0074 0.0178 0.0163 0.0111 0.0148 0.0144 0.01701980 0.0148 0.0064 0.0023 0.0020 0.0033 0.0048 0.0084 0.0050 0.0090 0.0185 0.0172 0.01621981 0.0098 0.0054 0.0030 0.0022 0.0040 0.0071 0.0204 0.0156 0.0210 0.0166 0.0128 0.01811982 0.0131 0.0060 0.0029 0.0024 0.0042 0.0068 0.0222 0.0207 0.0210 0.0187 0.0140 0.01401983 0.0120 0.0049 0.0028 0.0018 0.0034 0.0048 0.0062 0.0056 0.0031 0.0072 0.0092 0.00761984 0.0082 0.0057 0.0023 0.0017 0.0021 0.0033 0.0051 0.0052 0.0075 0.0140 0.0146 0.00851985 0.0050 0.0024 0.0019 0.0019 0.0029 0.0046 0.0166 0.0148 0.0185 0.0177 0.0159 0.01351986 0.0069 0.0044 0.0027 0.0019 0.0034 0.0051 0.0089 0.0138 0.0128 0.0145 0.0108 0.00771987 0.0112 0.0037 0.0023 0.0019 0.0036 0.0052 0.0131 0.0099 0.0153 0.0221 0.0178 0.01461988 0.0075 0.0039 0.0025 0.0026 0.0032 0.0050 0.0125 0.0179 0.0251 0.0199 0.0192 0.01681989 0.0149 0.0057 0.0032 0.0022 0.0042 0.0062 0.0219 0.0195 0.0206 0.0230 0.0160 0.02061990 0.0158 0.0069 0.0043 0.0026 0.0045 0.0057 0.0127 0.0157 0.0236 0.0193 0.0185 0.02561991 0.0215 0.0085 0.0052 0.0037 0.0047 0.0084 0.0179 0.0211 0.0217 0.0190 0.0203 0.02481992 0.0146 0.0065 0.0040 0.0030 0.0040 0.0052 0.0159 0.0263 0.0192 0.0162 0.0172 0.02321993 0.0172 0.0064 0.0033 0.0027 0.0044 0.0049 0.0142 0.0212 0.0273 0.0222 0.0175 0.01541994 0.0093 0.0044 0.0025 0.0023 0.0039 0.0061 0.0186 0.0194 0.0237 0.0193 0.0181 0.02691995 0.0132 0.0066 0.0037 0.0031 0.0055 0.0083 0.0192 0.0190 0.0054 0.0089 0.0148 0.01291996 0.0079 0.0033 0.0025 0.0023 0.0037 0.0051 0.0102 0.0169 0.0163 0.0179 0.0157 0.01141997 0.0087 0.0033 0.0026 0.0023 0.0035 0.0046 0.0107 0.0129 0.0071 0.0145 0.0117 0.01261998 0.0081 0.0033 0.0021 0.0017 0.0031 0.0048 0.0089 0.0130 0.0157 0.0163 0.0147 0.01181999 0.0071 0.0034 0.0027 0.0021 0.0030 0.0043 0.0107 0.0084 0.0095 0.0165 0.0124 0.01062000 0.0075 0.0034 0.0021 0.0017 0.0031 0.0048 0.0107 0.0152 0.0179 0.0177 0.0160 0.01652001 0.0131 0.0057 0.0040 0.0026 0.0043 0.0075 0.0164 0.0179 0.0213 0.0173 0.0167 0.01772002 0.0172 0.0070 0.0034 0.0031 0.0056 0.0084 0.0186 0.0230 0.0197 0.0165 0.0186 0.02312003 0.0167 0.0077 0.0051 0.0043 0.0079 0.0117 0.0217 0.0258 0.0304 0.0187 0.0159 0.02712004 0.0287 0.0135 0.0083 0.0061 0.0097 0.0144 0.0342 0.0177 0.0226 0.0208 0.0144 0.02902005 0.0307 0.0117 0.0070 0.0058 0.0104 0.0148 0.0304 0.0361 0.0214 0.0165 0.0147 0.03652006 0.0240 0.0110 0.0064 0.0052 0.0101 0.0126 0.0300 0.0241 0.0128 0.0187 0.0204 0.0383Avg 0.0136 0.0059 0.0035 0.0028 0.0047 0.0069 0.0160 0.0172 0.0176 0.0175 0.0158 0.0183Max 0.0307 0.0135 0.0083 0.0061 0.0104 0.0148 0.0342 0.0361 0.0304 0.0230 0.0204 0.0383Min 0.0050 0.0024 0.0019 0.0017 0.0021 0.0033 0.0051 0.0050 0.0031 0.0072 0.0092 0.0076Std 0.0061 0.0024 0.0015 0.0011 0.0020 0.0028 0.0067 0.0064 0.0066 0.0032 0.0027 0.0074
% SEEP PER MILEReach 15 N. Platte Gage at North Platte to Brady Gage Length 23.8 miles% Seep = Seep divided by Total Inflow to the Reach multiplied by 100
Wtr Yr Oct Nov Dec Jan Feb Mar Apr May Jun Jul Aug Sep19751976 0.039019771978 0.1109197919801981198219831984 0.60911985198619871988198919901991 0.3839 0.11201992199319941995199619971998199920002001 0.0704 0.0715200220032004 0.194420052006

% DIVERSION PER MILEReach 15 N. Platte Gage at North Platte to Brady Gage Length 23.8 miles% Div = Diversions divided by Total Inflow to the Reach multiplied by 100
Wtr Yr Oct Nov Dec Jan Feb Mar Apr May Jun Jul Aug Sep1975 3.7552 3.7164 3.7362 3.7711 3.7927 3.7746 3.7227 3.7913 3.2405 2.5880 2.8234 3.77451976 3.8815 3.8631 3.7905 3.8164 3.7251 3.7338 3.7169 3.7253 3.4740 2.4970 2.7358 3.51331977 3.7284 3.8025 3.7636 3.8544 3.7411 3.5746 3.3223 3.4268 3.5887 2.2888 3.1089 3.76331978 3.6775 3.7316 3.6977 3.5521 3.6579 3.5652 3.5849 3.6733 3.5330 2.3182 3.2506 3.77791979 3.7879 3.7907 3.8086 3.8082 3.7694 3.4565 3.5866 3.7356 1.8794 3.0223 3.0515 3.85181980 3.7011 3.5964 3.8266 3.6580 3.0307 3.2393 1.7560 0.7617 1.4098 2.2364 2.5809 3.73651981 3.6619 3.8224 3.8471 3.8741 3.8106 3.7283 3.6699 3.5807 3.7125 2.7429 3.7374 3.78691982 3.6821 3.5891 3.7840 3.8631 3.7745 3.7131 3.6669 3.4685 3.4666 2.6729 2.8911 3.44581983 3.2486 3.5732 3.3934 2.7807 3.2839 3.4287 2.1497 0.9573 0.3050 0.2784 0.8802 0.88771984 2.7842 3.2742 0.9371 1.4787 1.3485 1.3200 0.9001 0.6241 0.8340 2.2051 2.5497 1.77021985 1.9748 1.3816 1.2790 1.3584 1.5159 1.8964 3.4537 3.2996 3.4416 2.7788 3.2535 3.43001986 3.7018 3.5717 3.2123 3.0922 2.8297 3.3964 1.8112 2.6115 1.5878 1.9609 1.8432 1.87721987 2.3116 2.8694 3.0034 2.8388 3.3781 2.9452 3.0614 2.1120 2.2960 3.0516 2.9208 3.71461988 3.8751 3.7979 3.6630 2.7160 2.4338 3.6893 3.7044 3.0699 3.1059 2.7330 3.0375 3.81971989 3.7775 3.7312 3.7697 3.8316 3.4615 3.5763 3.7007 3.7827 3.6168 2.9294 2.8615 3.60741990 3.6727 3.5741 3.6351 3.8061 3.7222 3.7524 3.4880 3.3319 3.7184 2.3925 3.1227 3.52061991 3.2871 3.4879 3.3975 3.5954 3.7435 3.6345 3.6021 3.3957 3.6023 2.4844 2.8452 3.78801992 3.7214 3.6683 3.6531 3.6966 3.8057 3.6268 3.7606 3.7977 3.7541 3.3723 2.9832 3.73081993 3.5825 3.6438 3.7438 3.3272 3.3710 3.1816 3.5195 3.5605 3.5201 3.3989 3.7179 3.79181994 3.8999 3.7962 3.7711 3.5708 3.6062 3.7471 3.5573 3.7618 3.5974 2.9903 2.9954 3.70521995 3.7952 3.7291 3.7689 3.7303 3.7277 3.7200 3.5799 3.0455 0.6807 1.0622 2.4872 3.02971996 3.4842 3.8352 3.8695 3.6318 3.3881 3.5899 3.8938 3.6418 3.5179 2.5828 3.0696 2.47101997 3.0580 3.8447 3.4934 3.3879 3.7157 3.5385 3.5434 3.7560 0.9305 1.9785 1.9310 2.76691998 2.6386 2.6512 2.8240 2.5334 2.9265 2.5907 1.8586 3.0422 2.7414 2.2487 2.6220 3.82371999 3.8857 3.7965 3.5453 2.8519 3.9142 3.9234 3.8456 1.5998 1.4580 2.3691 2.0532 2.11252000 2.8208 3.2448 3.2291 3.1060 3.1731 3.4337 3.5035 3.4177 2.9518 2.5362 2.7305 3.93442001 3.8591 3.7691 3.6381 3.8087 3.8511 3.7041 3.5401 3.6834 3.6962 2.4889 2.8921 3.87052002 3.6802 3.6898 3.7746 3.7682 3.7247 3.6707 3.7107 3.7477 3.8376 2.3218 3.4093 3.93592003 3.8457 3.7568 3.7408 3.7382 3.6703 3.5911 3.6067 3.5228 3.6991 3.5928 3.6697 4.03212004 3.6372 3.4833 3.4223 3.3295 3.4329 3.4327 3.3831 3.8663 3.7998 3.6652 3.8899 3.77862005 3.3814 3.4312 3.3594 3.3312 3.3398 3.3098 3.3285 3.3528 3.3327 3.8425 3.9794 3.65492006 3.6270 3.5609 3.4845 3.4596 3.4413 3.4547 3.4399 3.7538 4.0574 3.5893 3.7756 3.6924Avg 3.4821 3.5336 3.4332 3.3427 3.3784 3.4044 3.2803 3.1531 2.8871 2.6006 2.9281 3.3874Max 3.8999 3.8631 3.8695 3.8741 3.9142 3.9234 3.8938 3.8663 4.0574 3.8425 3.9794 4.0321Min 1.9748 1.3816 0.9371 1.3584 1.3485 1.3200 0.9001 0.6241 0.3050 0.2784 0.8802 0.8877Std 0.4775 0.4699 0.6508 0.6243 0.6023 0.5349 0.7196 0.9061 1.0903 0.7060 0.6356 0.7447

% EVAP PER MILEReach 16 Brady Gage to Cozad Gage Length 25.5 miles% Evap = Evap divided by Total Inflow to the Reach multiplied by 100
Wtr Yr Oct Nov Dec Jan Feb Mar Apr May Jun Jul Aug Sep1975 0.0808 0.0246 0.0149 0.0123 0.0227 0.0319 0.0535 0.0686 0.0448 0.0380 0.0311 0.04071976 0.0566 0.0265 0.0157 0.0121 0.0190 0.0307 0.0560 0.0645 0.0583 0.0345 0.0366 0.04801977 0.0451 0.0240 0.0159 0.0129 0.0222 0.0288 0.0447 0.0518 0.0561 0.0319 0.0268 0.06031978 0.0709 0.0241 0.0159 0.0151 0.0242 0.0206 0.0578 0.0650 0.0595 0.0320 0.0306 0.05421979 0.0672 0.0247 0.0167 0.0160 0.0239 0.0231 0.0648 0.0628 0.0297 0.0282 0.0259 0.03731980 0.0677 0.0253 0.0135 0.0098 0.0106 0.0172 0.0222 0.0149 0.0235 0.0298 0.0322 0.05491981 0.0471 0.0294 0.0170 0.0140 0.0254 0.0352 0.0710 0.0366 0.0524 0.0316 0.0236 0.04981982 0.0513 0.0228 0.0135 0.0136 0.0239 0.0308 0.0903 0.0590 0.0479 0.0328 0.0225 0.03901983 0.0331 0.0201 0.0115 0.0060 0.0131 0.0204 0.0191 0.0163 0.0112 0.0179 0.0205 0.01771984 0.0182 0.0187 0.0049 0.0038 0.0053 0.0080 0.0122 0.0138 0.0184 0.0281 0.0278 0.02071985 0.0120 0.0054 0.0038 0.0040 0.0066 0.0111 0.0579 0.0523 0.0555 0.0301 0.0267 0.03521986 0.0341 0.0191 0.0108 0.0072 0.0095 0.0201 0.0235 0.0347 0.0309 0.0263 0.0202 0.01811987 0.0251 0.0107 0.0083 0.0066 0.0142 0.0158 0.0401 0.0291 0.0387 0.0389 0.0334 0.06571988 0.0490 0.0185 0.0131 0.0082 0.0096 0.0235 0.0636 0.0541 0.0580 0.0366 0.0345 0.04951989 0.0234 0.0224 0.0149 0.0120 0.0194 0.0249 0.0800 0.0618 0.0446 0.0357 0.0264 0.06031990 0.0584 0.0237 0.0162 0.0113 0.0221 0.0270 0.0571 0.0445 0.0508 0.0327 0.0351 0.06741991 0.0770 0.0230 0.0162 0.0148 0.0227 0.0345 0.0663 0.0461 0.0596 0.0337 0.0356 0.06741992 0.0562 0.0227 0.0151 0.0109 0.0209 0.0230 0.0641 0.0779 0.0443 0.0286 0.0316 0.04771993 0.0653 0.0249 0.0152 0.0112 0.0212 0.0184 0.0461 0.0592 0.0560 0.0370 0.0289 0.05961994 0.0589 0.0223 0.0145 0.0127 0.0199 0.0267 0.0586 0.0701 0.0556 0.0349 0.0306 0.08161995 0.0507 0.0229 0.0142 0.0114 0.0217 0.0288 0.0618 0.0505 0.0174 0.0220 0.0264 0.03431996 0.0371 0.0207 0.0153 0.0124 0.0130 0.0220 0.0692 0.0626 0.0565 0.0319 0.0334 0.03181997 0.0270 0.0202 0.0116 0.0090 0.0203 0.0234 0.0535 0.0655 0.0166 0.0269 0.0265 0.03881998 0.0241 0.0098 0.0066 0.0050 0.0102 0.0146 0.0222 0.0447 0.0435 0.0295 0.0291 0.06871999 0.0530 0.0192 0.0142 0.0065 0.0208 0.0317 0.0710 0.0233 0.0259 0.0315 0.0279 0.02752000 0.0257 0.0140 0.0089 0.0064 0.0125 0.0223 0.0523 0.0544 0.0404 0.0311 0.0315 0.09162001 0.0569 0.0209 0.0148 0.0134 0.0240 0.0263 0.0482 0.0510 0.0477 0.0311 0.0287 0.06342002 0.0564 0.0253 0.0155 0.0126 0.0225 0.0344 0.0717 0.0606 0.0349 0.0302 0.0335 0.10132003 0.0731 0.0287 0.0174 0.0144 0.0253 0.0359 0.0660 0.0572 0.0389 0.0311 0.0264 0.06152004 0.0750 0.0327 0.0188 0.0151 0.0260 0.0373 0.0802 0.0415 0.0493 0.0331 0.0202 0.05612005 0.0658 0.0299 0.0189 0.0157 0.0257 0.0350 0.0684 0.0565 0.0588 0.0246 0.0161 0.07762006 0.0786 0.0316 0.0184 0.0150 0.0290 0.0377 0.0676 0.0406 0.0202 0.0296 0.0218 0.0644Avg 0.0506 0.0222 0.0138 0.0110 0.0190 0.0257 0.0557 0.0497 0.0421 0.0310 0.0282 0.0529Max 0.0808 0.0327 0.0189 0.0160 0.0290 0.0377 0.0903 0.0779 0.0596 0.0389 0.0366 0.1013Min 0.0120 0.0054 0.0038 0.0038 0.0053 0.0080 0.0122 0.0138 0.0112 0.0179 0.0161 0.0177Std 0.0192 0.0059 0.0037 0.0036 0.0063 0.0076 0.0187 0.0164 0.0147 0.0044 0.0050 0.0199
% SEEP PER MILEReach 16 Brady Gage to Cozad Gage Length 25.5 miles% Seep = Seep divided by Total Inflow to the Reach multiplied by 100
Wtr Yr Oct Nov Dec Jan Feb Mar Apr May Jun Jul Aug Sep19751976 0.06861977 0.35651978 0.430319791980 0.1300 0.6240 0.222119811982 0.03141983 0.0340 0.3006 0.2304 0.13651984 0.0074 0.2906 0.3975 0.39791985 0.1463 0.3037 0.47281986 0.2566 0.0251 0.2980 0.4294 0.6461 0.283119871988 0.003519891990 0.2835199119921993 0.106019941995 0.1540 0.039319961997 1.4097 0.5093 0.44071998 0.2447 0.4888 0.26531999 0.5421 0.3941 0.5126200020012002 0.16482003200420052006
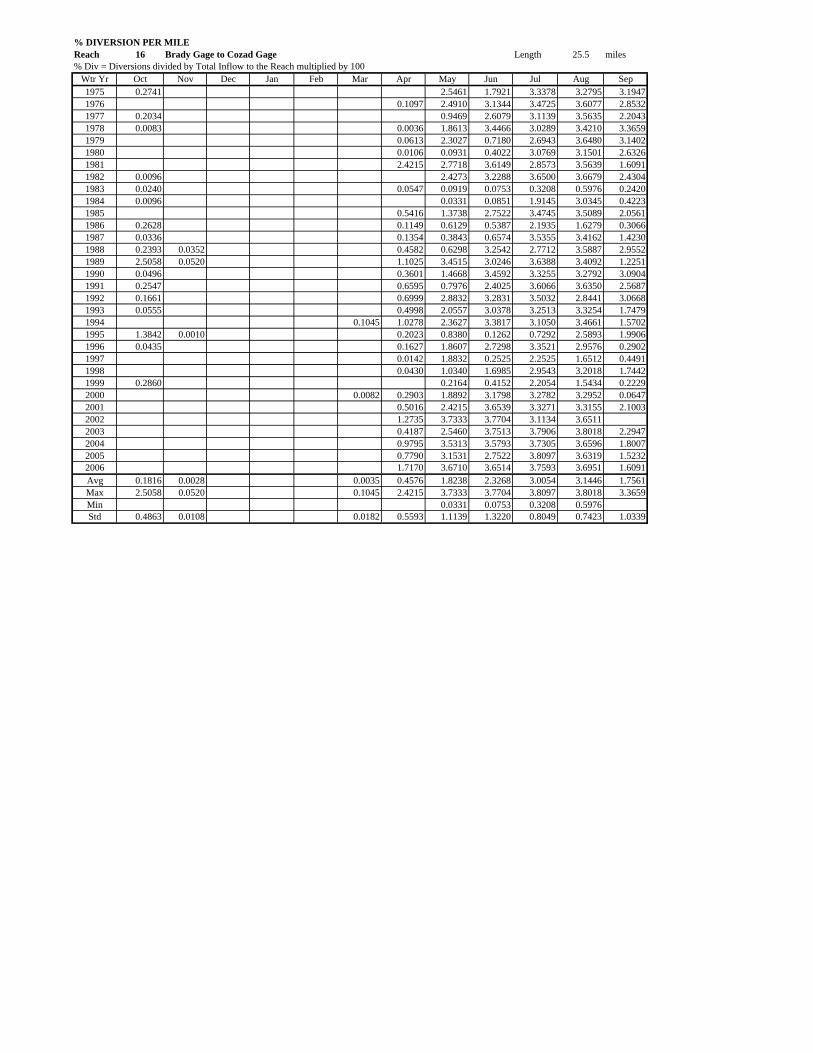
% DIVERSION PER MILEReach 16 Brady Gage to Cozad Gage Length 25.5 miles% Div = Diversions divided by Total Inflow to the Reach multiplied by 100
Wtr Yr Oct Nov Dec Jan Feb Mar Apr May Jun Jul Aug Sep1975 0.2741 2.5461 1.7921 3.3378 3.2795 3.19471976 0.1097 2.4910 3.1344 3.4725 3.6077 2.85321977 0.2034 0.9469 2.6079 3.1139 3.5635 2.20431978 0.0083 0.0036 1.8613 3.4466 3.0289 3.4210 3.36591979 0.0613 2.3027 0.7180 2.6943 3.6480 3.14021980 0.0106 0.0931 0.4022 3.0769 3.1501 2.63261981 2.4215 2.7718 3.6149 2.8573 3.5639 1.60911982 0.0096 2.4273 3.2288 3.6500 3.6679 2.43041983 0.0240 0.0547 0.0919 0.0753 0.3208 0.5976 0.24201984 0.0096 0.0331 0.0851 1.9145 3.0345 0.42231985 0.5416 1.3738 2.7522 3.4745 3.5089 2.05611986 0.2628 0.1149 0.6129 0.5387 2.1935 1.6279 0.30661987 0.0336 0.1354 0.3843 0.6574 3.5355 3.4162 1.42301988 0.2393 0.0352 0.4582 0.6298 3.2542 2.7712 3.5887 2.95521989 2.5058 0.0520 1.1025 3.4515 3.0246 3.6388 3.4092 1.22511990 0.0496 0.3601 1.4668 3.4592 3.3255 3.2792 3.09041991 0.2547 0.6595 0.7976 2.4025 3.6066 3.6350 2.56871992 0.1661 0.6999 2.8832 3.2831 3.5032 2.8441 3.06681993 0.0555 0.4998 2.0557 3.0378 3.2513 3.3254 1.74791994 0.1045 1.0278 2.3627 3.3817 3.1050 3.4661 1.57021995 1.3842 0.0010 0.2023 0.8380 0.1262 0.7292 2.5893 1.99061996 0.0435 0.1627 1.8607 2.7298 3.3521 2.9576 0.29021997 0.0142 1.8832 0.2525 2.2525 1.6512 0.44911998 0.0430 1.0340 1.6985 2.9543 3.2018 1.74421999 0.2860 0.2164 0.4152 2.2054 1.5434 0.22292000 0.0082 0.2903 1.8892 3.1798 3.2782 3.2952 0.06472001 0.5016 2.4215 3.6539 3.3271 3.3155 2.10032002 1.2735 3.7333 3.7704 3.1134 3.65112003 0.4187 2.5460 3.7513 3.7906 3.8018 2.29472004 0.9795 3.5313 3.5793 3.7305 3.6596 1.80072005 0.7790 3.1531 2.7522 3.8097 3.6319 1.52322006 1.7170 3.6710 3.6514 3.7593 3.6951 1.6091Avg 0.1816 0.0028 0.0035 0.4576 1.8238 2.3268 3.0054 3.1446 1.7561Max 2.5058 0.0520 0.1045 2.4215 3.7333 3.7704 3.8097 3.8018 3.3659Min 0.0331 0.0753 0.3208 0.5976Std 0.4863 0.0108 0.0182 0.5593 1.1139 1.3220 0.8049 0.7423 1.0339
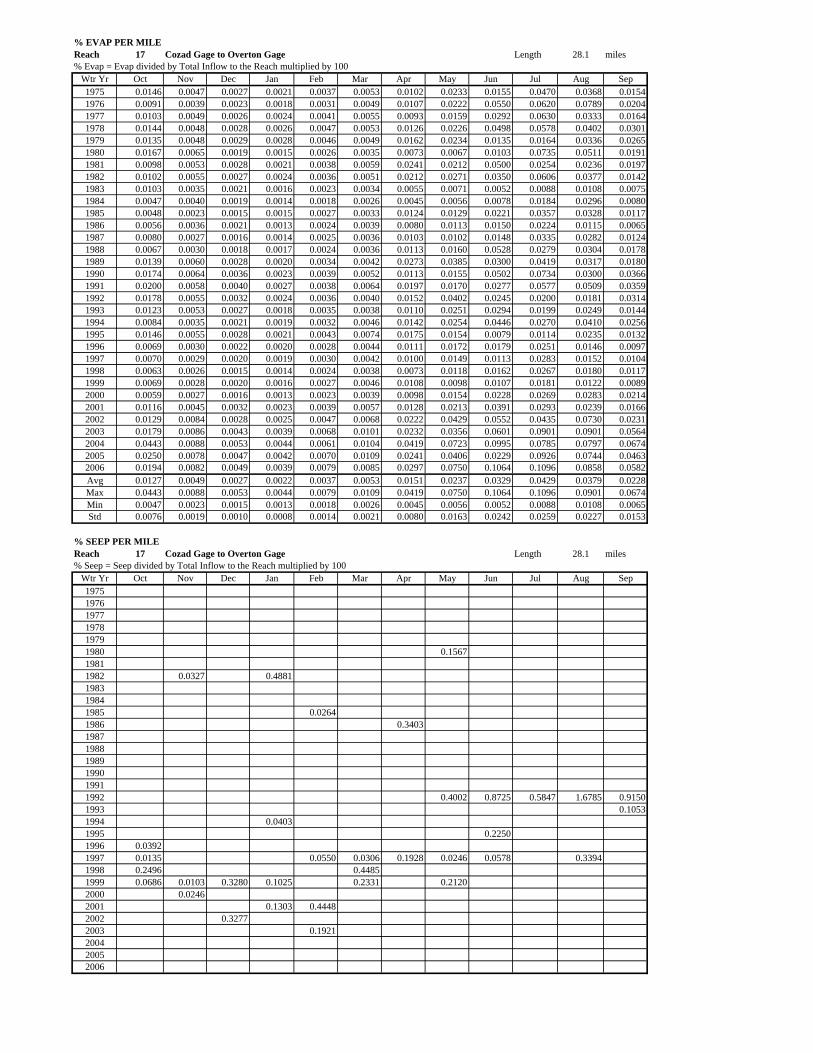
% EVAP PER MILEReach 17 Cozad Gage to Overton Gage Length 28.1 miles% Evap = Evap divided by Total Inflow to the Reach multiplied by 100
Wtr Yr Oct Nov Dec Jan Feb Mar Apr May Jun Jul Aug Sep1975 0.0146 0.0047 0.0027 0.0021 0.0037 0.0053 0.0102 0.0233 0.0155 0.0470 0.0368 0.01541976 0.0091 0.0039 0.0023 0.0018 0.0031 0.0049 0.0107 0.0222 0.0550 0.0620 0.0789 0.02041977 0.0103 0.0049 0.0026 0.0024 0.0041 0.0055 0.0093 0.0159 0.0292 0.0630 0.0333 0.01641978 0.0144 0.0048 0.0028 0.0026 0.0047 0.0053 0.0126 0.0226 0.0498 0.0578 0.0402 0.03011979 0.0135 0.0048 0.0029 0.0028 0.0046 0.0049 0.0162 0.0234 0.0135 0.0164 0.0336 0.02651980 0.0167 0.0065 0.0019 0.0015 0.0026 0.0035 0.0073 0.0067 0.0103 0.0735 0.0511 0.01911981 0.0098 0.0053 0.0028 0.0021 0.0038 0.0059 0.0241 0.0212 0.0500 0.0254 0.0236 0.01971982 0.0102 0.0055 0.0027 0.0024 0.0036 0.0051 0.0212 0.0271 0.0350 0.0606 0.0377 0.01421983 0.0103 0.0035 0.0021 0.0016 0.0023 0.0034 0.0055 0.0071 0.0052 0.0088 0.0108 0.00751984 0.0047 0.0040 0.0019 0.0014 0.0018 0.0026 0.0045 0.0056 0.0078 0.0184 0.0296 0.00801985 0.0048 0.0023 0.0015 0.0015 0.0027 0.0033 0.0124 0.0129 0.0221 0.0357 0.0328 0.01171986 0.0056 0.0036 0.0021 0.0013 0.0024 0.0039 0.0080 0.0113 0.0150 0.0224 0.0115 0.00651987 0.0080 0.0027 0.0016 0.0014 0.0025 0.0036 0.0103 0.0102 0.0148 0.0335 0.0282 0.01241988 0.0067 0.0030 0.0018 0.0017 0.0024 0.0036 0.0113 0.0160 0.0528 0.0279 0.0304 0.01781989 0.0139 0.0060 0.0028 0.0020 0.0034 0.0042 0.0273 0.0385 0.0300 0.0419 0.0317 0.01801990 0.0174 0.0064 0.0036 0.0023 0.0039 0.0052 0.0113 0.0155 0.0502 0.0734 0.0300 0.03661991 0.0200 0.0058 0.0040 0.0027 0.0038 0.0064 0.0197 0.0170 0.0277 0.0577 0.0509 0.03591992 0.0178 0.0055 0.0032 0.0024 0.0036 0.0040 0.0152 0.0402 0.0245 0.0200 0.0181 0.03141993 0.0123 0.0053 0.0027 0.0018 0.0035 0.0038 0.0110 0.0251 0.0294 0.0199 0.0249 0.01441994 0.0084 0.0035 0.0021 0.0019 0.0032 0.0046 0.0142 0.0254 0.0446 0.0270 0.0410 0.02561995 0.0146 0.0055 0.0028 0.0021 0.0043 0.0074 0.0175 0.0154 0.0079 0.0114 0.0235 0.01321996 0.0069 0.0030 0.0022 0.0020 0.0028 0.0044 0.0111 0.0172 0.0179 0.0251 0.0146 0.00971997 0.0070 0.0029 0.0020 0.0019 0.0030 0.0042 0.0100 0.0149 0.0113 0.0283 0.0152 0.01041998 0.0063 0.0026 0.0015 0.0014 0.0024 0.0038 0.0073 0.0118 0.0162 0.0267 0.0180 0.01171999 0.0069 0.0028 0.0020 0.0016 0.0027 0.0046 0.0108 0.0098 0.0107 0.0181 0.0122 0.00892000 0.0059 0.0027 0.0016 0.0013 0.0023 0.0039 0.0098 0.0154 0.0228 0.0269 0.0283 0.02142001 0.0116 0.0045 0.0032 0.0023 0.0039 0.0057 0.0128 0.0213 0.0391 0.0293 0.0239 0.01662002 0.0129 0.0084 0.0028 0.0025 0.0047 0.0068 0.0222 0.0429 0.0552 0.0435 0.0730 0.02312003 0.0179 0.0086 0.0043 0.0039 0.0068 0.0101 0.0232 0.0356 0.0601 0.0901 0.0901 0.05642004 0.0443 0.0088 0.0053 0.0044 0.0061 0.0104 0.0419 0.0723 0.0995 0.0785 0.0797 0.06742005 0.0250 0.0078 0.0047 0.0042 0.0070 0.0109 0.0241 0.0406 0.0229 0.0926 0.0744 0.04632006 0.0194 0.0082 0.0049 0.0039 0.0079 0.0085 0.0297 0.0750 0.1064 0.1096 0.0858 0.0582Avg 0.0127 0.0049 0.0027 0.0022 0.0037 0.0053 0.0151 0.0237 0.0329 0.0429 0.0379 0.0228Max 0.0443 0.0088 0.0053 0.0044 0.0079 0.0109 0.0419 0.0750 0.1064 0.1096 0.0901 0.0674Min 0.0047 0.0023 0.0015 0.0013 0.0018 0.0026 0.0045 0.0056 0.0052 0.0088 0.0108 0.0065Std 0.0076 0.0019 0.0010 0.0008 0.0014 0.0021 0.0080 0.0163 0.0242 0.0259 0.0227 0.0153
% SEEP PER MILEReach 17 Cozad Gage to Overton Gage Length 28.1 miles% Seep = Seep divided by Total Inflow to the Reach multiplied by 100
Wtr Yr Oct Nov Dec Jan Feb Mar Apr May Jun Jul Aug Sep197519761977197819791980 0.156719811982 0.0327 0.4881198319841985 0.02641986 0.3403198719881989199019911992 0.4002 0.8725 0.5847 1.6785 0.91501993 0.10531994 0.04031995 0.22501996 0.03921997 0.0135 0.0550 0.0306 0.1928 0.0246 0.0578 0.33941998 0.2496 0.44851999 0.0686 0.0103 0.3280 0.1025 0.2331 0.21202000 0.02462001 0.1303 0.44482002 0.32772003 0.1921200420052006

% DIVERSION PER MILEReach 17 Cozad Gage to Overton Gage Length 28.1 miles% Div = Diversions divided by Total Inflow to the Reach multiplied by 100
Wtr Yr Oct Nov Dec Jan Feb Mar Apr May Jun Jul Aug Sep19751976197719781979198019811982198319841985198619871988198919901991199219931994199519961997199819992000200120022003200420052006AvgMaxMinStd
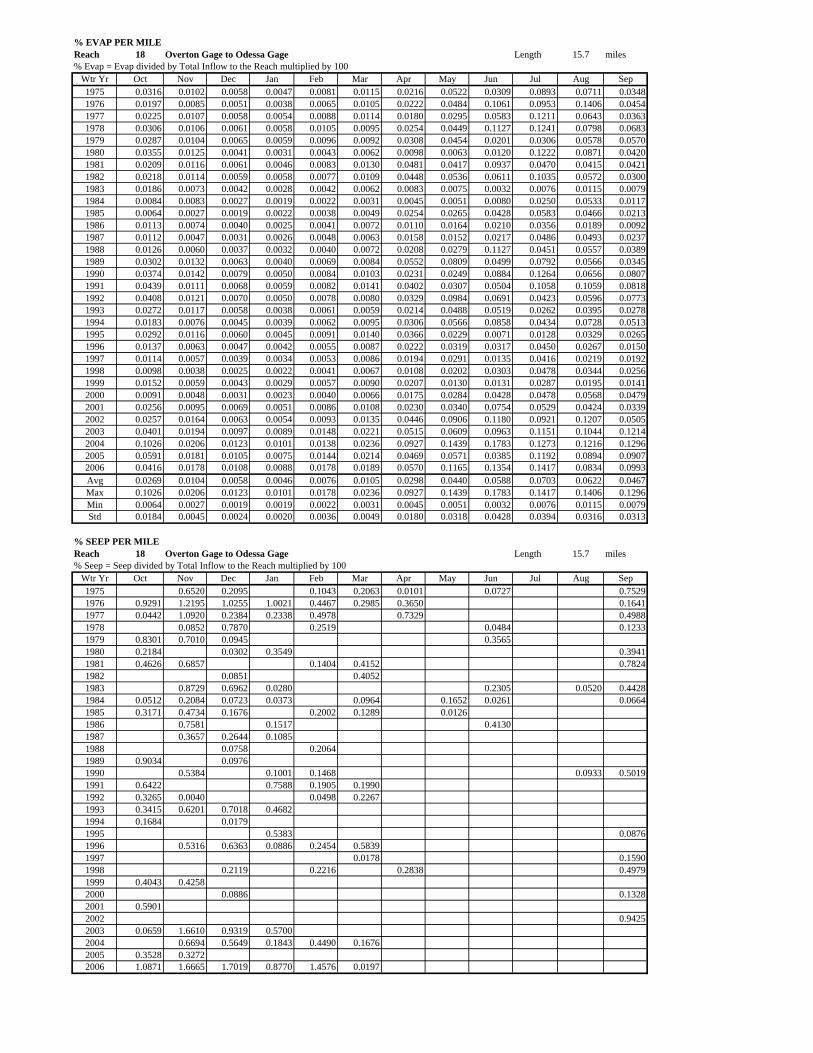
% EVAP PER MILEReach 18 Overton Gage to Odessa Gage Length 15.7 miles% Evap = Evap divided by Total Inflow to the Reach multiplied by 100
Wtr Yr Oct Nov Dec Jan Feb Mar Apr May Jun Jul Aug Sep1975 0.0316 0.0102 0.0058 0.0047 0.0081 0.0115 0.0216 0.0522 0.0309 0.0893 0.0711 0.03481976 0.0197 0.0085 0.0051 0.0038 0.0065 0.0105 0.0222 0.0484 0.1061 0.0953 0.1406 0.04541977 0.0225 0.0107 0.0058 0.0054 0.0088 0.0114 0.0180 0.0295 0.0583 0.1211 0.0643 0.03631978 0.0306 0.0106 0.0061 0.0058 0.0105 0.0095 0.0254 0.0449 0.1127 0.1241 0.0798 0.06831979 0.0287 0.0104 0.0065 0.0059 0.0096 0.0092 0.0308 0.0454 0.0201 0.0306 0.0578 0.05701980 0.0355 0.0125 0.0041 0.0031 0.0043 0.0062 0.0098 0.0063 0.0120 0.1222 0.0871 0.04201981 0.0209 0.0116 0.0061 0.0046 0.0083 0.0130 0.0481 0.0417 0.0937 0.0470 0.0415 0.04211982 0.0218 0.0114 0.0059 0.0058 0.0077 0.0109 0.0448 0.0536 0.0611 0.1035 0.0572 0.03001983 0.0186 0.0073 0.0042 0.0028 0.0042 0.0062 0.0083 0.0075 0.0032 0.0076 0.0115 0.00791984 0.0084 0.0083 0.0027 0.0019 0.0022 0.0031 0.0045 0.0051 0.0080 0.0250 0.0533 0.01171985 0.0064 0.0027 0.0019 0.0022 0.0038 0.0049 0.0254 0.0265 0.0428 0.0583 0.0466 0.02131986 0.0113 0.0074 0.0040 0.0025 0.0041 0.0072 0.0110 0.0164 0.0210 0.0356 0.0189 0.00921987 0.0112 0.0047 0.0031 0.0026 0.0048 0.0063 0.0158 0.0152 0.0217 0.0486 0.0493 0.02371988 0.0126 0.0060 0.0037 0.0032 0.0040 0.0072 0.0208 0.0279 0.1127 0.0451 0.0557 0.03891989 0.0302 0.0132 0.0063 0.0040 0.0069 0.0084 0.0552 0.0809 0.0499 0.0792 0.0566 0.03451990 0.0374 0.0142 0.0079 0.0050 0.0084 0.0103 0.0231 0.0249 0.0884 0.1264 0.0656 0.08071991 0.0439 0.0111 0.0068 0.0059 0.0082 0.0141 0.0402 0.0307 0.0504 0.1058 0.1059 0.08181992 0.0408 0.0121 0.0070 0.0050 0.0078 0.0080 0.0329 0.0984 0.0691 0.0423 0.0596 0.07731993 0.0272 0.0117 0.0058 0.0038 0.0061 0.0059 0.0214 0.0488 0.0519 0.0262 0.0395 0.02781994 0.0183 0.0076 0.0045 0.0039 0.0062 0.0095 0.0306 0.0566 0.0858 0.0434 0.0728 0.05131995 0.0292 0.0116 0.0060 0.0045 0.0091 0.0140 0.0366 0.0229 0.0071 0.0128 0.0329 0.02651996 0.0137 0.0063 0.0047 0.0042 0.0055 0.0087 0.0222 0.0319 0.0317 0.0450 0.0267 0.01501997 0.0114 0.0057 0.0039 0.0034 0.0053 0.0086 0.0194 0.0291 0.0135 0.0416 0.0219 0.01921998 0.0098 0.0038 0.0025 0.0022 0.0041 0.0067 0.0108 0.0202 0.0303 0.0478 0.0344 0.02561999 0.0152 0.0059 0.0043 0.0029 0.0057 0.0090 0.0207 0.0130 0.0131 0.0287 0.0195 0.01412000 0.0091 0.0048 0.0031 0.0023 0.0040 0.0066 0.0175 0.0284 0.0428 0.0478 0.0568 0.04792001 0.0256 0.0095 0.0069 0.0051 0.0086 0.0108 0.0230 0.0340 0.0754 0.0529 0.0424 0.03392002 0.0257 0.0164 0.0063 0.0054 0.0093 0.0135 0.0446 0.0906 0.1180 0.0921 0.1207 0.05052003 0.0401 0.0194 0.0097 0.0089 0.0148 0.0221 0.0515 0.0609 0.0963 0.1151 0.1044 0.12142004 0.1026 0.0206 0.0123 0.0101 0.0138 0.0236 0.0927 0.1439 0.1783 0.1273 0.1216 0.12962005 0.0591 0.0181 0.0105 0.0075 0.0144 0.0214 0.0469 0.0571 0.0385 0.1192 0.0894 0.09072006 0.0416 0.0178 0.0108 0.0088 0.0178 0.0189 0.0570 0.1165 0.1354 0.1417 0.0834 0.0993Avg 0.0269 0.0104 0.0058 0.0046 0.0076 0.0105 0.0298 0.0440 0.0588 0.0703 0.0622 0.0467Max 0.1026 0.0206 0.0123 0.0101 0.0178 0.0236 0.0927 0.1439 0.1783 0.1417 0.1406 0.1296Min 0.0064 0.0027 0.0019 0.0019 0.0022 0.0031 0.0045 0.0051 0.0032 0.0076 0.0115 0.0079Std 0.0184 0.0045 0.0024 0.0020 0.0036 0.0049 0.0180 0.0318 0.0428 0.0394 0.0316 0.0313
% SEEP PER MILEReach 18 Overton Gage to Odessa Gage Length 15.7 miles% Seep = Seep divided by Total Inflow to the Reach multiplied by 100
Wtr Yr Oct Nov Dec Jan Feb Mar Apr May Jun Jul Aug Sep1975 0.6520 0.2095 0.1043 0.2063 0.0101 0.0727 0.75291976 0.9291 1.2195 1.0255 1.0021 0.4467 0.2985 0.3650 0.16411977 0.0442 1.0920 0.2384 0.2338 0.4978 0.7329 0.49881978 0.0852 0.7870 0.2519 0.0484 0.12331979 0.8301 0.7010 0.0945 0.35651980 0.2184 0.0302 0.3549 0.39411981 0.4626 0.6857 0.1404 0.4152 0.78241982 0.0851 0.40521983 0.8729 0.6962 0.0280 0.2305 0.0520 0.44281984 0.0512 0.2084 0.0723 0.0373 0.0964 0.1652 0.0261 0.06641985 0.3171 0.4734 0.1676 0.2002 0.1289 0.01261986 0.7581 0.1517 0.41301987 0.3657 0.2644 0.10851988 0.0758 0.20641989 0.9034 0.09761990 0.5384 0.1001 0.1468 0.0933 0.50191991 0.6422 0.7588 0.1905 0.19901992 0.3265 0.0040 0.0498 0.22671993 0.3415 0.6201 0.7018 0.46821994 0.1684 0.01791995 0.5383 0.08761996 0.5316 0.6363 0.0886 0.2454 0.58391997 0.0178 0.15901998 0.2119 0.2216 0.2838 0.49791999 0.4043 0.42582000 0.0886 0.13282001 0.59012002 0.94252003 0.0659 1.6610 0.9319 0.57002004 0.6694 0.5649 0.1843 0.4490 0.16762005 0.3528 0.32722006 1.0871 1.6665 1.7019 0.8770 1.4576 0.0197

% DIVERSION PER MILEReach 18 Overton Gage to Odessa Gage Length 15.7 miles% Div = Diversions divided by Total Inflow to the Reach multiplied by 100
Wtr Yr Oct Nov Dec Jan Feb Mar Apr May Jun Jul Aug Sep1975 1.2674 0.9841 0.0731 0.0892 0.6847 1.4358 1.1315 3.3059 2.9789 0.91571976 1.5850 0.7045 0.1737 0.9803 0.8138 2.3990 3.1585 4.6572 1.95181977 1.5700 0.7032 0.4412 0.7411 0.9215 2.0181 4.0427 3.7402 1.84801978 1.2261 0.3029 0.3983 1.4686 3.6300 2.7367 3.7627 2.83131979 1.7728 0.9125 0.3934 2.0227 0.6398 1.1498 3.0292 3.11021980 3.3932 0.3212 0.1443 0.1904 0.3315 4.2102 3.1347 2.33111981 2.3957 1.7283 0.2061 2.2264 2.2170 3.7660 1.4802 2.2482 2.30651982 0.7610 0.4728 1.2879 3.1227 4.3368 3.5652 1.94851983 0.1269 0.4101 0.2078 0.0984 0.1672 0.3332 0.24591984 0.3525 0.0065 0.0001 0.0419 0.1456 0.7626 2.4035 0.53571985 0.4204 0.2120 0.3800 0.4999 0.7683 2.4355 1.9968 1.11541986 1.0119 0.6720 0.1070 0.5460 0.6161 1.2897 0.7878 0.43291987 0.3849 0.1699 0.0806 0.4161 0.4929 1.2763 1.8659 0.76541988 0.7830 0.8018 0.3094 0.0621 0.4531 0.7486 2.6651 1.0236 1.4331 1.38571989 0.3496 0.6335 3.2836 1.2605 2.1594 2.2670 1.35251990 1.2909 0.1375 0.9571 3.3263 4.8582 2.1522 3.23211991 1.6186 0.0337 0.3252 0.4887 0.6111 2.3150 2.2409 1.23641992 0.1242 2.4719 2.3700 0.9176 1.0576 1.48671993 0.1704 0.1395 0.6948 0.2060 0.6141 0.42821994 0.0336 1.3136 0.9816 2.2136 0.75551995 0.4262 0.5434 0.1614 0.3146 1.1517 0.61221996 0.3813 0.6625 0.9540 0.5652 0.37531997 0.5674 0.5321 0.4302 0.9418 0.2624 1.3886 0.7966 0.80741998 0.2737 0.0017 0.2424 0.5851 0.7237 1.6690 1.3821 0.71381999 0.4581 0.2263 0.6394 0.1005 0.1394 0.4795 0.4091 0.33172000 0.2380 0.1363 0.0131 0.1623 0.5058 0.7834 0.8502 1.4461 1.30502001 0.7702 0.0512 1.5916 1.8806 1.8329 1.71262002 2.0328 1.9948 0.3044 2.9033 1.5254 2.2503 4.7793 2.52442003 2.4690 1.7854 4.5031 5.6744 6.0816 4.55122004 1.0973 5.6378 4.7396 5.5632 4.33652005 0.0011 0.2585 2.3655 2.8818 1.1514 5.0985 5.0904 5.46142006 3.3099 1.9225 0.6455 3.4599 5.7222 6.0631 6.1520 4.4899 5.8723Avg 0.9563 0.3927 0.0120 0.0004 0.0657 0.5093 1.1779 1.7064 2.3208 2.5022 1.8381Max 3.3932 1.9948 0.3094 0.0131 0.6455 3.4599 5.7222 6.0631 6.1520 6.0816 5.8723Min 0.0336 0.0984 0.1672 0.3332 0.2459Std 0.9483 0.5692 0.0549 0.0023 0.1453 0.7626 1.2150 1.5954 1.7008 1.5713 1.4776
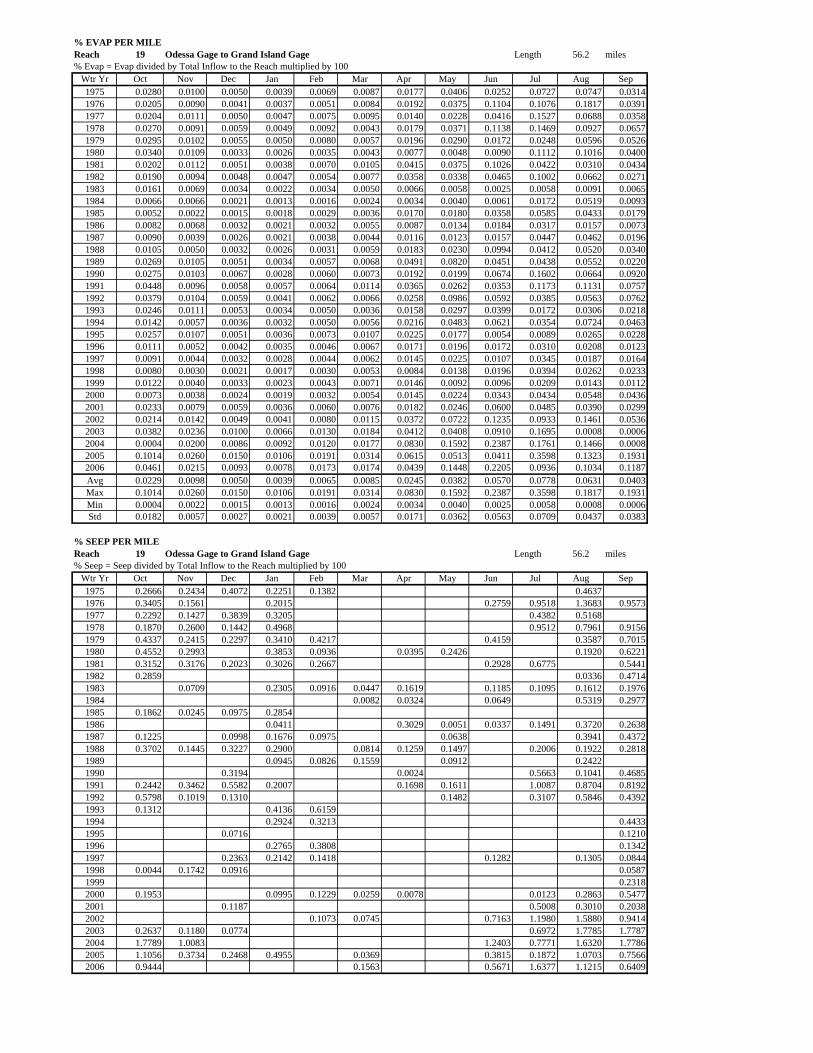
% EVAP PER MILEReach 19 Odessa Gage to Grand Island Gage Length 56.2 miles% Evap = Evap divided by Total Inflow to the Reach multiplied by 100
Wtr Yr Oct Nov Dec Jan Feb Mar Apr May Jun Jul Aug Sep1975 0.0280 0.0100 0.0050 0.0039 0.0069 0.0087 0.0177 0.0406 0.0252 0.0727 0.0747 0.03141976 0.0205 0.0090 0.0041 0.0037 0.0051 0.0084 0.0192 0.0375 0.1104 0.1076 0.1817 0.03911977 0.0204 0.0111 0.0050 0.0047 0.0075 0.0095 0.0140 0.0228 0.0416 0.1527 0.0688 0.03581978 0.0270 0.0091 0.0059 0.0049 0.0092 0.0043 0.0179 0.0371 0.1138 0.1469 0.0927 0.06571979 0.0295 0.0102 0.0055 0.0050 0.0080 0.0057 0.0196 0.0290 0.0172 0.0248 0.0596 0.05261980 0.0340 0.0109 0.0033 0.0026 0.0035 0.0043 0.0077 0.0048 0.0090 0.1112 0.1016 0.04001981 0.0202 0.0112 0.0051 0.0038 0.0070 0.0105 0.0415 0.0375 0.1026 0.0422 0.0310 0.04341982 0.0190 0.0094 0.0048 0.0047 0.0054 0.0077 0.0358 0.0338 0.0465 0.1002 0.0662 0.02711983 0.0161 0.0069 0.0034 0.0022 0.0034 0.0050 0.0066 0.0058 0.0025 0.0058 0.0091 0.00651984 0.0066 0.0066 0.0021 0.0013 0.0016 0.0024 0.0034 0.0040 0.0061 0.0172 0.0519 0.00931985 0.0052 0.0022 0.0015 0.0018 0.0029 0.0036 0.0170 0.0180 0.0358 0.0585 0.0433 0.01791986 0.0082 0.0068 0.0032 0.0021 0.0032 0.0055 0.0087 0.0134 0.0184 0.0317 0.0157 0.00731987 0.0090 0.0039 0.0026 0.0021 0.0038 0.0044 0.0116 0.0123 0.0157 0.0447 0.0462 0.01961988 0.0105 0.0050 0.0032 0.0026 0.0031 0.0059 0.0183 0.0230 0.0994 0.0412 0.0520 0.03401989 0.0269 0.0105 0.0051 0.0034 0.0057 0.0068 0.0491 0.0820 0.0451 0.0438 0.0552 0.02201990 0.0275 0.0103 0.0067 0.0028 0.0060 0.0073 0.0192 0.0199 0.0674 0.1602 0.0664 0.09201991 0.0448 0.0096 0.0058 0.0057 0.0064 0.0114 0.0365 0.0262 0.0353 0.1173 0.1131 0.07571992 0.0379 0.0104 0.0059 0.0041 0.0062 0.0066 0.0258 0.0986 0.0592 0.0385 0.0563 0.07621993 0.0246 0.0111 0.0053 0.0034 0.0050 0.0036 0.0158 0.0297 0.0399 0.0172 0.0306 0.02181994 0.0142 0.0057 0.0036 0.0032 0.0050 0.0056 0.0216 0.0483 0.0621 0.0354 0.0724 0.04631995 0.0257 0.0107 0.0051 0.0036 0.0073 0.0107 0.0225 0.0177 0.0054 0.0089 0.0265 0.02281996 0.0111 0.0052 0.0042 0.0035 0.0046 0.0067 0.0171 0.0196 0.0172 0.0310 0.0208 0.01231997 0.0091 0.0044 0.0032 0.0028 0.0044 0.0062 0.0145 0.0225 0.0107 0.0345 0.0187 0.01641998 0.0080 0.0030 0.0021 0.0017 0.0030 0.0053 0.0084 0.0138 0.0196 0.0394 0.0262 0.02331999 0.0122 0.0040 0.0033 0.0023 0.0043 0.0071 0.0146 0.0092 0.0096 0.0209 0.0143 0.01122000 0.0073 0.0038 0.0024 0.0019 0.0032 0.0054 0.0145 0.0224 0.0343 0.0434 0.0548 0.04362001 0.0233 0.0079 0.0059 0.0036 0.0060 0.0076 0.0182 0.0246 0.0600 0.0485 0.0390 0.02992002 0.0214 0.0142 0.0049 0.0041 0.0080 0.0115 0.0372 0.0722 0.1235 0.0933 0.1461 0.05362003 0.0382 0.0236 0.0100 0.0066 0.0130 0.0184 0.0412 0.0408 0.0910 0.1695 0.0008 0.00062004 0.0004 0.0200 0.0086 0.0092 0.0120 0.0177 0.0830 0.1592 0.2387 0.1761 0.1466 0.00082005 0.1014 0.0260 0.0150 0.0106 0.0191 0.0314 0.0615 0.0513 0.0411 0.3598 0.1323 0.19312006 0.0461 0.0215 0.0093 0.0078 0.0173 0.0174 0.0439 0.1448 0.2205 0.0936 0.1034 0.1187Avg 0.0229 0.0098 0.0050 0.0039 0.0065 0.0085 0.0245 0.0382 0.0570 0.0778 0.0631 0.0403Max 0.1014 0.0260 0.0150 0.0106 0.0191 0.0314 0.0830 0.1592 0.2387 0.3598 0.1817 0.1931Min 0.0004 0.0022 0.0015 0.0013 0.0016 0.0024 0.0034 0.0040 0.0025 0.0058 0.0008 0.0006Std 0.0182 0.0057 0.0027 0.0021 0.0039 0.0057 0.0171 0.0362 0.0563 0.0709 0.0437 0.0383
% SEEP PER MILEReach 19 Odessa Gage to Grand Island Gage Length 56.2 miles% Seep = Seep divided by Total Inflow to the Reach multiplied by 100
Wtr Yr Oct Nov Dec Jan Feb Mar Apr May Jun Jul Aug Sep1975 0.2666 0.2434 0.4072 0.2251 0.1382 0.46371976 0.3405 0.1561 0.2015 0.2759 0.9518 1.3683 0.95731977 0.2292 0.1427 0.3839 0.3205 0.4382 0.51681978 0.1870 0.2600 0.1442 0.4968 0.9512 0.7961 0.91561979 0.4337 0.2415 0.2297 0.3410 0.4217 0.4159 0.3587 0.70151980 0.4552 0.2993 0.3853 0.0936 0.0395 0.2426 0.1920 0.62211981 0.3152 0.3176 0.2023 0.3026 0.2667 0.2928 0.6775 0.54411982 0.2859 0.0336 0.47141983 0.0709 0.2305 0.0916 0.0447 0.1619 0.1185 0.1095 0.1612 0.19761984 0.0082 0.0324 0.0649 0.5319 0.29771985 0.1862 0.0245 0.0975 0.28541986 0.0411 0.3029 0.0051 0.0337 0.1491 0.3720 0.26381987 0.1225 0.0998 0.1676 0.0975 0.0638 0.3941 0.43721988 0.3702 0.1445 0.3227 0.2900 0.0814 0.1259 0.1497 0.2006 0.1922 0.28181989 0.0945 0.0826 0.1559 0.0912 0.24221990 0.3194 0.0024 0.5663 0.1041 0.46851991 0.2442 0.3462 0.5582 0.2007 0.1698 0.1611 1.0087 0.8704 0.81921992 0.5798 0.1019 0.1310 0.1482 0.3107 0.5846 0.43921993 0.1312 0.4136 0.61591994 0.2924 0.3213 0.44331995 0.0716 0.12101996 0.2765 0.3808 0.13421997 0.2363 0.2142 0.1418 0.1282 0.1305 0.08441998 0.0044 0.1742 0.0916 0.05871999 0.23182000 0.1953 0.0995 0.1229 0.0259 0.0078 0.0123 0.2863 0.54772001 0.1187 0.5008 0.3010 0.20382002 0.1073 0.0745 0.7163 1.1980 1.5880 0.94142003 0.2637 0.1180 0.0774 0.6972 1.7785 1.77872004 1.7789 1.0083 1.2403 0.7771 1.6320 1.77862005 1.1056 0.3734 0.2468 0.4955 0.0369 0.3815 0.1872 1.0703 0.75662006 0.9444 0.1563 0.5671 1.6377 1.1215 0.6409

% DIVERSION PER MILEReach 19 Odessa Gage to Grand Island Gage Length 56.2 miles% Div = Diversions divided by Total Inflow to the Reach multiplied by 100
Wtr Yr Oct Nov Dec Jan Feb Mar Apr May Jun Jul Aug Sep19751976197719781979198019811982198319841985198619871988198919901991199219931994199519961997199819992000200120022003200420052006AvgMaxMinStd
WATER MANAGEMENT STUDY, PHASE I EVALUATION OF PULSE FLOWS FOR THE PLATTE RIVER
RECOVERY IMPLEMENTATION PROGRAM
Phase I Report April 8, 2008
APPENDIX 3
Routing Tool Analysis Results

WY Year Class Scenario
Total
McConaughy
Release (af)
Total EA at
Overton (af)*
Peak EA Flow
at Overton (cfs)
Peak 3-Day
Total (af)
# Days >
5,000 EA (cfs)
# Days >
6,000 total
(cfs)
# Days >
800 EA
(cfs)
Total EA Irr
Season (af)
Shortage on
Peak Day
(cfs)
Target Vol
Short (af) Days of Year Typical reasons for short to target flow
1947 Average 5000-I 85493 82274 5221 22495 1 8 14 -221 7258 4/9-4/27 North Platte River, North Platte Hydro
1947 Average 5000-II 38115 42264 2521 14339 0 8 8 2479 15413 12/6-12/20 North Platte River
1947 Average 800-I 343483 246608 816 4792 0 11 135 239531 -16 3250 Sutherland Canal
1947 Average 800-II 343606 248033 800 4760 0 11 131 236966 0 5814 North Platte River
1948 Average 5000-I 107431 101159 5651 25682 1 1 20 -651 4070 1/26-2/15 North Platte River, Sutherland Canal
1948 Average 5000-II 37427 41710 2636 14151 0 0 9 2364 15601 2/1-2/15 North Platte River
1948 Average 800-I 338503 242499 800 4760 0 0 141 235281 0 7500 Korty Div, North Platte River
1948 Average 800-II 339031 243024 800 4760 0 0 141 234952 0 7828 North Platte River
1949 Average 5000-I 94511 90561 3942 21483 0 15 16 1058 8269 1/28-2/17 Sutherland Canal, North Platte Hydro, North Platte River
1949 Average 5000-II 44782 47980 2619 15424 0 15 9 2381 14328 12/25-1/9 North Platte River
1949 Average 800-I 345177 248485 812 4785 0 15 141 238791 -12 3989 North Platte River, North Platte Hydro, Keystone Ramp
1949 Average 800-II 343109 247390 800 4760 0 15 141 238012 0 4769 North Platte River
1950 Average 5000-I 115729 104939 4724 21847 0 0 21 276 7905 4/9-4/30 North Platte River, CNPPID Div
1950 Average 5000-II 39923 43814 2494 14528 0 0 9 2506 15225 12/2-12/16 North Platte River
1950 Average 800-I 351213 252924 807 4775 0 0 151 242746 -7 35 Keystone Ramp, North Platte Ramp
1950 Average 800-II 351999 253949 800 4760 0 0 155 242780 0 0
1951 Average 5000-I 109990 93122 3833 20356 0 1 19 1167 9397 4/18-4/30 North Platte Hydro, North Platte Hydro, North Platte River
1951 Average 5000-II 32351 37321 2483 13461 0 1 7 2517 16291 1/16-1/29 North Platte River
1951 Average 800-I 348532 251083 808 4775 0 1 149 242294 -8 487 Sutherland Canal, Keystone Div, North Platte Ramp
1951 Average 800-II 345537 249375 800 4760 0 1 148 238390 0 4391 North Platte River, North Platte Ramp
1952 Wet 5000-I 90863 87766 3419 17659 0 0 18 1581 12094 4/3-4/14 North Platte River
1952 Wet 5000-II 44207 47910 2543 15081 0 0 9 2457 14672 12/3-12/18 North Platte River
1952 Wet 800-I 345088 247631 800 4760 0 0 131 237998 0 4783 Sutherland Canal
1952 Wet 800-II 310210 223450 800 4760 0 0 113 213824 0 28956 North Platte River
1953 Average 5000-I 119308 111815 4517 20922 0 1 20 483 8831 2/10-2/24 North Platte River, North Platte Hydro
1953 Average 5000-II 38505 42598 2594 14814 0 0 8 2406 14939 2/10-2/24 North Platte River
1953 Average 800-I 348159 251099 808 4775 0 0 146 240769 -8 2011 Sutherland Canal, North Platte River
1953 Average 800-II 348813 251648 800 4760 0 0 148 240822 0 1958 North Platte Ramp, North Platte River
1954 Dry 5000-I 70905 68161 4695 21810 0 0 12 305 7943 4/10-4/27 Keystone Div, North Platte Hydro, North Platte River
1954 Dry 5000-II 55370 55373 2514 14927 0 0 11 2486 14825 4/3-4/20 North Platte River
1954 Dry 800-I 574306 240193 800 4760 0 0 110 229125 0 13655 Sutherland Canal, North Platte River
1954 Dry 800-II 575394 241423 800 4760 0 0 111 229223 0 13557 North Platte River
1955 Dry 5000-I 98171 89551 5094 22404 1 0 15 -94 7349 4/8-4/30 North Platte Hydro, North Platte River
1955 Dry 5000-II 38240 40686 2645 14586 0 0 8 2355 15166 2/7-2/21 North Platte River
1955 Dry 800-I 576248 241193 807 4774 0 0 105 229995 -7 12786 Sutherland Canal, North Platte River
1955 Dry 800-II 576880 241188 800 4760 0 0 113 230576 0 12205 North Platte River
1956 Dry 5000-I 120006 110601 4975 26191 0 1 20 25 3562 3/10-3/30 Keystone Div, North Platte River
1956 Dry 5000-II 32632 35917 2530 13701 0 0 7 2470 16052 12/8-12/21 North Platte Ramp
1956 Dry 800-I 589632 245281 806 4772 0 0 115 235289 -6 7491 Sutherland Canal, North Platte River
1956 Dry 800-II 588888 245322 800 4760 0 0 110 234204 0 8577 North Platte River
1957 Dry 5000-I 51304 51743 5000 22499 0 2 7 0 7253 3/29-4/10 Sutherland Canal, North Platte River
1957 Dry 5000-II 44302 45884 2555 15031 0 2 9 2445 14722 12/30-1/14 North Platte River
1957 Dry 800-I 582428 243547 808 4775 0 4 114 232360 -8 10420 Sutherland Canal, North Platte River
1957 Dry 800-II 582963 243630 800 4760 0 4 118 233038 0 9742 North Platte Ramp
1958 Average 5000-I 95143 91076 4586 21732 0 1 15 414 8021 2/17-3/8 Sutherland Canal, North Platte River
1958 Average 5000-II 38136 42281 2631 14493 0 0 8 2369 15259 2/16-3/2 North Platte River
1958 Average 800-I 342493 245504 815 4790 0 1 130 235565 -15 7215 Ramp rates in Keystone Div, North Platte River
1958 Average 800-II 340350 245746 800 4760 0 1 142 234681 0 8100 North Platte River
1959 Dry 5000-I 59166 58203 4588 21581 0 0 9 412 8171 2/22-3/8 Sutherland Canal, North Platte River
1959 Dry 5000-II 43556 45244 2429 14406 0 0 9 2571 15347 12/13-12/28 North Platte River
1959 Dry 800-I 589619 246433 818 4784 0 0 113 235268 -18 7513 Sutherland Canal, North Platte River
1959 Dry 800-II 589566 247105 800 4760 0 0 127 234982 0 7799 North Platte River
1960 Average 5000-I 47938 50671 5173 21794 1 2 7 -173 7959 2/25-3/9 North Platte River, Sutherland Canal
1960 Average 5000-II 44217 47531 2585 15218 0 2 9 2415 14535 11/2-11/17 North Platte River
1960 Average 800-I 350584 251140 839 4838 0 2 145 242615 -39 165 North Platte Hydro
1960 Average 800-II 351760 252230 800 4760 0 2 152 242697 0 84 North Platte River
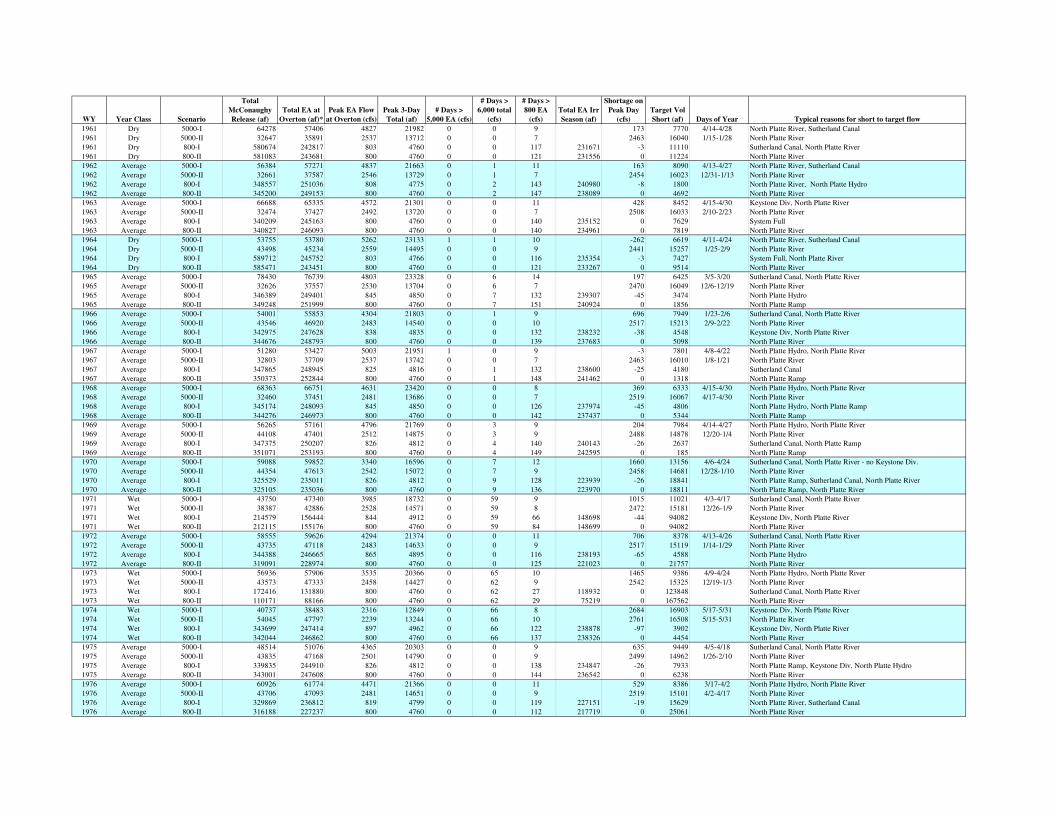
WY Year Class Scenario
Total
McConaughy
Release (af)
Total EA at
Overton (af)*
Peak EA Flow
at Overton (cfs)
Peak 3-Day
Total (af)
# Days >
5,000 EA (cfs)
# Days >
6,000 total
(cfs)
# Days >
800 EA
(cfs)
Total EA Irr
Season (af)
Shortage on
Peak Day
(cfs)
Target Vol
Short (af) Days of Year Typical reasons for short to target flow
1961 Dry 5000-I 64278 57406 4827 21982 0 0 9 173 7770 4/14-4/28 North Platte River, Sutherland Canal
1961 Dry 5000-II 32647 35891 2537 13712 0 0 7 2463 16040 1/15-1/28 North Platte River
1961 Dry 800-I 580674 242817 803 4760 0 0 117 231671 -3 11110 Sutherland Canal, North Platte River
1961 Dry 800-II 581083 243681 800 4760 0 0 121 231556 0 11224 North Platte River
1962 Average 5000-I 56384 57271 4837 21663 0 1 11 163 8090 4/13-4/27 North Platte River, Sutherland Canal
1962 Average 5000-II 32661 37587 2546 13729 0 1 7 2454 16023 12/31-1/13 North Platte River
1962 Average 800-I 348557 251036 808 4775 0 2 143 240980 -8 1800 North Platte River, North Platte Hydro
1962 Average 800-II 345200 249153 800 4760 0 2 147 238089 0 4692 North Platte River
1963 Average 5000-I 66688 65335 4572 21301 0 0 11 428 8452 4/15-4/30 Keystone Div, North Platte River
1963 Average 5000-II 32474 37427 2492 13720 0 0 7 2508 16033 2/10-2/23 North Platte River
1963 Average 800-I 340209 245163 800 4760 0 0 140 235152 0 7629 System Full
1963 Average 800-II 340827 246093 800 4760 0 0 140 234961 0 7819 North Platte River
1964 Dry 5000-I 53755 53780 5262 23133 1 1 10 -262 6619 4/11-4/24 North Platte River, Sutherland Canal
1964 Dry 5000-II 43498 45234 2559 14495 0 0 9 2441 15257 1/25-2/9 North Platte River
1964 Dry 800-I 589712 245752 803 4766 0 0 116 235354 -3 7427 System Full, North Platte River
1964 Dry 800-II 585471 243451 800 4760 0 0 121 233267 0 9514 North Platte River
1965 Average 5000-I 78430 76739 4803 23328 0 6 14 197 6425 3/5-3/20 Sutherland Canal, North Platte River
1965 Average 5000-II 32626 37557 2530 13704 0 6 7 2470 16049 12/6-12/19 North Platte River
1965 Average 800-I 346389 249401 845 4850 0 7 132 239307 -45 3474 North Platte Hydro
1965 Average 800-II 349248 251999 800 4760 0 7 151 240924 0 1856 North Platte Ramp
1966 Average 5000-I 54001 55853 4304 21803 0 1 9 696 7949 1/23-2/6 Sutherland Canal, North Platte River
1966 Average 5000-II 43546 46920 2483 14540 0 0 10 2517 15213 2/9-2/22 North Platte River
1966 Average 800-I 342975 247628 838 4835 0 0 132 238232 -38 4548 Keystone Div, North Platte River
1966 Average 800-II 344676 248793 800 4760 0 0 139 237683 0 5098 North Platte River
1967 Average 5000-I 51280 53427 5003 21951 1 0 9 -3 7801 4/8-4/22 North Platte Hydro, North Platte River
1967 Average 5000-II 32803 37709 2537 13742 0 0 7 2463 16010 1/8-1/21 North Platte River
1967 Average 800-I 347865 248945 825 4816 0 1 132 238600 -25 4180 Sutherland Canal
1967 Average 800-II 350373 252844 800 4760 0 1 148 241462 0 1318 North Platte Ramp
1968 Average 5000-I 68363 66751 4631 23420 0 0 8 369 6333 4/15-4/30 North Platte Hydro, North Platte River
1968 Average 5000-II 32460 37451 2481 13686 0 0 7 2519 16067 4/17-4/30 North Platte River
1968 Average 800-I 345174 248093 845 4850 0 0 126 237974 -45 4806 North Platte Hydro, North Platte Ramp
1968 Average 800-II 344276 246973 800 4760 0 0 142 237437 0 5344 North Platte Ramp
1969 Average 5000-I 56265 57161 4796 21769 0 3 9 204 7984 4/14-4/27 North Platte Hydro, North Platte River
1969 Average 5000-II 44108 47401 2512 14875 0 3 9 2488 14878 12/20-1/4 North Platte River
1969 Average 800-I 347375 250207 826 4812 0 4 140 240143 -26 2637 Sutherland Canal, North Platte Ramp
1969 Average 800-II 351071 253193 800 4760 0 4 149 242595 0 185 North Platte Ramp
1970 Average 5000-I 59088 59852 3340 16596 0 7 12 1660 13156 4/6-4/24 Sutherland Canal, North Platte River - no Keystone Div.
1970 Average 5000-II 44354 47613 2542 15072 0 7 9 2458 14681 12/28-1/10 North Platte River
1970 Average 800-I 325529 235011 826 4812 0 9 128 223939 -26 18841 North Platte Ramp, Sutherland Canal, North Platte River
1970 Average 800-II 325105 235036 800 4760 0 9 136 223970 0 18811 North Platte Ramp, North Platte River
1971 Wet 5000-I 43750 47340 3985 18732 0 59 9 1015 11021 4/3-4/17 Sutherland Canal, North Platte River
1971 Wet 5000-II 38387 42886 2528 14571 0 59 8 2472 15181 12/26-1/9 North Platte River
1971 Wet 800-I 214579 156444 844 4912 0 59 66 148698 -44 94082 Keystone Div, North Platte River
1971 Wet 800-II 212115 155176 800 4760 0 59 84 148699 0 94082 North Platte River
1972 Average 5000-I 58555 59626 4294 21374 0 0 11 706 8378 4/13-4/26 Sutherland Canal, North Platte River
1972 Average 5000-II 43735 47118 2483 14633 0 0 9 2517 15119 1/14-1/29 North Platte River
1972 Average 800-I 344388 246665 865 4895 0 0 116 238193 -65 4588 North Platte Hydro
1972 Average 800-II 319091 228974 800 4760 0 0 125 221023 0 21757 North Platte River
1973 Wet 5000-I 56936 57906 3535 20366 0 65 10 1465 9386 4/9-4/24 North Platte Hydro, North Platte River
1973 Wet 5000-II 43573 47333 2458 14427 0 62 9 2542 15325 12/19-1/3 North Platte River
1973 Wet 800-I 172416 131880 800 4760 0 62 27 118932 0 123848 Sutherland Canal, North Platte River
1973 Wet 800-II 110171 88166 800 4760 0 62 29 75219 0 167562 North Platte River
1974 Wet 5000-I 40737 38483 2316 12849 0 66 8 2684 16903 5/17-5/31 Keystone Div, North Platte River
1974 Wet 5000-II 54045 47797 2239 13244 0 66 10 2761 16508 5/15-5/31 North Platte River
1974 Wet 800-I 343699 247414 897 4962 0 66 122 238878 -97 3902 Keystone Div, North Platte River
1974 Wet 800-II 342044 246862 800 4760 0 66 137 238326 0 4454 North Platte River
1975 Average 5000-I 48514 51076 4365 20303 0 0 9 635 9449 4/5-4/18 Sutherland Canal, North Platte River
1975 Average 5000-II 43835 47168 2501 14790 0 0 9 2499 14962 1/26-2/10 North Platte River
1975 Average 800-I 339835 244910 826 4812 0 0 138 234847 -26 7933 North Platte Ramp, Keystone Div, North Platte Hydro
1975 Average 800-II 343001 247608 800 4760 0 0 144 236542 0 6238 North Platte River
1976 Average 5000-I 60926 61774 4471 21366 0 0 11 529 8386 3/17-4/2 North Platte Hydro, North Platte River
1976 Average 5000-II 43706 47093 2481 14651 0 0 9 2519 15101 4/2-4/17 North Platte River
1976 Average 800-I 329869 236812 819 4799 0 0 119 227151 -19 15629 North Platte River, Sutherland Canal
1976 Average 800-II 316188 227237 800 4760 0 0 112 217719 0 25061 North Platte River
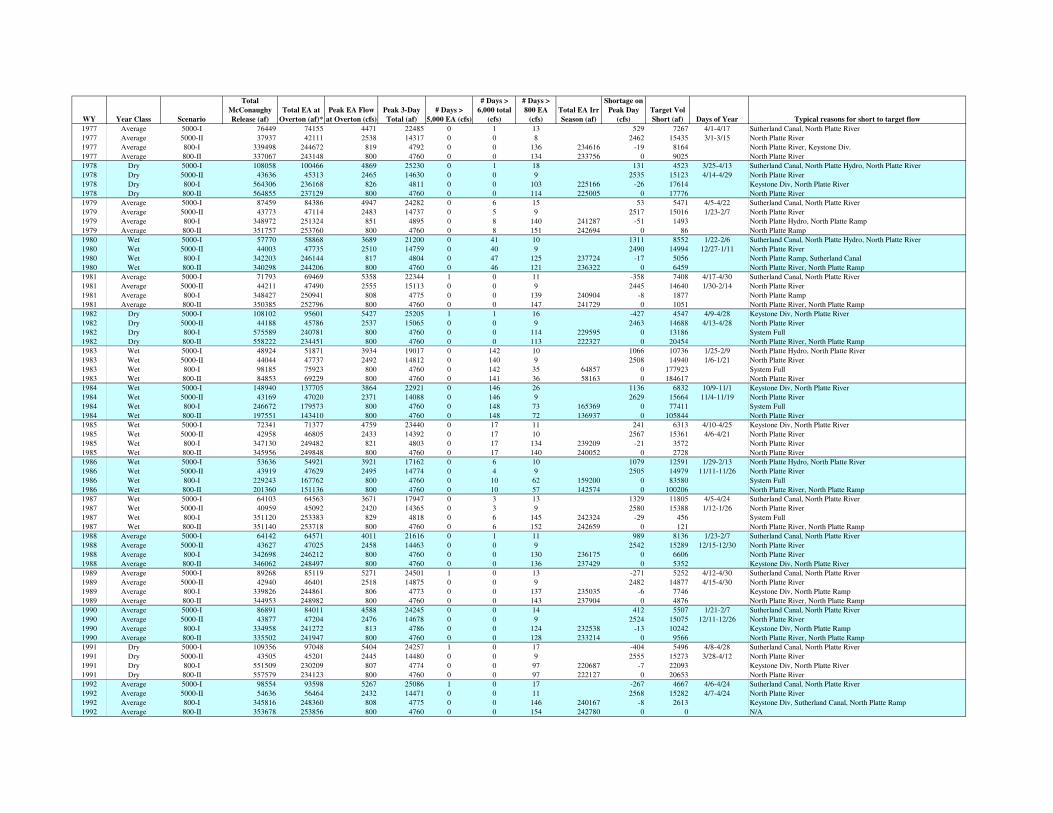
WY Year Class Scenario
Total
McConaughy
Release (af)
Total EA at
Overton (af)*
Peak EA Flow
at Overton (cfs)
Peak 3-Day
Total (af)
# Days >
5,000 EA (cfs)
# Days >
6,000 total
(cfs)
# Days >
800 EA
(cfs)
Total EA Irr
Season (af)
Shortage on
Peak Day
(cfs)
Target Vol
Short (af) Days of Year Typical reasons for short to target flow
1977 Average 5000-I 76449 74155 4471 22485 0 1 13 529 7267 4/1-4/17 Sutherland Canal, North Platte River
1977 Average 5000-II 37937 42111 2538 14317 0 0 8 2462 15435 3/1-3/15 North Platte River
1977 Average 800-I 339498 244672 819 4792 0 0 136 234616 -19 8164 North Platte River, Keystone Div.
1977 Average 800-II 337067 243148 800 4760 0 0 134 233756 0 9025 North Platte River
1978 Dry 5000-I 108058 100466 4869 25230 0 1 18 131 4523 3/25-4/13 Sutherland Canal, North Platte Hydro, North Platte River
1978 Dry 5000-II 43636 45313 2465 14630 0 0 9 2535 15123 4/14-4/29 North Platte River
1978 Dry 800-I 564306 236168 826 4811 0 0 103 225166 -26 17614 Keystone Div, North Platte River
1978 Dry 800-II 564855 237129 800 4760 0 0 114 225005 0 17776 North Platte River
1979 Average 5000-I 87459 84386 4947 24282 0 6 15 53 5471 4/5-4/22 Sutherland Canal, North Platte River
1979 Average 5000-II 43773 47114 2483 14737 0 5 9 2517 15016 1/23-2/7 North Platte River
1979 Average 800-I 348972 251324 851 4895 0 8 140 241287 -51 1493 North Platte Hydro, North Platte Ramp
1979 Average 800-II 351757 253760 800 4760 0 8 151 242694 0 86 North Platte Ramp
1980 Wet 5000-I 57770 58868 3689 21200 0 41 10 1311 8552 1/22-2/6 Sutherland Canal, North Platte Hydro, North Platte River
1980 Wet 5000-II 44003 47735 2510 14759 0 40 9 2490 14994 12/27-1/11 North Platte River
1980 Wet 800-I 342203 246144 817 4804 0 47 125 237724 -17 5056 North Platte Ramp, Sutherland Canal
1980 Wet 800-II 340298 244206 800 4760 0 46 121 236322 0 6459 North Platte River, North Platte Ramp
1981 Average 5000-I 71793 69469 5358 22344 1 0 11 -358 7408 4/17-4/30 Sutherland Canal, North Platte River
1981 Average 5000-II 44211 47490 2555 15113 0 0 9 2445 14640 1/30-2/14 North Platte River
1981 Average 800-I 348427 250941 808 4775 0 0 139 240904 -8 1877 North Platte Ramp
1981 Average 800-II 350385 252796 800 4760 0 0 147 241729 0 1051 North Platte River, North Platte Ramp
1982 Dry 5000-I 108102 95601 5427 25205 1 1 16 -427 4547 4/9-4/28 Keystone Div, North Platte River
1982 Dry 5000-II 44188 45786 2537 15065 0 0 9 2463 14688 4/13-4/28 North Platte River
1982 Dry 800-I 575589 240781 800 4760 0 0 114 229595 0 13186 System Full
1982 Dry 800-II 558222 234451 800 4760 0 0 113 222327 0 20454 North Platte River, North Platte Ramp
1983 Wet 5000-I 48924 51871 3934 19017 0 142 10 1066 10736 1/25-2/9 North Platte Hydro, North Platte River
1983 Wet 5000-II 44044 47737 2492 14812 0 140 9 2508 14940 1/6-1/21 North Platte River
1983 Wet 800-I 98185 75923 800 4760 0 142 35 64857 0 177923 System Full
1983 Wet 800-II 84853 69229 800 4760 0 141 36 58163 0 184617 North Platte River
1984 Wet 5000-I 148940 137705 3864 22921 0 146 26 1136 6832 10/9-11/1 Keystone Div, North Platte River
1984 Wet 5000-II 43169 47020 2371 14088 0 146 9 2629 15664 11/4-11/19 North Platte River
1984 Wet 800-I 246672 179573 800 4760 0 148 73 165369 0 77411 System Full
1984 Wet 800-II 197551 143410 800 4760 0 148 72 136937 0 105844 North Platte River
1985 Wet 5000-I 72341 71377 4759 23440 0 17 11 241 6313 4/10-4/25 Keystone Div, North Platte River
1985 Wet 5000-II 42958 46805 2433 14392 0 17 10 2567 15361 4/6-4/21 North Platte River
1985 Wet 800-I 347130 249482 821 4803 0 17 134 239209 -21 3572 North Platte River
1985 Wet 800-II 345956 249848 800 4760 0 17 140 240052 0 2728 North Platte River
1986 Wet 5000-I 53636 54921 3921 17162 0 6 10 1079 12591 1/29-2/13 North Platte Hydro, North Platte River
1986 Wet 5000-II 43919 47629 2495 14774 0 4 9 2505 14979 11/11-11/26 North Platte River
1986 Wet 800-I 229243 167762 800 4760 0 10 62 159200 0 83580 System Full
1986 Wet 800-II 201360 151136 800 4760 0 10 57 142574 0 100206 North Platte River, North Platte Ramp
1987 Wet 5000-I 64103 64563 3671 17947 0 3 13 1329 11805 4/5-4/24 Sutherland Canal, North Platte River
1987 Wet 5000-II 40959 45092 2420 14365 0 3 9 2580 15388 1/12-1/26 North Platte River
1987 Wet 800-I 351120 253383 829 4818 0 6 145 242324 -29 456 System Full
1987 Wet 800-II 351140 253718 800 4760 0 6 152 242659 0 121 North Platte River, North Platte Ramp
1988 Average 5000-I 64142 64571 4011 21616 0 1 11 989 8136 1/23-2/7 Sutherland Canal, North Platte River
1988 Average 5000-II 43627 47025 2458 14463 0 0 9 2542 15289 12/15-12/30 North Platte River
1988 Average 800-I 342698 246212 800 4760 0 0 130 236175 0 6606 North Platte River
1988 Average 800-II 346062 248497 800 4760 0 0 136 237429 0 5352 Keystone Div, North Platte River
1989 Average 5000-I 89268 85119 5271 24501 1 0 13 -271 5252 4/12-4/30 Sutherland Canal, North Platte River
1989 Average 5000-II 42940 46401 2518 14875 0 0 9 2482 14877 4/15-4/30 North Platte River
1989 Average 800-I 339826 244861 806 4773 0 0 137 235035 -6 7746 Keystone Div, North Platte Ramp
1989 Average 800-II 344953 248982 800 4760 0 0 143 237904 0 4876 North Platte River, North Platte Ramp
1990 Average 5000-I 86891 84011 4588 24245 0 0 14 412 5507 1/21-2/7 Sutherland Canal, North Platte River
1990 Average 5000-II 43877 47204 2476 14678 0 0 9 2524 15075 12/11-12/26 North Platte River
1990 Average 800-I 334958 241272 813 4786 0 0 124 232538 -13 10242 Keystone Div, North Platte Ramp
1990 Average 800-II 335502 241947 800 4760 0 0 128 233214 0 9566 North Platte River, North Platte Ramp
1991 Dry 5000-I 109356 97048 5404 24257 1 0 17 -404 5496 4/8-4/28 Sutherland Canal, North Platte River
1991 Dry 5000-II 43505 45201 2445 14480 0 0 9 2555 15273 3/28-4/12 North Platte River
1991 Dry 800-I 551509 230209 807 4774 0 0 97 220687 -7 22093 Keystone Div, North Platte River
1991 Dry 800-II 557579 234123 800 4760 0 0 97 222127 0 20653 North Platte River
1992 Average 5000-I 98554 93598 5267 25086 1 0 17 -267 4667 4/6-4/24 Sutherland Canal, North Platte River
1992 Average 5000-II 54636 56464 2432 14471 0 0 11 2568 15282 4/7-4/24 North Platte River
1992 Average 800-I 345816 248360 808 4775 0 0 146 240167 -8 2613 Keystone Div, Sutherland Canal, North Platte Ramp
1992 Average 800-II 353678 253856 800 4760 0 0 154 242780 0 0 N/A
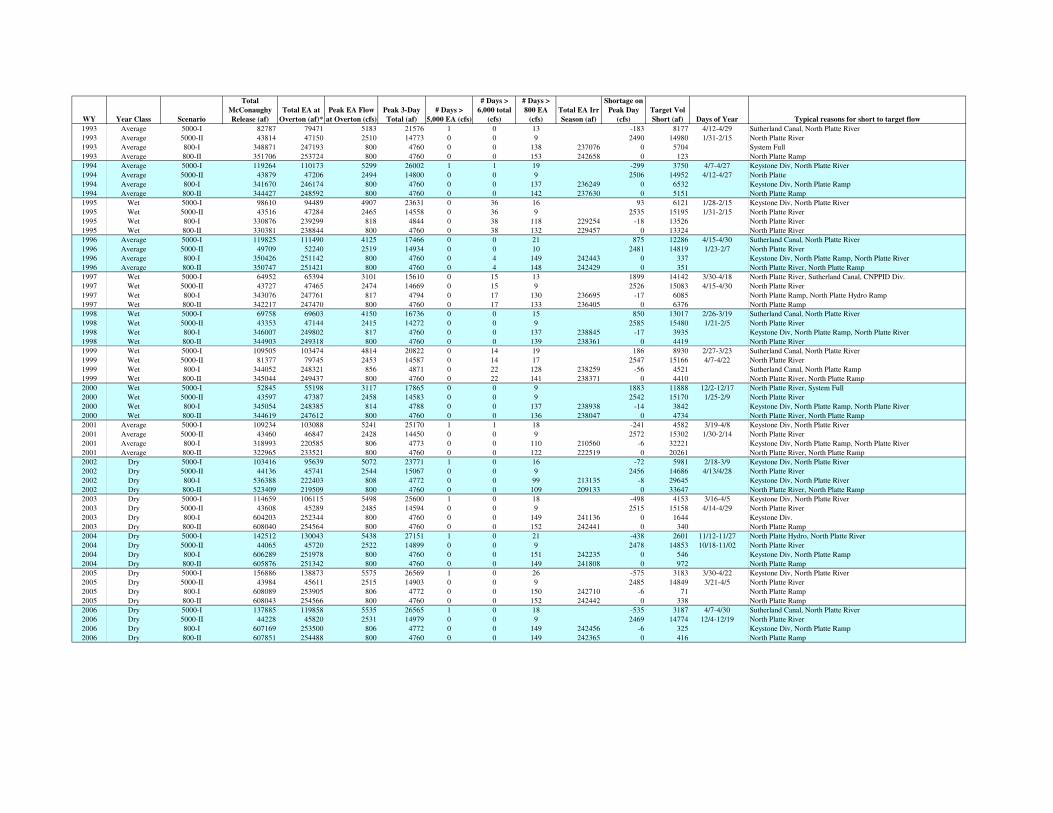
WY Year Class Scenario
Total
McConaughy
Release (af)
Total EA at
Overton (af)*
Peak EA Flow
at Overton (cfs)
Peak 3-Day
Total (af)
# Days >
5,000 EA (cfs)
# Days >
6,000 total
(cfs)
# Days >
800 EA
(cfs)
Total EA Irr
Season (af)
Shortage on
Peak Day
(cfs)
Target Vol
Short (af) Days of Year Typical reasons for short to target flow
1993 Average 5000-I 82787 79471 5183 21576 1 0 13 -183 8177 4/12-4/29 Sutherland Canal, North Platte River
1993 Average 5000-II 43814 47150 2510 14773 0 0 9 2490 14980 1/31-2/15 North Platte River
1993 Average 800-I 348871 247193 800 4760 0 0 138 237076 0 5704 System Full
1993 Average 800-II 351706 253724 800 4760 0 0 153 242658 0 123 North Platte Ramp
1994 Average 5000-I 119264 110173 5299 26002 1 1 19 -299 3750 4/7-4/27 Keystone Div, North Platte River
1994 Average 5000-II 43879 47206 2494 14800 0 0 9 2506 14952 4/12-4/27 North Platte
1994 Average 800-I 341670 246174 800 4760 0 0 137 236249 0 6532 Keystone Div, North Platte Ramp
1994 Average 800-II 344427 248592 800 4760 0 0 142 237630 0 5151 North Platte Ramp
1995 Wet 5000-I 98610 94489 4907 23631 0 36 16 93 6121 1/28-2/15 Keystone Div, North Platte River
1995 Wet 5000-II 43516 47284 2465 14558 0 36 9 2535 15195 1/31-2/15 North Platte River
1995 Wet 800-I 330876 239299 818 4844 0 38 118 229254 -18 13526 North Platte River
1995 Wet 800-II 330381 238844 800 4760 0 38 132 229457 0 13324 North Platte River
1996 Average 5000-I 119825 111490 4125 17466 0 0 21 875 12286 4/15-4/30 Sutherland Canal, North Platte River
1996 Average 5000-II 49709 52240 2519 14934 0 0 10 2481 14819 1/23-2/7 North Platte River
1996 Average 800-I 350426 251142 800 4760 0 4 149 242443 0 337 Keystone Div, North Platte Ramp, North Platte River
1996 Average 800-II 350747 251421 800 4760 0 4 148 242429 0 351 North Platte River, North Platte Ramp
1997 Wet 5000-I 64952 65394 3101 15610 0 15 13 1899 14142 3/30-4/18 North Platte River, Sutherland Canal, CNPPID Div.
1997 Wet 5000-II 43727 47465 2474 14669 0 15 9 2526 15083 4/15-4/30 North Platte River
1997 Wet 800-I 343076 247761 817 4794 0 17 130 236695 -17 6085 North Platte Ramp, North Platte Hydro Ramp
1997 Wet 800-II 342217 247470 800 4760 0 17 133 236405 0 6376 North Platte Ramp
1998 Wet 5000-I 69758 69603 4150 16736 0 0 15 850 13017 2/26-3/19 Sutherland Canal, North Platte River
1998 Wet 5000-II 43353 47144 2415 14272 0 0 9 2585 15480 1/21-2/5 North Platte River
1998 Wet 800-I 346007 249802 817 4760 0 0 137 238845 -17 3935 Keystone Div, North Platte Ramp, North Platte River
1998 Wet 800-II 344903 249318 800 4760 0 0 139 238361 0 4419 North Platte River
1999 Wet 5000-I 109505 103474 4814 20822 0 14 19 186 8930 2/27-3/23 Sutherland Canal, North Platte River
1999 Wet 5000-II 81377 79745 2453 14587 0 14 17 2547 15166 4/7-4/22 North Platte River
1999 Wet 800-I 344052 248321 856 4871 0 22 128 238259 -56 4521 Sutherland Canal, North Platte Ramp
1999 Wet 800-II 345044 249437 800 4760 0 22 141 238371 0 4410 North Platte River, North Platte Ramp
2000 Wet 5000-I 52845 55198 3117 17865 0 0 9 1883 11888 12/2-12/17 North Platte River, System Full
2000 Wet 5000-II 43597 47387 2458 14583 0 0 9 2542 15170 1/25-2/9 North Platte River
2000 Wet 800-I 345054 248385 814 4788 0 0 137 238938 -14 3842 Keystone Div, North Platte Ramp, North Platte River
2000 Wet 800-II 344619 247612 800 4760 0 0 136 238047 0 4734 North Platte River, North Platte Ramp
2001 Average 5000-I 109234 103088 5241 25170 1 1 18 -241 4582 3/19-4/8 Keystone Div, North Platte River
2001 Average 5000-II 43460 46847 2428 14450 0 0 9 2572 15302 1/30-2/14 North Platte River
2001 Average 800-I 318993 220585 806 4773 0 0 110 210560 -6 32221 Keystone Div, North Platte Ramp, North Platte River
2001 Average 800-II 322965 233521 800 4760 0 0 122 222519 0 20261 North Platte River, North Platte Ramp
2002 Dry 5000-I 103416 95639 5072 23771 1 0 16 -72 5981 2/18-3/9 Keystone Div, North Platte River
2002 Dry 5000-II 44136 45741 2544 15067 0 0 9 2456 14686 4/13/4/28 North Platte River
2002 Dry 800-I 536388 222403 808 4772 0 0 99 213135 -8 29645 Keystone Div, North Platte River
2002 Dry 800-II 523409 219509 800 4760 0 0 109 209133 0 33647 North Platte River, North Platte Ramp
2003 Dry 5000-I 114659 106115 5498 25600 1 0 18 -498 4153 3/16-4/5 Keystone Div, North Platte River
2003 Dry 5000-II 43608 45289 2485 14594 0 0 9 2515 15158 4/14-4/29 North Platte River
2003 Dry 800-I 604203 252344 800 4760 0 0 149 241136 0 1644 Keystone Div.
2003 Dry 800-II 608040 254564 800 4760 0 0 152 242441 0 340 North Platte Ramp
2004 Dry 5000-I 142512 130043 5438 27151 1 0 21 -438 2601 11/12-11/27 North Platte Hydro, North Platte River
2004 Dry 5000-II 44065 45720 2522 14899 0 0 9 2478 14853 10/18-11/02 North Platte River
2004 Dry 800-I 606289 251978 800 4760 0 0 151 242235 0 546 Keystone Div, North Platte Ramp
2004 Dry 800-II 605876 251342 800 4760 0 0 149 241808 0 972 North Platte Ramp
2005 Dry 5000-I 156886 138873 5575 26569 1 0 26 -575 3183 3/30-4/22 Keystone Div, North Platte River
2005 Dry 5000-II 43984 45611 2515 14903 0 0 9 2485 14849 3/21-4/5 North Platte River
2005 Dry 800-I 608089 253905 806 4772 0 0 150 242710 -6 71 North Platte Ramp
2005 Dry 800-II 608043 254566 800 4760 0 0 152 242442 0 338 North Platte Ramp
2006 Dry 5000-I 137885 119858 5535 26565 1 0 18 -535 3187 4/7-4/30 Sutherland Canal, North Platte River
2006 Dry 5000-II 44228 45820 2531 14979 0 0 9 2469 14774 12/4-12/19 North Platte River
2006 Dry 800-I 607169 253500 806 4772 0 0 149 242456 -6 325 Keystone Div, North Platte Ramp
2006 Dry 800-II 607851 254488 800 4760 0 0 149 242365 0 416 North Platte Ramp

WATER MANAGEMENT STUDY, PHASE I EVALUATION OF PULSE FLOWS FOR THE PLATTE RIVER
RECOVERY IMPLEMENTATION PROGRAM
Phase I Report April 8, 2008
APPENDIX 4
Request for Proposal – Engineering Services for the Platte River Recovery Implementation Program
Water Management Study
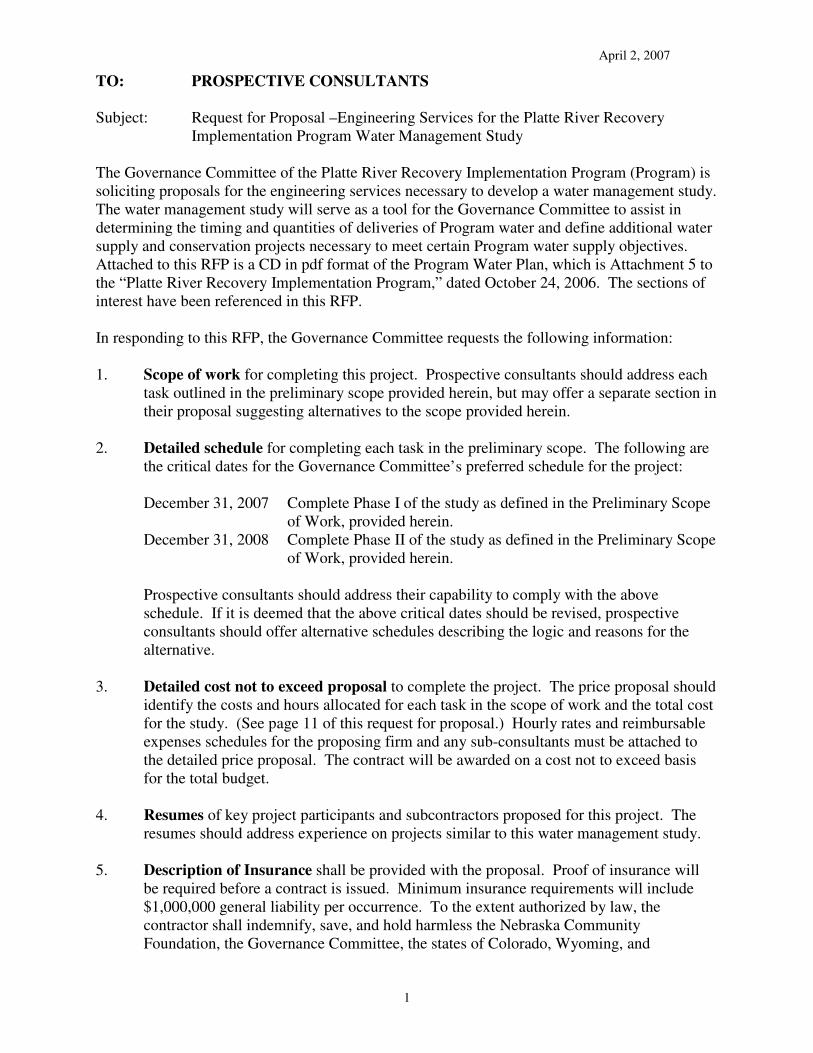
April 2, 2007
1
TO: PROSPECTIVE CONSULTANTS
Subject: Request for Proposal –Engineering Services for the Platte River Recovery
Implementation Program Water Management Study
The Governance Committee of the Platte River Recovery Implementation Program (Program) is
soliciting proposals for the engineering services necessary to develop a water management study.
The water management study will serve as a tool for the Governance Committee to assist in
determining the timing and quantities of deliveries of Program water and define additional water
supply and conservation projects necessary to meet certain Program water supply objectives.
Attached to this RFP is a CD in pdf format of the Program Water Plan, which is Attachment 5 to
the “Platte River Recovery Implementation Program,” dated October 24, 2006. The sections of
interest have been referenced in this RFP.
In responding to this RFP, the Governance Committee requests the following information:
1. Scope of work for completing this project. Prospective consultants should address each
task outlined in the preliminary scope provided herein, but may offer a separate section in
their proposal suggesting alternatives to the scope provided herein.
2. Detailed schedule for completing each task in the preliminary scope. The following are
the critical dates for the Governance Committee’s preferred schedule for the project:
December 31, 2007 Complete Phase I of the study as defined in the Preliminary Scope
of Work, provided herein.
December 31, 2008 Complete Phase II of the study as defined in the Preliminary Scope
of Work, provided herein.
Prospective consultants should address their capability to comply with the above
schedule. If it is deemed that the above critical dates should be revised, prospective
consultants should offer alternative schedules describing the logic and reasons for the
alternative.
3. Detailed cost not to exceed proposal to complete the project. The price proposal should
identify the costs and hours allocated for each task in the scope of work and the total cost
for the study. (See page 11 of this request for proposal.) Hourly rates and reimbursable
expenses schedules for the proposing firm and any sub-consultants must be attached to
the detailed price proposal. The contract will be awarded on a cost not to exceed basis
for the total budget.
4. Resumes of key project participants and subcontractors proposed for this project. The
resumes should address experience on projects similar to this water management study.
5. Description of Insurance shall be provided with the proposal. Proof of insurance will
be required before a contract is issued. Minimum insurance requirements will include
$1,000,000 general liability per occurrence. To the extent authorized by law, the
contractor shall indemnify, save, and hold harmless the Nebraska Community
Foundation, the Governance Committee, the states of Colorado, Wyoming, and
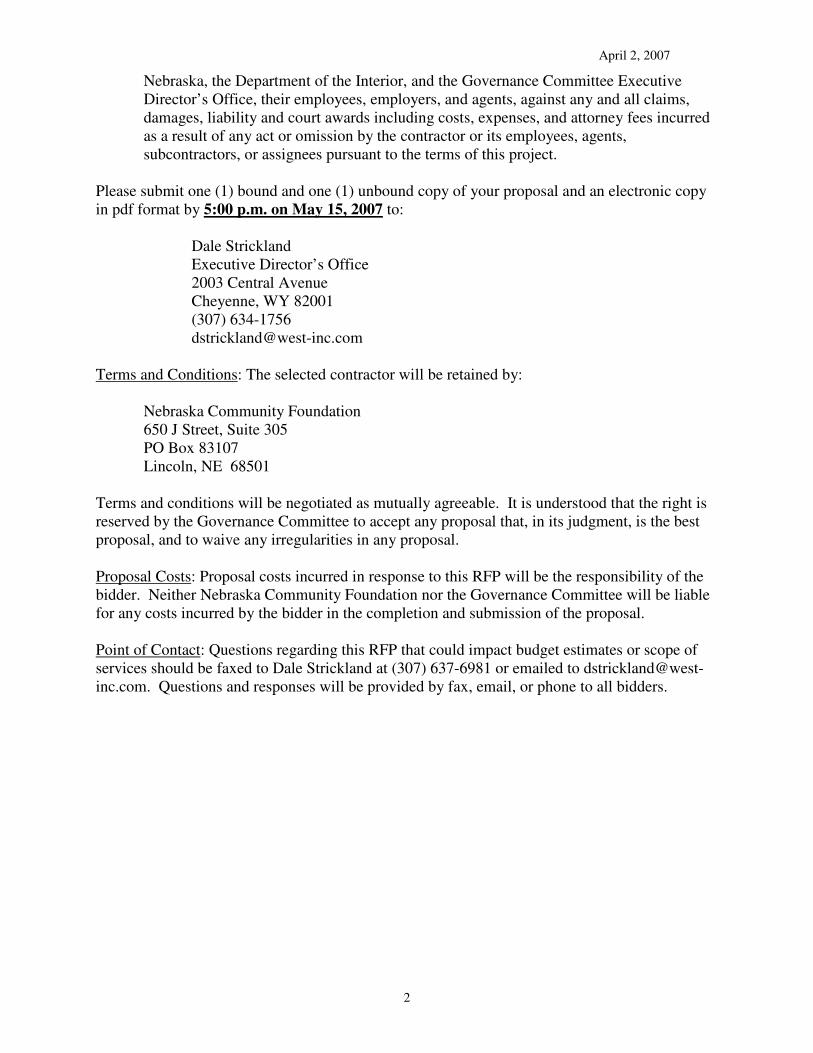
April 2, 2007
2
Nebraska, the Department of the Interior, and the Governance Committee Executive
Director’s Office, their employees, employers, and agents, against any and all claims,
damages, liability and court awards including costs, expenses, and attorney fees incurred
as a result of any act or omission by the contractor or its employees, agents,
subcontractors, or assignees pursuant to the terms of this project.
Please submit one (1) bound and one (1) unbound copy of your proposal and an electronic copy
in pdf format by 5:00 p.m. on May 15, 2007 to:
Dale Strickland
Executive Director’s Office
2003 Central Avenue
Cheyenne, WY 82001
(307) 634-1756
Terms and Conditions: The selected contractor will be retained by:
Nebraska Community Foundation
650 J Street, Suite 305
PO Box 83107
Lincoln, NE 68501
Terms and conditions will be negotiated as mutually agreeable. It is understood that the right is
reserved by the Governance Committee to accept any proposal that, in its judgment, is the best
proposal, and to waive any irregularities in any proposal.
Proposal Costs: Proposal costs incurred in response to this RFP will be the responsibility of the
bidder. Neither Nebraska Community Foundation nor the Governance Committee will be liable
for any costs incurred by the bidder in the completion and submission of the proposal.
Point of Contact: Questions regarding this RFP that could impact budget estimates or scope of
services should be faxed to Dale Strickland at (307) 637-6981 or emailed to dstrickland@west-
inc.com. Questions and responses will be provided by fax, email, or phone to all bidders.
April 2, 2007
3
PRELIMINARY SCOPE OF WORK
For
Engineering Services
Platte River Recovery Implementation Program
Water Management Study
1.0 INTRODUCTION
The Platte River Recovery Implementation Program (Program) was initiated on January 1, 2007
between Nebraska, Wyoming, and Colorado and the Department of the Interior (DOI) (the
parties) to address endangered species issues in the Platte River Basin. The species, referred to as
“target species,” are the whooping crane, piping plover, interior least tern, and pallid sturgeon.
A Governance Committee has been established that reviews, directs, and provides oversight for
activities undertaken during the Program. The Governance Committee is comprised of one
representative from each of the three states, three water user representatives, two representatives
from environmental groups, and two members representing federal agencies. The Governance
Committee has named Dale Strickland to serve as its interim Executive Director. Mr. Strickland
will be the primary contact for prospective consultants responding to this RFP.
2.0 PROBLEM STATEMENT
One of the objectives of the Program is to complete a phased study to evaluate the feasibility of
meeting the following water supply goals by December 31, 2011:
1. Provide 5,000 cubic feet per second of Program water for three days to the Overton gage
on the Platte River in central Nebraska for pulse flows when other demands that may be
competing for river channel and irrigation system capacity are low (normally September 1-May
31). Assuming this water-delivery availability, Program water may be used to supplement
existing flows to achieve pulse flows in excess of 6,000 cfs two out of three years. If these flows
are achieved by existing flows (without Program water), the deliveries of Program water would
not be necessary.
2. Identify feasible measures and quantify the Program water necessary to ensure a yield of
800 cfs of Program water at the Overton gage during the irrigation season (May 1 through
September 30).
3.0 DEFINITIONS AND ASSUMPTIONS
1. Program water
One of the long-term objectives of the Program is to reduce shortages to certain specified target
flows by an average of 130,000-150,000 acre-feet per year in the Platte River in central Nebraska
(Platte River valley area from Lexington to Chapman, Nebraska). The following list describes
three initial Program projects and a reference to the description of the respective projects that can
be found in the Program Document:
April 2, 2007
4
a. Nebraska’s Environmental Account in Lake McConaughy (NEA) (Attachment 5,
Section 5)
b. Wyoming’s Pathfinder Modification Project (PMP) (Attachment 5, Section 4)
c. Colorado’s Initial Water Project (Tamarack 1) (Attachment 5, Section 3)
The following table depicts estimated quantities of Program water that will be available in wet,
average, and dry years. The following yields are based on model runs used in the FEIS for the
Program for the 1947 through 1994 period of record. The yields of the NEA and PMP are
achieved in Lake McConaughy. The yields of Tamarack I are based on increased flows at the
CO/NE state line.
Average yields (AF x 1,000)
Avg. Annual Avg. Annual Avg. Max Monthly
Project NEA PMP Tamarack I
Wet year (25%) 74.8 29.5 3.4
Average year (50%) 56.9 22.7 3.2
Dry year (25%) 48.5 10.2 3.2
The above three projects will provide an average of 80,000 acre-feet per year toward the
objective of reducing shortages to target flows by an average of 130,000-150,000 acre feet per
year. Presently, it is envisioned that the remaining 50,000-70,000 acre feet of water per year will
be obtained from projects selected from those identified in the “Reconnaissance Level Water
Action Plan” (Attachment 5, Section 6). One of the purposes of this study is to assist the
Governance Committee in the selection of these projects.
2. River channel capacity
The channel capacities for the reaches of the North Platte, South Platte, and Platte Rivers used to
transport Program water will be based on discharge rates during flood stages as determined by
the National Weather Service with one notable exception. The flood stage discharge of the
North Platte River, north of the city of North Platte, Nebraska and extending approximately two
miles upstream of the intersection of the North Platte River and Highway 83 will be assumed to
be 3,000 cfs.
3. Irrigation system capacity
Throughout the year, the Districts (The Central Nebraska Public Power and Irrigation District
(CNPPID) and Nebraska Public Power District (NPPD)) divert all available flows up to the
diversion capacity including any available Program water.
However, Program water may be intentionally re-regulated using the Districts’ systems and/or
Program water may be intentionally bypassed to the river under the specific conditions and
within the constraints described in the Program Document (Attachment 5, Section 1) and the
agreement with the Districts.
The following are the known limitations and capacities within the Districts’ system that affect
the delivery of Program water; there may be others that are not identified herein. These
limitations and capacities are provided in this RFP to provide background to prospective
April 2, 2007
5
consultants. These limitations and capacities may be expanded or altered during the completion
of Task I of Phase I. One of the purposes of this study is to test the sensitivity of these
limitations in providing capacity for Program water. Attached to this RFP is a map of the
Central Platte System
a. North Platte River Channel Limitations and Capacities below Keystone Diversion Dam
North Platte River Channel below Keystone Diversion Dam
- The initial ramp-up rate will be 300 cfs/day with no ramp down-rate limits (all
seasons).
- Flows in the North Platte River at North Platte, Nebraska must not exceed flood stage
as defined by the National Weather Service. Current flood stage is estimated to be
approximately 1,600 cfs. However, the consultant should assume it will be 3,000 cfs
due to planned Program improvements to the channel in the area. (See 2. above)
b. CNPPID System Limitations and Capacities
Central Diversion Dam at North Platte
- The maximum diversion is 2,250 cfs all year (barring icing conditions or
hydro/system malfunctions)
- There are presently no specified maximum ramp-up/down rates. However, they may
be provided in the future.
- A full diversion is generally possible all year long and is likely to occur in wet years.
- In average and dry years, the maximum diversion is being used for irrigation from
July 1 to September 15.
- Diversion of the Districts’ water reduces the available capacity for Program water.
Program water in excess of available capacity must be bypassed down the river.
- The capacity available for Program water in mid-March could be reduced by 300 cfs
for Elwood Reservoir filling.
Jeffrey Return
- The maximum return is 1,250 cfs.
- Capacity for Program water is limited during the irrigation season when the return is
being used for NPPD irrigation flows.
- Use of the Jeffrey Return may be limited during the dry years from August through
September due to CNPPID water conservation practices.
- Use of this return diminishes the flow continuing to Johnson Reservoir and could
therefore reduce the capacity for regulation of Program water in Johnson Reservoir
and/or the amount of water that can be released through the J-2 return.
J-2 Return
- The maximum return is 2,000 cfs.
- The capacity for return flows will decline from 2,000 cfs in mid April when irrigation
deliveries begin. In dry years (when irrigation deliveries are reduced), available
return flow capacity may be as high as approximately 800 cfs from July 1 to
September 15. In some years, there may be no return flow capacity available.
April 2, 2007
6
c. NPPD System Limitations and Capacities
Keystone Diversion
- The maximum capacity of the diversion is 1,750 cfs all year barring icing conditions,
summer weed growth, system maintenance and unplanned malfunctions.
- The ramp-up/down rate is 100 cfs/day all year, barring icing conditions and summer
weed growth and system malfunctions. This ramp rate limitation is intended to avoid
canal system damage that could result in a loss of the cooling water supply to Gerald
Gentlemen power plant.
- The entire capacity is typically required for irrigation from July 1 to September 15.
Korty Diversion
- The maximum capacity of the diversion is 850 cfs all year, barring icing conditions,
summer weed growth and system malfunctions.
Total NPPD Diversion
- The total diversion to NPPD can be no more than1,900 cfs below the confluence of
the Keystone and Korty Diversions all year, barring icing conditions, summer weed
growth and system malfunctions.
NPPD North Platte Hydro
- The maximum capacity is 1,750 cfs. As the hydro discharge rate increases to the
maximum, a reduction in the storage level in Lake Maloney is required due to the fact
that the system has no by-pass potential at the North Platte Hydro. When the outlet
canal is flowing at a high rate, additional space is necessary in Lake Maloney to allow
for the storage of the additional flow. The maximum hydro discharge rate may also
decrease as the storage level in Lake Maloney is reduced, assuming inadequate
replacement inflows in the Sutherland Outlet Canal.
- The ramp-up rate is 200 cfs per day and there is no maximum ramp-down rate, as
long as adequate storage space exists in Sutherland and Maloney Reservoirs for flows
in the canals.
4. Re-regulation within the Districts’ system
Initially, there will be the opportunity to use a maximum of 4,000 acre feet of the capacity in
Johnson Lake within the Districts’ system as re-regulation space for Program water in February,
March, and April. There may be additional opportunity for re-regulation in the Districts’ system
if this study identifies such additional re-regulation space would serve as a solution in the
delivery of Program water and the Governance Committee determines such re-regulation is
feasible. In any event, the total annual use of the re-regulation space cannot exceed 12,000 acre-
feet.
5. Classification of water years
For purposes of this study, the classification of water years will be based on the flows at the
Overton gage from 1947-2006. Provisional data for the most recent years can be used.
April 2, 2007
7
Wet-The 25% wettest years
Dry-The 25% driest years
Average-The remaining years
4.0 SCOPE OF WORK
The following scope of work is offered to assist the prospective consultants in the preparation of
their proposals. The proposals should address each task in this scope. However, if prospective
consultants believe scope alternatives would benefit the project, those alternatives should be
thoroughly described and the corresponding cost increases or savings should be identified.
PHASE I
Task I. Research and Investigation
A. The consultant shall review the Program Water Plan. The consultant should prepare
questions after reviewing the Program Water Plan. As a minimum, the consultant will
hold interviews with the representatives of the Program or their designees. Interviews
may be held in person or via conference calls.
Interview Topic
Mark Butler, Fish and Wildlife Service Yield of water supply projects
Don Anderson, Fish and Wildlife Service Ramping rates for water deliveries
Sharon Whitmore, Fish and Wildlife Service Environmental Account management
Don Kraus, CNPPID Districts’ system, including physical
constraints and potential liabilities
Environmental Account in Lake
McConaughy
Brian Barels, NPPD Districts’ system, including physical
constraints and potential liabilities
Jon Altenhofen, Northern Colorado
Water Conservation District Tamarack I
Mike Purcell, Wyoming Pathfinder Modification Project
John Lawson, USBR Pathfinder Modification Project
Ann Bleed, Nebraska Conveyance losses
B. The consultant will need to contact the USGS and the Nebraska Department of Natural
Resources regarding flow information at the Overton gage on the Platte River and other
gages of interest.
C. The consultant will need to quantify and tabulate conveyance losses and lag times for the
river reaches of interest during wet, average, and dry periods.
Task II. Determine Available Capacity for Program Water
The consultant will develop a working paper describing the methodology that will be used to
determine the capacity available for delivery of Program water through the Districts’ system
April 2, 2007
8
and the river channels in wet, average, and dry years. A draft of the working paper will be
circulated to parties interviewed under Task I.A. for review and comment.
After receipt of comments, the consultant will proceed in using the methodology to estimate
the capacity available at critical points within the Districts’ systems and within the river
channels for delivery of Program water in wet, average, and dry years. Initially, the
consultant will use the limitations and capacities described in section 3.0 of this RFP, as may
be amended during the discussions conducted under Task I.A. of Phase I. The consultant
will test the sensitivity of these limitations and capacities in delivery of Program water and
may propose changes for consideration by the Governance Committee. The consultant will
also estimate the amounts of water that would be required to achieve the water supply
objectives described in Section 2.0 of this RFP given the available capacity.
Task III. Routing Studies
The consultant will build upon the methodologies and estimates developed in Task II to route
Program water available in the NEA, PMP, and Tamarack I supplies through the available
capacities as determined in Task II in order to determine the shortages to the water delivery
objectives described in Section 2 of this RFP in wet, average, and dry years. The routing
studies will be completed for the following scenarios:
Case I-No Program water will bypass the Districts’ system when the Districts have the
capacity within their system to divert it.
Case II-Program water can bypass the Districts’ system even if the Districts have the capacity
to divert it.
The consultant will quantify the shortages in wet, average, and dry years and identify the
causes for those shortages under Case I and Case II. The consultant will identify the
definitions and assumptions described in section 3.0 of this RFP that could be revised for the
purposes of reducing shortages.
Task IV. Solutions
The consultant will review the projects identified in the “Reconnaissance Level Water Action
Plan” (Attachment 5, Section 6) and identify those projects that would likely be the most
cost-effective in reducing shortfalls to the Program water-delivery objectives described in
Section 2.0. The consultant will describe the reasons for selecting the various projects and
describe the operations of those projects that should be implemented to eliminate the
shortages in wet, average, and dry years under Case I and Case II.
Task V. Draft Report
The consultant will provide the Executive Director’s office a draft report describing the
results of Task I through IV in pdf format, no later than October 1, 2007.
April 2, 2007
9
Task VI. Presentation
The consultant will work with the Executive Director’s office to arrange one workshop to
present the Phase I report to the Governance Committee and Water Advisory Committee in
November, 2007.
Task VII. Final Report
The consultant will finalize the Phase I report incorporating comments received on the draft
report and at the workshop. The consultant will provide one (1) bound and one (1) unbound
copy of the final report and an electronic copy in pdf format no later than December 31,
2007.
PHASE II.
The Consultant shall not proceed to Phase II without written approval from the Executive
Director.
Task I. Additional Solutions
The consultant will identify projects not previously analyzed that, if implemented, could
reduce or eliminate shortfalls to the Program water-delivery objectives described in Section
2. The consultant will describe the reasons for selecting the various projects and describe the
operations of those projects that should be implemented to eliminate the shortfalls in wet,
average, and dry years under Case I and Case II.
Task II. Screening
The consultant will screen the projects identified above. The screening will be based on cost,
technical feasibility, liability and risks, and environmental and permitting considerations.
The consultant will select three (3) projects that are considered worthy of additional review.
Task III. Workshop
The consultant will work with the Executive Director’s Office for purposes of arranging a
workshop to review the results of Tasks I and II. The purpose of the workshop will be to
determine the projects worthy of progressing to Task IV.
Task IV. Project Evaluations
The consultant will complete reconnaissance level designs and cost estimates on the projects
selected in the Task III workshop. For purposes of proposal preparation, the consultant
should assume that three (3) projects will be selected for the reconnaissance level designs and
cost estimates.
Task V. Draft Report

April 2, 2007
10
The consultant will provide the Executive Director’s office a draft Phase II report describing
the results of Task I through IV in pdf format, no later than October 15, 2008.
Task VI. Final Report
The consultant will finalize the Phase II report incorporating comments received on the draft
report. The consultant will provide one (1) bound and one (1) unbound copy of the final
report and an electronic copy in pdf format no later than December 31, 2008.

April 2, 2007
11
Price Proposal
Water Management Study
Task Proposal Price Hours
PHASE I
I. Research and Investigation $___________ ______
II. Determine Available Capacity $___________ ______
III. Routing Studies $___________ ______
IV. Solutions $___________ ______
V. Draft Report $___________ ______
VI. Presentation $___________ ______
VII. Final Report
Total Phase I $___________ ______
PHASE II
I. Additional Solutions $___________ ______
II. Screening $___________ ______
III. Workshop $___________ ______
IV. Project Evaluations $___________ ______
V. Draft Report $___________ ______
VI. Final Report $___________ ______
Total Phase II $___________ ______
Grand Total $___________ ______
Firm Name and Address: _____________________________________________
_____________________________________________
_____________________________________________
Signature of Firm President or Authorized Agent:_____________________________
If the consultant offers a revised scope of services, this form should be duplicated and the
proposal prices for the revised scope should be provided.