Embed Size (px)
Citation preview
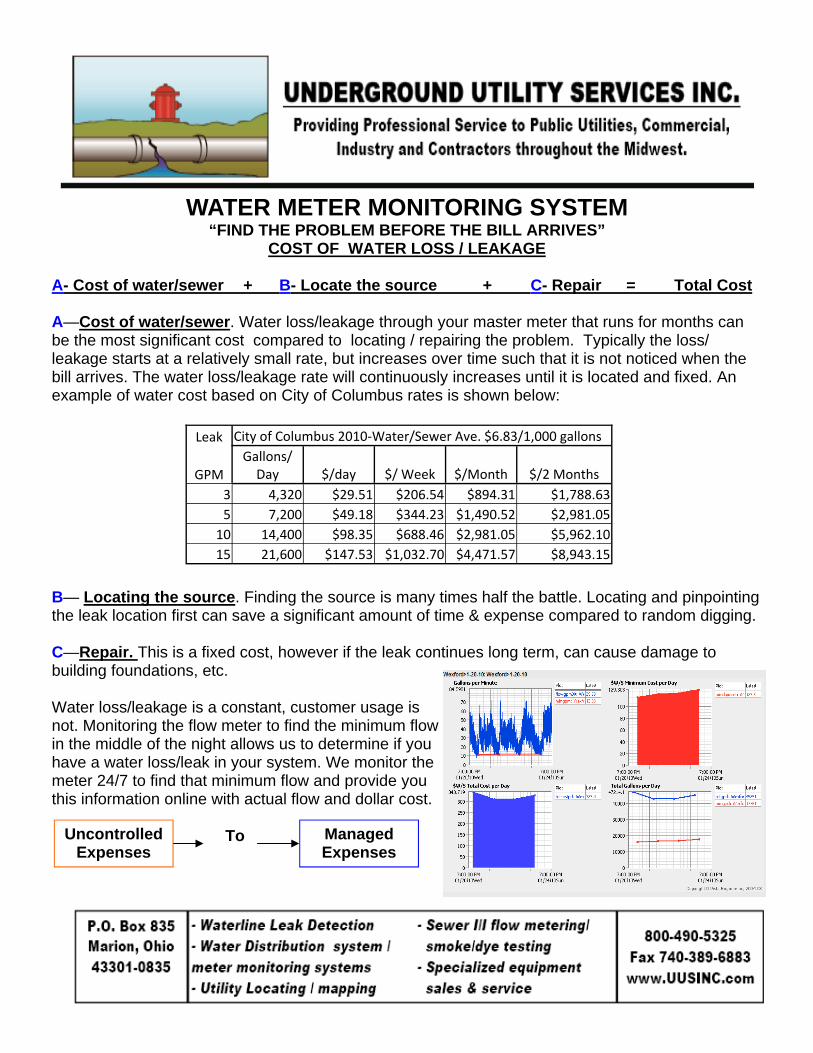
WATER METER MONITORING SYSTEM
“FIND THE PROBLEM BEFORE THE BILL ARRIVES” COST OF WATER LOSS / LEAKAGE
A- Cost of water/sewer + B- Locate the source + C- Repair = Total Cost A—Cost of water/sewer. Water loss/leakage through your master meter that runs for months can be the most significant cost compared to locating / repairing the problem. Typically the loss/leakage starts at a relatively small rate, but increases over time such that it is not noticed when the bill arrives. The water loss/leakage rate will continuously increases until it is located and fixed. An example of water cost based on City of Columbus rates is shown below: B— Locating the source. Finding the source is many times half the battle. Locating and pinpointing the leak location first can save a significant amount of time & expense compared to random digging. C—Repair. This is a fixed cost, however if the leak continues long term, can cause damage to building foundations, etc. Water loss/leakage is a constant, customer usage is not. Monitoring the flow meter to find the minimum flow in the middle of the night allows us to determine if you have a water loss/leak in your system. We monitor the meter 24/7 to find that minimum flow and provide you this information online with actual flow and dollar cost.
To Uncontrolled
Expenses Managed Expenses
Leak City of Columbus 2010‐Water/Sewer Ave. $6.83/1,000 gallons
GPM Gallons/Day $/day $/ Week $/Month $/2 Months
3 4,320 $29.51 $206.54 $894.31 $1,788.63 5 7,200 $49.18 $344.23 $1,490.52 $2,981.05
10 14,400 $98.35 $688.46 $2,981.05 $5,962.10 15 21,600 $147.53 $1,032.70 $4,471.57 $8,943.15
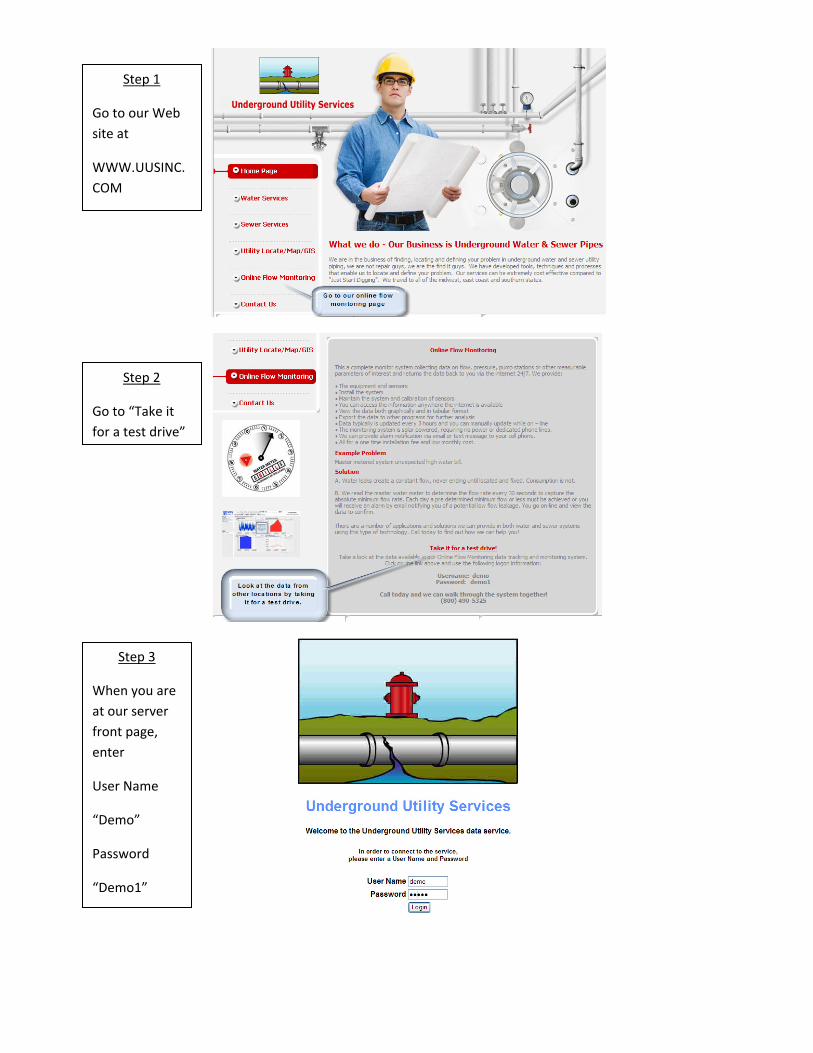
Step 1
Go to our Web site at
WWW.UUSINC.COM
Step 2
Go to “Take it for a test drive”
Step 3
When you are at our server front page, enter
User Name
“Demo”
Password
“Demo1”
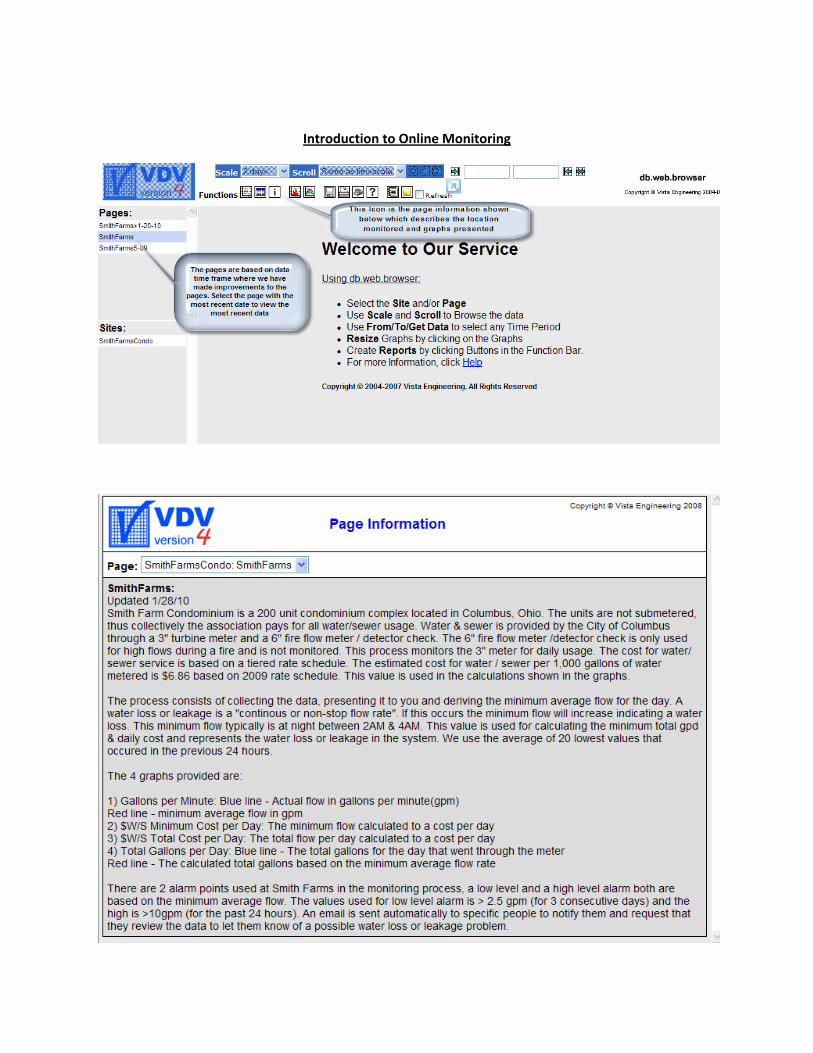
Introduction to Online Monitoring
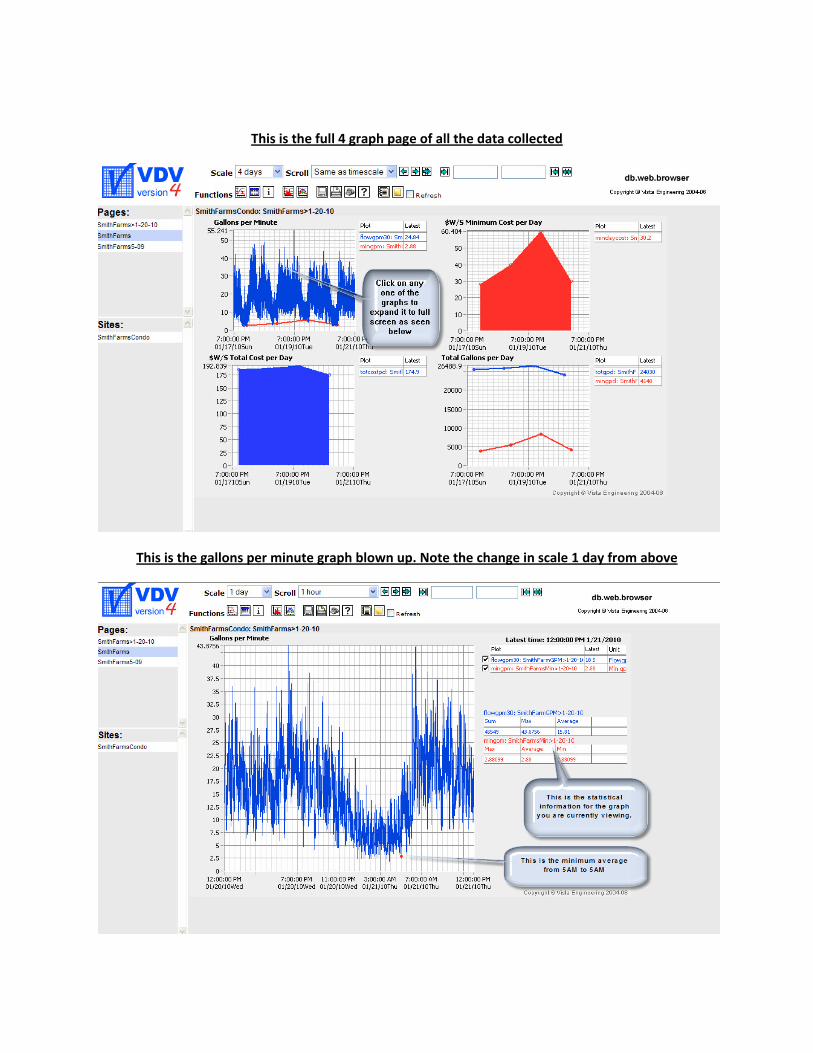
This is the full 4 graph page of all the data collected
This is the gallons per minute graph blown up. Note the change in scale 1 day from above
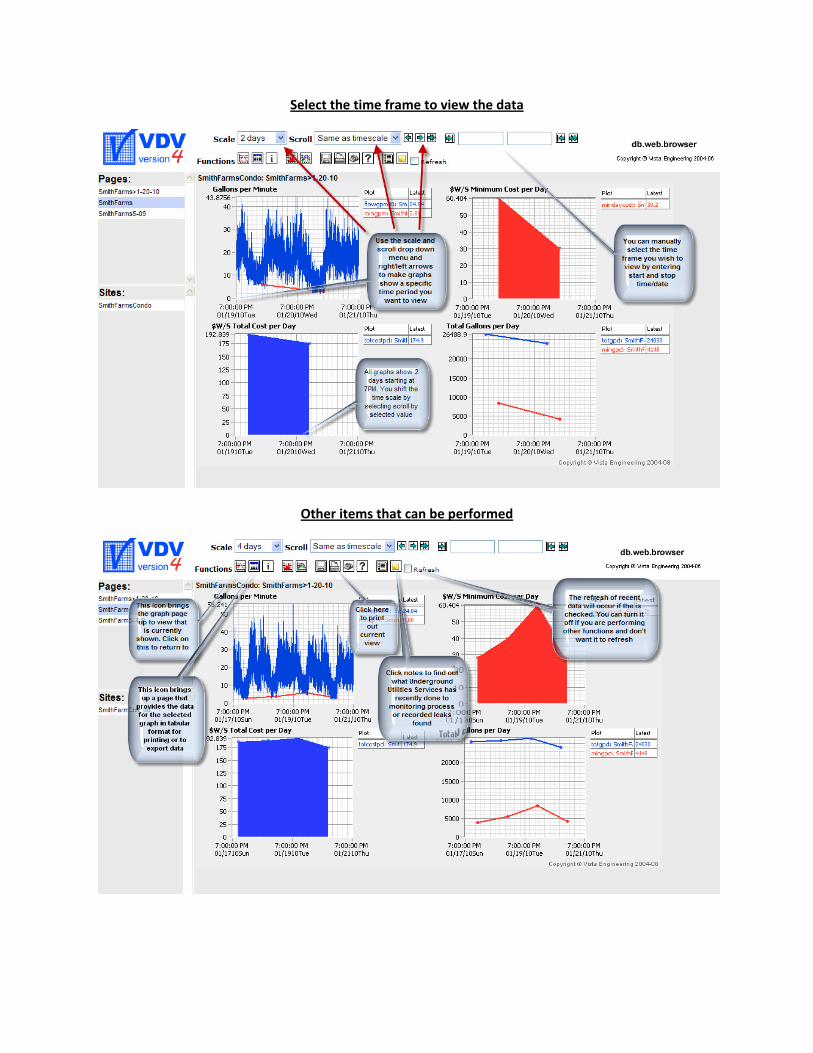
Select the time frame to view the data
Other items that can be performed
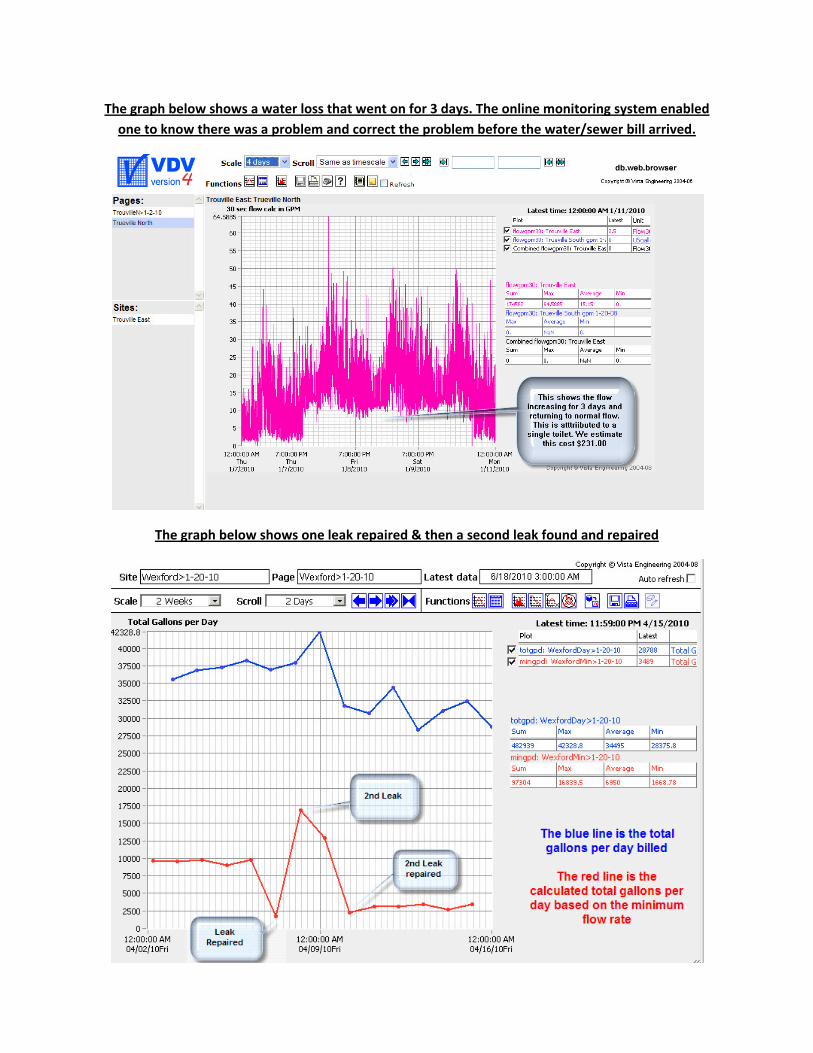
The graph below shows a water loss that went on for 3 days. The online monitoring system enabled one to know there was a problem and correct the problem before the water/sewer bill arrived.
The graph below shows one leak repaired & then a second leak found and repaired


![Octave Water Meter - RMC Water Control Valves · Maximum Cable Length* 500 [meter] Maximum Applied Voltage 35 [Vdc] ... Octave Water Meter Installation Manual](https://img.pdfslide.net/doc/110x75/5b0c90c77f8b9a6a6b8c7f4a/octave-water-meter-rmc-water-control-cable-length-500-meter-maximum-applied.jpg)